Article

Evaluating Complex Magma Mixing via Polytopic Vector Analysis (PVA) in the Papagayo Tuff, Northern Costa Rica: Processes that Form Continental Crust

by
David W. Szymanski
1,*,
Lina C. Patino
2,3,
Thomas A. Vogel
3 and
Guillermo E. Alvarado
4
1
Department of Natural and Applied Sciences, Bentley University, Waltham, MA 02452, USA
2
National Science Foundation, Arlington, VA 22230, USA
3
Department of Geological Sciences, Michigan State University, East Lansing, MI 48824, USA
4
Seismology and Volcanology Department, Costa Rica Institute of Electricity, Apdo. 10032-1000, San José, Costa Rica
*
Author to whom correspondence should be addressed.
Geosciences 2013, 3(3), 585-615; https://doi.org/10.3390/geosciences3030585
Submission received: 4 July 2013 / Revised: 19 August 2013 / Accepted: 23 August 2013 / Published: 29 August 2013
(This article belongs to the Special Issue Continental Accretion and Evolution)

Abstract

:
Over the last forty years, research has revealed the importance of magma mixing as a trigger for volcanic eruptions, as well as its role in creating the diversity of magma compositions in arcs. Sensitive isotopic and microchemical techniques can reveal subtle evidence of magma mixing in igneous rocks, but more robust statistical techniques for bulk chemical data can help evaluate complex mixing relationships. Polytopic vector analysis (PVA) is a multivariate technique that can be used to evaluate suites of samples that are produced by mixing of two or more magma batches. The Papagayo Tuff of the Miocene-Pleistocene Bagaces Formation in northern Costa Rica is associated with a segment of the Central American Volcanic Arc. While this segment of the arc is located on oceanic plateau, recent (<8 Ma) ignimbrites bear the chemical signatures of upper continental crust, marking the transition from oceanic to continental crust. The Papagayo Tuff contains banded pumice fragments consistent with one or more episodes of mixing/mingling to produce a single volcanic deposit. The PVA solution for the sample set is consistent with observations from bulk chemistry, microchemistry and petrographic data from the rocks. However, without PVA, the unequivocal identification of the three end-member solution would not have been possible.

Graphical Abstract

1. Introduction

Magma mixing is a common petrogenetic process; it is recognized by many researchers as important in the histories of most arc magmas (for a review, see [1]). It is well documented that mixing can trigger eruptions when magma chambers are recharged by the injection of more mafic or more silicic magmas (e.g., [2,3,4,5,6,7]). In addition to open-system processes, like recharge and mixing, in situ crystallization and/or resorption (cryptic phases) can make it difficult to interpret the histories of many magma batches (e.g., [8,9,10,11,12]). The chemical complexity created by these processes requires rigorous statistical techniques for interpreting magmatic evolution. Microchemical and isotopic analyses of glass, crystalline phases and melt inclusions in volcanic rocks have emphasized the prevalence of recharge, mixing and mingling in arc magmas (e.g., [1,13,14,15,16]). Compared to linear regression and simple bivariate plots of element ratios, application of multivariate statistical tests, such as polytopic vector analysis (PVA), can be used to extract more robust information about mixing from bulk rock chemical data [17,18,19].
This paper demonstrates how standard geochemical and mineralogical analyses and PVA can be used in tandem to unravel the petrogenesis of the Papagayo Tuff, an undescribed ignimbrite unit from northern Costa Rica. This single eruptive unit provides a snapshot of a chemically complex magmatic system evolving in juvenile continental crust.

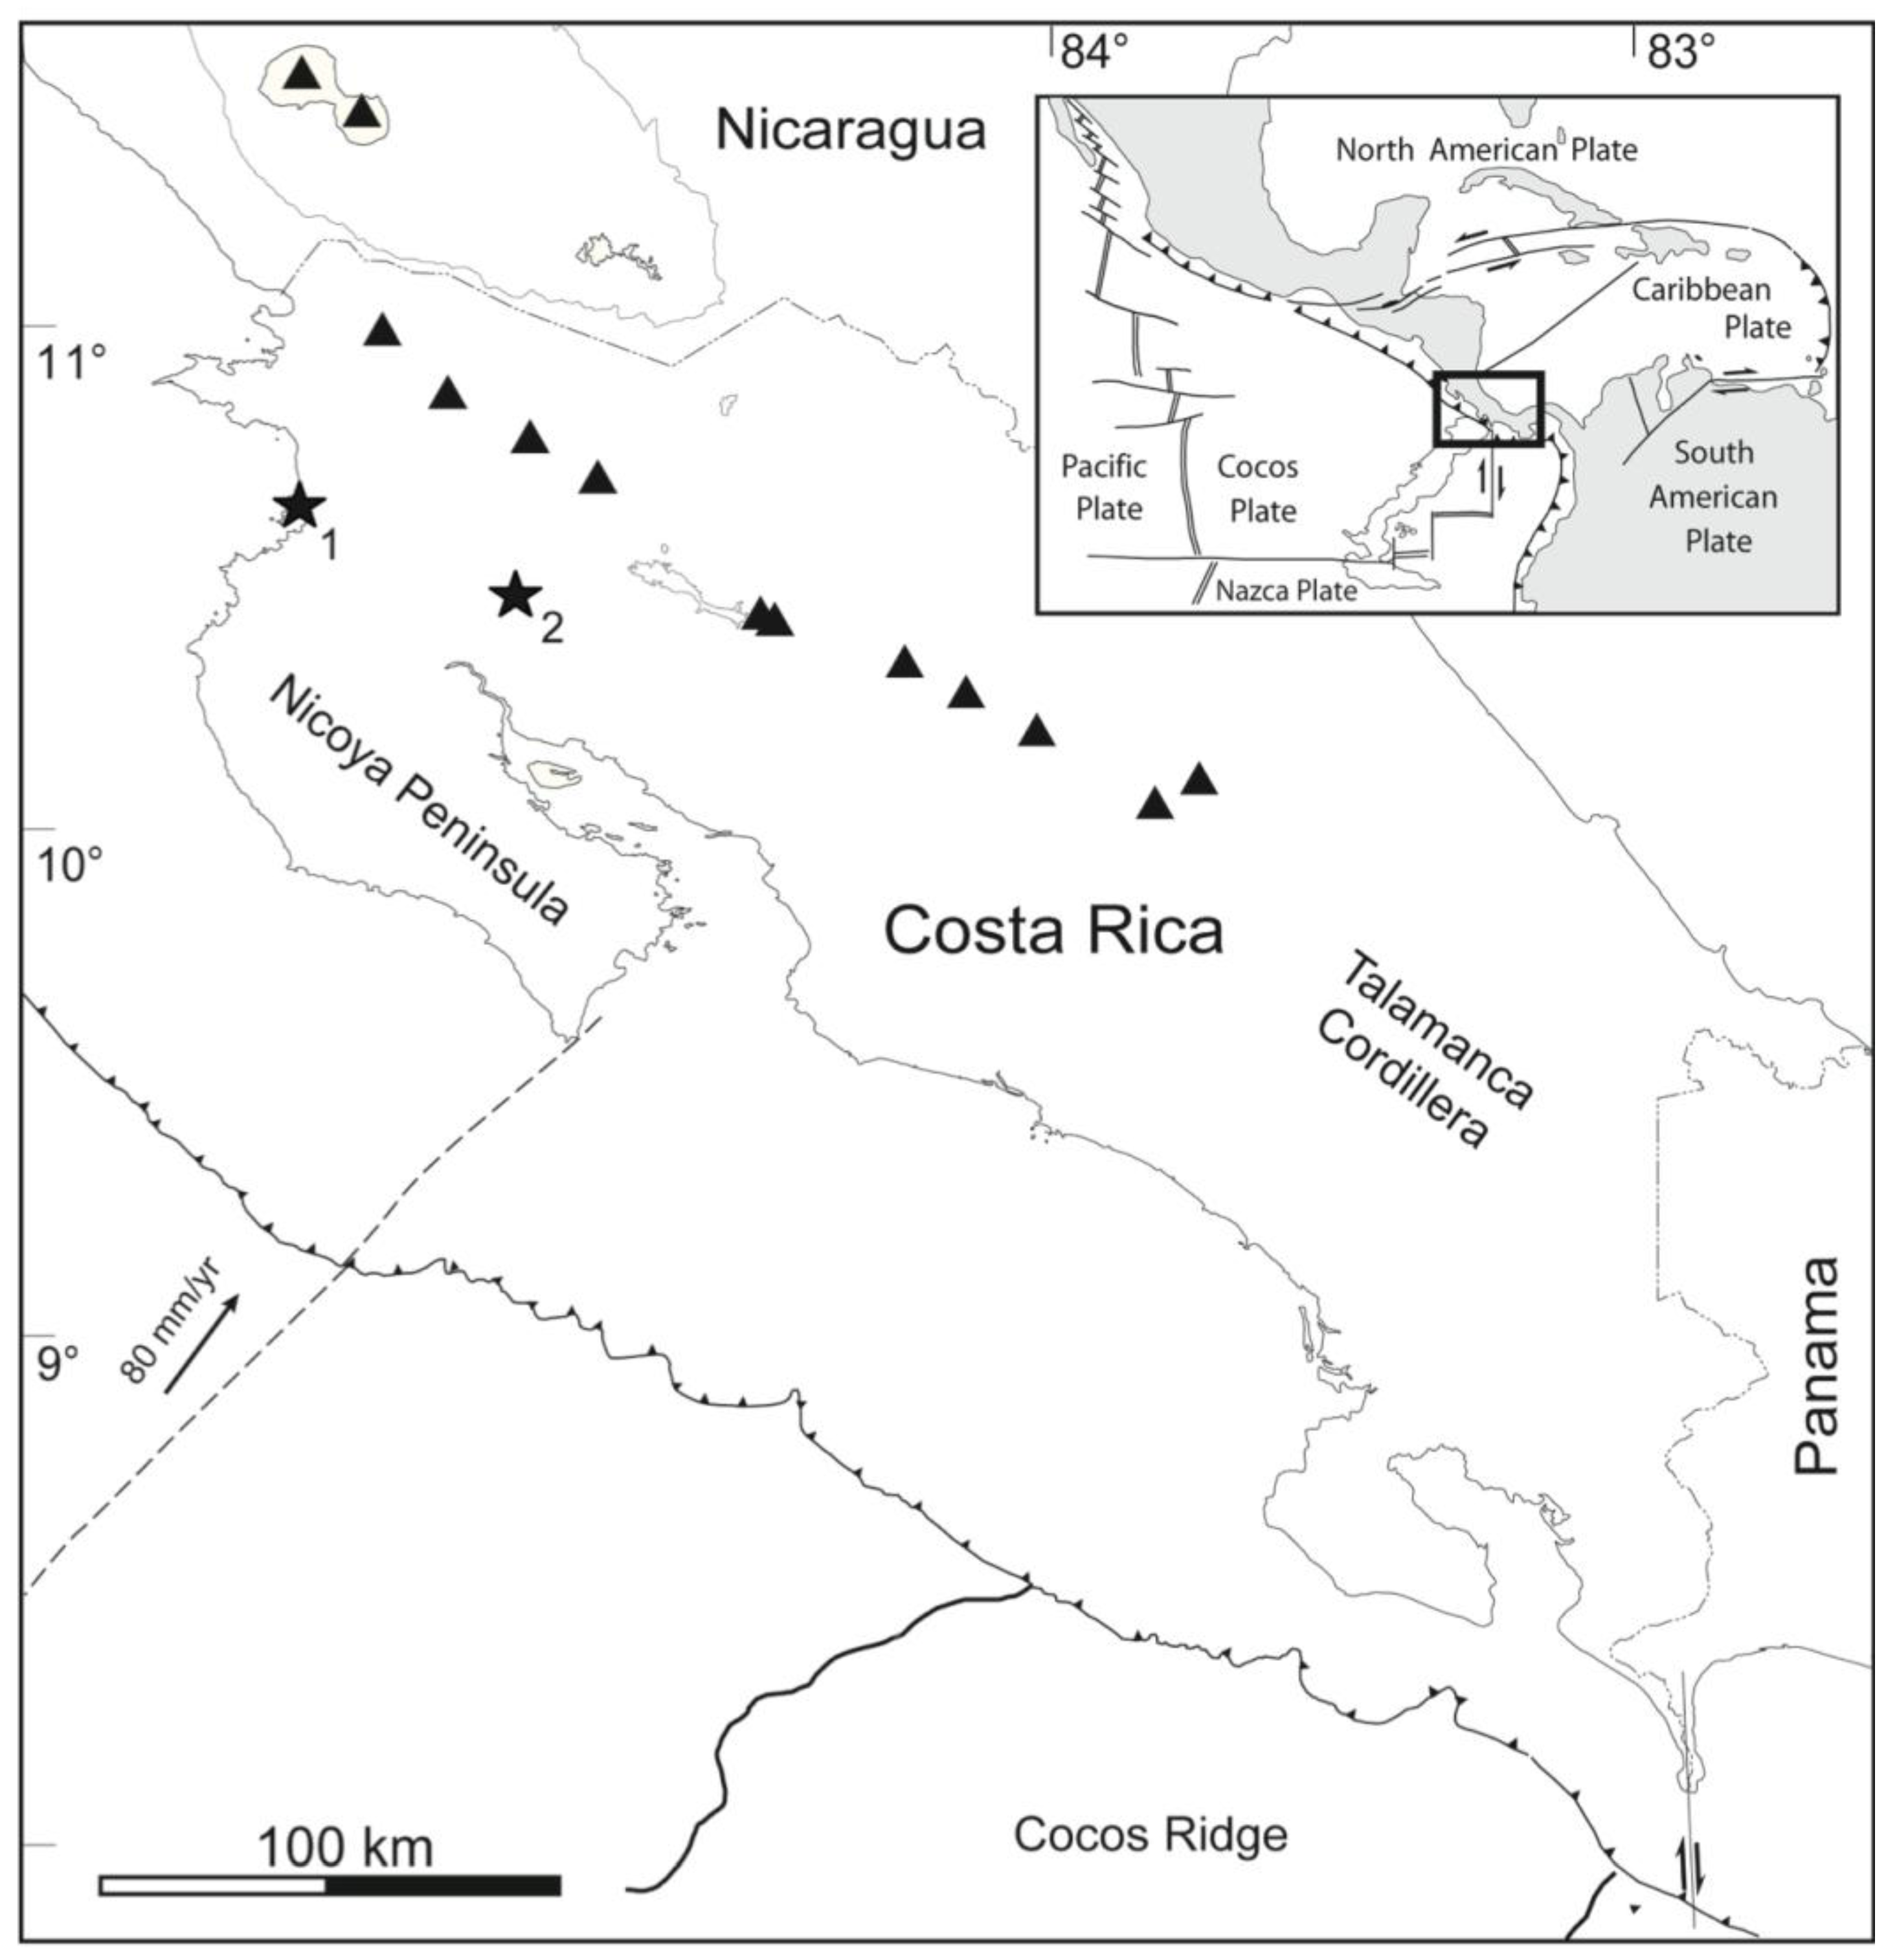
2. Geologic and Tectonic Setting

The Central American Volcanic Arc results from the subduction of the Cocos plate beneath the Caribbean plate along the Middle American Trench (MAT) (Figure 1). The arc extends from Tacaná volcano on the Mexico-Guatemala border to Irazú-Turrialba volcanoes in central Costa Rica. The northern part of the Central American Volcanic Arc is located on Paleozoic continental crust and accreted terranes of the Chortis tectonic block [20]. In contrast, the southern part of the arc, which includes northern Costa Rica, is built on oceanic crust of Chorotega tectonic block. While the exact location of the boundary between the blocks is not known, it is thought to be close to the Nicaragua-Costa Rica border [20,21]. The origin of the oceanic crust of the Chorotega block is the Caribbean Large Igneous Province (CLIP), which represents the overriding plate in the subduction zone. Seismic analysis has estimated the CLIP to be approximately 40 km thick directly beneath the arc, nearly twice the average thickness of the rest of the CLIP [21,22]. The bulk of the CLIP is thought to have formed ~90 Ma over the Galápagos hotspot [23].
The Papagayo Tuff is located on the Guanacaste Plain, south and west of Rincón de la Vieja, Miravalles and Tenorio volcanoes in the Guanacaste Province of northern Costa Rica. The gently undulating Guanacaste plain is a broad ignimbrite plateau (>2000 km2) that extends from the base of the modern volcanic cordillera to the 100–150 m escarpment along the Pacific coast [24]. The unit is part of the Miocene-Pleistocene Bagaces Formation, a group of moderately-to-densely welded ignimbrites with a dominantly anhydrous mineral assemblage of plagioclase (plag) + clinopyroxene (cpx) + orthopyroxene (opx) + Fe-oxide [25,26,27]. Amphibole is only found in a few Bagaces units. Pyroclastic units are interbedded with lava flows, terrigenous sediments and paleosols [25,28]. One sequence is also interbedded with shallow marine units containing ripple marks and invertebrate fossils [29]. Gillot et al. [30] estimated a volume of 100 ± 40 km3 for the Bagaces Formation. Limited radiometric ages and stratigraphic information yields an age range for Bagaces units from 1.86 Ma to approximately 8 Ma [30,31,32,33,34,35].
Figure 1. Map after [36] showing the location of the Central American Volcanic Arc in Costa Rica and the location of the outcrops of the Papagayo Tuff. Triangles represent volcanic centers along the volcanic front. The locations of Papagayo Tuff outcrops are indicated by stars. “1” represents the location of the 23-m section exposed at Bahía Culebra and “2” shows the location of the rock pavement outcrop near the town of Aguacaliente.
Geosciences 03 00585 g001

2.1. Significance of Ignimbrites in the Bagaces Formation: Evolving Continental Crust?

Although a full discussion of the geochemical evolution of the arc is beyond the scope of this paper, understanding the geochemical origin of units in the Bagaces Formation helps address the fundamental question of how continental crust forms. The modern volcanic arc in Costa Rica is built on a modified oceanic plateau, and volcanic rocks older than about 8 Ma are similar to those typically found in oceanic arcs. However, younger rocks, like those in the Bagaces Formation, are enriched in SiO2, alkali earth metals, light rare earth elements (LREE), large ion lithophile elements (LILE) and depleted in high field strength elements (HFSE); they are geochemically similar to the composition of upper continental crust [35]. Likewise, based on seismic characteristics and structure, the crust in Costa Rica resembles juvenile continental crust [22,37,38].
Vogel et al. [39] used trace elements and isotopic signatures to demonstrate a genetic relationship between mafic lavas and high-silica volcanic rocks along the Central American Volcanic Arc. Building on the work of Leat et al. [40], Smith et al. [41] and Tamura and Tatsumi [42], among others, Vogel et al. [39] suggested that the silicic magmas were derived from the partial melting of or melt extraction from previously emplaced and partially crystallized calc-alkaline basalts in the lower crust. Deering et al. [43] proposed a model for the evolution of the upper crust in Costa Rica into continental crust by repeated melt extraction from highly crystalline (50–70 vol %) calc-alkaline magmas under different P-T-fO2-aH2O regimes in the lower crust. Combined, the geochemical and geophysical evidence supports the interpretation that oceanic crust in Costa Rica is being transformed into continental crust. Because ignimbrites of the Bagaces Formation represent some of the oldest and most voluminous high-silica rocks in this part of the arc, they represent the earliest stages of exposed evolving continental crust.

3. Analytical Methods

Whole pumice fragments were used for petrographic and chemical analysis in this study. Fragments were cleaned and then powdered in a ceramic-plate Bico pulverizer. After drying, glass disks were produced by fusing rock powders with a lithium tetraborate (Li2B4O7) flux. All samples were produced using a low dilution fusion method suitable for trace elemental analysis using 9 g Li2B4O7 and 3 g of rock powder. Approximately 0.5 g of ammonium nitrate (NH4NO3) was added to each sample to ensure oxidation of iron during fusion. Samples were weighed in Pt crucibles (95% Pt, 5% Au) and suspended over an oxidizing flame (~1000 °C) on an orbital mixing stage for 25 min. Resulting melts were poured into red-hot Pt molds and cooled on a hot plate at ~500 °C. These glass disks were then analyzed for major elements, selected trace elements by X-ray fluorescence (XRF) and for trace elements by laser ablation inductively-coupled plasma mass spectrometry (LA-ICP-MS).
Major elements (SiO2, TiO2, Al2O3, Fe2O3, MnO, MgO, CaO, Na2O, K2O and P2O5), as well as Rb, Sr and Zr, were analyzed on a Rigaku S-MAX XRF (Rigaku Corporation, Tokyo, Japan) or a Bruker S4 Pioneer XRF (Bruker AXS, Karlsruhe, Germany) at Michigan State University. Major element data were reduced using fundamental parameters (e.g., [44]) in XRFWIN software (Omni Scientific Instruments, Biloxi, MS, USA) on the S-MAX and in SPECTRAplus software (Bruker AXS) on the S4 Pioneer; trace elements were determined using standard linear regression techniques. Precision is similar for analyses done on both instruments; most elements have <1% RSD (relative standard deviation), except for TiO2 and P2O5 (<3%) on the S-MAX and P2O5 (<2%) on the S4 Pioneer.
Trace element concentrations were determined on the opposite side of the same glass disks using a CETAC (Omaha, NE, USA) LSX 200 Plus Nd:YAG (266 nm) laser on a Micromass (now Thermo Electron Corporation, Waltham, MA, USA) Platform ICP-MS with a hexapole collision cell. Data were acquired for twenty-three (23) elements: V, Cr, Y, Nb, Ba, La, Ce, Pr, Nd, Sm, Eu, Gd, Tb, Dy, Ho, Er, Yb, Lu, Hf, Ta, Pb, Th and U. A set of 15 external international rock standards, representing a wide variety of igneous rock compositions and prepared using an identical fusion method, was used for quantitation. Strontium concentration, determined by XRF on the same glass disks, was used as an internal standard for each sample. Final concentrations were determined using a standard linear regression for each element (normalized signal vs. concentration), using only standards with calculated values within 15% of preferred published values. The precision for all elements is <5% RSD.
Based on bulk chemistry results, pumice thin sections were selected for microchemical analysis by electron microprobe (EMP). Matrix glass and selected mineral phases (plagioclase, pyroxene) were analyzed using a Cameca (Gennevilliers, France) SX-100 electron microprobe located in the Electron Microbeam Analysis Laboratory (EMAL) at the University of Michigan. The SX-100 is equipped with five wavelength-dispersive spectrometer (WDS) units. All analyses were performed using an accelerating voltage of 15 kV and a 10 nA beam current. A 10 μm beam diameter was used for glass and plagioclase analyses, while pyroxene measurements were done in spot mode (effective beam diameter of <1 μm).

4. The Papagayo Tuff

The Papagayo Tuff (Figure 2) is a moderately welded pyroclastic flow deposit that outcrops in at least two locations in the Guanacaste Province of northern Costa Rica (Figure 1). The first exposure is located on the Pacific coast, on Bahía Culebra, Golfo de Papagayo (location “1” in Figure 1). An extensive vertical section was sampled in a roadcut made for construction of a resort on Bahía Culebra in 2001. The outcrop, which has since been largely obscured by the growth of vegetation and weathering in the tropical climate, is an approximately 23 m vertical section that begins at the base of the tuff. Fresh tuff varies in color from dark brown to gray (Figure 2). The base of the tuff is in contact with massive volcaniclastic sands and boulder-rich debris flows of the Carbonal lava flow (8 Ma, [32]). The tuff was produced by one eruption; there are no cooling breaks in the vertical sequence.
Figure 2. Papagayo Tuff in outcrop near the base of 23-m section exposed at Bahía Culebra. The yellow arrow indicates a gray pumice fragment in the tuff.
Geosciences 03 00585 g002
Twenty-eight pumice fragments were sampled stratigraphically at this outcrop with a vertical spacing of 0.5 to 5 m. Sub-rounded to moderately oblate pumice fragments (fiamme) are approximately two to 5 cm in diameter (Figure 2). All samples are glassy and hydrated. Some samples are clearly banded in hand sample with fine (mm-scale) ribbons of alternating brown and gray glass.
The tuff is exposed in a second location approximately 50 km to the east-southeast of Bahía Culebra locality, outcropping in three sections of rock pavement near the town of Aguacaliente (location “2” in Figure 1). A total of eight pumice fragments were collected among the three outcrops. A linear distance of approximately 5 km separates the three outcrops along the same road. Several of these pumice fragments also display gray-brown banding in hand sample. Petrographic and chemical analyses clearly identify them as part of the same unit. The actual volume of the ash-flow tuff is unknown, due to lack of exposure, but an estimate of volume based on simple wedge geometry yields a minimum of 1 km3 of ejecta for the flow.

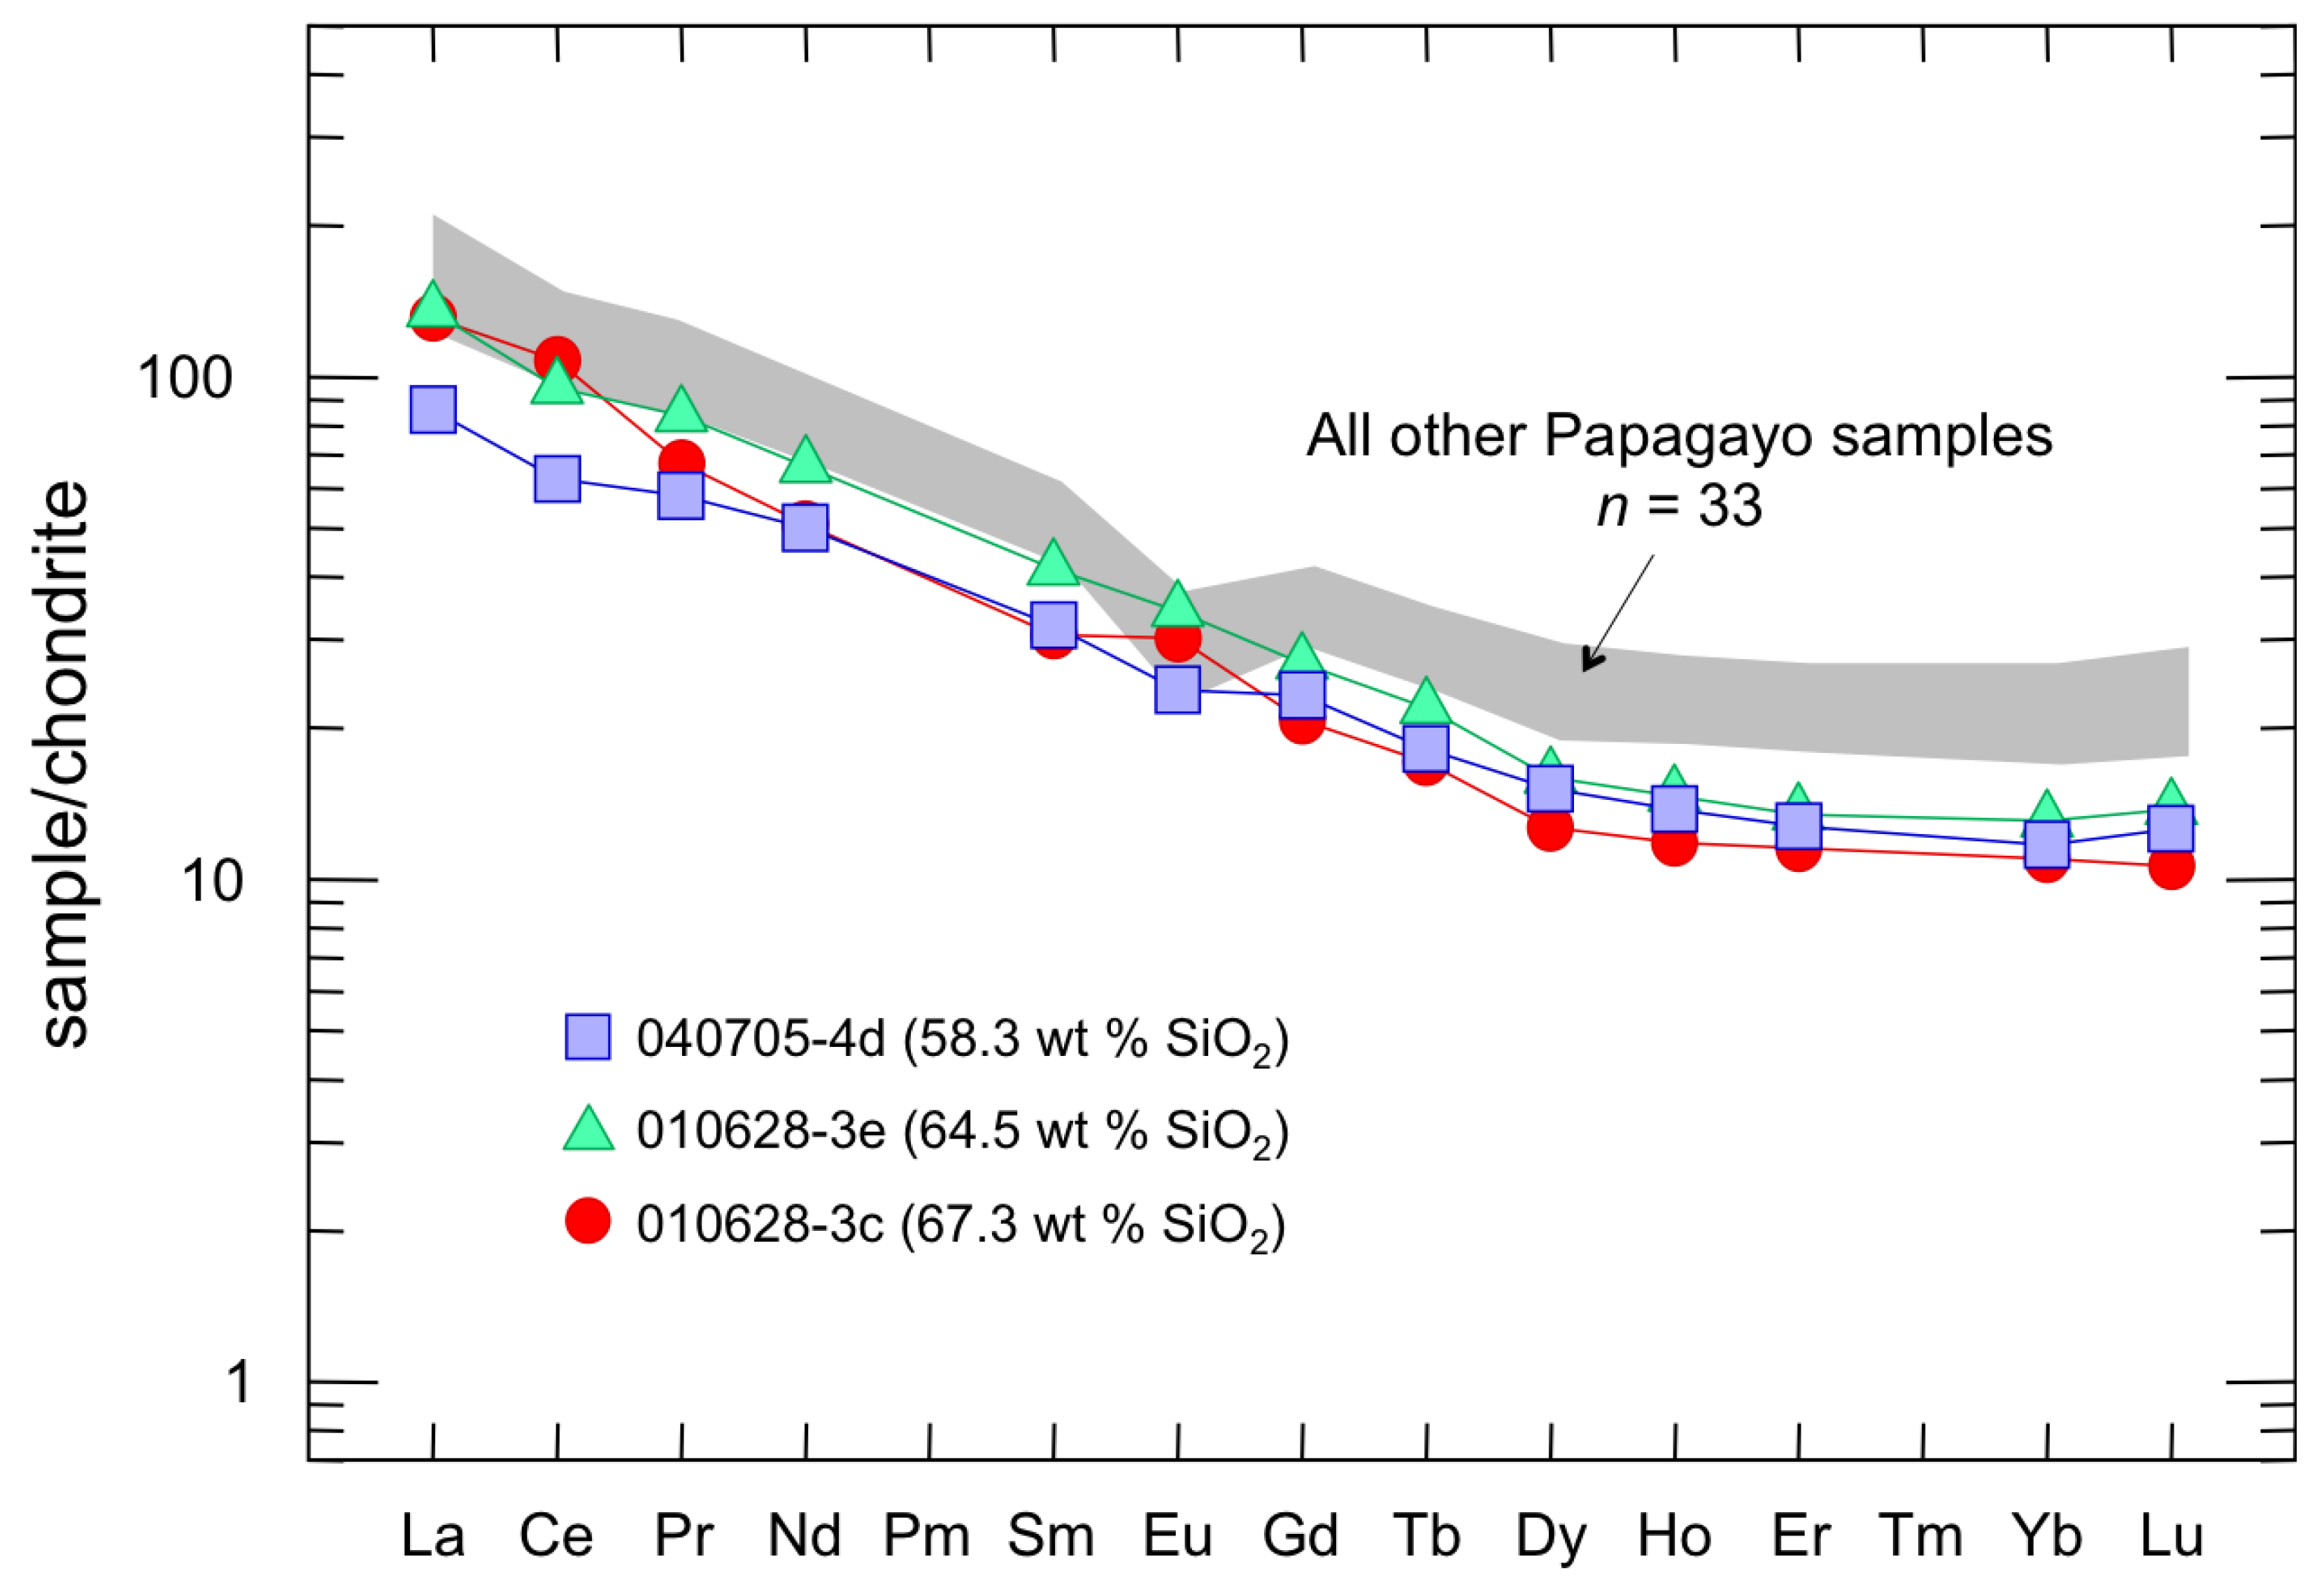
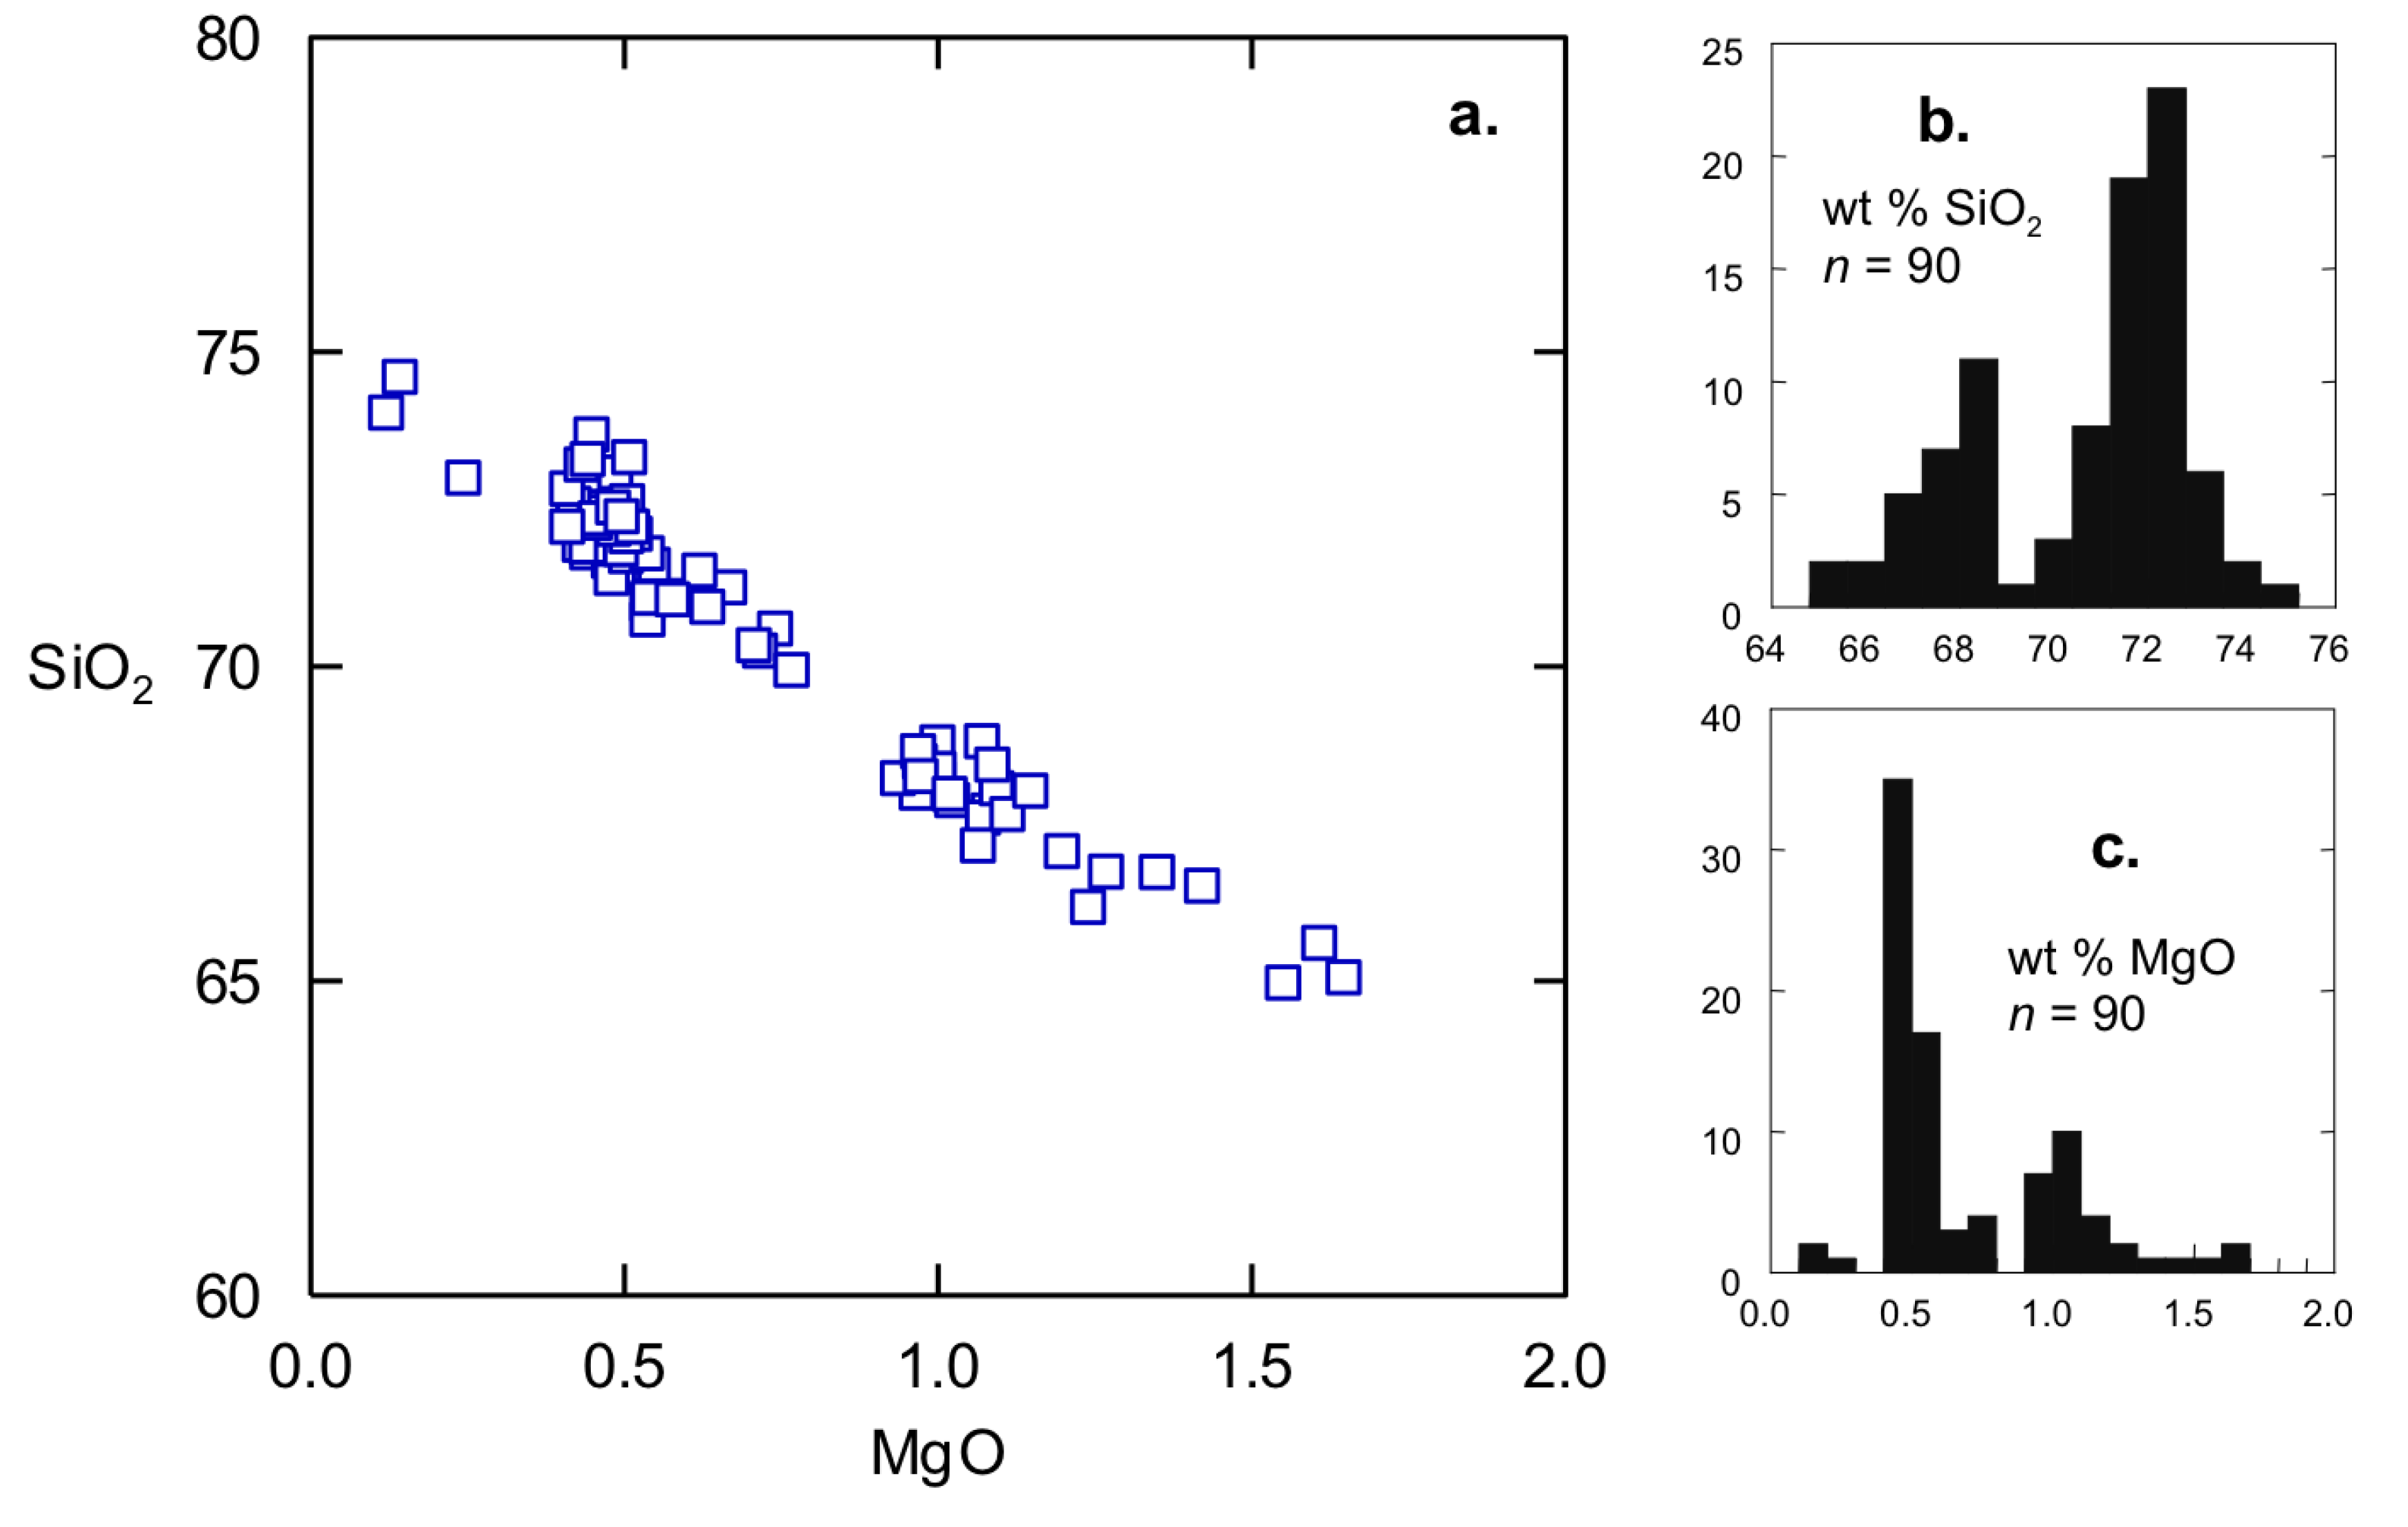
4.1. Pumice Chemistry and Petrography

Bulk pumice compositions for the Papagayo samples (n = 36) are given in Supplementary Table S1. Major elements were recalculated to 100% anhydrous, because of the hydrated nature of the glassy pumice fragments, and total iron is given as Fe2O3. All samples had analytical totals ≥95%, with only minor alteration and/or devitrification of glass in some samples. Plots for selected major and trace elements versus SiO2 are given in Figure 3, Figure 4, respectively. Samples range from andesite to rhyolite in composition (58.3–70.9 wt % SiO2). In the figures, bulk pumice sample compositions are coded by arbitrary divisions in silica content: blue squares represent low-silica samples (58–63 wt % SiO2), green triangles represent intermediate samples (63–66 wt % SiO2) and red circles represent high-silica samples (66–71 wt % SiO2). The black stars in Figure 3, Figure 4 show three end member mixing compositions predicted by PVA and are explained later in the paper. Overall, major element distributions display nearly linear trends with SiO2 content (Figure 3), as do trace elements, with an exception of a larger range among those samples with the highest SiO2 contents (n = 7, all ~70 wt %; Figure 4). Rare earth elements (REE) display a tight distribution among most samples, with a negative europium anomaly (Figure 5). Three of the 36 samples—010628-3c, 010628-3e and 040705-4d—deviate significantly from the linear trends for several elements in Figure 3 (e.g., Al2O3, MnO) and for the REEs (Figure 4, Figure 5). The significance of these samples is discussed at length later in the paper.
In hand sample, pumice fragments are glassy, porphyritic and moderately-to-highly vesicular. Although vesicle proportions range from <20% to approximately 80%, the median is 60%–70%. In thin section, the groundmass of many pumice fragments consists of alternating bands of light and dark brown glass. Although bands and ribbons are observed on the millimeter scale, the banding occurs at even a finer scale, with individual bands <10 μm thick, demonstrated in the backscatter photomicrograph in Figure 6 (sample 020702-4a). Although no thin section was available for the most mafic sample, the sample with the next lowest silica content (010628-3m, 60.1 wt % SiO2) is mingled. Several of the most silicic samples (n = 7, all ~70 wt % SiO2) also display banding in thin section. Others have more cryptic mingling not apparent in hand sample or by light microscopy.
Figure 3. Major element oxides (wt %) plotted against SiO2 for all Papagayo samples. Black stars on chemical variation diagrams show three end member mixing compositions predicted by polytopic vector analysis (PVA) and are explained in the text. Rhy, rhyolite; BA, balsaltic andesite; Dac, dacite.
Geosciences 03 00585 g003
Figure 4. Select trace elements (ppm) plotted against wt % SiO2 for all Papagayo samples. Black stars on chemical variation diagrams show three end member mixing compositions predicted by PVA and are explained in the text.
Geosciences 03 00585 g004
Figure 5. Chondrite-normalized rare earth element (REE) plot showing the range for Papagayo samples (n = 33) and the three “anomalous” samples.
Geosciences 03 00585 g005
Figure 6. Scanning electron microscope backscatter image of glass in the thin section of Papagayo sample 020702-4a (65.8 wt % SiO2). Differences in shade represent differences in glass composition. Notice several bright spots that occur in the darker areas. These may be microphenocrysts, although they are not observed using transmitted or reflected light microscopy.
Geosciences 03 00585 g006
The phenocryst content of the Papagayo samples ranges from 2%–30% by volume, although most contain approximately 10% crystals. The bulk assemblage consists of plagioclase, orthopyroxene (opx), clinopyroxene (cpx) and titanomagnetite, with trace amounts of ilmenite and apatite. Relative abundances vary from sample to sample, but plagioclase is the dominant phase in all samples. Plagioclase phenocrysts are euhedral to subhedral and range from 0.25 to 3.0 mm in length. Clinopyroxene and opx grains are predominantly euhedral and are up to 2.5 mm-long, although most are 0.25 to 1.25 mm. Apatite occurs mainly as small (<0.25 mm) acicular inclusions in plagioclase and, less frequently, pyroxene. Although all minerals are found as isolated phenocrysts in the groundmass, plagioclase, pyroxene and oxide phenocrysts frequently occur in glomeroporphyritic clots. Disequilibrium textures in plagioclase and pyroxene phenocrysts are ubiquitous throughout the samples. Many plagioclase crystals have sieved cores, resorption rims and/or rims with overgrowths. Overgrowths in plagioclase are marked by concentric zones of melt inclusions, serrate boundaries and optical discontinuity of the rims with the host crystals. Many pyroxene grains also display serrate grain boundaries and embayments.

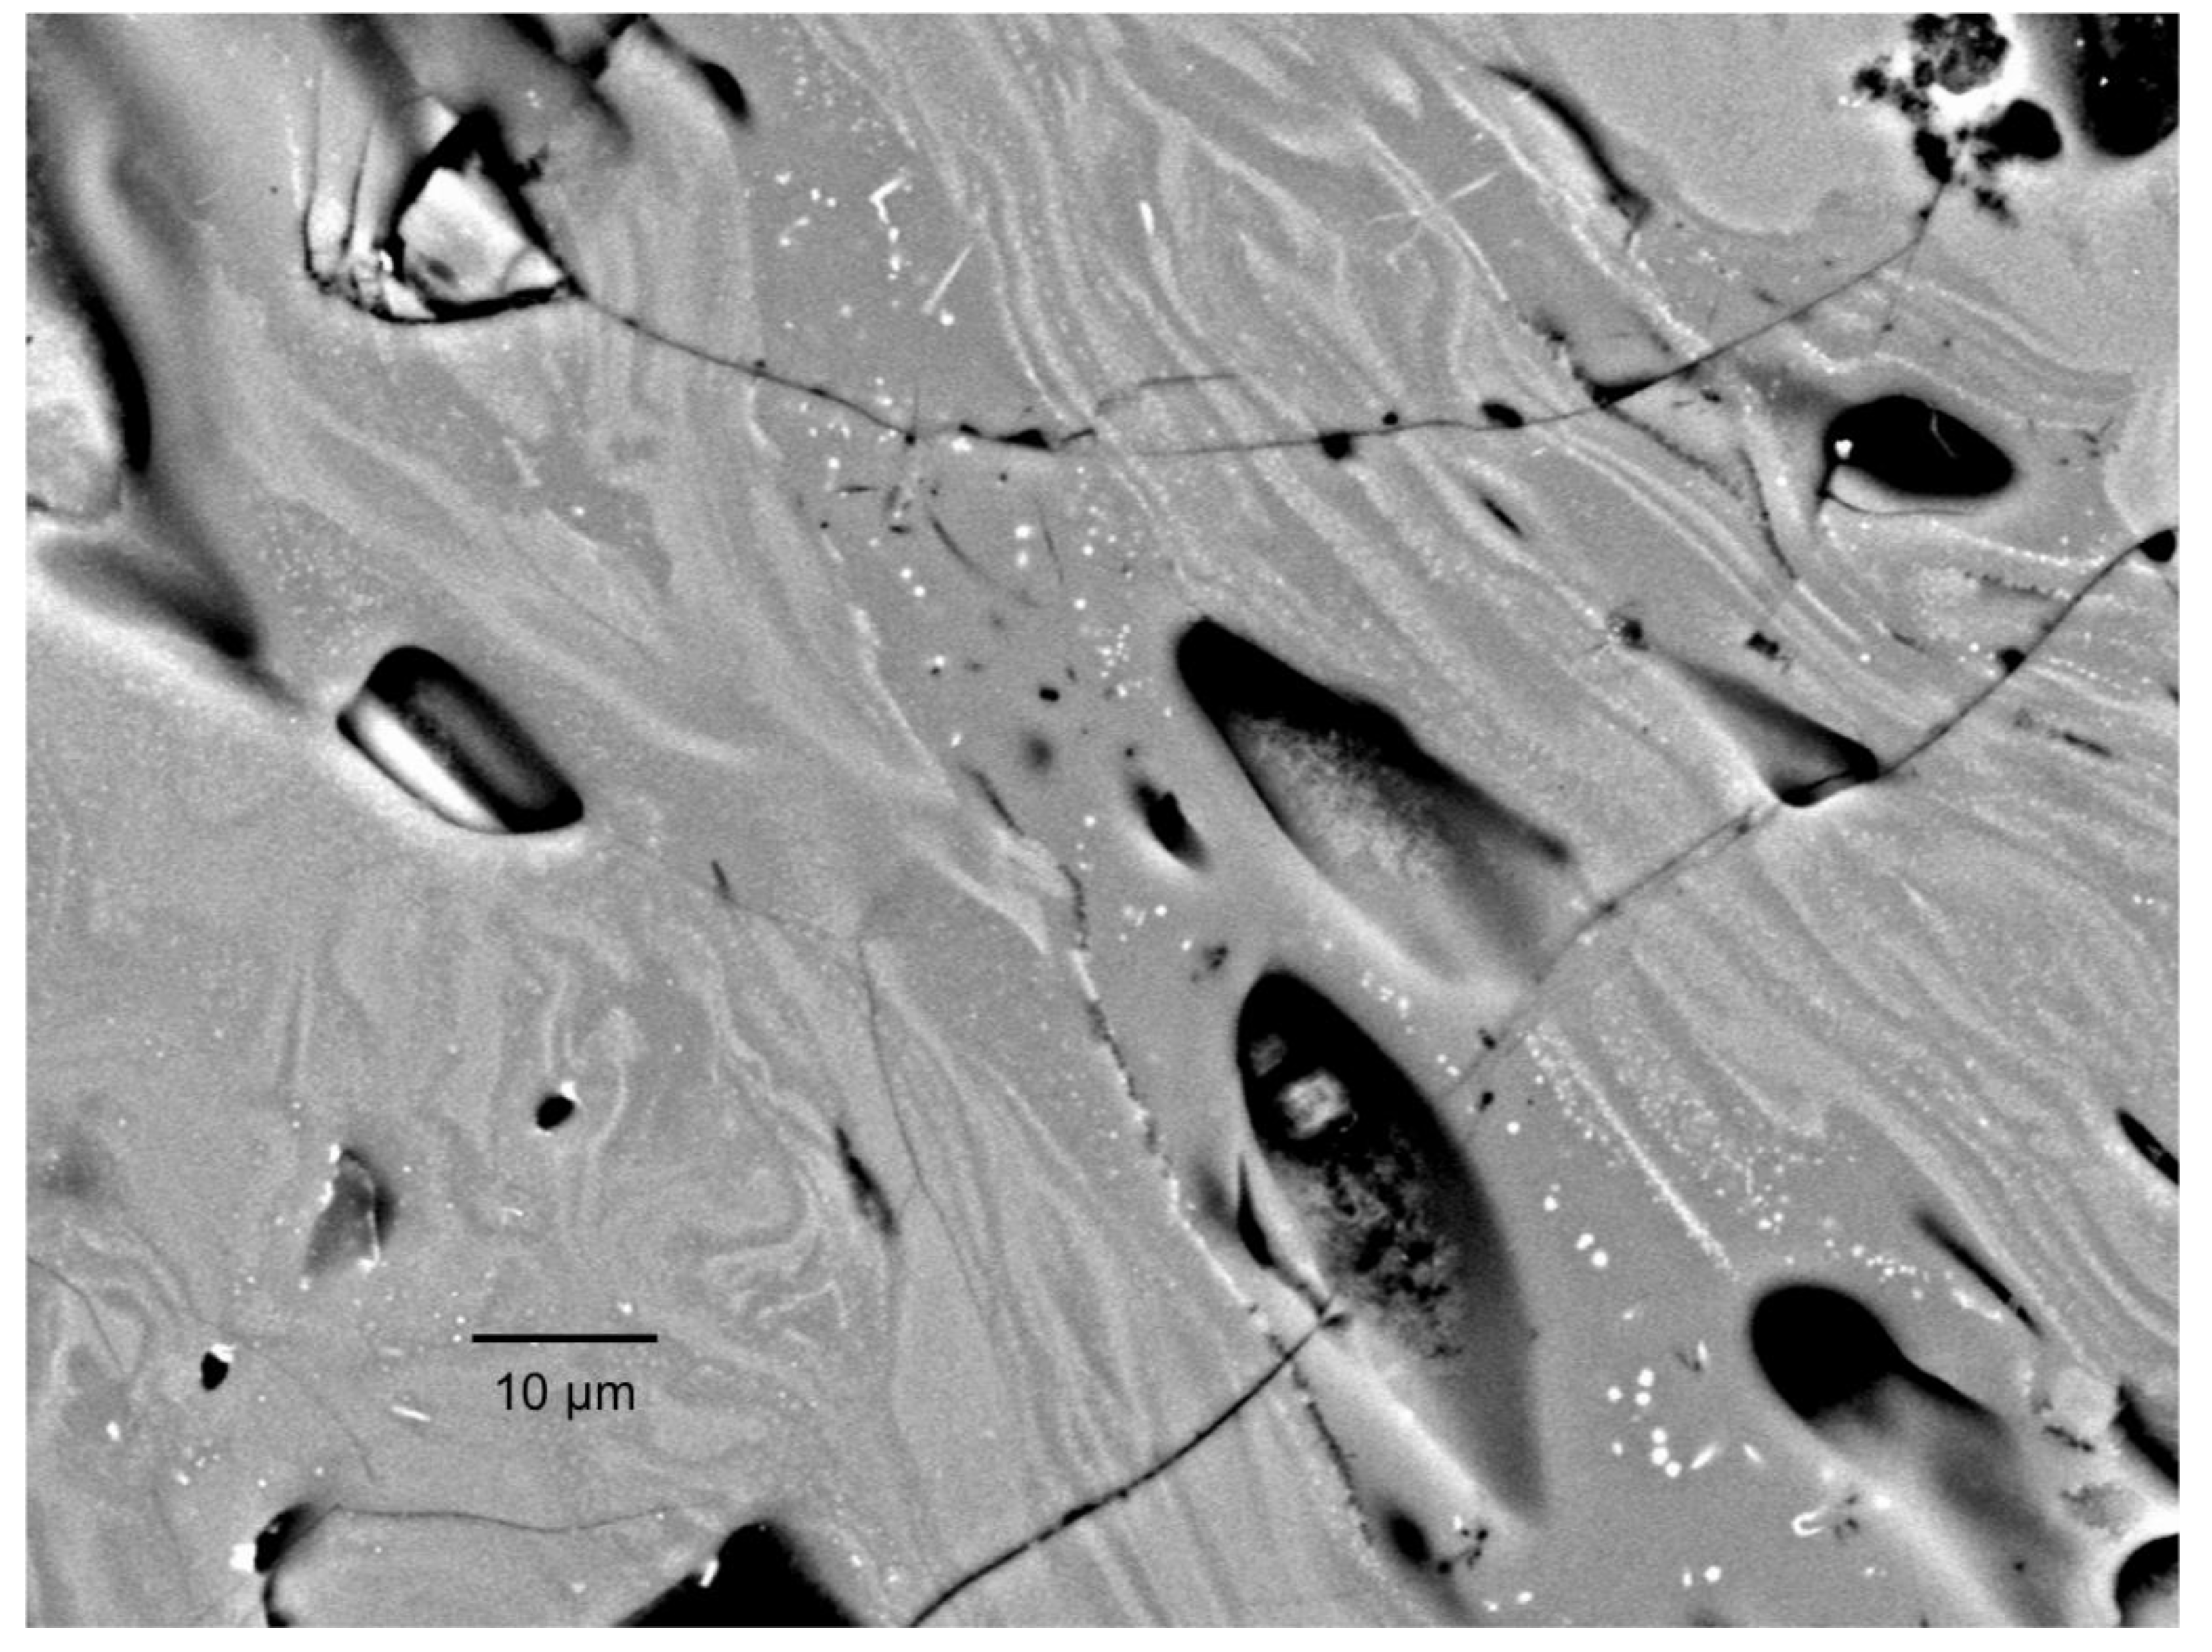
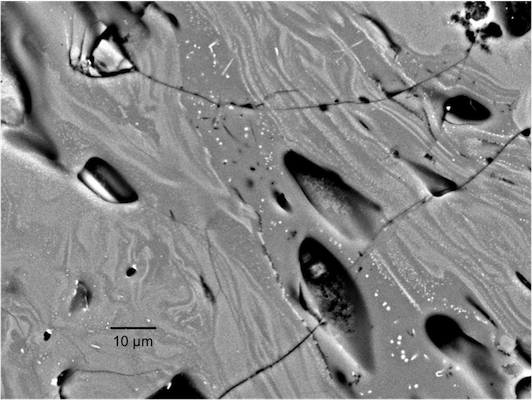
4.2. Matrix Glass Composition

Groundmass glass was analyzed in 90 locations among nine thin sections representing nearly the entire range of the bulk sample compositions (60.1–70.9 wt % SiO2). Data for glass analyses are given in Supplementary Table S2, with weight percent oxides recalculated to 100% anhydrous (again, because of the hydrated nature of the glassy pumice fragments).
Glass analyses reveal a broad range of compositions within and among individual pumice fragments. Analyses from individual samples (including sample 020702-4a, shown in Figure 6) span nearly the entire compositional range found among all samples. Analyses also show an approximately equivalent 10 wt % range in SiO2 with their bulk rock counterparts; major elements in groundmass glass also display similar trends as those for the bulk rock samples (Figure 7).
Although there is an apparent continuum of major element composition in matrix glass (Figure 7), a narrow gap occurs at approximately 69 wt % SiO2 and 0.8 wt % MgO (Figure 8). Glasses of different color sometimes reflect differences in chemistry, but glass color is not a predictor of composition. It is possible this result is influenced by a combination of the fine, micron-scale of mingling in samples and the 10-μm diameter of the EMP electron beam. In other words, the beam occasionally samples more or less discrete bands of glass, and in other cases, the mingling is on a finer scale than the diameter of the beam (i.e., more homogenized glass). The beam size may therefore contribute to an artificial “continuum” of chemical composition in glass analyses (Figure 8) that obscures a perhaps narrower bimodal compositional distribution in mingled samples. Although diffusion rates in most silicate melts (e.g., [45]) would not permit the preservation of chemical zoning at this scale exhibited in Figure 8 for long periods, it is possible that banding in some samples was produced by syn-eruptive mixing. As in most cases of magma mixing, the terms “mingled” and “mixed” are defined arbitrarily by scale and the measuring tool used.
Figure 7. Plots of wt % MgO vs. wt % SiO2 in (a) Papagayo whole rock samples and (b) groundmass glass; and wt % CaO vs. wt % SiO2 in (c) whole rock samples and (d) groundmass glass. Linear trends in whole rock and glass analyses cover a similar 10 wt % range in SiO2, >1.5 wt % range in MgO and 4 wt % range in CaO. Regressions lines for bulk rock, and glass trends have similar slopes with R2 ≥ 0.88.
Geosciences 03 00585 g007
Figure 8. (a) SiO2 vs. MgO in groundmass glass. A gap occurs at approximately 69 wt % SiO2 and 0.8 wt % MgO; This gap reveals a bimodal distribution of glass compositions shown in histograms for (b) wt % SiO2; and (c) wt % MgO in glass analyses.
Geosciences 03 00585 g008

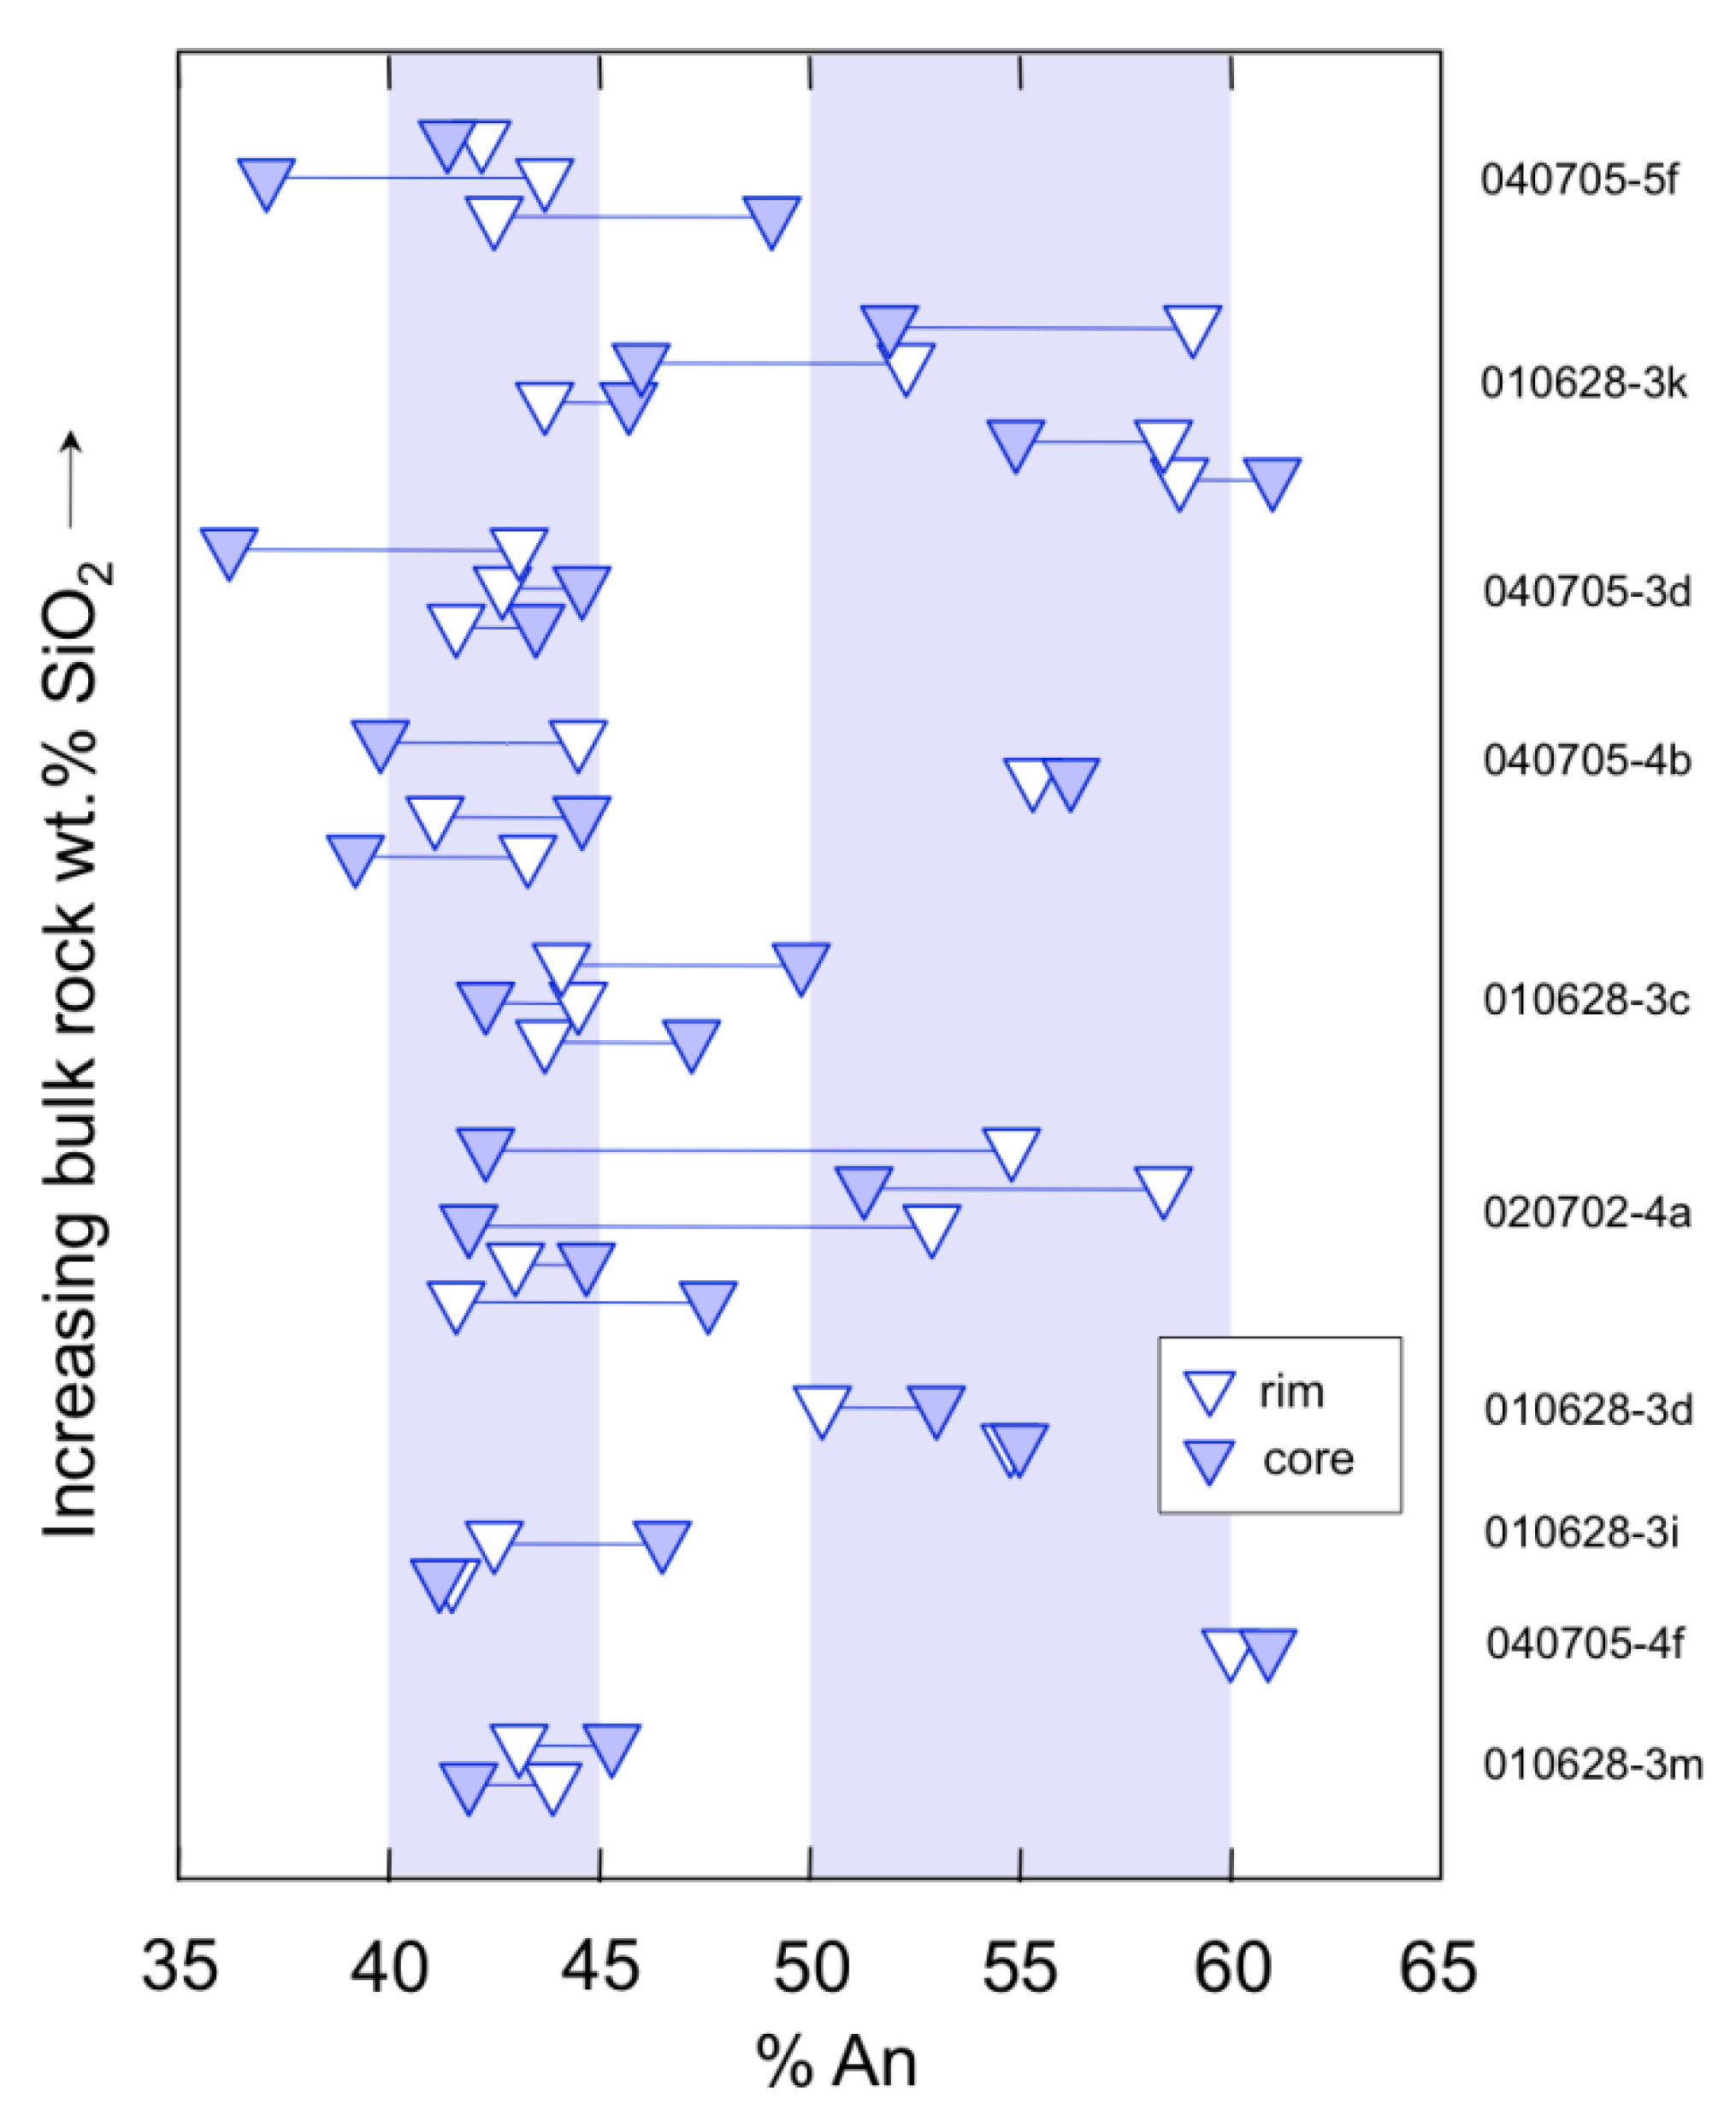
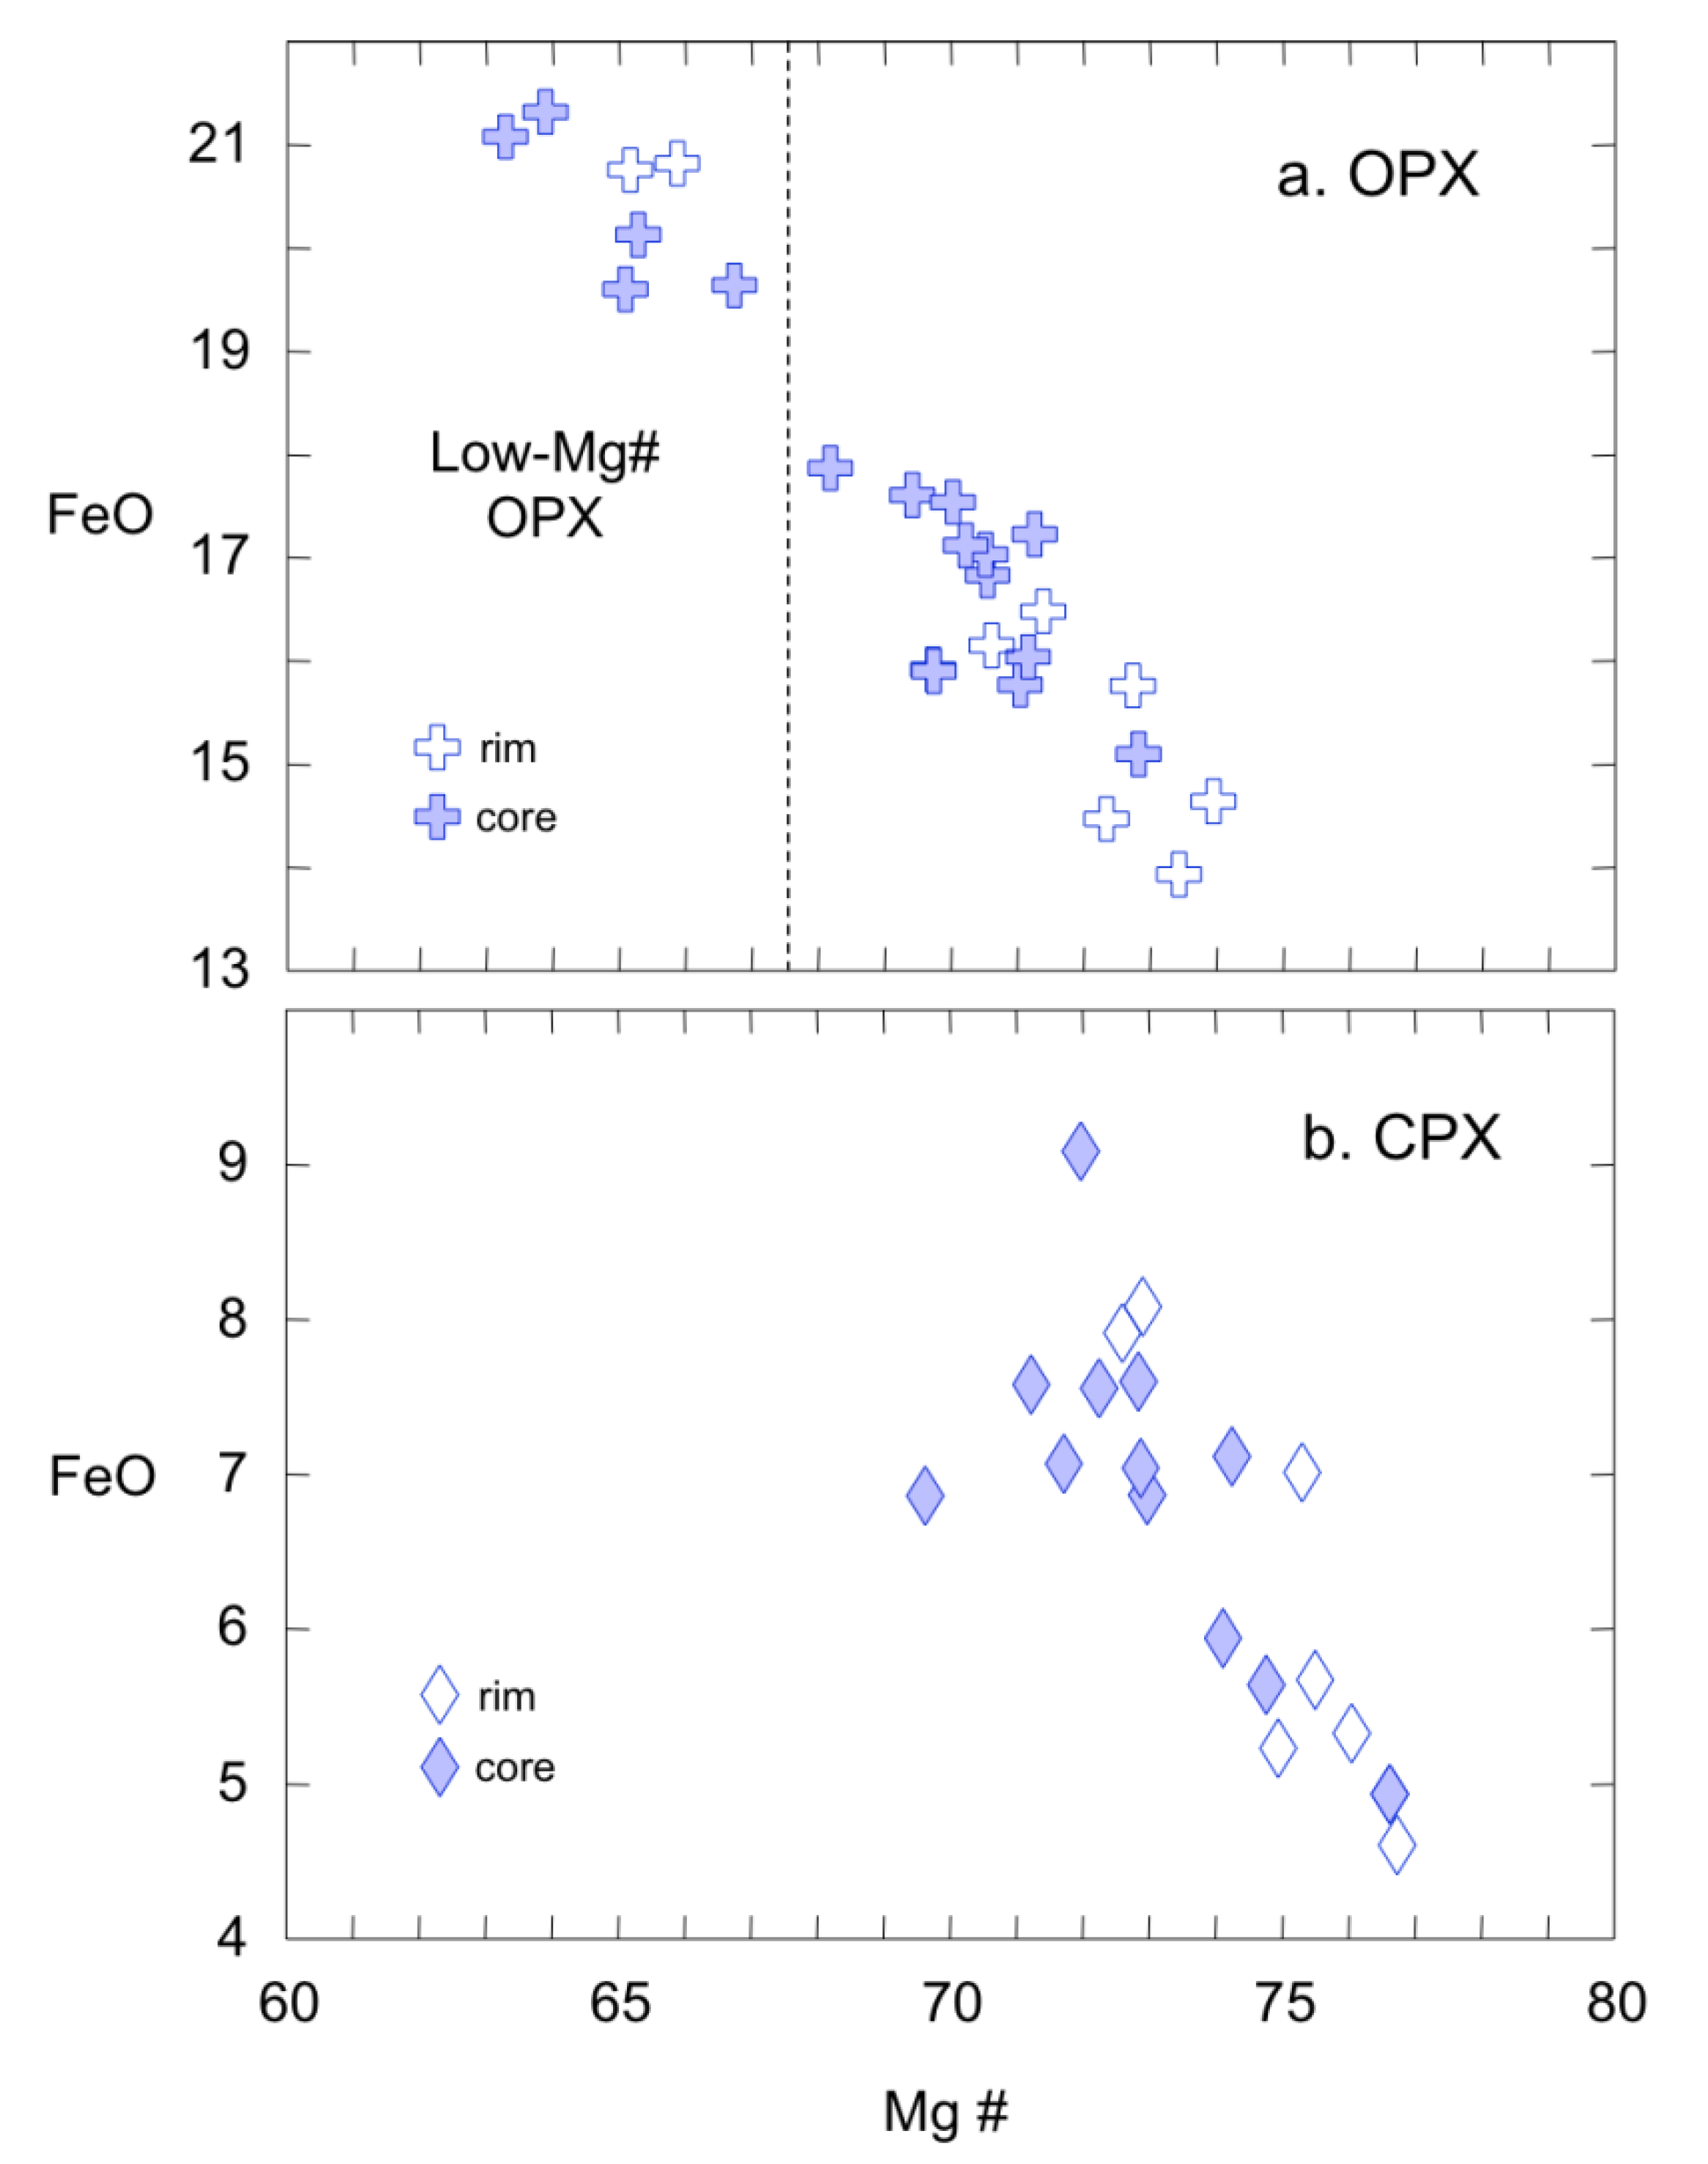
4.3. Mineral Compositions

Thirty-one plagioclase phenocrysts were analyzed by EMP among ten thin sections of Papagayo samples. Plagioclase analyses are given in Supplementary Table S3. The anorthite (An) content of plagioclase grains is given as mol % An (Ca/Ca + Na + K) × 100.
Plagioclase compositions are variable, but do not vary systematically across the bulk compositional range of the samples. Cores range from An36 to An61, and rims have a comparable range from An41 to An60. Intermediate zones of grains, where analyzed, vary from An39 to An55. Plagioclase grains exhibit both normal and reverse zoning. Grains with both types of zoning occur in nearly all samples in which multiple grains were analyzed. Although core and intermediate zones show a continuum of compositions, rims have a markedly bimodal distribution, with two-thirds (65%) of rims ranging between An41 and An45 and one-third (35%) ranging from An50 to An60 (Figure 9). Notably, all but one of the An50–60 rims are from samples that have the widest distribution of glass compositions, spanning the high-MgO and low-MgO populations of glass analyses shown in Figure 8.
Figure 9. Rim and core compositions in mol % An for plagioclase phenocrysts, plotted vertically by increasing SiO2 content of the host pumice fragment (sample numbers are given on the vertical axis by groups of phenocrysts). Shaded fields identify two distinct populations of plagioclase rims from (1) An41 and An45 and (2) An50 to An60.
Geosciences 03 00585 g009
EMP analyses were made for 28 pyroxene grains among six thin sections; 17 of the 28 were orthopyroxene (opx) and 11 were clinopyroxene (cpx). Analyses for pyroxene phenocrysts are given in Supplementary Table S4. The magnesium number (Mg#) is given as Mg/(Mg + Fe) × 100.
Opx compositions range from Mg# 63–74, and there is a gap in the FeO content of these phenocrysts, separating grains with cores that have Mg# <67 and >19 wt % FeO (Figure 10a). Opx grains in the low-Mg# group are from samples that cover the complete range in bulk rock SiO2: 010628-3k (70.2 wt % SiO2), 020702-4a (65.8 wt % SiO2) and 010628-3m (60.1 wt % SiO2). Cpx grains have a slightly more restricted compositional range (Mg# 73.9 ± 2.0). Unlike opx compositions, there are no significant compositional gaps among cpx grains, with the possible exception at ~6 wt % FeO (Figure 10b). However, there is no corresponding gap in Mg#, as seen for opx (Figure 10a).
Figure 10. FeO content (wt %) plotted against magnesium number (Mg#) for Papagayo (a) orthopyroxene (opx) and (b) clinopyroxene (cpx) grains. In (a), filled crosses are cores of opx, while open crosses are rim compositions. Samples to the left of the vertical dashed line in (a) are the low-Mg# population of opx phenocrysts observed in Papagayo samples. In (b), filled vertical diamonds are cpx cores, and open vertical diamonds are cpx rims from Papagayo samples.
Geosciences 03 00585 g010

5. Discussion

5.1. Magma Mixing in the Papagayo Tuff

Bulk-rock chemistry, microchemistry of glass and phenocrysts and petrography support mixing (sensu lato) of a high-silica (>71 wt % SiO2) and a low-silica magma (<60 wt % SiO2) to produce the magma that erupted to form the Papagayo Tuff. The sample with the highest silica content (040705-3b, 70.9 wt % SiO2) does not appear mingled in thin section, and the most silicic sample analyzed by electron microprobe (040705-4f; 70.3 wt % SiO2) does not display glass compositions with <72 wt % SiO2 (n = 8). One sample, however (010628-3k; 70.2 wt % SiO2), is mingled and contains both high- and low-silica glass. Therefore, the high-silica magma must have a bulk SiO2 composition ≥71 wt %. Conversely, sample 010628-3m, the sample with the lowest bulk silica content, also analyzed by microprobe (010628-3m; 60.1 wt %), is mingled and displays glass from both high- and low-silica populations in Figure 8. Coupled with the bulk composition of the lowest-silica sample (040705-4d; 58.3 wt % SiO2), the low-silica magma must have a silica content ≤58 wt % SiO2. Momentarily disregarding samples 010628-3c, 010628-3e and 040705-4d in Figure 3, linear trends for major elements oxides therefore represent mixing between the two magmas, and glass compositions within individual samples accordingly mimic the bulk chemical range of the entire suite of pumice samples (Figure 7).
Phenocryst textures and compositions provide further evidence of magma mixing. Many plagioclase and pyroxene phenocryst textures clearly reflect chemical and/or thermal disequilibrium between crystals and their surrounding melt during mingling. Normal and reverse zoning in plagioclase, opx and cpx phenocrysts provide evidence that the mixing was incomplete, i.e., some phenocrysts remained in equilibrium with their host liquid prior to eruption, while others were entrained as antecrysts in the other magma. (As used by Beard [46], “antecryst” here refers to phenocrysts present in magmas prior to mixing, expanding upon the term for cognate crystals in plutonic bodies used by Bacon and Lowenstern [47], among others.) The rim compositions of mineral grains reflect the composition of the last liquid from which they grew, i.e., with which they were in equilibrium. In the Papagayo samples, there is a population of low-Ca (CaO < 10 wt %) rims and a smaller population of high-Ca rims (Figure 9). Both types of rims occur on both normally-zoned and reversely-zone phenocrysts. It appears that regardless of their origin, most of the plagioclase grains were in contact with a more evolved (low-Ca) liquid before eruption, while the grains with more calcic rims were last in contact with the least-evolved liquid (high-Ca) prior to eruption. Orthopyroxene compositions also display bimodal distributions in chemistry. The low-Mg# opx phenocrysts in Figure 10a occur in the same samples that also have populations of high-SiO2/low-MgO glass (Figure 8).
Simple probability plots (cumulative frequency diagrams using a log axis for the frequency) of trace element ratios also support the presence of at least two magma batches (Figure 11). A suite of representative samples from a relatively homogeneous magma—regardless of its chemical origin—should produce a linear array on a probability plot, indicating a normal distribution about a mean. The slope of the array is a function of the standard deviation: the shallower the slope, the greater the standard deviation (Vogel et al. [35]). In the case of samples related by partial melting, fractional crystallization, or even homogeneous magma mixing, one would expect a normal distribution (e.g., linear array), although, probably, with a larger standard deviation, due to larger compositional variation (i.e., shallower slope on the diagram). Vogel et al. [35] used ratios of highly incompatible elements to evaluate sources of different high-silica ignimbrites in Costa Rica, but in theory, any trace element ratio could be used to evaluate incomplete mixing of magmas (cf., Langmuir et al. [48]). If some pumice fragments represent more or less “pure” samples of one of the discrete magma batches, while other samples are mingled, an overall normal distribution is not expected. Cumulative frequency plots for the Papagayo samples do not show normal distributions, but rather, arrays with breaks and changes in slope for many element ratios, e.g., Sr/Ba and Nd/Th (Figure 11). These distributions are consistent with incomplete mixing of at least two magmas.
Figure 11. Probability plots (cumulative frequency diagrams that use a log y-axis) for (a) Sr/Ba and (b) Nd/Th values in bulk rock Papagayo samples.
Geosciences 03 00585 g011

5.2. Origin of the Anomalous Samples

Three of the 36 Papagayo samples—010628-3c, 010628-3e and 040705-4d—deviate significantly from the linear trends for several elements in Figure 3 (e.g., Al2O3, MnO) and for the REEs (Figure 4, Figure 5). Although there are only three anomalous samples, they cover almost the entire silica range of the suite of 36 samples at 58.3, 64.5 and 67.3 wt % SiO2 respectively. With a 9 wt % SiO2 range, the three samples form a coarsely sub-parallel array to the linear trends observed for some oxides (Figure 3, e.g., Al2O3, MgO, MnO) and, even, for some trace elements, REE in particular (Figure 4, e.g., La, Ce, Yb, Lu).
With respect to the possibility of weathering, all three samples meet “freshness” criteria for inclusion in this study. Samples have analytical totals >95%. Similarly, using the chemical weathering index (WI) of Parker [49], all three samples have WI values >40 on the dimensionless scale, consistent with other Papagayo samples. (The threshold here is arbitrary, but altered pumice fragments in the region that have WI values <40 using the Parker [49] index generally correlate with low analytical totals and/or evidence of zeolite or clay formation in the thin section.) Although only one of the three pumice fragments was large enough for a thin section and a sufficient sample for bulk chemical analysis (010628-3c), there is no petrographic evidence for extensive alteration or chemical weathering compared to other Papagayo samples. The relatively depleted REE patterns for the three samples in Figure 5 compared to other Papagayo pumice are broadly similar to REE depletions reported by Patino et al. [50] for shells of spheroidally weathered basalts and andesites from Hawaii and Guatemala, but the patterns lack the clear and characteristic positive cerium (Ce) anomalies reported by the authors for incipient weathering. Therefore, there is no convincing evidence that weathering is responsible for changing the composition of these three samples relative to other samples from the same outcrops.
Assuming the samples represent primary magmatic compositions, there are a limited number of possible origins for the subset of samples, although they are clearly contemporaneous with and genetically related to the Papagayo suite. In situ crystal fractionation is an improbable, if not impossible, mechanism for producing variation in just three samples. Likewise, the variation is not likely due to differences in crystal content among pumice fragments with host phases that preferentially incorporate certain elements (e.g., REE); there is no readily apparent phase or assemblage that would produce the variable enrichments and depletions among the elements identified for the three samples in Figure 3, Figure 4.
A simpler and more reasonable explanation for the origin of the three samples—and at the same time, consistent with the larger range in trace element composition among the high-silica samples and REE, in particular—is that there was another high-silica magma involved in the petrogenesis of the Papagayo Tuff. In other words, a second high-silica magma batch may have mixed with the other high-silica magma prior to the mixing event that produced the linear trends in Figure 3, Figure 4. In this scenario, the three anomalous samples are actually preserved remnants of mixing among just two of the three magmas. However, with only three samples, the number of petrographic and microchemical observations to test this hypothesis is severely limited. A more robust statistical technique, like polytopic vector analysis (PVA), can help to simultaneously evaluate the samples within the context of the entire set of bulk rock geochemical variables.

5.3. Polytopic Vector Analysis (PVA)

Polytopic vector analysis (PVA) is a multivariate statistical program for analyzing sample suites that result from mixing of two or more end members [51,52,53]. Although PVA has been used for several decades to evaluate source mixing in cases of environmental contamination [54,55,56], its application to igneous petrology is fairly new. An extensive discussion of PVA applied to relatively simple igneous systems can be found in Vogel et al. [19]. Tefend et al. [18] used PVA to evaluate a complex volcanic system involving multiple mixed magma batches; Deering et al. [57] used PVA to document the evolution of rhyolites in the Taupo Volcanic Zone in New Zealand; Barclay et al. [17] used PVA to evaluate recharge events in the erupting Soufrière Hills Volcano, Montserrat, as evidenced in chemically diverse mafic enclaves. A more comprehensive discussion of the technique and its development can be found in [18,52,53,54]. In brief, PVA is an oblique factor analysis procedure that uses all available geochemical analytes to simultaneously evaluate a group of samples that result from mixing (or “unmixing,” such as the case of fractional crystallization [19]). PVA determines the number and composition of end members required to explain the variation within the sample population. It is the responsibility of the analyst to evaluate how reasonable the solution is for a given number of end members in terms of both statistical fit and, in this case, geological feasibility. PVA also determines the unique composition of every sample by expressing the relative proportion of each end member in each sample. By definition, the proportions of each end member in every sample yield a constant sum of one (or 100%) [18]. Therefore, PVA should not be used as a “blind” probative technique to look for genetic or, even, descriptive statistical information about a sample suite. Since the process presupposes mixing (or unmixing), an analyst could force a solution for a set of unrelated samples.
Traditionally, petrologists have evaluated magma mixing in bulk rock samples using multiple linear regressions [58] and plots of trace element ratios [48]. However, Tefend et al. [18] and Vogel et al. [19] demonstrate that a multivariate technique, like PVA, has advantages over these tests alone, because it (1) assesses relationships among samples using all available data rather than select sets of variables, (2) places the same relative importance of each variable in the data set rather than artificially weighting more abundant components (e.g., SiO2) and (3) requires a solution that “fits” every sample, rather than placing a disproportionate importance on just the samples used in modeling. For these reasons, Vogel et al. [19] also note that PVA is not a stand-alone test, but only adds to the petrological toolbox for evaluating magmatic systems.

5.3.1. PVA of the Papagayo Samples

PVA was performed on the data set of 36 bulk rock analyses (10 major elements and 25 trace elements) for Papagayo samples. The analysis resulted in a three end-member solution to describe the chemical variation within the population. The robustness of a variable is given by its coefficient of determination (CD). The CD is similar to a statistical R2 value in regression analysis; it is a measure of predicted versus actual values or how well a given solution can be used to “back-calculate” and reproduce the original data set [59,60]. In a solution with n end members, where n is the number of variables, the CD for each should be unity (i.e., one). While we arbitrarily use a lower limit of 0.4 for a variable to support a solution with x end members, a CD of 0.9 or higher very strongly supports the solution. Table 1 gives the CD for each analyte in a two, three and four end member solution for the Papagayo samples. A three end member solution describes ~98% of the chemical variation among the suite of samples (PVA also provides a composite measure of the overall “fit” of the solution, not found in Table 1), although Na and Eu have very low coefficients of determination in the three end member solution (0.13 and 0.07, respectively; Table 1). However, a four end member solution is not necessary to describe most of the variation among the samples. Evaluating how much the “fit” of a solution is improved by adding an end member is a subjective process (e.g., how significant is describing 95% vs. 98% of the chemical variation), but PVA is just one petrological tool. In this case, a four end member solution is not geologically reasonable; one end member in a four end member PVA solution has zero (0) values for seven elements.
Table 1. Coefficients of determination (CD) for each analyte in a two, three and four end member PVA solution for all Papagayo samples. See text for explanation of CDs. Notice the low CDs for Na and Eu in a three end member solution.
Analyte234
SiO20.960.980.99
TiO20.860.880.93
Al2O30.700.810.79
Fe2O30.960.970.98
MnO0.390.610.64
MgO0.850.950.97
CaO0.910.960.98
Na2O0.030.130.86
K2O0.890.930.95
P2O50.840.920.93
Rb0.700.850.91
Sr0.880.900.95
Sr0.920.930.95
Ba0.780.900.94
La0.700.810.95
Ce0.820.900.93
Pr0.510.790.95
Nd0.250.700.93
Sm0.180.670.91
Eu0.050.070.84
Gd0.100.680.88
Tb0.160.680.88
Y0.220.810.93
Dy0.130.750.89
Ho0.180.780.90
Er0.270.820.93
Yb0.390.860.95
Lu0.380.840.93
V0.890.900.91
Nb0.920.940.96
Hf0.890.910.92
Ta0.870.920.92
Pb0.500.520.59
Th0.880.900.93
U0.820.820.87
The compositions of the three end members determined by PVA are given in Table 2. The first end member is rhyolitic (71 wt % SiO2); the second is basaltic andesite (53 wt % SiO2), and the third is dacitic (69 wt % SiO2). End members are indicated by black stars on chemical variation diagrams and labeled in tables and figures as rhyolite (Rhy), balsaltic andesite (BA) and dacite (Dac). Note that in Figure 3, Figure 4, the end members form triangular mixing fields that (ideally) bound all samples. Samples closer to one end member, logically, contain a higher proportion of that end member with respect to the other two.
Table 2. Composition of end members determined by PVA for the three end member solution for all Papagayo samples. Major element oxides are listed in weight percent, and trace elements are in ppm. Rhy, rhyolite; BA, balsaltic andesite; Dac, dacite.
AnalyteRhyBADac
SiO272.553.168.9
TiO20.581.170.72
Al2O313.4019.0016.90
Fe2O32.1811.404.20
MnO0.130.190.06
MgO0.662.950.02
CaO1.797.291.58
Na2O2.803.743.95
K2O5.540.313.39
P2O50.120.600.00
Rb128.011.151.9
Zr298.068.2290.0
Sr217.0734.0329.0
V0.0190.043.7
Y50.8023.7018.40
Nb15.602.1415.70
Ba16808092130
La52.3018.9032.70
Ce105.0034.0066.90
Pr13.605.616.98
Nd51.5026.7024.70
Sm9.925.644.88
Eu1.681.891.68
Gd9.015.514.27
Tb1.390.790.64
Dy7.914.313.10
Ho1.690.850.65
Er4.912.211.86
Yb5.191.931.90
Lu0.830.300.29
Hf6.501.826.41
Ta0.910.021.01
Pb10.001.869.53
Th11.902.9011.90
U5.360.634.32
It is useful to note here that as a petrological tool, end member compositions determined by PVA can aid in evaluating possible sources of geochemical mixing in the broadest sense. PVA uses the observed geochemical variations to deconvolve possible sources, but the end members only describe the variation, or more appropriately, some fraction thereof. In this respect, PVA can help the analyst identify less obvious patterns or sources obscured by mixing, as discussed below. However, while the end members should be geologically reasonable, they almost certainly do not represent or even necessarily reflect actual geological source materials. This is why PVA should be used in tandem with other evidence: it does not provide a reliable level of detail about an individual sample or distribution of a single geochemical analyte.
Since PVA gives the composition of every sample in terms of the proportion of each end member to a constant sum of 1.0, samples can then be plotted in x-y space by end member for comparison. Figure 12 is a scatter plot showing the relative composition of the Papagayo samples in terms of each end member plotted against each of the other two. As in previous figures, samples are color coded by the same arbitrary divisions in silica content. Like simple plots of any two elements, mixing between end members produces a linear trend. Other magmatic processes, such as fractional crystallization and partial melting, can also produce linear trends if the crystallizing/melting assemblage remains constant [19]. Figure 12 shows two trends. In BA-Dac space, the main mixing trend (a) is formed by the bulk of the Papagayo samples and shows mixing among all three end members in varying proportions. The second trend (b) is formed by the three anomalous samples with varying proportions of BA and Dac, but essentially no Rhy. The most important observation about Figure 12 is that trends (a) and (b) are roughly parallel in BA-Dac space; low-silica samples in both trends are dominated by BA, while the silicic samples in both trends contain the smallest fractions of BA (≤20%).
The rhyolitic PVA end member (Rhy, 72.5 wt % SiO2) has only a marginally higher silica content than the highest-silica Papagayo samples (n = 7, 70 ± 0.5 wt % SiO2). While some of the high-silica samples appear mingled, there is evidence that they are closer to the bulk composition of the high-silica magma than the lowest-silica samples are to the mafic magma. For example, the average glass composition of the three most silicic samples analyzed by microprobe is 71.5 ± 2.2 wt % SiO2 (n = 27 analyses), demonstrating the paucity of low-silica glass compositions represented in the samples. Therefore the 72.5 wt % SiO2 value of the rhyolitic end member is consistent with the expected value >70 wt % SiO2.
The dacitic end member identified by PVA (Dac, 68.9 wt % SiO2) not only describes the chemical composition of the three anomalous samples as mixtures of basaltic andesite and dacite (without contamination by mixing with high-silica rhyolite), but it also describes chemical variation among high-silica Papagayo samples in select trace elements (Figure 4). For example, even if one were to disregard the three anomalous samples, there is enough variation among the remaining 33 Papagayo samples with respect to REE (e.g., Lu; Figure 4) and select trace elements, like Hf (Figure 4) and Y (not shown), that a three end member PVA model is still necessary to capture most of the variation. Independent PVA on the 33 “main” Papagayo samples alone requires a three end member solution with two high-silica end members (70.7 and 70.6 wt % SiO2) with nearly identical major element compositions to one another. The necessity of a third end member in this analysis provides corroborating evidence of mixing that would be otherwise obscure using traditional bulk chemical and microchemical techniques alone.
Figure 12. Scatter plot showing Papagayo samples in terms of relative proportions of the three end members identified by PVA. Samples are coded by the same arbitrary divisions in silica content as in previous diagrams. Two trends are identified among the samples and marked as trends “a” and “b” (see text for discussion).
Geosciences 03 00585 g012
PVA provides a robust test of mixing, because it uses all geochemical variables simultaneously. Plots of individual element ratios provide a graphical confirmation of the mixing relationships after Langmuir et al. [48], which can be used in tandem with PVA end member compositions to estimate mixing proportions. Plots of any two elemental ratios should yield a hyperbolic curve for samples that result from magma mixing, and all elements should conform to such mixing curves if the data set is internally consistent [48]. A second test for mixing is to then plot one of the original ratios against the ratio of denominators; samples produced by mixing should then fall along a straight line on the companion plot. Figure 13a shows samples plotted in terms of CaO/Y and Ba/TiO2 ratios, in addition to the three PVA end members predicted for Papagayo samples. Mixing lines between Rhy-BA and Dac-BA are each shown in 20% increments. The three “anomalous” samples plot along the Dac-BA mixing curve in Figure 13a, whereas samples in the main group of Papagayo samples plot closer to the Rhy-BA mixing curve. The companion mixing plot after [48] is shown in Figure 13b using the same y-axis, but changing the x-axis to the ratio of the denominators, or Y/TiO2. Note that the “anomalous” samples still plot close to the Dac-BA mixing curve in Figure 13b, although the main group of samples forms a wider array between the two curves that also has an origin at BA. The range of x-axis (Y/TiO2) values is larger for high-silica samples in this group and decreases for intermediate low-silica samples as the relative proportion of BA increases. These observations are mutually consistent with the multi-stage mixing relationships identified in the PVA solution (Figure 12); however, without the end members identified by PVA, the complexity of the system and the scarcity of anomalous samples makes an interpretation much more difficult. The unequivocal identification of the three end member solution for the sample set would not have been possible without PVA.
Figure 13. Mixing plots using element ratios for Papagayo samples: (a) Ba/TiO2 vs. CaO/Y; and (b) Ba/TiO2 vs. Y/TiO2. Symbols are the same as in previous diagrams. PVA-generated end members are shown by stars. In both (a) and (b), mixing lines are shown in 20% increments of Rhy-BA and Dac-BA.
Geosciences 03 00585 g013

5.4. Petrogenesis of the Papagayo Tuff

The Papagayo Tuff resulted from mingling and eruption of a low-silica basaltic andesite and a high-silica rhyolite. At some point prior to the mixing event that triggered the eruption, another silicic magma of dacitic composition incompletely mixed with the rhyolitic magma to produce the small, but apparent, differences in some trace element compositions among the most silicic Papagayo samples. Three anomalous samples record the composition of the dacitic magma, preserving evidence of “clean” mixing between basaltic andesite and dacite, with no influence of the rhyolitic magma on their compositions. It is possible that a pristine parcel of dacitic magma was entrained in rhyolitic magma prior to mixing with the mafic basaltic andesite magma.
The exact timing and sequence of mixing events cannot be definitively known, since the anomalous pumice samples were produced by the same eruptive event as other Papagayo samples, yet were not chemically mixed with rhyolitic magma. However, several lines of evidence support a model of Rhy-Dac mixing prior to Rhy-BA mixing. First, the range of compositions generated by Rhy-Dac mixing is larger among the high-silica and intermediate samples and decreases as the effect of mingling with the mafic BA magma overwhelms the Rhy-Dac mixing signal (Figure 12, Figure 13). Secondly, petrographic and microchemical evidence clearly demonstrate mingling of BA-type glass with high-silica glass (Figure 6) centered about a mode of 72–73 wt % SiO2 (Figure 8) at the time of eruption. This is logical, because mixing between a basaltic andesite magma and a rhyolitic magma is much more likely to have triggered an eruption than the mixing of two high-silica magmas. It is also plausible that there were several Rhy-Dac mixing events that simply cannot be resolved using this data set.
Numerous examples of eruptions triggered by either mafic or silicic recharge mixing events have been described in the literature [3,5,6,7,61], although the former is more common and more likely in terms of crustal dynamics (e.g., [62]). Regardless of the triggering mechanism, it appears that more homogeneous silicic Papagayo magma was erupted from the magma chamber first. Figure 14 shows SiO2 content plotted against the stratigraphic position of each sample in the continuous 23-m section of the Papagayo Tuff exposed at Bahía Culebra (location “1” in Figure 1). Samples at the base of the section (i.e., first to be erupted and deposited) are exclusively high-silica samples. Although the sample size from the base of the section is small, no intermediate or low-silica samples are found in the lower 10 m of the section. Above this point, chemically intermediate samples appear, followed by a continuum of low-silica through high-silica samples near the top of the section. This pattern is consistent with expulsion of more pristine silicic magma that resided at the top of the magma chamber immediately prior to the start of the eruption. As the eruption continued, mingling with progressively larger volumes of low-silica magma occurred, producing the continuum of pumice compositions at the top of the ignimbrite (Figure 14).

5.5. Magma Mixing as a Process in the Formation of Continental Crust

Building on the work of Vogel et al. [35,39] and Deering et al. [43], among others, Figure 15 is a schematic model for the petrogenesis of the Papagayo Tuff in the context of the chemical transformation of oceanic crust in northern Costa Rica into continental crust. Ignimbrites of the Bagaces Formation possess the relative enrichments in light rare earth elements (LREE) and large ion lithophile elements (LILE) and depletions in high field strength elements (HFSE) that are common in subduction zone magmas. These characteristics impart a permanent chemical signature to the continental crust [63]. In fact, incompatible trace element patterns for the Papagayo Tuff and other Bagaces units are nearly identical to average values of the upper continental crust of Rudnick and Gao [64] (Figure 16). The only notable exception between the patterns is the relative Ba enrichment in Bagaces units. However, this enrichment is explained by the moderately high recycling efficiency of Ba coming from biogenic sediments on top of the Cocos Plate and being subducted beneath northern Costa Rica [65].
Figure 14. SiO2 content plotted against the stratigraphic position of each sample in the continuous 23-m section of the Papagayo Tuff exposed at Bahía Culebra (location “1” in Figure 1). Note that the stratigraphic position of samples taken from the Aguacaliente locality (shown at the top of the diagram) is uncertain.
Geosciences 03 00585 g014
Figure 15. Schematic diagram for the petrogenesis of the Papagayo Tuff.
Geosciences 03 00585 g015
Figure 16. Spider diagram of incompatible elements for samples of the Papagayo Tuff (n = 36) and all units of the Bagaces Formation (n = 128). The average composition of the upper continental crust as given by Rudnick and Gao [64] is shown by the dashed line. Data for the Bagaces Formation from Szymanski [66].
Geosciences 03 00585 g016
In Figure 15, calc-alkaline basalts produced by partial melting of the mantle are emplaced in the lower crust of the thickened CLIP, where the plutons stall and either completely or nearly completely crystallize (e.g., [35,39,40,41,42]). The lower crust, however, is kept relatively hot by continuous emplacement of new mantle melts, resulting in incomplete crystallization and/or episodes of partial melting. Liquid extraction from lower crustal crystal mushes at 50–70 vol % crystallinity [67] produces melts that can ascend higher in the crust. Deering et al. [43] demonstrated that generation of two chemically distinct magma types (high-TiO2 and low-TiO2) in northern Costa Rica are controlled by differences in lower crustal P-T-fO2-aH2O conditions; in general, low-TiO2 Bagaces-type magmas were produced under relatively hot, dry, reducing conditions compared to those that generated the younger ignimbrites of the Guachipelín Formation. In this model, a low-silica melt similar to the composition of the basaltic andesite can be produced directly from a lower crustal mush at the low end of the melt extraction window (~50 vol % crystals). Deering et al. [43] also demonstrate that more evolved melts (greater than approximately >62 wt % SiO2) must undergo an additional stage of differentiation in the middle to upper crust. Deering et al. [43] argue that geophysical characteristics of the crust in NW Costa Rica promote shallower emplacement and trapping of less evolved magmas in the lower to middle crust. Therefore, in Figure 15, melts of more intermediate (i.e., andesitic) composition are extracted from crystal mushes, ascend and become trapped in mid- to upper-crustal reservoirs, where further differentiation produces silicic magmas of rhyolitic (Rhy) and dacitic (Dac) composition. Alternatively, a small amount of crustal contamination could also generate the distinct end members identified by PVA. (In any case, the broadly similar compositions of Rhy and Dac with respect to many elements may reflect a genetic relationship to chemically similar calc-alkaline basalts in the lower crust or to intermediate plutons stalled in the middle to upper crust.) The rhyolitic and dacitic magmas then mix—although not completely, given the trace element variation among high-silica samples—to produce a hybrid high-silica magma. The low-silica BA magma mixes with the hybrid Rhy/Dac magma, as well as an entrained, relatively pristine parcel of dacitic magma, which triggered the eruption that produced the Papagayo Tuff.
The identification of two high-silica end members required to describe the chemical variation of the Papagayo samples raises important questions about their individual origins, their genetic relationship to one another and their relationship to parent melts in an evolving crust. While answering these questions is beyond the scope of this paper, the compositional distinctions between the rhyolitic and dacitic magmas shows the strength of PVA as a complementary analytical tool.

6. Conclusions

The Papagayo Tuff of the Miocene-Pleistocene Bagaces Formation of northern Costa Rica was formed by the mingling and eruption of rhyolitic and basaltic andesite magmas. Bulk-rock chemistry, glass and phenocryst microchemistry and petrographic textures support a model of mixing between a high-silica (>71 wt % SiO2) and a low-silica (<60 wt % SiO2) magma. Although analyses for pumice samples and glasses display diagnostically linear mixing trends for most elements, several trace elements show slightly larger ranges among the highest-silica samples (Figure 3, Figure 4). Even more importantly, three of the 36 pumice samples in this study deviate significantly from these linear trends for a number of major and trace elements. While there are plausible petrogenetic interpretations for these samples, the small number (and volume) of samples makes it almost impossible to test those interpretations. However, using all the bulk-rock geochemical parameters simultaneously, PVA helped identify a second high-silica end member (Dac) to explain the chemical variation among the samples, aside from the main mixing trend between rhyolitic (Rhy) and basaltic andesite (BA) end members (Figure 12, Figure 13). This information provides a much more complete interpretation of an evolving magmatic system (Figure 15) in juvenile continental crust.
This work demonstrates how traditional petrological and geochemical analyses can be integrated with a robust multivariate statistical method, like PVA, to unravel complex magma mixing histories like that of the Papagayo Tuff. The importance of mixing processes in generating the diversity of arc magma compositions during the transition from oceanic to continental crust is clear. However, even detailed geochemical studies using microchemistry can be hindered by cryptic and/or multi-stage mixing/mingling events, as well as incomplete sampling, all of which have been demonstrated here. This is the real strength in a tool like PVA, because it uses all geochemical variables concurrently, and it provides a means of identifying geologically reasonable mixing end members without assigning unintended or undue weight to specific variables or samples. For the Papagayo Tuff, PVA identified the end members involved in mixing and helped confirm the origin of chemical variation among the most silica-rich Papagayo samples. Although the three anomalous samples are shown to be critical for developing a comprehensive and reasonable petrologic model for the Papagayo Tuff, it is easy to see how the samples might be dismissed as unrepresentative, thereby obscuring the origin of geochemical trends in the remaining sample set (i.e., trace element variation among high-silica samples). These results unequivocally demonstrate the utility of PVA in identifying complex mixing relationships within and among sample suites and support the conclusions of Vogel et al. [19] about the robustness of PVA.

Acknowledgments

We are extremely grateful to Calvin Miller and Philipp Ruprecht for providing detailed and insightful reviews, both of which significantly improved the manuscript. Beth Apple, Francisco “Chico” Arias, Chad Deering and Jennifer Wade provided assistance with sample collection in the field; Vinayak Prasad and Joshua Wallace assisted with sample preparation in the laboratory. Lina C. Patino contributed to this manuscript while serving at the National Science Foundation.

Conflicts of Interest

The authors declare no conflict of interest.

References

  1. Davidson, J.P.; Hora, J.M.; Garrison, J.M.; Dungan, M.A. Crustal forensics in arc magmas. J. Volcanol. Geotherm. Res. 2005, 140, 157–170. [Google Scholar] [CrossRef]
  2. Eichelberger, J.C. Vesiculation of mafic magma during replenishment of silicic magma reservoirs. Nature 1980, 288, 446–450. [Google Scholar] [CrossRef]
  3. Eichelberger, J.C.; Chertkoff, D.G.; Dreher, S.T.; Nye, C.J. Magmas in collision: Rethinking chemical zonation in silicic magmas. Geology 2000, 28, 603–606. [Google Scholar] [CrossRef]
  4. Murphy, M.D.; Sparks, R.S.J.; Barclay, J.; Carroll, M.R.; Lejeune, A.-M.; Brewer, T.S.; Macdonald, R.; Black, S.; Young, S. The role of magma mixing in triggering the current eruption at the Soufriere Hills volcano, Montserrat, West Indies. Geophys. Res. Lett. 1998, 25, 3433–3436. [Google Scholar] [CrossRef]
  5. Ruprecht, P.; Bachmann, O. Pre-eruptive reheating during magma mixing at Quizapu volcano and the implications for the explosiveness of silicic arc volcanoes. Geology 2010, 38, 919–922. [Google Scholar] [CrossRef]
  6. Sparks, S.R.J.; Sigurdsson, H. Magma mixing: A mechanism for triggering acid explosive eruptions. Nature 1977, 267, 315–318. [Google Scholar] [CrossRef]
  7. Wiebe, R.A. Rupture and inflation of a basic magma chamber by silicic liquid. Nature 1987, 326, 69–71. [Google Scholar] [CrossRef]
  8. D’Lemos, R.S. Mixing between granitic and dioritic crystal mushes, Guernsey, Channel Islands, UK. Lithos 1996, 38, 233–257. [Google Scholar] [CrossRef]
  9. De Silva, S.; Salas, G.; Schubring, S. Triggering explosive eruptions: The case for silicic magma recharge at Huaynaputina, southern Peru. Geology 2008, 36, 387–390. [Google Scholar] [CrossRef]
  10. Dungan, M.A. Open system magmatic evolution of the Taos Plateau volcanic field, northern New Mexico: II. The genesis of cryptic hybrids. J. Petrol. 1987, 28, 955–977. [Google Scholar] [CrossRef]
  11. Humphreys, M.C.S.; Blundy, J.D.; Sparks, R.S.J. Magma evolution and open-system processes at Shiveluch Volcano: Insights from phenocryst zoning. J. Petrol. 2006, 47, 2303–2334. [Google Scholar] [CrossRef]
  12. Ruprecht, P.; Wörner, G. Variable regimes in magma systems documented in plagioclase zoning patterns: El Misti stratovolcano and Andahua monogenetic cones. J. Volcanol. Geotherm. Res. 2007, 165, 142–162. [Google Scholar] [CrossRef]
  13. Browne, B.L.; Eichelberger, J.C.; Patino, L.C.; Vogel, T.A.; Uto, K.; Hoshizumi, H. Magma mingling as indicated by texture and Sr/Ba ratios of plagioclase phenocrysts from Unzen volcano, SW Japan. J. Volcanol. Geotherm. Res. 2006, 154, 103–116. [Google Scholar] [CrossRef]
  14. Davidson, J.P.; Tepley, F.J., III. Recharge in volcanic systems: Evidence from isotope profiles of phenocrysts. Science 1997, 275, 826–829. [Google Scholar] [CrossRef]
  15. Feeley, T.C.; Dungan, M.A. Compositional and dynamic controls on mafic-silicic magma interactions at continental arc volcanoes: Evidence from cordón el guadal, tatara-san pedro complex, Chile. J. Petrol. 1996, 37, 1547–1577. [Google Scholar] [CrossRef]
  16. Izbekov, P.E.; Eichelberger, J.C.; Patino, L.C.; Vogel, T.A.; Ivanov, B.V. Calcic cores of plagioclase phenocrysts in andesite from Karymsky volcano: Evidence for rapid introduction by basaltic replenishment. Geology 2002, 30, 799–802. [Google Scholar] [CrossRef]
  17. Barclay, J.; Herd, R.A.; Edwards, B.R.; Christopher, T.; Kiddle, E.J.; Plail, M.; Donovan, A. Caught in the act: Implications for the increasing abundance of mafic enclaves during the recent eruptive episodes of the Soufrière Hills Volcano, Montserrat. Geophys. Res. Lett. 2010, 37, L00E09:1–L00E09:5. [Google Scholar] [CrossRef]
  18. Tefend, K.S.; Vogel, T.A.; Flood, T.P.; Ehrlich, R. Identifying relationships among silicic magma batches by polytopic vector analysis: A study of the Topopah Spring and Pah Canyon ash-flow sheets of the southwest Nevada volcanic field. J. Volcanol. Geotherm. Res. 2007, 167, 198–211. [Google Scholar] [CrossRef]
  19. Vogel, T.A.; Hidalgo, P.J.; Patino, L.; Tefend, K.S.; Ehrlich, R. Evaluation of magma mixing and fractional crystallization using whole-rock chemical analyses: Polytopic vector analyses. Geochem. Geophys. Geosyst. 2008, 9. [Google Scholar] [CrossRef]
  20. Rogers, R.D.; Mann, P.; Emmet, P.A. Tectonic Terranes of the Chortis Block Based on an Integration of Regional Aeromagnetic and Geologic Data. In Geologic and Tectonic Development of the Caribbean Plate Boundary in Northern Central America; GSA Special Papers 428; Mann, P., Ed.; Geological Society of America: Boulder, CA, USA, 2007; pp. 65–88. [Google Scholar]
  21. MacKenzie, L.; Abers, G.A.; Fischer, K.M.; Syracuse, E.M.; Protti, J.M.; Gonzalez, V.; Strauch, W. Crustal structure along the southern Central American volcanic front. Geochem. Geophys. Geosyst. 2008, 9. [Google Scholar] [CrossRef]
  22. Linkimer, L.; Beck, S.L.; Schwartz, S.Y.; Zandt, G.; Levin, V. Nature of crustal terranes and the Moho in northern Costa Rica from receiver function analysis. Geochem. Geophys. Geosyst. 2010, 11. [Google Scholar] [CrossRef]
  23. Sinton, C.W.; Duncan, R.A.; Storey, M.; Lewis, J.; Estrada, J.J. An oceanic flood basalt province within the Caribbean plate. Earth Planet. Sci. Lett. 1998, 155, 221–235. [Google Scholar] [CrossRef]
  24. Marshall, J.S. The Geomorphology and Physiographic Provinces of Central America. In Central America: Geology, Resources and Hazards; Bundschuh, J., Alvarado, G.E., Eds.; Taylor and Francis: London, UK, 2007; pp. 1–51. [Google Scholar]
  25. Dengo, G. Tectonic-Igneous Sequence in Costa Rica. In Petrologic Studies: A Volume to Honor A.F. Buddington; Engel, A.E.J., James, H.L., Leonard, B.F., Eds.; Geological Society of America: Boulder, CA, USA, 1962; pp. 133–161. [Google Scholar]
  26. Kussmaul, S.; Tournon, J.; Alvarado, G.E. Evolution of the Neogene to Quaternary igneous rocks of Costa Rica. Profil 1994, 7, 97–123. [Google Scholar]
  27. Tournon, J. Magmatismes du Mesozoique a l’actuel en Amérique Central: L’example de Costa Rica, des ophiolites aux andesites; [in French]; Université Curie: Paris, France, 1984. [Google Scholar]
  28. Chiesa, S.; Civelli, G.; Gillot, P.-Y.; Mora, O.; Alvarado, G.E. Rocas piroclásticas asociadas con la Formación de la caldera Guayabo, cordillera de Guanacaste, Costa Rica. [in Spanish]. Rev. Geol. Am. Central 1992, 14, 59–75. [Google Scholar]
  29. Aguilar, T.; Alvarado, G.E. Tafonomía y sedimentología de la paleobiota estuarina en los Cerros Barbudal (Costa Rica) sepultada por vulcanismo neógeno. [in Spanish]. Rev. Geol. Am. Cent. 2004, 30, 111–116. [Google Scholar]
  30. Gillot, P.-Y.; Chiesa, S.; Alvarado, G.E. Chronostratigraphy of upper Miocene-Quaternary volcanism in northern Costa Rica. Rev. Geol. Am. Cent. 1994, 17, 45–53. [Google Scholar]
  31. Alvarado, G.E.; Kussmaul, S.; Chiesa, S.; Gillot, P.-Y.; Appel, H.; Wörner, G.; Rundle, C. Resumen cronoestratigráfico de las rocas ígneas de Costa Rica basado en dataciones radiométricas. [in Spanish]. J. S. Am. Earth Sci. 1992, 6, 151–168. [Google Scholar] [CrossRef]
  32. Alvarado, G.E.; Gans, P.B. Sintesis geochronologica del magmatismo, metamorfismo y metalogenia de Costa Rica, America Central. [in Spanish]. Rev. Geol. Am. Cent. 2012, 46, 7–122. [Google Scholar]
  33. Appel, H.; Wörner, G.; Alvarado-Induni, G.E.; Rundle, C.; Kussmaul-Ruf, S. Age relations in igneous rocks from Costa Rica. Profil 1994, 7, 63–69. [Google Scholar]
  34. Gans, P.B.; Alvarado-Induni, G.; Perez, W.; MacMillan, I.; Calvert, A. Neogene Evolution of the Costa Rican Arc and Development of the Cordillera Central; Geological Society of America: Boulder, CA, USA, 2003. [Google Scholar]
  35. Vogel, T.A.; Patino, L.C.; Alvarado, G.E.; Gans, P.B. Silicic ignimbrites within the Costa Rican volcanic front: Evidence for the formation of continental crust. Earth Planet. Sci. Lett. 2004, 226, 149–159. [Google Scholar] [CrossRef]
  36. Denyer, P.; Alvarado, G.E. Mapa Geológico de Costa Rica; [in Spanish]; Librería Francesa: San Jose, Costa Rica, 2007. [Google Scholar]
  37. Hayes, J.L.; Holbrook, W.S.; Lizarralde, D.; van Avendonk, H.J.A.; Bullock, A.D.; Mora, M.; Harder, S.; Alvarado, G.E.; Ramirez, C. Crustal structure across the Costa Rican Volcanic Arc. Geochem. Geophys. Geosyst. 2013, 14, 1087–1103. [Google Scholar]
  38. Sallarès, V.; Dañobieta, J.J.; Flueh, E.R. Lithospheric structure of the Costa Rican Isthmus: Effects of subduction zone magmatism on an oceanic plateau. J. Geophys. Res. Sol. Ea. 2001, 106, 621–643. [Google Scholar] [CrossRef]
  39. Vogel, T.A.; Patino, L.C.; Eaton, J.K.; Valley, J.K.; Rose, W.I.; Alvarado, G.E.; Viray, E.L. Origin of silicic magmas along the Central American volcanic front: Genetic relationship to mafic melts. J. Volcanol. Geotherm. Res. 2006, 156, 217–228. [Google Scholar] [CrossRef]
  40. Leat, P.T.; Smellie, J.L.; Millar, I.L.; Larter, R.D. Magmatism in the South Sandwich Arc. Geol. Soc. Lond. Spec. Publ. 2003, 219, 285–313. [Google Scholar] [CrossRef]
  41. Smith, I.E.M.; Worthington, T.J.; Stewart, R.B.; Price, R.C.; Gamble, J.A. Felsic volcanism in the Kermadec arc, SW Pacific: Crustal recycling in an oceanic setting. Geol. Soc. Lond. Spec. Publ. 2003, 219, 99–118. [Google Scholar] [CrossRef]
  42. Tamura, Y.; Tatsumi, Y. Remelting of an andesitic crust as a possible origin for rhyolitic magma in oceanic arcs: An example from the Izu-Bonin arc. J. Petrol. 2002, 43, 1029–1047. [Google Scholar] [CrossRef]
  43. Deering, C.D.; Vogel, T.A.; Patino, L.C.; Szymanski, D.W.; Alvarado, G.E. Magmatic processes that generate chemically distinct silicic magmas in NW Costa Rica and the evolution of juvenile continental crust in oceanic arcs. Contrib. Mineral. Petrol. 2012, 163, 259–275. [Google Scholar] [CrossRef]
  44. Criss, J.W. Fundamental-Parameters Calculations on a Laboratory Microcomputer. In Advances in X-Ray Analysis; Rhodes, J., Barret, C., Leyden, D., Newkirk, J., Predecki, P., Ruud, C., Eds.; Springer: Berlin, Germany, 1980; pp. 93–97. [Google Scholar]
  45. Zhang, Y.; Ni, H.; Chen, Y. Diffusion data in silicate melts. Rev. Mineral. Geochem. 2010, 72, 311–408. [Google Scholar] [CrossRef]
  46. Beard, J.S. Crystal-melt separation and the development of isotopic heterogeneities in hybrid magmas. J. Petrol. 2008, 49, 1027–1041. [Google Scholar] [CrossRef]
  47. Bacon, C.R.; Lowenstern, J.B. Late Pleistocene granodiorite source for recycled zircon and phenocrysts in rhyodacite lava at Crater Lake, Oregon. Earth Planet. Sci. Lett. 2005, 233, 277–293. [Google Scholar] [CrossRef]
  48. Langmuir, C.H.; Vocke, R.D., Jr; Hanson, G.N.; Hart, S.R. A general mixing equation with applications to Icelandic basalts. Earth Planet. Sci. Lett. 1978, 37, 380–392. [Google Scholar] [CrossRef]
  49. Parker, A. An index of weathering for silicate rocks. Geol. Mag. 1970, 107, 501–504. [Google Scholar] [CrossRef]
  50. Patino, L.C.; Velbel, M.A.; Price, J.R.; Wade, J.A. Trace element mobility during spheroidal weathering of basalts and andesites in Hawaii and Guatemala. Chem. Geol. 2003, 202, 343–364. [Google Scholar] [CrossRef]
  51. Ehrlich, R.; Full, W.E. Sorting out Geology, Unmixing Mixtures. In Use and Abuse of Statistical Methods in Earth Sciences; Size, W., Ed.; Oxford University Press: Oxford, UK, 1987; pp. 34–46. [Google Scholar]
  52. Full, W.E.; Ehrlich, R.; Klovan, J.E. EXTENDED QMODEL—Objective definition of external end members in the analysis of mixtures. Math. Geol. 1981, 13, 331–344. [Google Scholar] [CrossRef]
  53. Full, W.E.; Ehrlich, R.; Bezdek, J.C. FUZZY QMODEL—A new approach for linear unmixing. Math. Geol. 1982, 14, 259–270. [Google Scholar] [CrossRef]
  54. Ehrlich, R.; Wenning, R.J.; Johnson, G.; Su, S.H.; Paustenbach, D.J. A mixing model for polychlorinated dibenzo-p-dioxins and dibenzofurans in surface sediments from Newark Bay, New Jersey using polytopic vector analysis. Arch. Environ. Con. Tox. 1994, 27, 486–500. [Google Scholar]
  55. Huntley, S.L.; Carlson-Lynch, H.; Johnson, G.W.; Paustenbach, D.J.; Finley, B.L. Identification of historical PCDD/F sources in Newark Bay Estuary subsurface sediments using polytopic vector analysis and radioisotope dating techniques. Chemosphere 1998, 36, 1167–1185. [Google Scholar] [CrossRef]
  56. Wenning, R.J.; Erickson, G.A. Interpretation and analysis of complex environmental data using chemometric methods. TrAC Trend Anal. Chem. 1994, 13, 446–457. [Google Scholar] [CrossRef]
  57. Deering, C.D.; Cole, J.W.; Vogel, T.A. A rhyolite compositional continuum governed by lower crustal source conditions in the Taupo Volcanic Zone, New Zealand. J. Petrol. 2008, 49, 2245–2276. [Google Scholar] [CrossRef]
  58. Bryan, W.B.; Finger, L.; Chayes, F. Estimating proportions in petrographic mixing equations by least-squares approximation. Science 1969, 163, 926–927. [Google Scholar]
  59. Johnson, G.W.; Ehrlich, R.; Full, W.E. Principal Components Analysis and Receptor Models in Environmental Forensics. In An Introduction to Environmental Forensics; Murphy, B.L., Morrison, R.D., Eds.; Academic Press: San Diego, CA, USA, 2002; pp. 461–515. [Google Scholar]
  60. Miesch, A.T. Q-Mode Factor Analysis of Geochemical and Petrologic Data Matrices with Constant Row-Sums: An Extension of the Method of Q-Mode Factor (Vector) Analysis to Increase Its Usefulness in Geochemical and Petrologic Investigations; U.S. Government Printing Office: Washington, DC, USA, 1976. [Google Scholar]
  61. Kent, A.J.; Darr, C.; Koleszar, A.M.; Salisbury, M.J.; Cooper, K.M. Preferential eruption of andesitic magmas through recharge filtering. Nat. Geosci. 2010, 3, 631–636. [Google Scholar] [CrossRef]
  62. Ruprecht, P.; Bergantz, G.W.; Cooper, K.M.; Hildreth, W. The crustal magma storage system of Volcán Quizapu, Chile, and the effects of magma mixing on magma diversity. J. Petrol. 2012, 53, 801–840. [Google Scholar] [CrossRef]
  63. Davidson, J.P.; Arculus, R.J. The Significance of Phanerozoic Arc Magmatism in Generating Continental Crust. In Evolution and Differentiation of the Continental Crust; Brown, M., Rushmer, T., Eds.; Cambridge University Press: New York, NY, USA, 2006; pp. 135–172. [Google Scholar]
  64. Rudnick, R.; Gao, S. Composition of the Continental Crust. In Treatise on Geochemistry; Holland, H.D., Turekian, K.K., Eds.; Elsevier: Amsterdam, The Netherlands, 2003; Volume 3, pp. 1–64. [Google Scholar]
  65. Patino, L.C.; Carr, M.J.; Feigenson, M.D. Local and regional variations in Central American arc lavas controlled by variations in subducted sediment input. Contrib. Mineral. Petrol. 2000, 138, 265–283. [Google Scholar] [CrossRef]
  66. Szymanski, D.W. Magmatic Evolution of Ignimbrites in the Bagaces Formation, Guanacaste Province, Costa Rica; Michigan State University: Ann Arbor, MI, USA, 2007. [Google Scholar]
  67. Dufek, J.; Bachmann, O. Quantum magmatism: Magmatic compositional gaps generated by melt-crystal dynamics. Geology 2010, 38, 687–690. [Google Scholar] [CrossRef]

