

Soil–Structure Interactions in a Capped CBP Wall System Triggered by Localized Hydrogeological Drawdown in a Complex Geological Setting


1
School of Engineering & Built Environment, Griffith University, Nathan, QLD 4111, Australia
2
Faculty of Engineering, Computing and Science, Swinburne University of Technology, Sarawak Campus, Jalan Simpang Tiga, Kuching 93350, Sarawak, Malaysia
*
Author to whom correspondence should be addressed.
Geosciences 2023, 13(10), 304; https://doi.org/10.3390/geosciences13100304
Submission received: 13 July 2023
/
Revised: 28 September 2023
/
Accepted: 30 September 2023
/
Published: 11 October 2023
(This article belongs to the Special Issue Soil-Structure Interactions in Underground Construction)
Abstract
:Retaining walls are often used to construct basements and underground station boxes. This unique case study compares the field-measured contiguous bored pile (CBP) wall, surrounding geology, and hydrogeology or groundwater responses against the results using 2D and 3D numerical back analyses of a deep excavation project that experienced localized groundwater drawdown through the leaking ground anchor points. Site observations indicated that the ground anchor installation works had caused larger than expected through-the-wall leakages that subsequently triggered nearby ground and building settlements. In order to study the complex soil–structure interaction behavior, back analyses using a hybrid modeling technique of through-the-wall transient hydrogeological seepage and geomaterial stress-strain analyses was implemented. Through these soil-structure interaction back analyses, it was evidently revealed that the presence of the continuous capping beam was key in providing pile head restraints against the active earth pressures when the groundwater was depressed, as well as efficiently distributing the beneficial wall corner effects towards the middle CBP wall, leading to smaller bending moment magnitudes, characterized by their ‘S-shaped’ profiles. This behavior had been correctly diagnosed, as opposed to the ‘D-shaped’ bending moment profile usually only seen in a typical free-head cantilever wall in similar geology. The eventual results show that the wall and ground responses, i.e., deflection, bending moment, and settlement, were reasonably well predicted when compared against the instrumented field data, thus validating the reliability of the geotechnical modeling technique, key geological parameters, and hydrogeological fluctuations adopted in the 2D and 3D numerical models, as well as the beneficial contributions of the continuous capping beam, which tend to be overlooked during routine retaining wall design.
1. Introduction
Basement excavation is a popular construction choice in urban areas, owing to the lack of space for horizontal built-up. During the construction of deep excavation projects, adjacent structures may experience damages of varying degrees due to the stresses caused by hydrogeology or groundwater imbalance, soil movements, and construction activities. Over the years, many studies have examined soil–structure interactions in relation to excavations in various geological settings, such as in clayey soils [1,2,3,4,5,6] and sandy soils [7,8,9], using continuous, ‘impermeable’ secant pile wall and diaphragm wall systems modeled as structural plate elements, but very limited research and case studies have been documented on contiguous bored pile (CBP) wall systems to address complex CBP behaviors [10] such as through-the-wall (semi-permeable) hydrogeology seepages and the apparent effects of the capping beam at pile heads and wall corner.
There are three main issues related to the modeling of a CBP wall to reflect real-life situations. Firstly, the nature of a CBP wall is often not fully impermeable due to the presence of gaps in between the successive bored piles [10,11,12]. The popular assumption of modeling a CBP wall is to model it as a continuous plate element with smeared properties. This technique automatically makes the CBP wall impermeable, which is counter-intuitive. Secondly, if the CBP wall is indeed modeled as a continuous plate element in a 2D environment (due to ignorance), then the presence and effect of the capping beam on the bore pile heads will become negligible, which is also not the case in real-life [13]. The presence of the continuous capping beam in a CBP wall system is critical in forcing the individual pile heads to act in unison to better resist the active earth pressures through soil–structure interactions, especially during the first excavation stage [14,15,16], when the CBP wall deflects in a cantilever fashion in the surrounding geology. The capping beam also plays a pivotal role in increasing the stiffness of the weak out-of-plane CBP wall rigidity [17] to help resist the induced shear stresses along the supporting waler beams as a result of the transmission of earth pressures via the ground anchors and/or strutting system. Thirdly, if the contributions of the capping beam are not recognized (i.e., second assumption violated), then the corner effect will also be negated due to the absence of structural continuity, which is again counter-intuitive because the contributions of corner effects are well established [18,19,20], including in the case of a CBP wall [17].
Therefore, this paper aims to back-analyze the unique performance of a 10 m deep case study excavation process using a CBP wall system, whose surrounding hydrogeology or groundwater table was affected by the installation of ground anchors that subsequently triggered building and ground settlements adjacent to the excavation site.
In the process of evidencing soil–structure interactions of the CBP wall with the surrounding geology, capturing the three key behaviors discussed above (i.e., through-the-wall seepage including the leaking ground anchor points, effect of capping beam, and effect of excavation corner), geotechnical sensitivity analyses incorporating correct selection of key geological and hydrogeological parameters have been shown to be important in developing fundamental understanding of complex real-life case studies.
2. Project Overview and Subsoil Conditions
2.1. Site Description
Figure 1 shows the deep excavation project presented in this case study, which involves a 3-level basement for a shopping mall and hotel complex, situated in the heart of a city center and surrounded by century-old colonial era buildings, which were vulnerable to the effects of ground settlement and groundwater lowering that might be induced by the proposed excavation works. The site was divided into two main sections, that is, the main basement area, which was approximately 13,000 m2, and a 120 m sloping cut-and-cover tunnel. The basement was constructed using a bottom-up method. For the main basement, the retaining wall comprised 545 nos. of 700 mm diameter contiguous bored pile (CBP) walls with 750 mm center-to-center spacing, supported by two levels of temporary ground anchors spaced horizontally at 2.25 m and corner struts that comprised double steel H-sections. The CBP wall depth was approximately 14 m, while the average excavation depth was 10 m, allowing for 4 m embedment length. To plug the gaps between the successive bored piles, unreinforced cement grout columns (CGC) with 200 mm diameter were installed until the depth where hard strata were found. Figure 2 shows the details of the CBP wall and CGC arrangement. The groundwater table at the site was generally consistent, between 0.7 m and 1.0 m below the ground level, as the area was flat and adjacent to a main river about 50 m north.
2.2. Soil Conditions
The upper layer of the geology consisted of loose sand or soft-to-firm clayey silt, as shown in Figure 2, for the piles of interest, namely, CBPs 393, 424, 465, and 506. The standard penetration test (SPT) ‘N’, particle content, water content, plastic limit, and liquid limit are presented in Figure 3. The site was characterized by ‘N’ values ranging between 1 and 15 for the upper 5 m of soil layers. For the next 5 to 7 m, the ‘N’ value ranges from 15 to 50. High sand contents were observed in Figure 3, ranging from 60% to 90% for the first 6 m. Highly weathered metamorphic phyllite was found starting at depths of approximately 6 to 8 m below the existing ground level, with the occasional presence of metasandstone, enabling the bored piles to be consistently socketed into the phyllite bedrock.
2.3. Geotechnical Monitoring System and Construction Sequence
The site layout plan and the geotechnical monitoring instruments (i.e., in-pile inclinometers, building and ground settlement markers, and water standpipes) are shown Figure 1. The length of each inclinometer was about 20 m, providing an extension of 6 m beyond the pile toe to capture any potential toe movement [21]. In this case study, Wall E comprised CBP393 and CBP 424, while Wall F comprised CBP465 and CBP506.
The construction sequence for the main basement is summarized in Table 1. The first excavation depth was about 2 to 3 m from the ground level, which went until 0.5 m below the first level of the temporary ground anchors (GA1). The second stage of excavation, to 0.5 m below the second level of temporary ground anchors (GA2), was 3.5 m thick. The last stage of excavation, to the formation level, had a thickness of 3.1 m.
3. Site Observations
Other site observations and field results on the deep excavation implications in the highly variable Tuang Formation of Kuching city had also been discussed in detail in Chong and Ong [22], where the focus was to demonstrate the consistency of the field measured results.
3.1. Building and Ground Settlements
The main excavation works consisted of Stages 3 to 9. These activities were thought to have caused much of the ground and building settlements, particularly along Walls E and F, with the ground and building settlements ranging from 17.9 mm to 98.3 mm. Through site observations during the demolition work of some of the century-old buildings, it was evident that the buildings were supported on ‘floating’ timber piles measuring not more than 3 m long each. Such construction practice during the colonial era was common and had also been reported by Goh and Mair [23] in Singapore and Korff et al. [24] in the Netherlands.
The observed settlements were perhaps caused by the combination of [22] (i) some losses of soil particles that may have been washed out during the ground anchor installation using the rotary wash drilling method and (ii) the groundwater loss from the CBP wall ground anchor installation works before the grout of the anchor cured. During construction, care was taken to minimize these effects, where non-shrink concrete was used to increase the curing rate of the grout. Although the possibilities of having construction defects are present, failures associated with it are higher for excavation depths of more than 20 m [25]. The ground anchors were spaced at an interval of 2.25 m that corresponded to the cement grout column (CGC) locations. Therefore, the ground anchor installation process involved coring through the grout columns, thus effectively causing leakages in the CBP wall system. Wiggan et al. [10], Powrie et al. [11], and Clough and O’Rourke [26] all identified that through-the-wall seepage can be one of the main causes of adjacent ground settlements. Site observations revealed that, on the ground anchor installation works, the groundwater would immediately seep through the ground anchor holes, as evidenced from Figure 4, where the walls retained by the ground anchors showed distinct water stain marks beneath the ground anchor heads. In contrast, corner wall sections retained by the corner steel H-section struts were dry. The water stain marks were observed to occur at both GA1 and GA2 levels due to the existing high groundwater table.
3.2. Relationship between Maximum Wall Deflections and Maximum Settlements
Figure 5 presents the normalized relationship between maximum building and ground (vertical) settlement (δvm) with maximum (horizontal) wall deflection (δhm). In the present study, the maximum δvm/δhm ratios for building and ground were 14.8 (see Figure 5a) and 14.5 (Figure 5b), respectively. These values are significantly higher than a typical δvm/δhm ratio of between 0.5 and 1.0 [27] for a normal, typical excavation without groundwater leakages and through-the-wall seepage. However, this is not unreasonable for this particular case study where groundwater leakages occurred during the excavation works, because Zhang et al. [28] reported δvm/δhm ratio of 10 and ascribed the excessive ground surface settlements to significant groundwater drawdown due to their observed under-drainage phenomenon. Therefore, based on the data from the water standpipes, it can be safely inferred that the substantial settlements had been caused by the groundwater drawdown during the ground anchor installation process. This phenomenon is modeled in the next section using finite element analyses in order to provide a greater understanding on the ensuing complex soil–structure interactions.
4. Finite Element Analysis
4.1. Relationship between Maximum Wall Deflections and Maximum Settlements
A two-dimensional (2D) finite element (FE) analysis was conducted using PLAXIS 2D version 9.0 to simulate the excavation process for CBPs 393, 424, 465, and 506. A typical 2D FE model is shown in Figure 6. The boundary was set to seven times the excavation depth (H) [29] to help account for the possible groundwater drawdown. The dimensions of the FE model are 110 m × 30 m. A surcharge was added to the retained side to consider the bearing pressure imposed by the shophouses. Subsequently, the predicted building settlements are corrected using the pile-ground interaction technique [24]. Standard fixities were applied to the side and bottom boundaries of the models, allowing vertical movement at both ends while restricting horizontal movement. To model the constant hydraulic heads at both ends, a closed groundwater flow condition was adopted. The mesh for each model was automatically generated and consisted of approximately 1000 elements of 15-node triangular elements with about 8860 nodes.
The soil model chosen for the analysis was the linear elastic–perfectly plastic, commonly known as Mohr–Coulomb (MC), model due to the limited presence of clay. Furthermore, soil movements are very much dependent on soil stiffness instead of the soil model [11]. Any numerical model is always affected by model uncertainties [30]. The soil properties for both wall sections are summarized in Table 2. For soils with ‘N’ from 0–3, the soil modulus (E′) of 5217 kN/m2 was adopted, while the modulus for soils with ‘N’ > 3 were estimated using Equations (1) and (2) [31]. For the geologically complex phyllite layer of the Tuang Formation in Kuching city, E′ of 250,000 kN/m2 was used [22,32]. As an undisturbed mass block under confining pressure, phyllite exhibited high strength despite its rock quality designation being less than 25% upon coring and retrieval [32].
E = 2000 × ‘N’ (kN/m2)
E′ = E/1.15 (kN/m2)
Figure 7 shows a typical corner model consisting of walls E and F simulated using PLAXIS 3D version 2013.01. Similar to the 2D model, the 3D model boundary extended to 7H. Due to the large size of the basement, only half of the wall was simulated. The dimensions of the FE model were 110 m × 100 m × 30 m.
The Poisson’s ratio of 0.3 was adopted for all soil types. The effective cohesion of the soils (c′) and friction angle (ϕ′) were adopted based on the soil test reports [33,34]. To increase the numerical calculation stability in PLAXIS, a low cohesion value of c′ = 1 kPa was assigned to the sand layers. For phyllite, the c′ and ϕ′ were obtained from generalized tangential interpretation of direct shear tests on the same rock material [35,36,37,38,39,40]. The dilatancy angle (ψ″) for sand with ϕ′ > 30° [41] is shown in Equation (3):
ψ″ = ϕ′ − 30°
At the initial stage, the soil is considered to be under at-rest condition. The coefficient of lateral earth pressure for at-rest condition (K0) was determined [42] using Equation (4):
K0 = 1 − sin ϕ′
To analyze the groundwater lowering, permeabilities were required and the reliable values were adopted based on their hydrogeological seepage analyses and calibration process in similar geology [43].
4.2. Modeling the Equivalent CBP Wall
The CBP wall was modeled with plate elements. In a typical FEM program, the CBP wall properties are taken as a thin, long equivalent wall panel in which it is translated into the wall thickness. Since the CBP walls were made up of discrete piles, smearing of piles into equivalent thin sheets could approximate the essentially 3D problem into 2D plane strain condition [14,44,45]. The smearing technique enables the bored piles to have the same second moment of cross-sectional area, Ip, per meter run [11]. Figure 8 shows the method of smearing 3D piles to an equivalent 2D wall to enable the wall properties to be modeled in finite element analysis, with s = center-to-center pile spacing between two piles in the plane-strain direction, h = depth of the wall, and b = thickness of the wall.
The smeared axial stiffness (kN/m) and bending rigidity (kNm2/m) per meter run of the CBP wall can be calculated using Equations (5) and (6), respectively:
where n = number of piles in plane–strain direction, Ep = Young’s modulus of the pile, Ap = sectional area of the pile, Ip = second moment of inertia of the pile, and s = center-to-center pile spacing between two piles in the plane–strain direction. The properties of the smeared CBP wall are shown in Table 3.
The Young’s modulus (E) was calculated using the formula by American Concrete Institute [46], as per Equation (7):
where fc (MPa) is the standard compressive strength of the CBP wall.
4.3. Modeling the Equivalent Ground Anchor
The ground anchor consisted of free length and the fixed bonded length, with the details shown in Figure 9. The free length was simulated with node-to-node anchor while the bonded length was modeled as geogrid. The pre-stress force of the ground anchor was calculated per meter length of the wall from the working load of 660 T. The properties for the free length ground anchor are shown in Table 4, while the axial stiffness for geogrid was 2.20 × 10⁵ kN/m. Table 5 shows the properties of the grouted ground anchor with fixed length.
To simulate the interaction or sliding between the soil and the CBP wall due to ground disturbance, the interface element (Rinter) was incorporated. As suggested, Rinter = 0.5 was used [47].
4.4. Modeling the Fluctuating Groundwater Levels
Two-dimensional GeoStudio SEEP/W was used to conduct a series of transient analyses involving the groundwater responses due to the effect of the installation of the ground anchors. The transient flow analysis has two hydrogeological parameters: permeability (Table 2), k, and volumetric water content (VWC). The VWC was estimated from a data point function based on a set of built-in functions for different types of soils by specifying the saturated water content [48]. The models followed the construction sequence from Table 1. The edge of the model on the retained side was applied with a constant head of −0.7 m below the existing ground level. On the excavated side, a constant zero pressure was applied to the surface of the excavation, while, at the model edge, the groundwater level was maintained at the same level as the excavation. The CBP wall was modeled using boundary conditions to allow flow through the wall. The time elapsed in between each stage was modeled so the results would have the same timeline as the actual construction activities.
Due to the nature of a 2D analysis, the CBP wall and the gaps that were alternating with each other in the out-of-plane direction could only be assigned with one permeability value. Therefore, the concept of equivalent permeability, keq soil, was introduced to establish the permeability of stratified soil layers. The permeabilities for sand, silt, and phyllite were 1 × 10⁻⁴, 1 × 10⁻⁶, and 1 × 10⁻⁸ m/s, respectively. Subsequently, the equivalent flow through the wall, keq wall, was established for the 50 mm gaps, now represented by keq soil, and the bored piles which were represented by the permeability of concrete, kconcrete. The keq soil and keq wall can be determined from the general keq formula, expressed as per Equation (8):
where, k1, k2, …, kn = permeability of soil for different layers (m/s), and Hs1, Hs2, …, Hsn = thickness of soil for different layers (m).
Figure 10a,b shows the two methods of modeling the equivalent wall permeability situations, where the former considers the case of a ‘permeable wall’ with 50 mm gaps between successive bored piles towards the eastern corner of Wall F (without grout columns) while the latter considers the case of ‘impermeable wall’ but with leakage points at the ground anchor heads at Wall E and most parts of Wall F. It is evident from Figure 10a that the phreatic level at the Standpipe SP1 location compared really well with the field-measured groundwater level (shown with a red dot), thus reflecting the reliability of the hydrogeological parameters used. This observation was also consistent with the flowtank tests [10] that showed the groundwater table immediately behind the wall went from near vertical to near horizontal, when groundwater was allowed to be discharged via the equivalent permeable wall. Using this modeling technique, a good match was observed between the measured groundwater profiles (SP1 and SP2) and those predicted from SEEP/W over a period of more than 200 days, as evidently shown in Figure 11a,b, respectively. Figure 11a,b also shows that, upon excavation, the groundwater drawdown was immediate and remained close to the final excavation level when the construction of the skinwall was on-going after the excavation process. After the skinwall was finally constructed, it effectively cut off the groundwater flow through the wall, thus re-establishing the groundwater to its original level, as shown in Figure 11a,b.
Since the leakage only occurred at the anchor heads, it was modeled as a plane strain square point of 0.2 m × 0.2 m opening that was applied with keq wall through the use of unit flux hydraulic boundary condition, simulating the groundwater loss due to the ground anchor installation process. The remaining parts of the CBP wall were modeled as ‘impermeable’ by setting the unit flux to 0 m3/s. Figure 10b shows a sample model where the ground anchor heads had been applied with keq wall to simulate the effects of the ground anchor installation works on the wall permeability. The groundwater profiles generated for the different stages of excavation, as shown in Figure 12, were subsequently implemented in PLAXIS 2D and PLAXIS 3D (see Figure 13) for stress–strain analyses. The PLAXIS 2D and 3D software were not used in the analysis of groundwater flow due to its limitation, i.e., the retaining wall can only be modeled via a continuous structural plate element and is, thus, unable to simulate the effect of through-the-wall seepage or having an equivalent permeability [47].
4.5. Modeling the Excavation Sequence
Based on the construction sequence in Table 1, the modeling sequence and technique to simulate the groundwater drawdown behind the CBP wall will be discussed henceforth.
- Stage 1: The CBP wall installation was a ‘wish-in-place’ condition that assumed no changes in the geological stresses and hydrogeological pore water pressure surrounding the wall;
- Stage 2: In the real-life construction of a CBP wall, there was a need to introduce a continuous capping beam to tie the individual bored pile heads together. Therefore, an equivalent horizontal load was needed to be applied to the pile heads to simulate the restraining action. However, since there was no active pressure acting on the wall during the capping beam installation, the loading was not activated at this stage. In the 3D analysis, the wall was modeled as a continuous plate, hence the significance of the 3D restraining effect would have been automatically captured;
- Stage 3: The excavation process was modeled by deactivating the ‘excavated’ soil region. Since the soil pressures behind the wall acted as active pressures, the capping beam restraint was activated using a relevant restraining load, whose equivalent magnitude is discussed later;
- Stage 4: The node-to-node anchor and geogrid were activated. From the site observations, the installation of ground anchor had caused groundwater lowering. Therefore, the groundwater level behind the wall was deliberately drawn down through Z-water table method, in which the groundwater profiles from SEEP/W (see Figure 12) were re-produced in PLAXIS. Since the bored piles were socketed in phyllite with low permeability, the effect of groundwater flow through the wall toe can be disregarded [31,47]. This important finding ensures that the use of PLAXIS ‘z-water table’ method is validated;
- Stage 5: The pre-stress was activated and 293 kN/m was entered. If there was any adjustment to the groundwater table behind the wall, the Z-water table method described in Stage 4 would be repeated. The ground anchors were then activated at this stage and they were expected to play a more significant role than the capping beam [49];
- Stage 6: The second excavation of soil was removed by deactivating the soil region, and adjustment to the groundwater level, if any, was made; as described in Stage 4;
- Stage 7: GA2 was activated, similar to Stage 4;
- Stage 8: Pre-stress was activated, similar to Stage 5;
- Stage 9: The final excavation was simulated, similar to Stage 6.
4.6. Modeling the Individual Bored Pile and Continuous Capping Beam
The capping beam is an important consideration, especially during the cantilever stage of the excavation, as it provides the necessary restraint for the individual bored pile tops to act in unison. In the 2D analysis, the capping beam was simulated by applying a horizontal load at the top of the wall. Due to the capping beam thickness of 1.35 m, the modeling technique of how to represent the capping beam was tested by adopting either a ‘line load’ (kN per m length of the wall) or ‘point load’ (kN), as shown in Figure 14. The results from the modeled wall sections at various profile heights show good comparisons between the two techniques with R2 = 0.9817 (Figure 15). This means that both modeling methods were acceptable since they provided rather similar results in the 2D environment. For consistency, the line load technique was adopted so that the height of the capping beam could be properly modeled.
4.7. Modeling the Capping Beam Restraining Load
In the 2D analyses, parametric back-analyses were conducted to determine the effect of the capping beam as a horizontal restraint against the detrimental active soil pressures derived from the continuous CBP wall. A line load from 0 kN/m to 60 kN/m with 10 kN/m intervals were modeled at the top of the capped wall for each analysis, and all the excavation stages were then run. Figure 16 shows the outcomes of the FE geology-sensitive parametric analyses showing the analyzed capped wall responses as a function of the capping beam restraining loads. As evidence, and for illustration purposes, the predicted pile responses of only CBP465 (in 2D analysis) were used, as plotted in Figure 16. It is evidenced that, when no restraining capping beam load was applied in the analysis, the predicted pile top cantilever deflection was 16 mm, which grossly over-predicted the real-life capped CBP wall behavior (measured at only 2 mm, see Figure 16—Stage 3). This observation shows that the real-life capping beam had a positive restraining effect on the individually installed bored piles, i.e., the continuous capping beam tied the individually installed bored pile tops so that they were forced to act in unison, like a capped wall, to efficiently counter the detrimental active soil pressures. Further analysis shows that the correct active cantilever profile was observed to occur until 50 kN/m before producing a passive deflection profile at 60 kN/m, which informs that a capping load of 50 kN/m was limiting and, hence, this value was subsequently used in all the 2D analyses in Stages 3, 6, and 9.
5. Results and Discussion
5.1. Measured vs. Predicted Responses of CBPs 343, 424, 465, and 506
5.1.1. Measured and Predicted Deflection Profiles
Figure 17a–d shows the measured as well as the 2D- and 3D-predicted horizontal pile deflection and the bending moment profiles at Stages 3 (excavation—unpropped), 6 (excavation—after installation of GA1), and 9 (deepest excavation—after installation of GA2) of CBPs 343, 424, 465, and 506, respectively. It is clear that, at Stage 3, in an ‘unpropped’ wall situation, all the CBPs deflect forward in a somewhat ‘cantilever’ fashion [16], where the largest deflections are between 2 mm and 4 mm, as recorded at the tops of the piles. This phenomenon is very interesting because the CBP wall is not strictly a cantilever wall due to the physical presence of the capping beam running in-plane with the CBP wall alignment. The 1.35 m thick capping beam ties the consecutive, individual bored pile heads together to form a contiguous bored pile wall (CBP) system, thus introducing a restraining line load (as discussed in the preceding section) to the individual bored piles. Even though the restraining effect of the capping beam is not obvious in the deflection profile, it is evidenced in the subsequent discussion to show its greater impact on the corresponding bending moment profile instead.
At Stage 6, after GA1 was successfully installed and pre-stressed, CBPs 393, 424, 465, and 506 were ‘pulled back’ towards the retained ground, where the deflection profile rebounded to near-zero or slightly negative throughout its length, signifying the effectiveness of the pre-stress loads in mitigating detrimental lateral deflections induced by the active lateral pressures [47]. At Stage 9, when the deepest excavation took place, all the CBPs responded by developing obvious ‘pregnant woman’ deflection profiles, which was intuitively correct at this stage of excavation. Maximum deflections of between 3 mm and 5 mm were recorded at depths of about 6.5 m from the respective pile tops.
The predicted deflection profiles of the CBPs at Stages 3 and 6, respectively, are rather consistent to their measured profiles, with the exception of Stage 9 for CBPs 393 and 424, where the measured pile top deflections are somewhat in between the 2D and 3D predictions. Nonetheless, the discrepancies are small enough not to raise any further concern.
5.1.2. Measured and Predicted Bending Moment Profiles
The corresponding measured pile bending moment profiles for CBPs 343, 424, 465, and 506 can be obtained by performing double-differentiation on the respective deflection profiles to yield their respective curvature profiles [16]. If the respective curvature profile is divided by the known pile bending rigidity (EI) value, then bending moment is obtained [14,16]. It can be seen from Figure 17a–d that the predicted bending moment profiles from the 2D and 3D analyses are rather similar in shape and profiles to their corresponding calculated counterparts obtained via the measured pile deflection profiles. Similarly, as the calculated bending moment magnitudes were derived from the measured pile deflection profiles as discussed above, any variations in the pile deflection profiles would be correspondingly reflected in the subsequent pile bending moment profiles [14,16]; hence, consistent discrepancies were observed between both the measured and predicted magnitudes for all Stages 3, 6, and 9. Nonetheless, the observed small discrepancies in magnitude are insignificant to raise any further concerns. It is more important that the pile response profiles or shapes are correctly predicted in order to articulate the more complex pile–soil interaction behaviors [14,49], which are discussed next.
5.1.3. Key Observable Soil–Structure Interaction Behaviors
Firstly, it is well established that, if the retaining wall behaves in pure cantilever fashion, the deflection profile would register the largest magnitude at the pile top and its corresponding bending moment profile must be ‘D-shaped’, i.e., the largest bending moment magnitude is normally somewhere at the mid-depth of the wall [14,50,51]. However, close observation shows that, at Stage 3 (see Figure 17a–d), the measured deflection profiles look like a ‘cantilever’ behavior, but, once this profile is double-differentiated to obtain the corresponding measured bending moment profile, it is evident that the bending moment profile produced is not ‘D-shaped’, but instead is a wiggly ‘S-shaped’ profile, indicating the effect of a restraint somewhere along the pile [16,51]. At Stage 3, the only restraint present has to be from the capping beam. This very important observation confirms the necessary modeling technique of using an equivalent capping beam load in a 2D modeling environment, as discussed earlier. The ‘S-shaped’ measured and predicted bending moment profiles in Stage 3 for all the CBPs clearly demonstrate that the capping beam plays a critical role in providing the necessary restraint, whilst moderating the load-transfer and load-sharing mechanism [16,51] amongst the individual bored piles to act in unison against the mobilized active earth pressures during the excavation process and the hydrogeology that has been drawn down during the ground anchor installation. For the 3D analyses, the significance of the corner effect was automatically captured. From the 3D predicted pile responses (see Figure 17), the corner effects seemed to be significant enough to yield S-shaped bending moment profiles, thus again validating the 2D analyses requiring the line load to be modeled to represent the capping beam effect.
Secondly, it has also been established that the maximum positive bending moment in any ‘S-shaped’ bending moment profile derived from a restrained pile, is located at or below the current excavation level [16,51]. As evidenced in Figure 17a–d for all the CBPs, this observation holds true for most excavations at Stages 3, 6, and 9, except for CBP393 Stages 6 and 9. In this case, it is suspected that either the ground anchors at CBP393 were installed higher than the other GAs or that the capping team at this location was cast much thicker than normal. Note the corresponding CBP393 deflection profiles at Stages 6 and 9, which tend to also show that the maximum deflections occur at higher elevations.
Thirdly, the development of negative bending moment in an ‘S-shaped’ bending moment profile is associated with the presence of effective physical restraints along the depth of the pile [14,47], be it the capping beam, struts, or ground anchors. For example, the effective restraint causing negative bending moment [16,51] at Stage 3 (see Figure 17a–d) is due to the presence of the capping beam. Similarly, the effective restraints causing negative bending moments in the ‘S-shaped’ bending moment profiles [16,51] at Stages 6 and 9 are due to presence of GAs 1 and 2, respectively. It must also be mentioned that, in the case of a multi-level propped wall, the development of the maximum negative bending moment is normally nearer to the last propped level [14].
5.1.4. Summary on Measured and Predicted Pile Deflections and Bending Moment Profiles
It is very interesting to note that the pile responses obtained from both the geology-sensitive 2D and 3D analyses have been well-predicted when benchmarked against the measured profiles. These consistent results further validate and reinforce the correctness of the 2D modeling techniques adopted herein, so that the easier and less time-consuming 2D analysis could still be preserved and reliably adopted as long as proper modeling techniques and correct calculation of pile properties (e.g., smearing effect) were executed.
5.2. Measured vs. Predicted Responses of Ground Markers (GM) and Building Markers (BM) in the Vicinity of CBPs 393, 424, 465, and 506
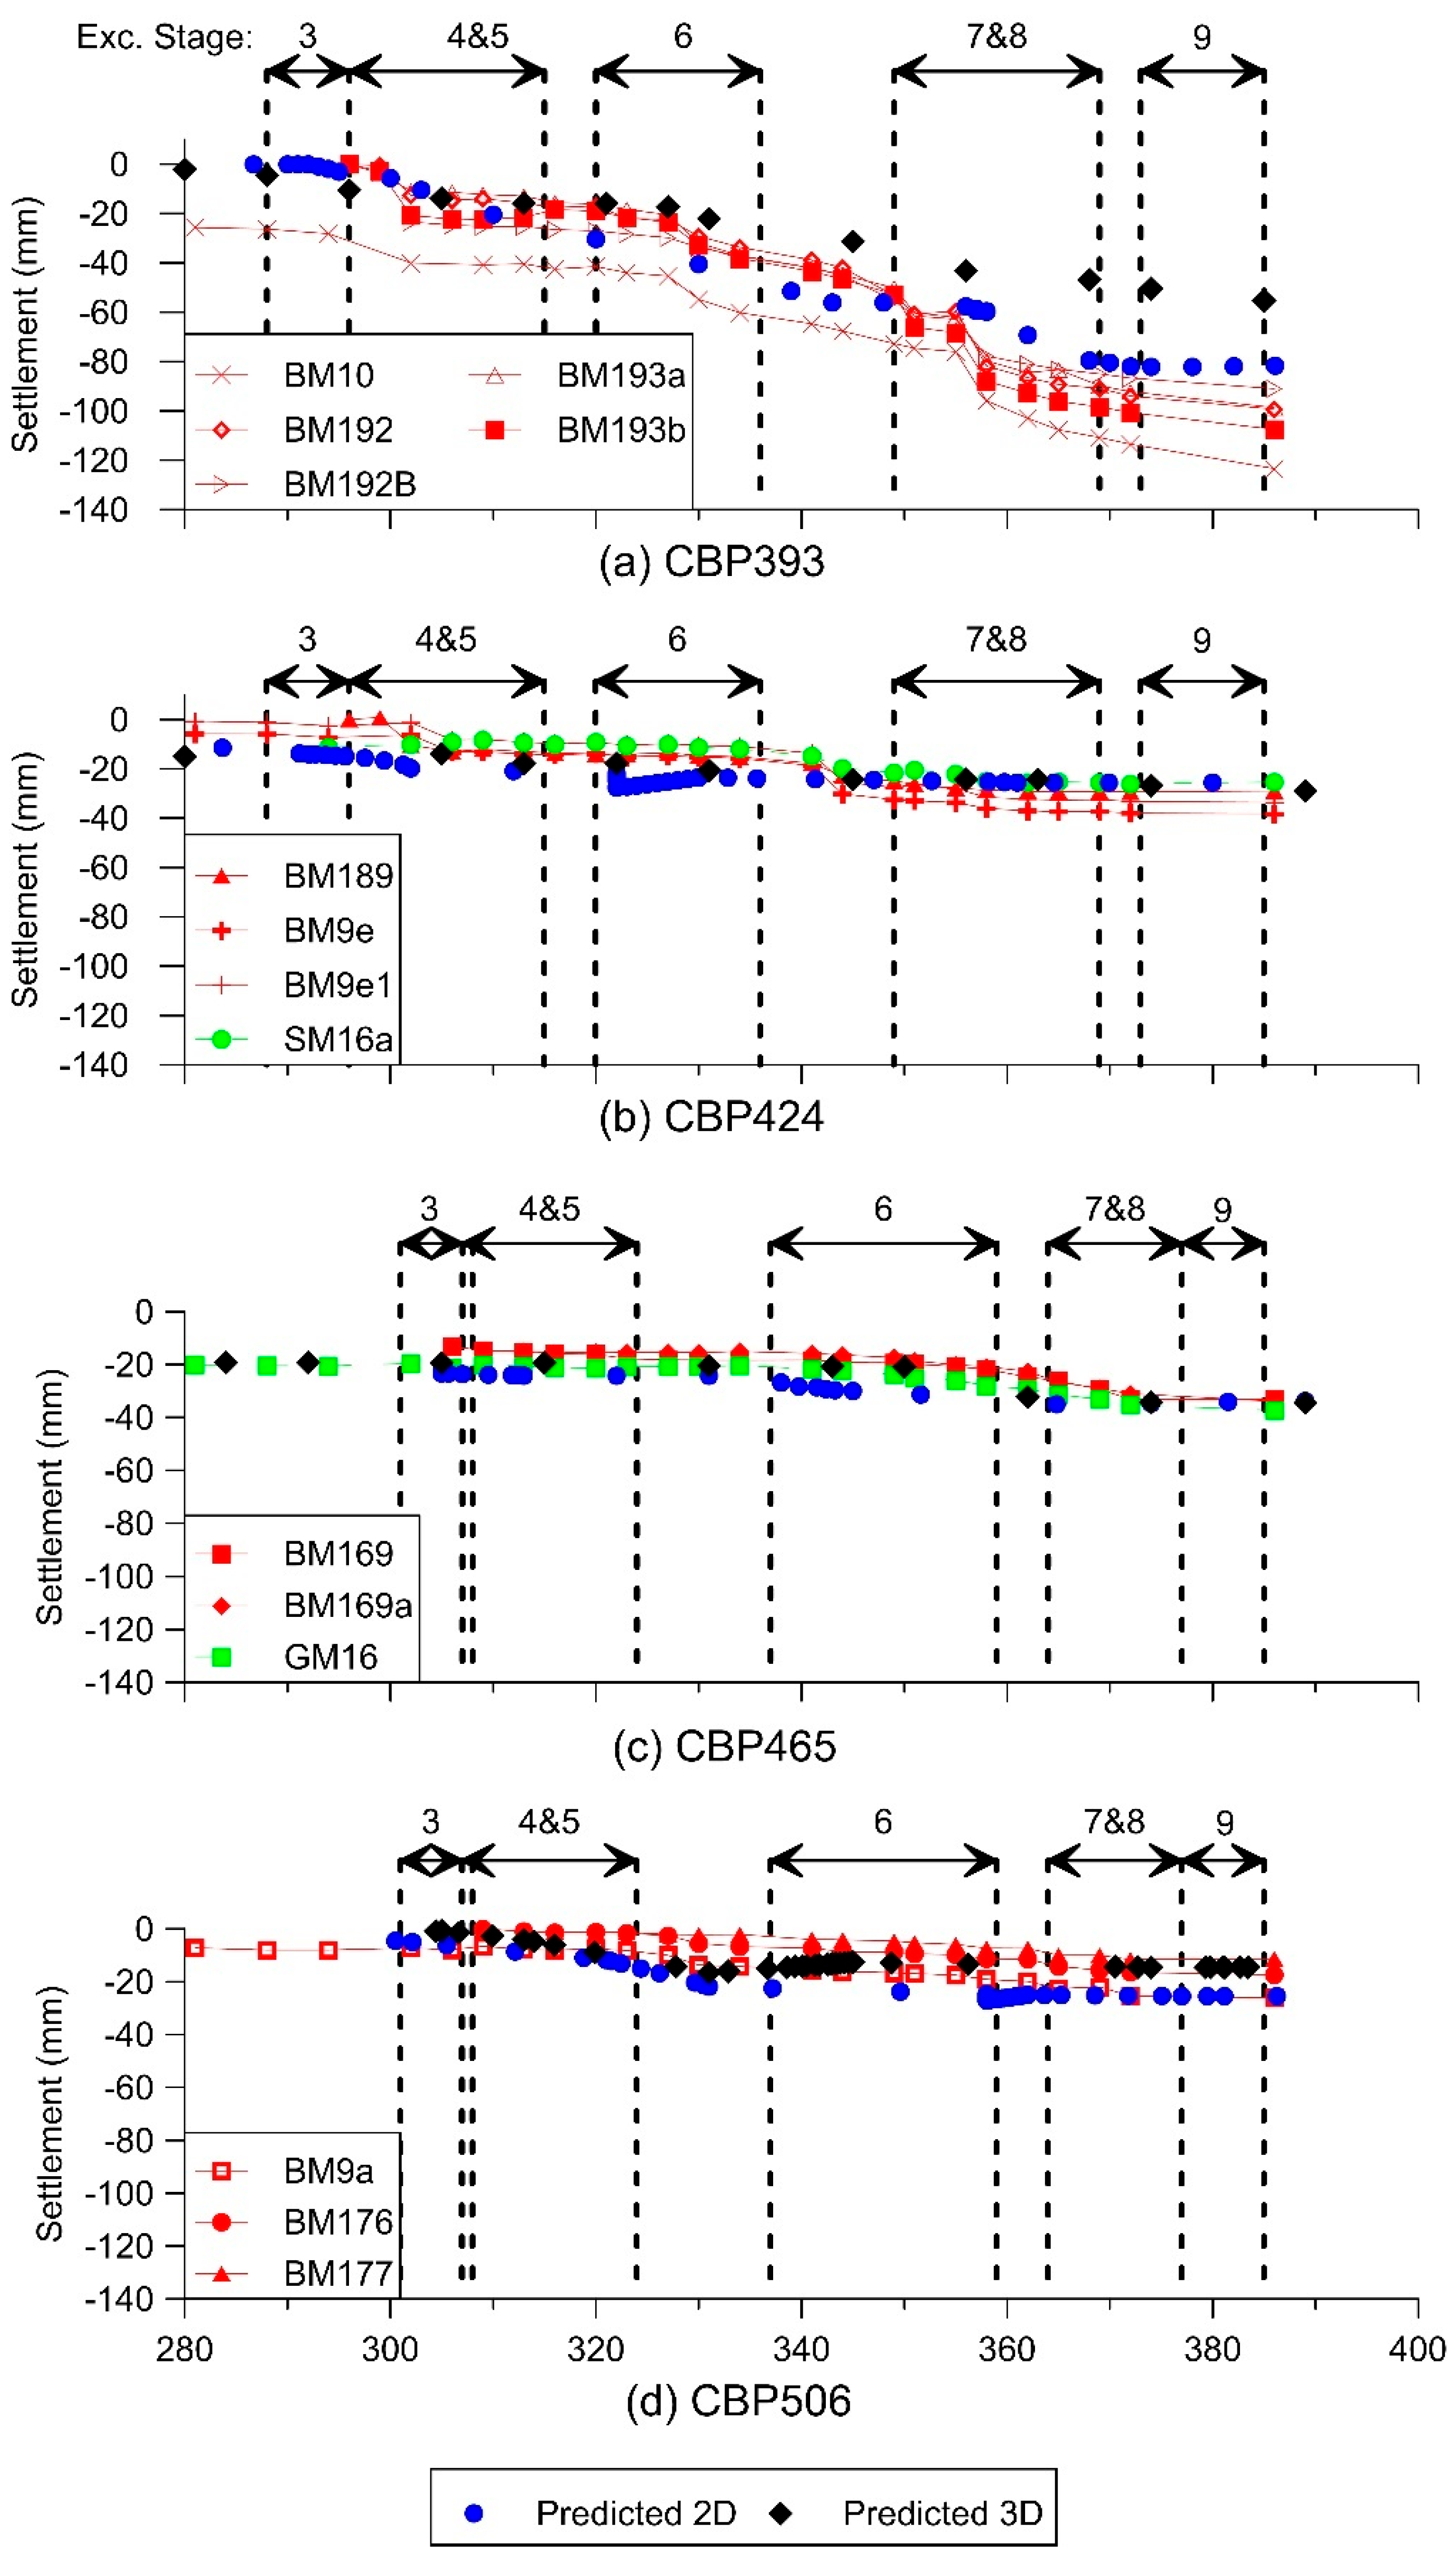
The 2-storey colonial-era masonry and timber buildings are at least 100 years old. They were supported on tapered, mangrove timber piles, estimated to be between 3.0 m and 3.5 m in length [22], embedded within the soft clayey silt (near CBPs 424 and 465) and loose sand (near CBPs 393 and 506), with top and bottom diameters of approximately 100 mm and 70 mm, respectively. The working load capacity of a single timber pile was estimated to be about 10 kN, as per common local design method in the region. Figure 1 shows the locations of the building markers (BM) and ground markers (GM) behind CBPs 393 and 424 of Wall E, as well as CBPs 465 and 506 of Wall F. Figure 18a–d shows the measured and predicted building and ground settlement profiles behind CBPs 393, 424, 465, and 506, respectively, over the course of the construction process.
5.2.1. CBPs 424 and 465: Ground Markers (GM) and Building Markers (BM)
In the vicinity of CBP424 (see Figure 18b) and CBP465 (see Figure 18c), the measured settlements from both the ground markers (GM) and building markers (BM) showed that the ground and buildings were settling at almost the same rate and magnitudes when the groundwater table was drawn down due to the effects of the ground installation process, as described earlier. The lowering of the groundwater table behind CBPs 424 and 465 inevitably triggered the consolidation process of the upper geology, comprising a soft clayey silt layer (see Figure 2) which supported the buildings. As the timber piles were floating within the upper soft clayey silt layer, it is not surprising to see that the buildings settled in unison with the supporting ground, as evidenced in Figure 5. This phenomenon and observation were also described in [22] on the same project, where the authors explicitly stated that the consolidation settlements of the surrounding ground and buildings during the bored pile installation process were 24% and 25%, respectively, but during the main excavation stages, these values increased to 32% and 36%, respectively, of the total settlements recorded over the entire construction stages.
In the case studies by Korff et al. [24], consolidation settlements of their 100-year-old historical masonry buildings with timber foundations occurred at a nearby metro excavation in Amsterdam. They postulated that, if a friction pile length was totally embedded within the entire depth of the consolidating soft clayey silt layer, the development of the neutral axis should come close to the ‘interaction level’ of zero, i.e., pile settlement is equal to the surface settlement, thus reinforcing the observations made for this case study. As shown in Figure 18b,c, the predicted consolidation settlement profiles at 2 m behind CBPs 424 and 465 agreed reasonably well with the measured GM and BM settlement profiles, thus validating the geological parameters and modeling techniques used.
5.2.2. CBPs 393 and 506: Ground Markers (GM) and Building Markers (BM)
In the vicinity of CBP506 (see Figure 18d), the measured building settlements were much smaller in magnitude than those recorded for CBP424 and CBP465. This was due to the fact that CBP506 was surrounded by loose sand with relatively better strength and settlement properties than the soft clayey silts found surrounding CBP424 and CBP465. Furthermore, the overall measured building settlement profiles over time showed only the effects of immediate settlement (without the effect of consolidation settlement), thus further verifying the reliability of the field-measured readings and the sandy nature of the ground. As the timber piles supporting the masonry buildings near CBP506 were embedded in the loose sand layer with estimated mobilized working load of 67% of the ultimate pile capacity (or safety factor of 100/67 ≈ 1.5), as per common design methods consistent with Goh and Mair [23] in Singapore and Korff et al. [24] in the Netherlands, the corresponding ‘interaction level’ should range between 0.5 and 0.6 [24]. As such, when the predicted free-field ground settlements for CBP506 were multiplied by the average pile mobilized ‘interaction level’ factor of 0.55 [24], the outcomes—shown in Figure 18d—matched the measured profiles reasonably well, thus validating the geological parameters and modeling technique adopted.
CBP393 was surrounded by very loose sand at the top 3 m (see Figure 2). Figure 18a shows that the predicted ground settlements are significantly lesser (on average, about 70 mm), as opposed to what was actually measured by the corresponding building settlement markers (about 120 mm). Close observation shows that the predicted ground settlement for CBP393 and CBP506 demonstrate similar settlement trends but contrast in magnitude. The underlying soil profiles of CBP393 were quite similar to those at the CBP506 location and, hence, it was suspicious that the measured larger building settlements of up to 120 mm were only experienced by CBP393 and not the other CBPs. This observation could then be used to explain the possible loss of sand via piping effect through the drilled hole during the wash boring process for ground anchor installation at CBP393, consistent with some workers’ claims that they had observed washed-out materials on the excavation floor during that construction stage [22]. Additionally, the relatively larger induced pile deflections and bending moments in CBP393 (see Figure 17c) as compared to others also seem to suggest the detrimental impact of the ground loss phenomenon [22].
5.3. Cross-Verification of 2D and 3D Analyses against Measured Field Data
The results of the 2D and 3D numerical analyses presented herein serve to cross-check each other’s accuracy in comparison to the field-measured soil–structure interactions. It is obvious from the verification process that correct modeling techniques, well-characterized geomaterial properties, and in-depth understanding of complex soil–structure interaction behaviors have been adopted and, thus, highlight their utmost importance in explaining the complex hydrogeology and ground responses when the CBP walls were subjected to real-life through-the-wall seepages induced during anchor installation. Future work could include parametric analysis or scenario analysis to obtain data that could not be measured at site to further understand the excavation behavior.
6. Conclusions
This paper presents the numerical back-analysis of localized hydrogeology or groundwater drawdown of a deep excavation project during ground anchor installation. Based on the well-documented field data, 2D and 3D finite element modeling techniques were developed to model the geological or ground and groundwater responses, considering the beneficial effect of the restraining capping beam so that the complex soil–structure behaviors could be back analyzed to develop greater understanding. The benefits of the capping beam have been evidently proven in the back analysis, thus demonstrating to engineers that its effect should be considered in routine analysis in order to reduce design conservatism and for sustainability of construction materials. The following conclusions were drawn based on the results and observations in this case study:
- (a)
- Groundwater drawdown due to leakage through the CBP walls had a considerable impact on the extent of wall deflections (small) and ground settlement (large). The ratio of δvm/δhm for building and ground were measured to be 14.8 and 14.5, respectively, considerably higher than typical δvm/δhm ratio of between 0.5 and 1.0 in a typical deep excavation project without through-the-wall seepage. This real-life observation has been successfully modeled using 2D and 3D finite element analyses, and the main causes have been attributed to the ground anchor installation process that had caused (i) groundwater loss and (ii) possible loss of soil particles (observed in CBP393 only);
- (b)
- The concept of equivalent wall permeability was successfully implemented to represent the through-the-wall hydrogeological seepage happening in real life. In this case, two modeling methods were used, namely, (i) flow-through ‘permeable wall’ mimicking gaps between successive bored piles and (ii) ‘impermeable wall’ but with leakage points at the locations of the ground anchor heads;
- (c)
- Transient or time-dependent seepage analyses have been adopted to successfully verify the applicability of the conventional “Z-water table” method based on the understanding that the piles were socketed in the low-permeability geology, typically the phyllite rock mass. The predicted groundwater and ground responses that reasonably matched the measured profiles effectively verified this modeling technique;
- (d)
- The presence of the capping beam effectively tied all the pile heads together and forced them to act in unison to resist the active lateral earth pressures from the retained side of the excavation. Through finite element back analyses and field measurements, the 1.5 m thick continuous capping beam was found to exert a representative, back-analyzed restraining line load of 50 kN/m. This implies that the capping beam is beneficial in resisting the induced CBP deflections and the induced ground settlement due to through-the-wall seepage;
- (e)
- The complex soil–structure interactions observed in this case study does not only stop at the wall deflection–ground settlement relationship, but also directly influencing the ground settlement–foundation settlement relationship in the challenging geological setting. In the unique case of CBP393, where the field-measured ground and building settlements were overly large despite being embedded in relatively competent sandy/silty ground (N = 4), the belief that localized liquefaction occurred during wash boring for ground anchor installation became more real, especially with the workers’ claim that locally washed-out materials were evident at that very location.
The real-life CBP wall responses (i.e., deflection, bending moment, and ground settlement) were evidently demonstrated to be influenced by the surrounding geology and hydrogeological behaviors. The wall responses were reasonably well predicted when compared against the instrumented field data, thus validating the reliability of the geotechnical modelling technique, key geological parameters, and hydrogeological fluctuations adopted in the 2D and 3D numerical models. These important findings help geotechnical engineers better understand the complex soil–structure interaction behavior, thus creating awareness of the beneficial contributions of the continuous capping beam, which tend to be overlooked during routine retaining wall design.
Author Contributions
Conceptualization, E.E.M.C. and D.E.L.O.; methodology, E.E.M.C.; software, D.E.L.O.; validation, D.E.L.O. and E.E.M.C.; formal analysis, E.E.M.C.; investigation, E.E.M.C.; resources, D.E.L.O.; writing—original draft preparation, E.E.M.C.; writing—review and editing, D.E.L.O.; supervision, D.E.L.O.; funding acquisition, D.E.L.O. All authors have read and agreed to the published version of the manuscript.
Funding
This research was funded by Rakyat Elite Sdn. Bhd. 2-5116.
Data Availability Statement
The data that support the findings of this study are available from the second author, E.E.M. Chong, upon reasonable request.
Acknowledgments
The authors wish to express their gratitude to Bina Puri Construction Sdn. Bhd. and KTA (Sarawak) Sdn. Bhd. for their assistance in the collection of field data and other information.
Conflicts of Interest
The authors declare no conflict of interest. The funder had no role in the design of the study; in the collection, analyses, or interpretation of data; in the writing of the manuscript; or in the decision to publish the results.
References
- Finno, R.; Blackburn, J.; Roboski, J. Three-dimensional effects for supported excavations in clay. J. Geotech. Geoenviron. Eng. 2007, 133, 30–36. [Google Scholar] [CrossRef]
- Hashash, Y.M.A.; Whittle, A.J. Ground movement prediction for deep excavations in soft clay. J. Geotech. Eng. 1996, 122, 474–486. [Google Scholar] [CrossRef]
- Hsiung, B.-C.B.; Yang, K.-H.; Aila, W.; Ge, L. Three-dimensional effects of a deep excavation on wall defections in central Jakarta. Tunn. Undergr. Space Technol. 2018, 72, 84–96. [Google Scholar] [CrossRef]
- Ong, D.E.L.; Leung, C.; Chow, K. Time-dependent Pile Behavior Due to Excavation-Induced Soil Movement in Clay. In Proceedings of the 12th Pan-American Conference on Soil Mechanics and Geotechnical Engineering, Massachusetts Institute of Technology, Boston, MA, USA, 22–26 June 2003. [Google Scholar]
- Ong, D.E.L.; Leung, C.F.; Chow, Y.K. Piles subject to excavation-induced soil movement in clay. In Proceedings of the 13th European Conference on Soil Mechanics and Geotechical Engineering, Prague, Czech Republic, 25–28 August 2003; pp. 777–782. [Google Scholar]
- Ou, C.-Y.; Hsieh, P.-G.; Lin, Y.-L. A parametric study of wall deflections in deep excavations with the installation of cross walls. Comput. Geotech. 2013, 50, 55–65. [Google Scholar] [CrossRef]
- Hsiung, B.-C.B.; Yang, K.-H.; Aila, W.; Hung, C. Three-dimensional effects of a deep excavation on wall deflections in loose to medium dense sands. Comput. Geotech. 2016, 80, 138–151. [Google Scholar] [CrossRef]
- Nikolinakou, M.A.; Whittle, A.J.; Savidis, S.; Schran, U. Prediction and Interpretation of the Performance of a Deep Excavation in Berlin Sand. J. Geotech. Geoenviron. Eng. 2011, 137, 1047–1061. [Google Scholar] [CrossRef]
- Russo, G.; Nicotera, M.V.; Autuori, S. Three-Dimensional Performance of a Deep Excavation in Sand. J. Geotech. Geoenviron. Eng. 2019, 145, 05019001. [Google Scholar] [CrossRef]
- Richards, D.J.; Wiggan, C.A.; Powrie, W. Seepage and pore pressures around contiguous pile retaining walls. Géotechnique 2016, 66, 523–532. [Google Scholar] [CrossRef]
- Powrie, W.; Chandler, R.J.; Carder, D.R.; Watson, G.V.R. Back-analysis of an embedded retaining wall with a stabilizing base slab. Proc. Inst. Civ. Eng.-Geotech. Eng. 1999, 137, 75–86. [Google Scholar] [CrossRef]
- Richards, D.J.; Powrie, W.; Roscoe, H.; Clark, J. Pore water pressure and horizontal stress changes measured during construction of a contiguous bored pile multi-propped retaining wall in Lower Cretaceous clays. Géotechnique 2007, 57, 197–205. [Google Scholar] [CrossRef]
- Ho, A.; Wright, M.; Ng, S. Deep Excavation in Hong Kong–Cantilever Bored Pile Wall Design Using CIRIA Report No. C580. In Proceedings of the 18th International Conference on Soil Mechanics and Geotechnical Engineering, Paris, France, 2–6 September 2013; pp. 1813–1817. [Google Scholar]
- Ong, D.E.; Leung, C.E.; Chow, Y.K. Pile Behavior due to Excavation-Induced Soil Movement in Clay. I: Stable Wall. J. Geotech. Geoenviron. Eng. 2006, 132, 36–44. [Google Scholar] [CrossRef]
- Ong, D.E.L. Pile Behaviour Subject to Excavation-Induced Soil Movement in Clay. Ph.D. Thesis, National University of Singapore, Singapore, 2004. [Google Scholar]
- Ong, D.E.L.; Leung, C.F.; Chow, Y.K.; Ng, T.G. Severe Damage of a Pile Group due to Slope Failure. J. Geotech. Geoenviron. Eng. 2015, 141, 04015014. [Google Scholar] [CrossRef]
- Zdravkovic, L.; Potts, D.M.; St. John, H.D. Modelling of a 3D excavation in finite element analysis. Géotechnique 2005, 55, 497–513. [Google Scholar] [CrossRef]
- Lee, F.H.; Hong, S.H.; Gu, Q.; Zhao, P. Application of Large Three-Dimensional Finite-Element Analyses to Practical Problems. Int. J. Geomech. 2010, 11, 529–539. [Google Scholar] [CrossRef]
- Lee, F.H.; Yong, K.Y.; Quan, K.C.N.; Chee, K.T. Effect of Corners in Strutted Excavations: Field Monitoring and Case Histories. J. Geotech. Geoenviron. Eng. 1998, 124, 339–349. [Google Scholar] [CrossRef]
- Ou, C.-Y.; Lai, C.-H. Finite-element analysis of deep excavation in layered sandy and clayey soil deposits. Can. Geotech. J. 1994, 31, 204–214. [Google Scholar] [CrossRef]
- Hwang, R.; Moh, Z.-C.; Wang, C.H. Toe movements of diaphragm walls and correction of inclinometer readings. J. GeoEng. 2007, 2, 61–71. [Google Scholar] [CrossRef]
- Chong, E.E.-M.; Ong, D.E.-L. Data-Driven Field Observational Method of a Contiguous Bored Pile Wall System Affected by Accidental Groundwater Drawdown. Geosciences 2020, 10, 268. [Google Scholar] [CrossRef]
- Goh, K.H.; Mair, R.J. The horizontal response of framed buildings on individual footings to excavation-induced movements. In Geotechnical Aspects of Underground Construction in Soft Ground; CRC Press: Boca Raton, FL, USA, 2012; pp. 895–902. [Google Scholar] [CrossRef]
- Korff, M.; Mair, R.; Van Tol, F. Pile-Soil Interaction and Settlement Effects Induced by Deep Excavations. J. Geotech. Geoenviron. Eng. 2016, 142, 04016034. [Google Scholar] [CrossRef]
- Castaldo, P.; Jalayer, F.; Palazzo, B. Probabilistic assessment of groundwater leakage in diaphragm wall joints for deep excavations. Tunn. Undergr. Space 2018, 71, 531–543. [Google Scholar] [CrossRef]
- Clough, G.W.; O’Rourke, T.D. Construction Induced Movements of In-situ Walls. In Proceedings of the Conference Proceedings of Design and Performance of Earth Retaining Structures, New York, NY, USA, 18–21 June 1990; pp. 439–470. [Google Scholar]
- Ou, C.-Y.; Hsieh, P.-G.; Chiou, D.-C. Characteristics of ground surface settlement during excavation. Can. Geotech. J. 1993, 30, 758–767. [Google Scholar] [CrossRef]
- Zhang, W.; Wang, W.; Zhou, D.; Zhang, R.; Goh, A.T.C.; Hou, Z. Influence of groundwater drawdown on excavation responses–A case history in Bukit Timah granitic residual soils. J. Rock Mech. Geotech. Eng. 2018, 10, 856–864. [Google Scholar] [CrossRef]
- Khoiri, M.; Ou, C.-Y. Evaluation of deformation parameter for deep excavation in sand through case histories. Comput. Geotech. 2013, 47, 57–67. [Google Scholar] [CrossRef]
- Castaldo, P.; Gino, D.; Mancini, G. Nonlinear Numerical Analyses of Reinforced Concrete Structures: Safety Formats, Aleatory and Epistemic Uncertainties. In Reliability-Based Analysis and Design of Structures and Infrastructure; Farsangi, E.N., Noori, M., Gardoni, P., Takewaki, I., Varum, H., Bogdanovic, A., Eds.; CRC Press: Boca Raton, FL, USA, 2021; pp. 143–158. [Google Scholar]
- Hsiung, B.-C.B. A case study on the behaviour of a deep excavation in sand. Comput. Geotech. 2009, 36, 665–675. [Google Scholar] [CrossRef]
- Ong, D.E.L.; Choo, C.S. Sustainable construction of a bored pile foundation system in erratic phyllite. In Proceedings of the ASEAN Australian Engineering Congress, Sarawak, Malaysia, 25–27 July 2011. [Google Scholar]
- Geo-Field Engineering. Design and Build Negotiated Contract for Kuching City Central Wastewater Management System: Centralised Sewerage for Kuching City Centre (Package 1): Geotechnical Interpretative Report (Volume 1). Prepared for Hock Seng Lee Berhad. 2009.
- Geo-Field Engineering. Design and Build Negotiated Contract for Kuching City Central Wastewater Management System: Centralised Sewerage for Kuching City Centre (Package 1): Geotechnical Interpretative Report (Volume 2). Prepared for Hock Seng Lee Berhad. 2009.
- Choo, C.S.; Ong, D.E.L. Evaluation of Pipe-Jacking Forces Based on Direct Shear Testing of Reconstituted Tunneling Rock Spoils. J. Geotech. Geoenviron. Eng. 2015, 141, 04015044. [Google Scholar] [CrossRef]
- Choo, C.S.; Ong, D.E.L. Impact of highly weathered geology on pipe-jacking forces. Geotech. Res. 2017, 4, 94–106. [Google Scholar] [CrossRef]
- Choo, C.S.; Ong, D.E.L. Assessment of non-linear rock strength parameters for the estimation of pipe-jacking forces. Part 2. Numerical modeling. Eng. Geol. 2020, 265, 105405. [Google Scholar] [CrossRef]
- Ong, D.E.L.; Choo, C.S. Assessment of non-linear rock strength parameters for the estimation of pipe-jacking forces. Part 1. Direct shear testing and backanalysis. Eng. Geol. 2018, 244, 159–172. [Google Scholar] [CrossRef]
- Peerun, M.I.; Ong, D.E.L.; Choo, C.S. Interpretation of Geomaterial Behavior during Shearing Aided by PIV Technology. J. Mater. Civ. Eng. 2019, 31, 04019195. [Google Scholar] [CrossRef]
- Peerun, M.I.; Ong, D.E.L.; Choo, C.S.; Cheng, W.C. Effect of interparticle behavior on the development of soil arching in soil-structure interaction. Tunn. Undergr. Space Technol. 2020, 106, 103610. [Google Scholar] [CrossRef]
- Ong, D.E.L.; Sim, Y.S.; Leung, C.F. Performance of Field and Numerical Back-Analysis of Floating Stone Columns in Soft Clay Considering the Influence of Dilatancy. Int. J. Geomech. 2018, 18, 04018135. [Google Scholar] [CrossRef]
- Jacky, J. The coefficient of earth pressure at rest. J. Soc. Hung. Archit. Eng. 1944, 8, 355–358. (In Hungarian) [Google Scholar]
- Ng, L.T.; Ong, D.E.L.; Wong, W.S.H.; Gannilegedera, D.A.; BonJong, B.F.; Chua, H.S. Real-time monitoring and assessment of groundwater responses due to dewatering of an abandoned 7 m deep excavation pit in Kuching City. In Computer Methods and Recent Advances in Geomechanics, Proceedings of the 14th International Conference for Computer Methods and Recent Advances in Geomechanics, Kyoto, Japan, 22–25 September 2014; Oka, F., Murakami, A., Uzuoka, R., Kimoto, S., Eds.; Taylor & Francis Books Ltd.: London, UK, 2015; pp. 1205–1211. [Google Scholar]
- Ong, D.E.L. Benchmarking of FEM Technique Involving Deep Excavation, Pile-soil Interaction and Embankment Construction. In Proceedings of the 12th International Conference of International Association for Computer Methods and Advances in Geomechanics (IACMAG), Goa, India, 1–6 October 2008; pp. 154–162. [Google Scholar]
- Ong, D.E.L.; Leung, C.F.; Chow, Y.K.; Yang, D.Q. Effect of Limiting Soil Pressures on Pile Behaviour. In Proceedings of the 16th South-East Asian Geotechnical Conference (SEAGC), Kuala Lumpur, Malaysia, 8–11 May 2007; pp. 427–437. [Google Scholar]
- American Concrete Institute. Building Code Requirements for Structural Concrete (ACI 318-08) and Commentary; American Concrete Institute: Indianapolis, IN, USA, 2008. [Google Scholar]
- Ong, D.E.L.; Yang, D.Q.; Phang, S.K. Comparisons of Finite Element Modelling of a Deep Excavation Using SAGE-CRISP and PLAXIS. In Proceedings of the International Conference on Deep Excavations, Singapore, 28–30 June 2006. [Google Scholar]
- GEO-SLOPE International Ltd. Seepage Modeling with SEEP/W 2007: An Engineering Methodology, 4th ed.; GEO-SLOPE International Ltd.: Calgary, AB, Canada, 2010. [Google Scholar]
- Loh, C.K. Effect of a Corner in a Three-Dimensional Excavation. Ph.D. Thesis, National University of Singapore, Singapore, 2003. [Google Scholar]
- Leung, C.F.; Ong, D.E.; Chow, Y.K. Pile Behavior Due to Excavation-Induced Soil Movement in Clay. II: Collapsed Wall. J. Geotech. Geoenviron. Eng. 2006, 132, 45–53. [Google Scholar] [CrossRef]
- Ong, D.E.L.; Leung, C.F.; Chow, Y.K. Behavior of Pile Groups Subject to Excavation-Induced Soil Movement in Very Soft Clay. J. Geotech. Geoenviron. Eng. 2009, 135, 1462–1474. [Google Scholar] [CrossRef]
Figure 1.
Site layout plan of the main basement indicating locations of geotechnical instruments.
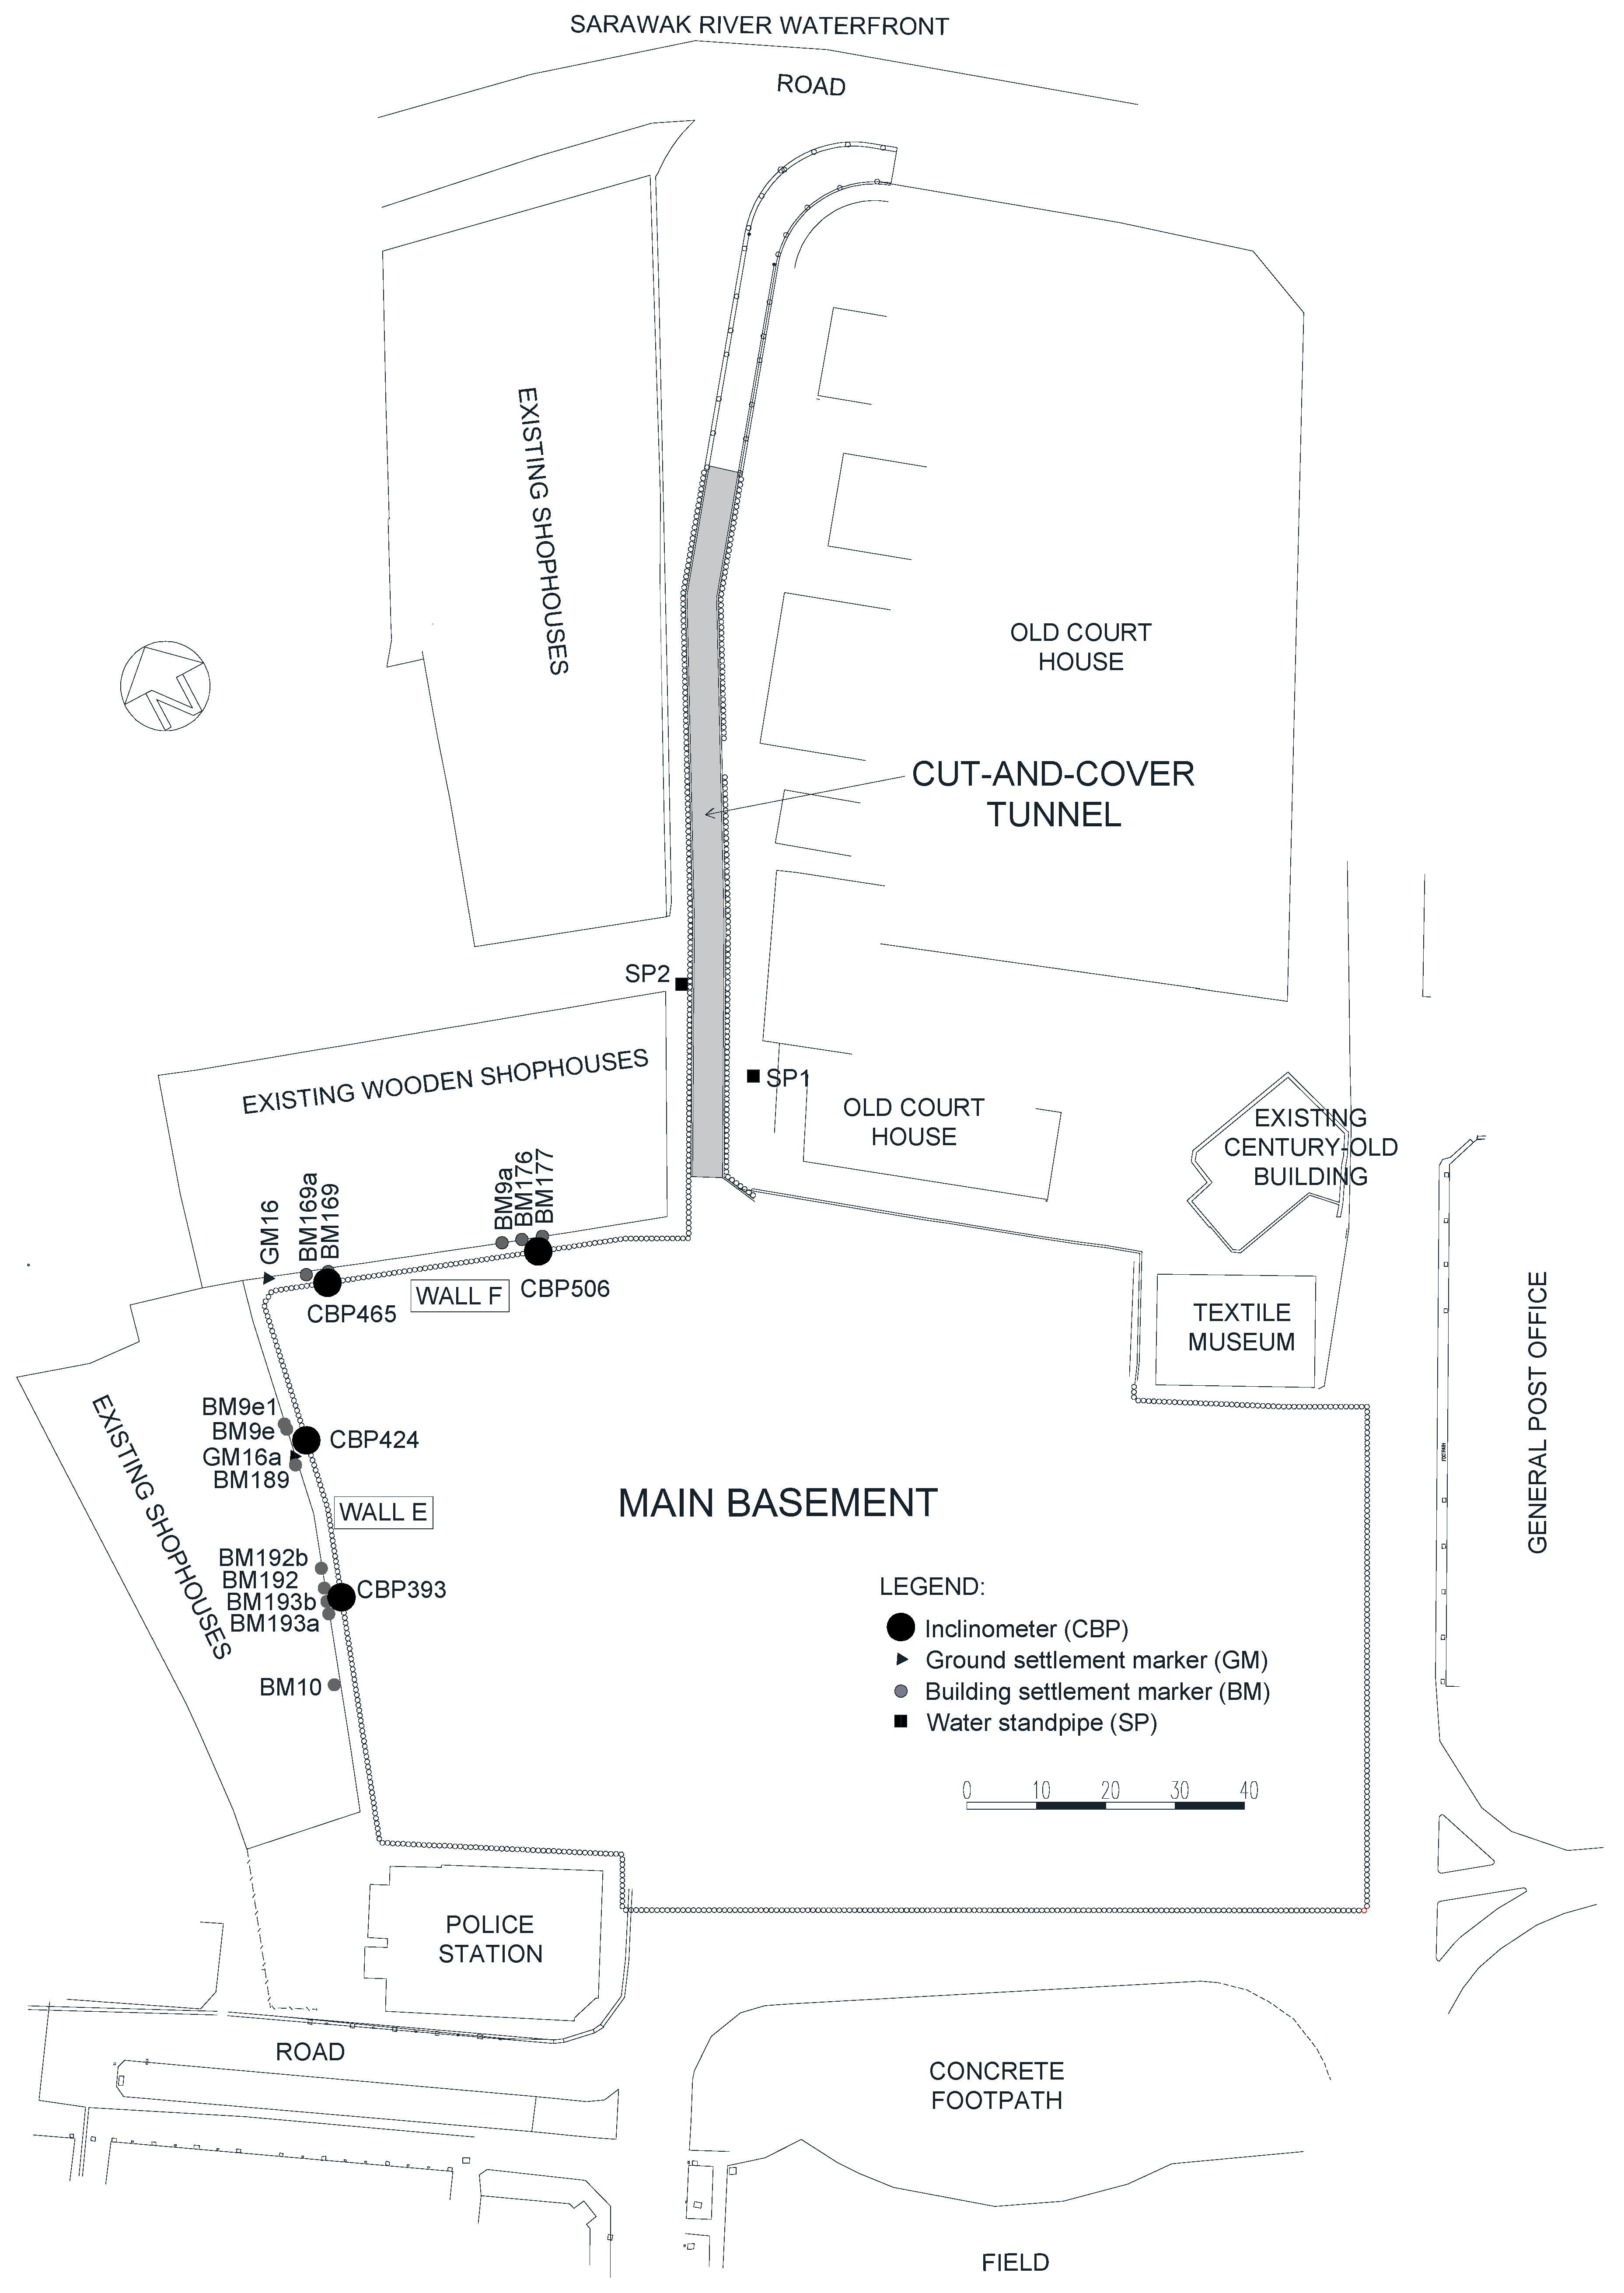
Figure 2.
Cross section of CBP wall and soil profiles for different wall sections.
Figure 3.
Geological properties obtained from borehole logs: (a) SPT ‘N’; (b) particle content; (c) water content; (d) plastic limit and liquid limit.
Figure 3.
Geological properties obtained from borehole logs: (a) SPT ‘N’; (b) particle content; (c) water content; (d) plastic limit and liquid limit.
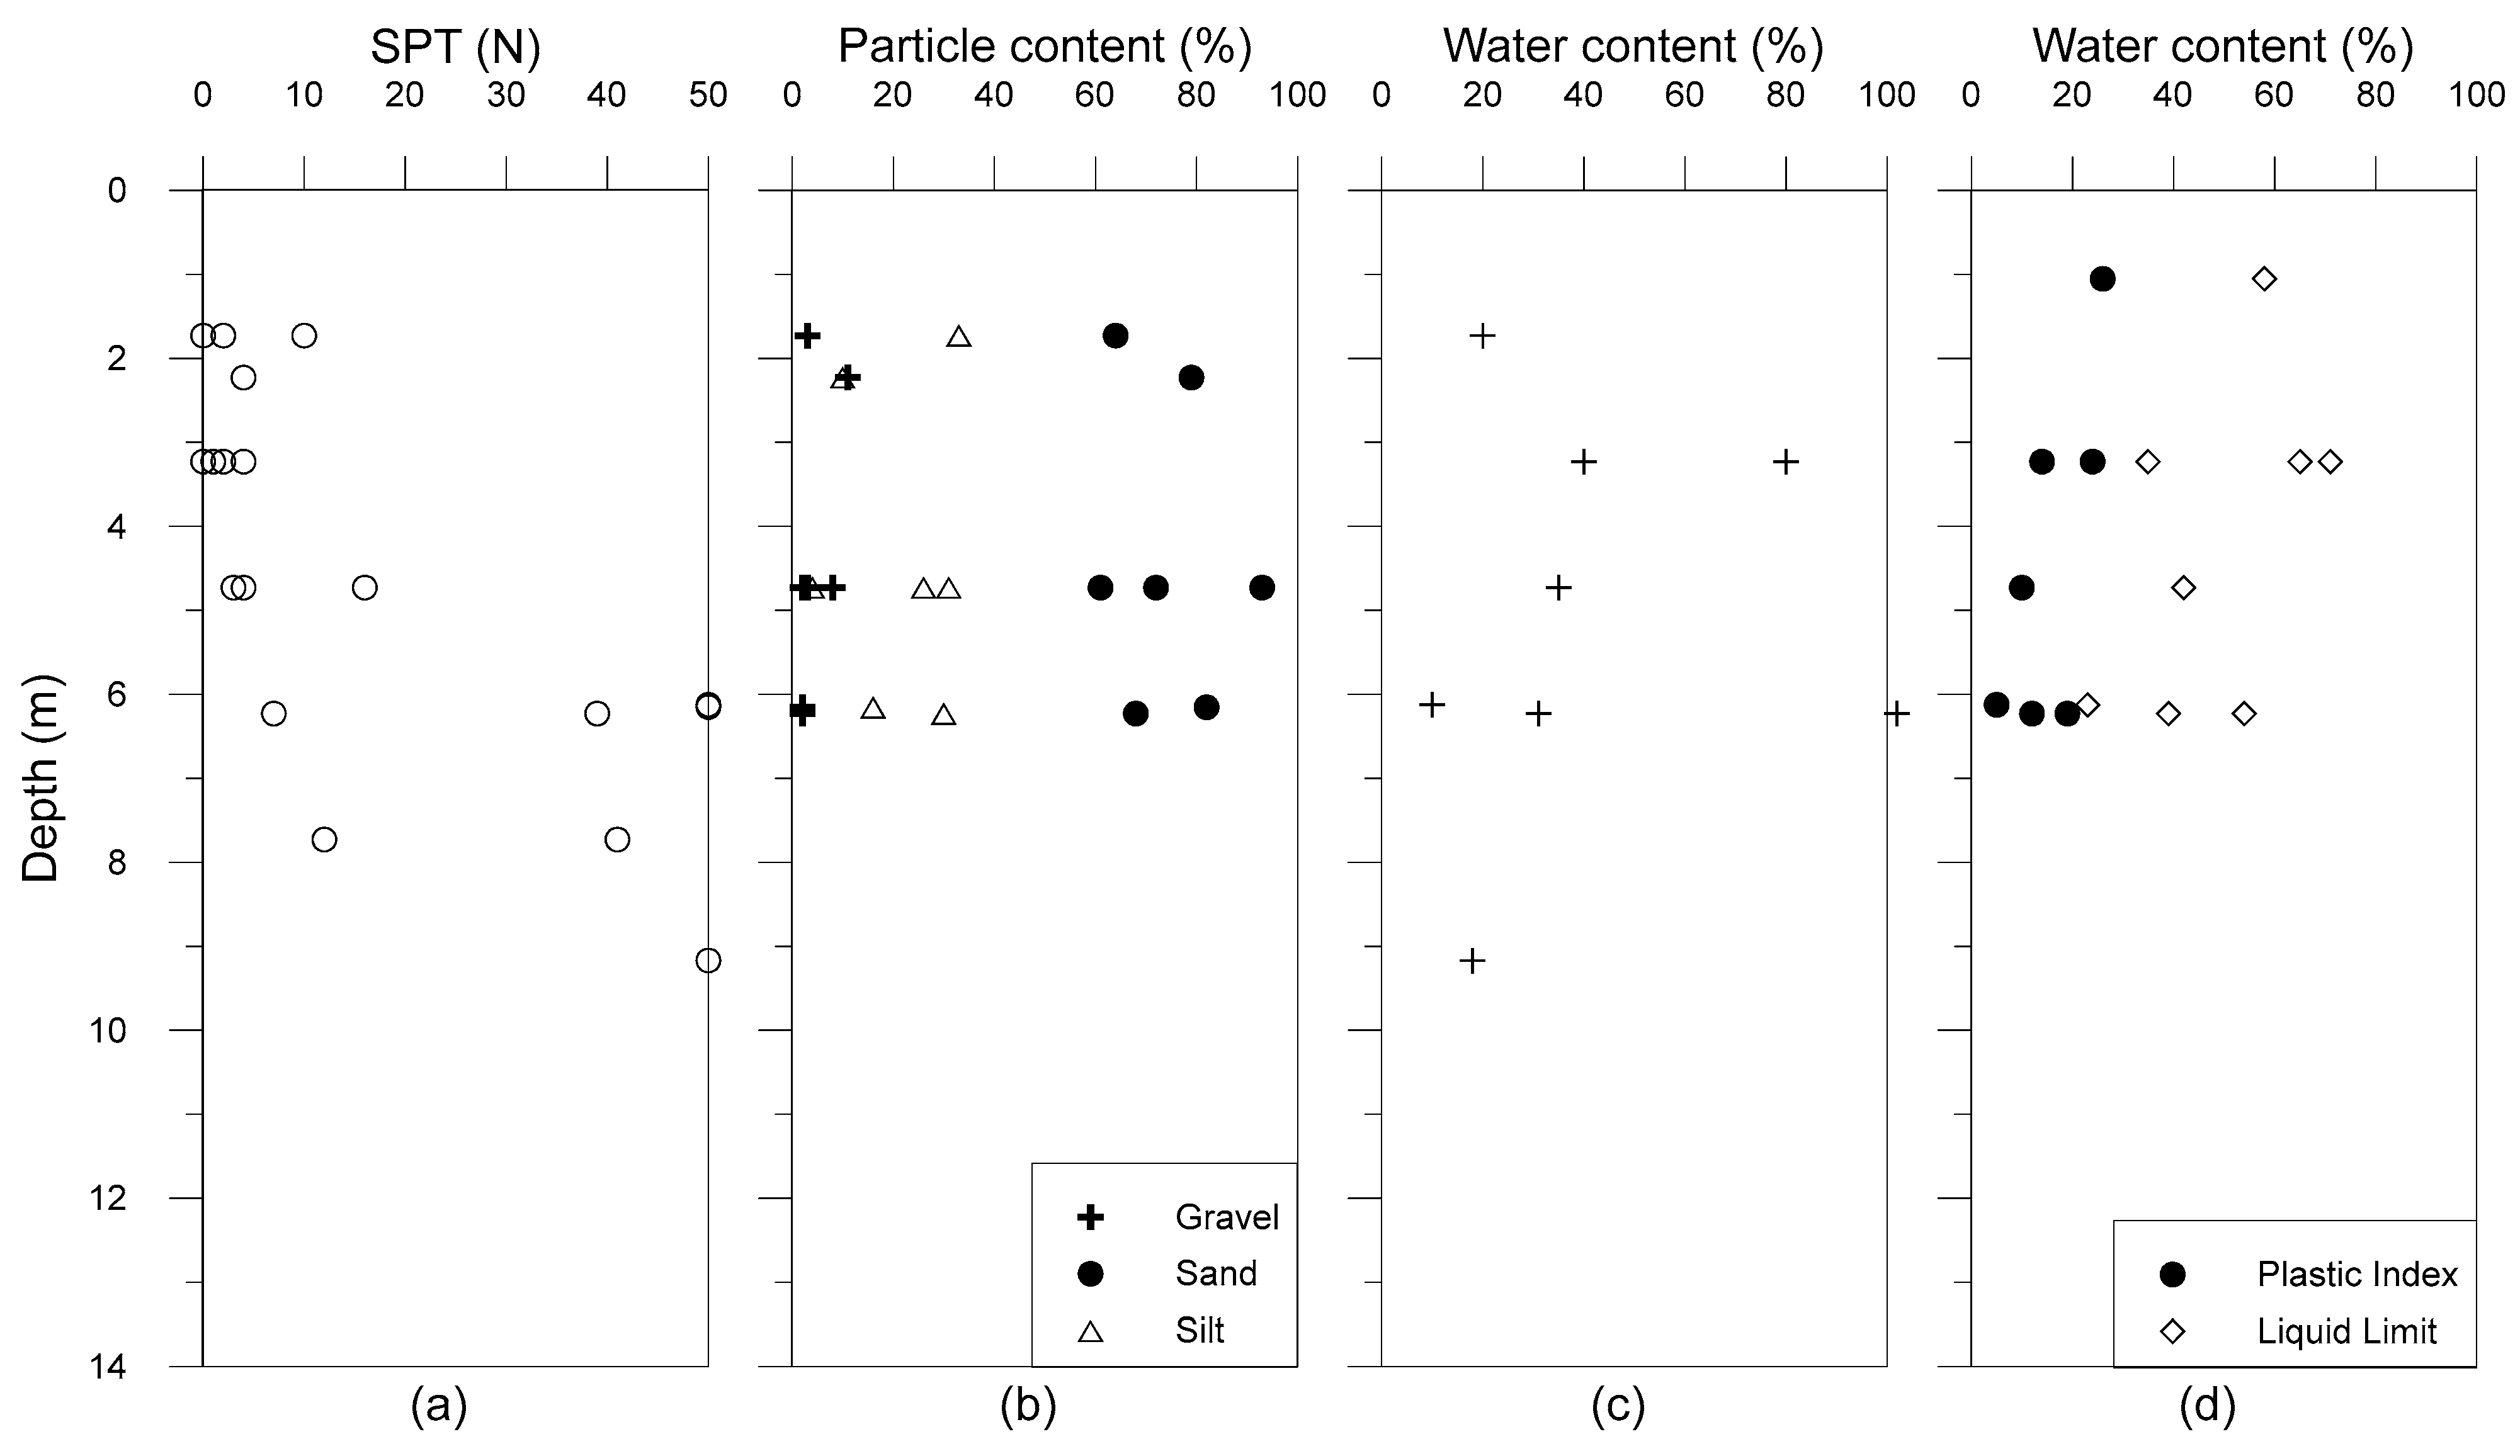
Figure 4.
Evidence of groundwater leakage and soil residues observed at locations where ground anchors were installed.
Figure 4.
Evidence of groundwater leakage and soil residues observed at locations where ground anchors were installed.
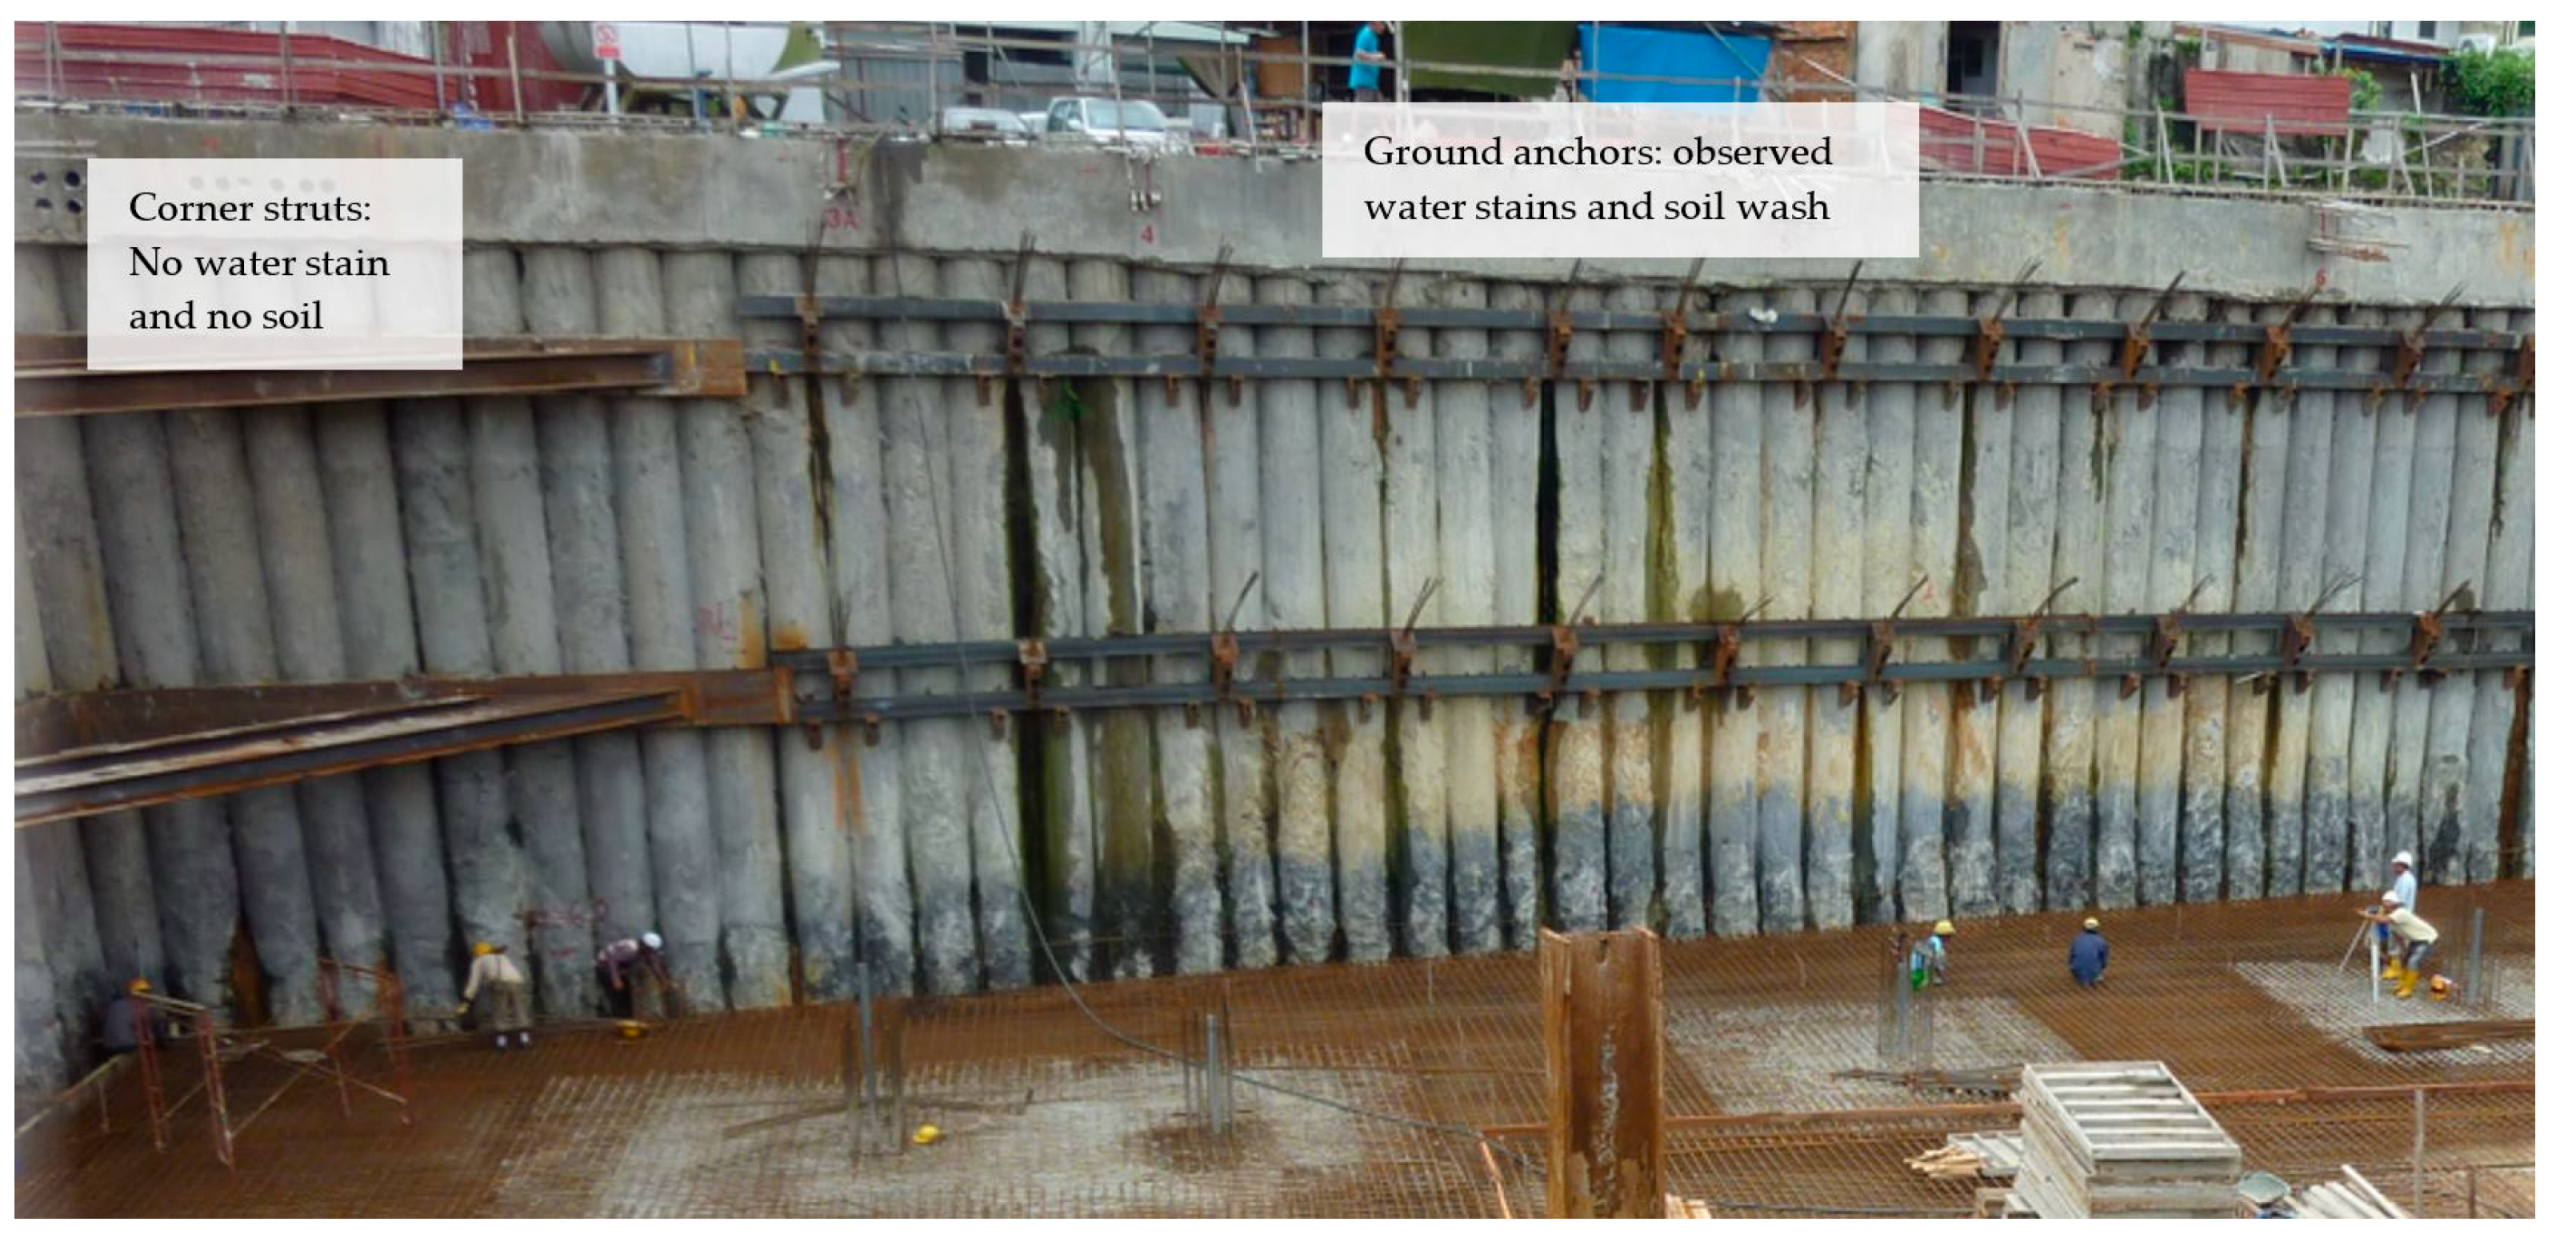
Figure 5.
Relationship between (a) maximum building settlement and maximum wall deflection; and (b) ground settlement and maximum wall deflection, due to the likely cause of accidental groundwater lowering during the ground anchor installation process. Upper bound after Ou et al. (1993) [27] and Zhang et al. (2018) [28].
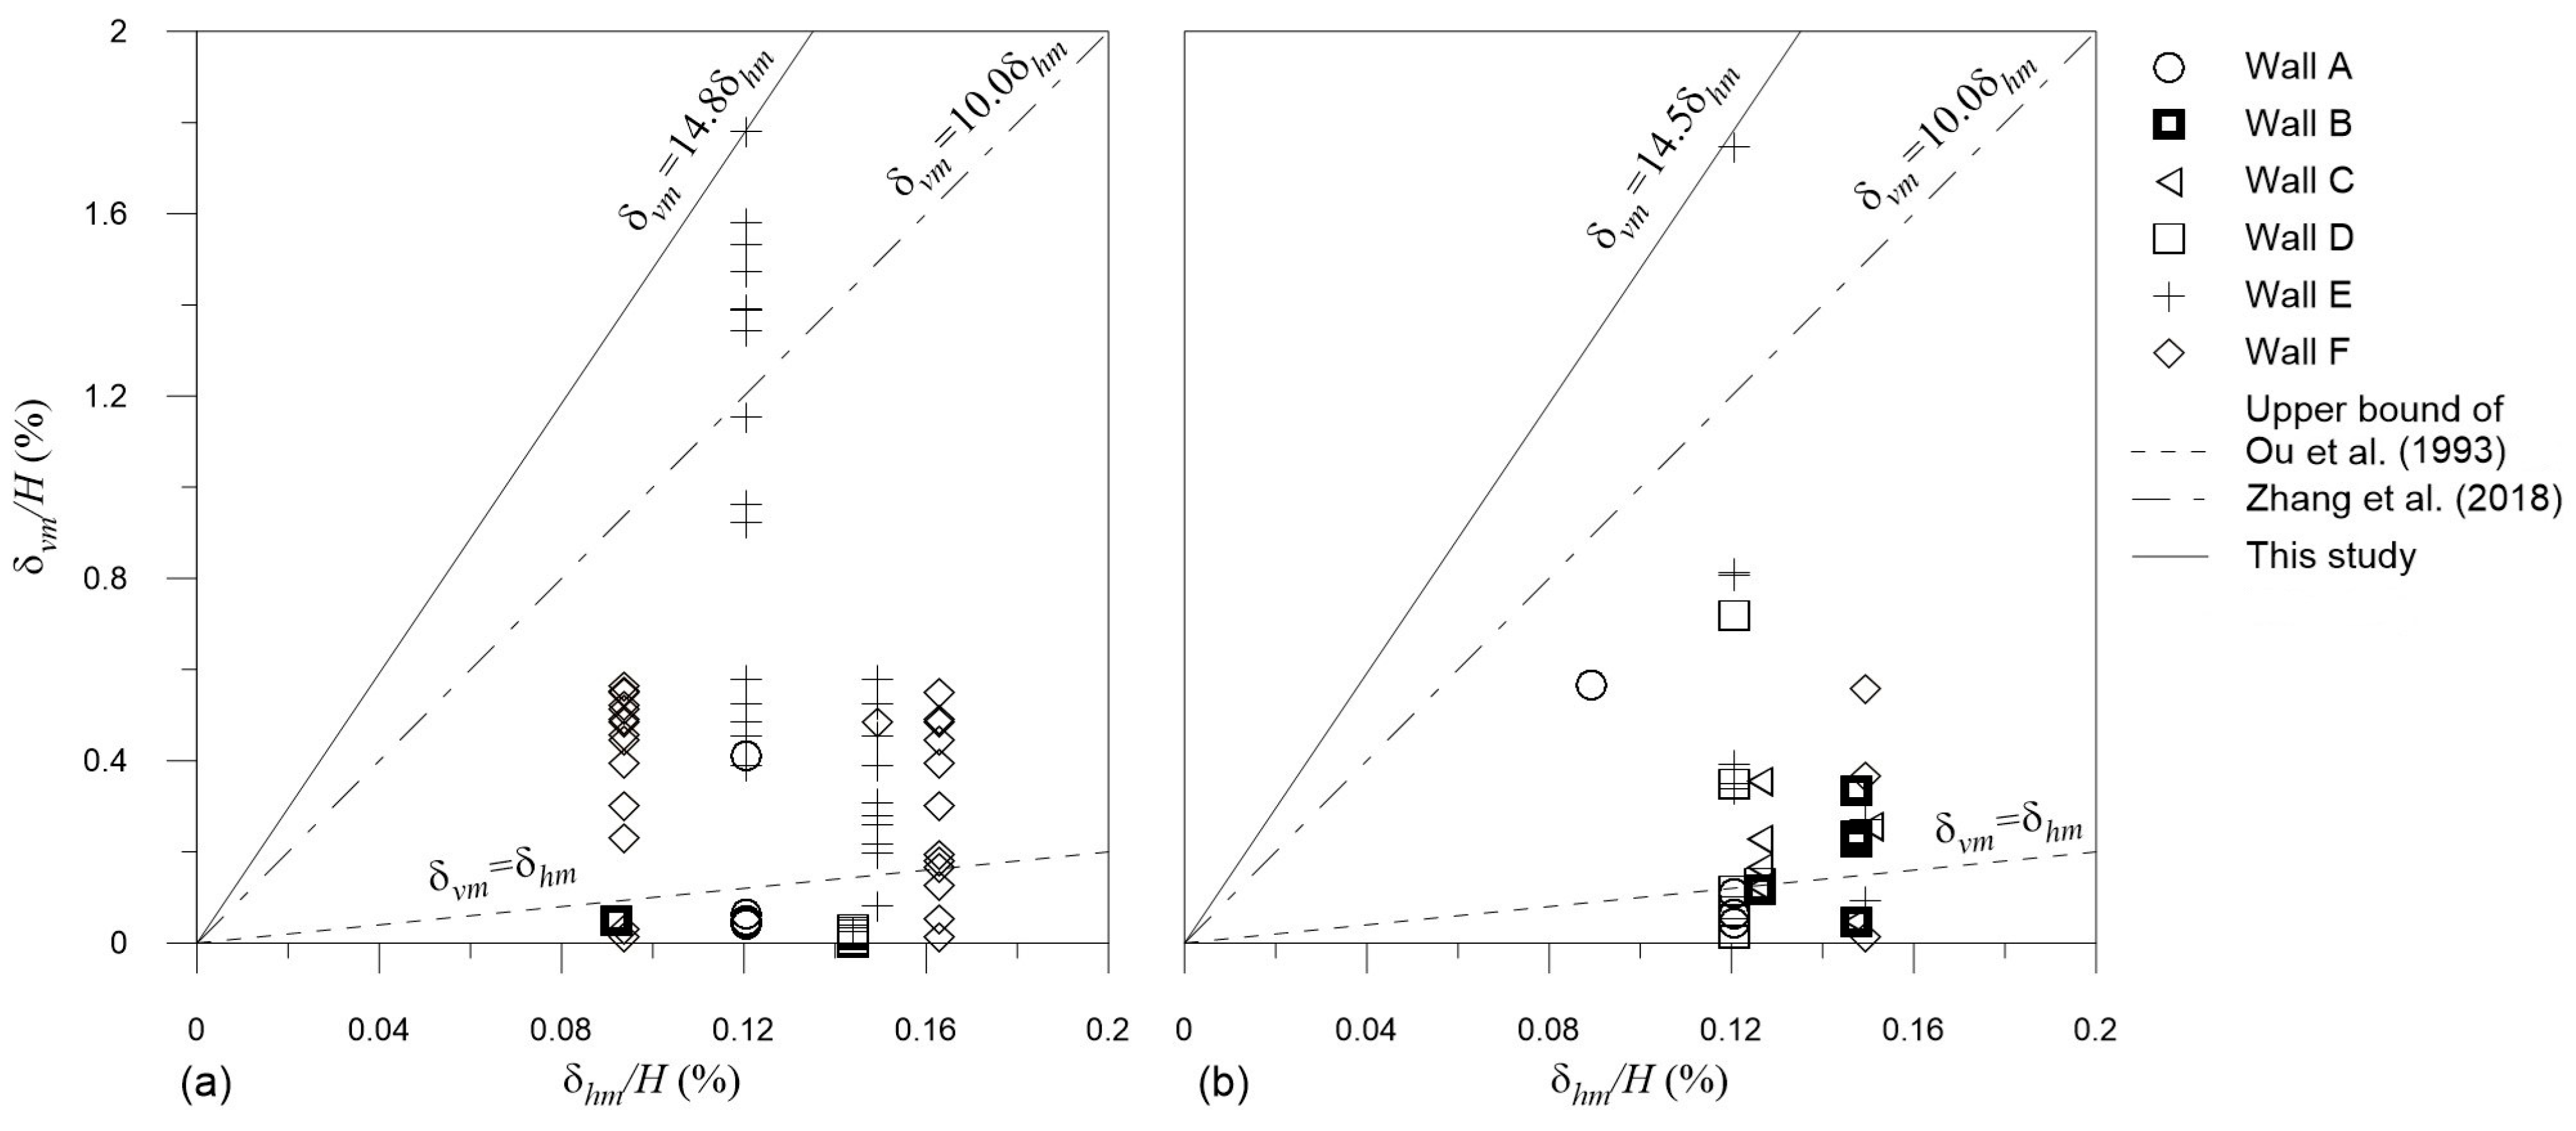
Figure 6.
An example of a finite element model in PLAXIS 2D.
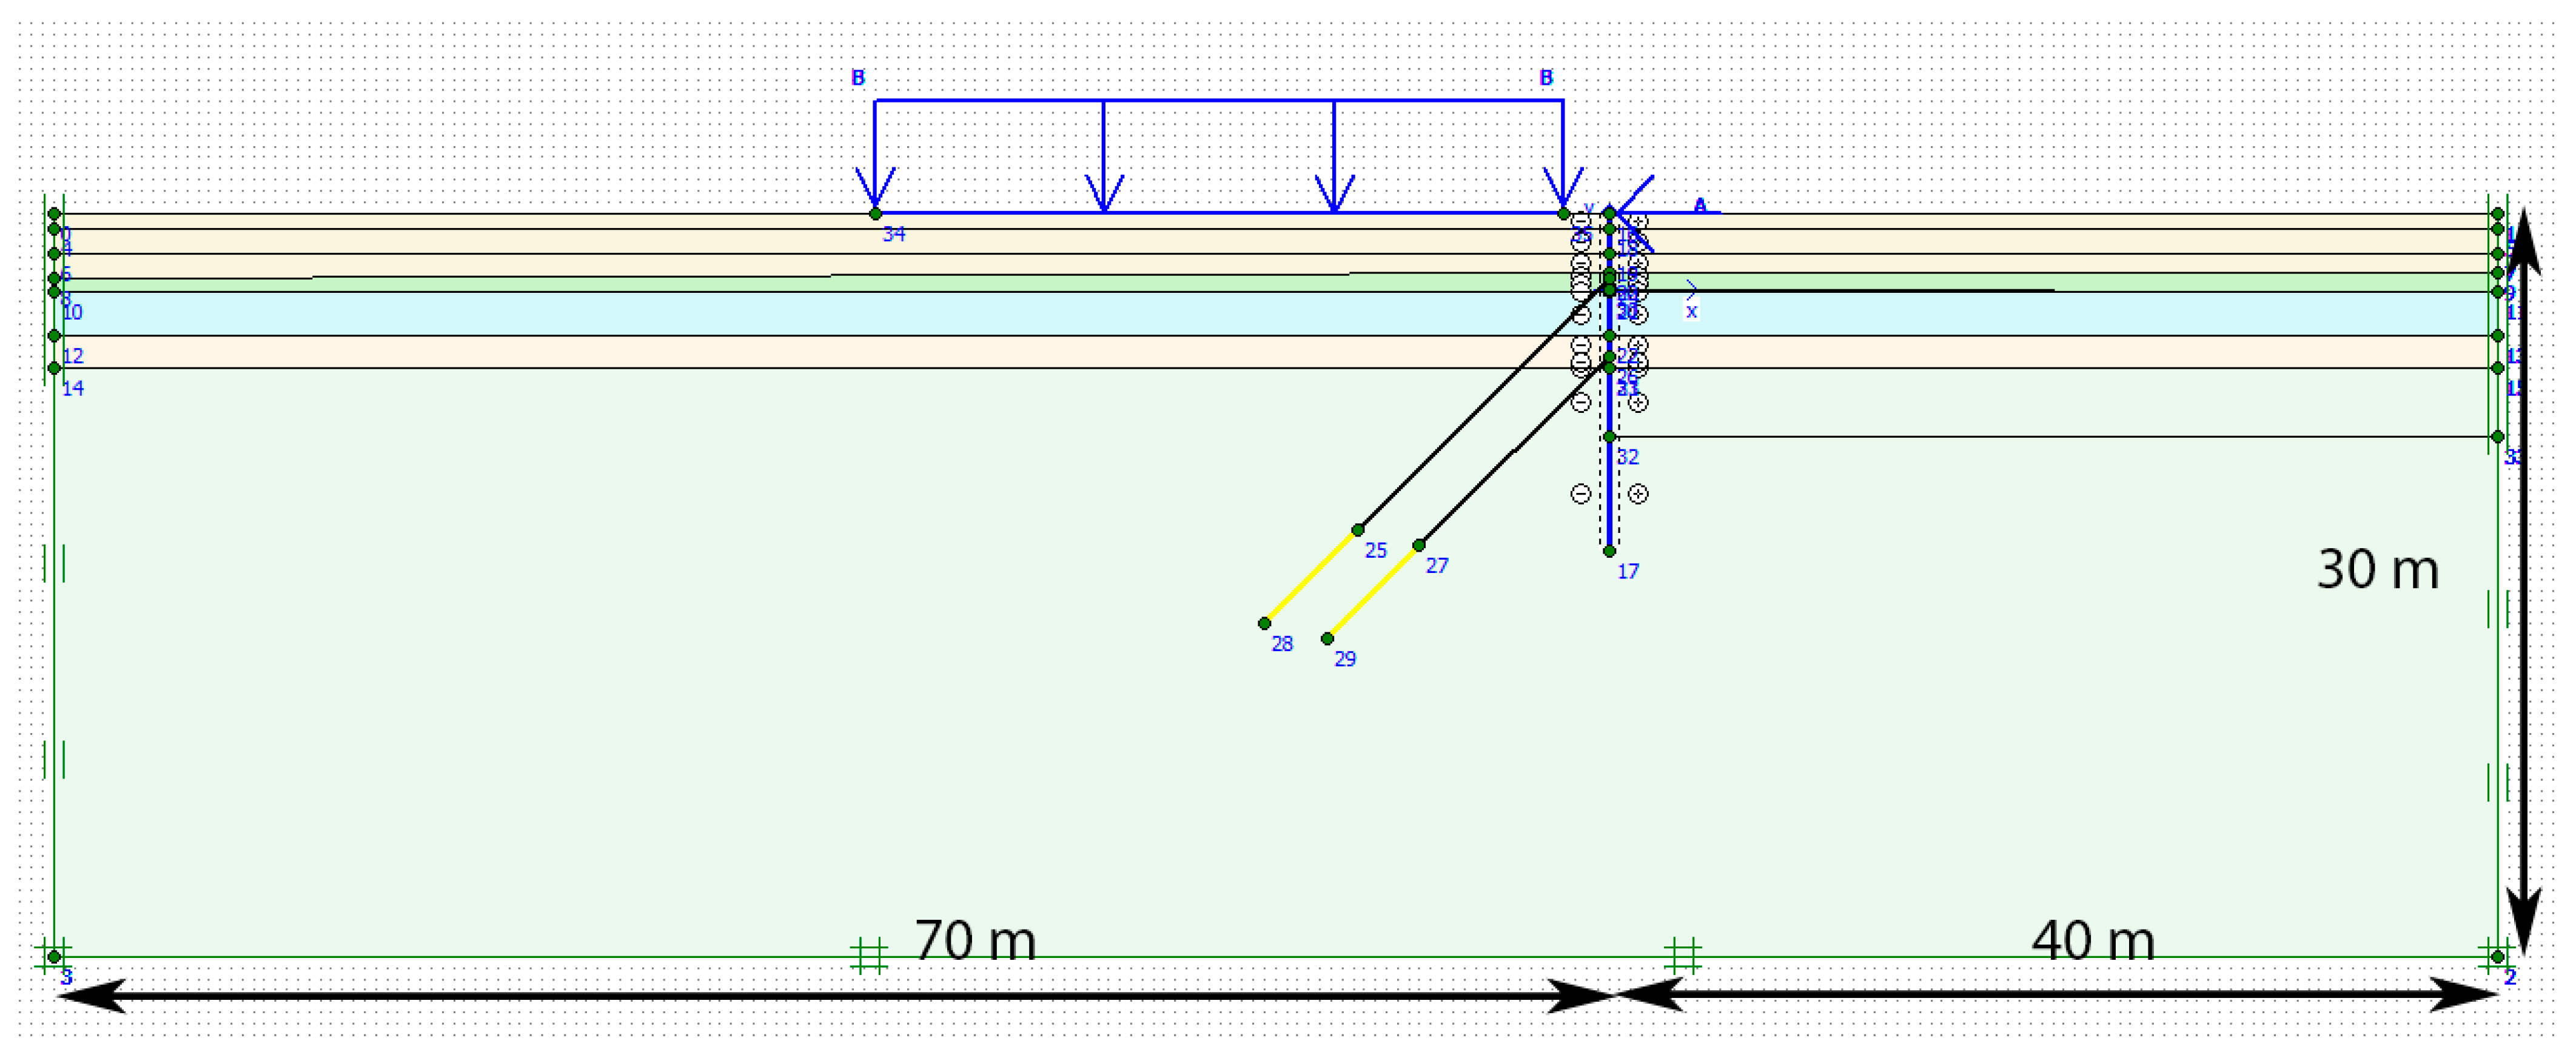
Figure 7.
A typical finite element model in PLAXIS 3D.
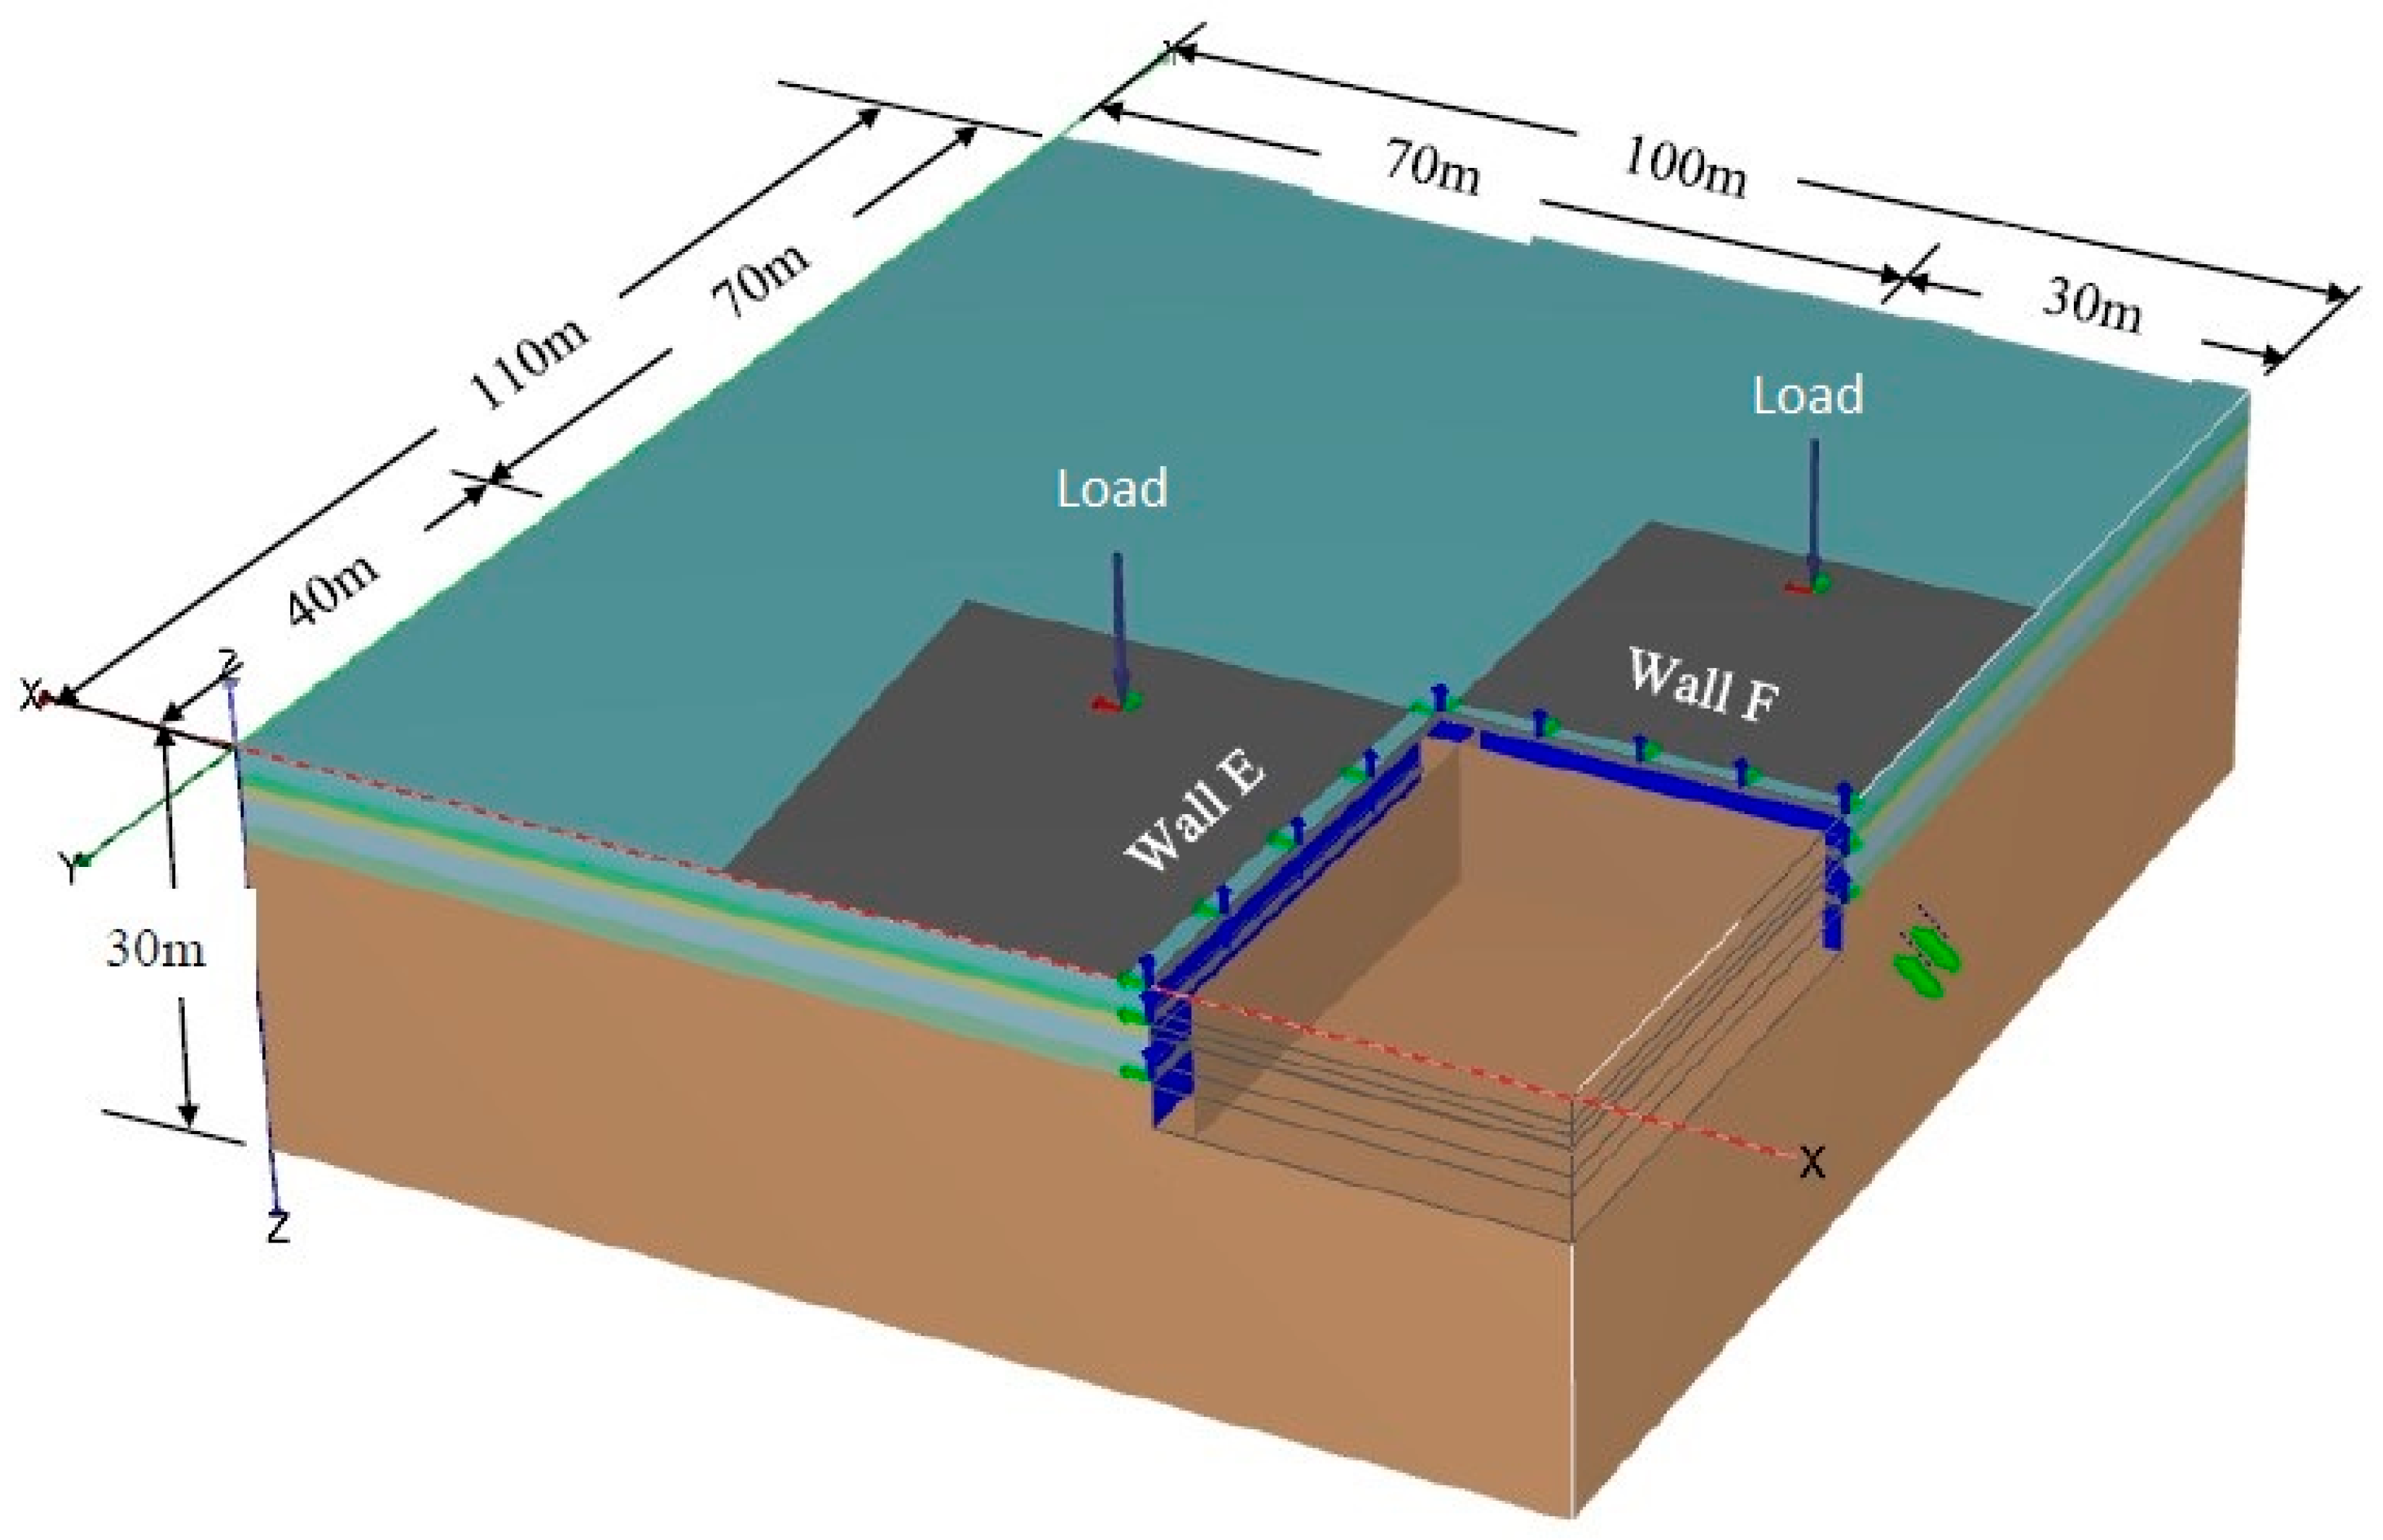
Figure 8.
Method of smearing piles to an equivalent wall for use in PLAXIS 2D and 3D [44].
Figure 8.
Method of smearing piles to an equivalent wall for use in PLAXIS 2D and 3D [44].
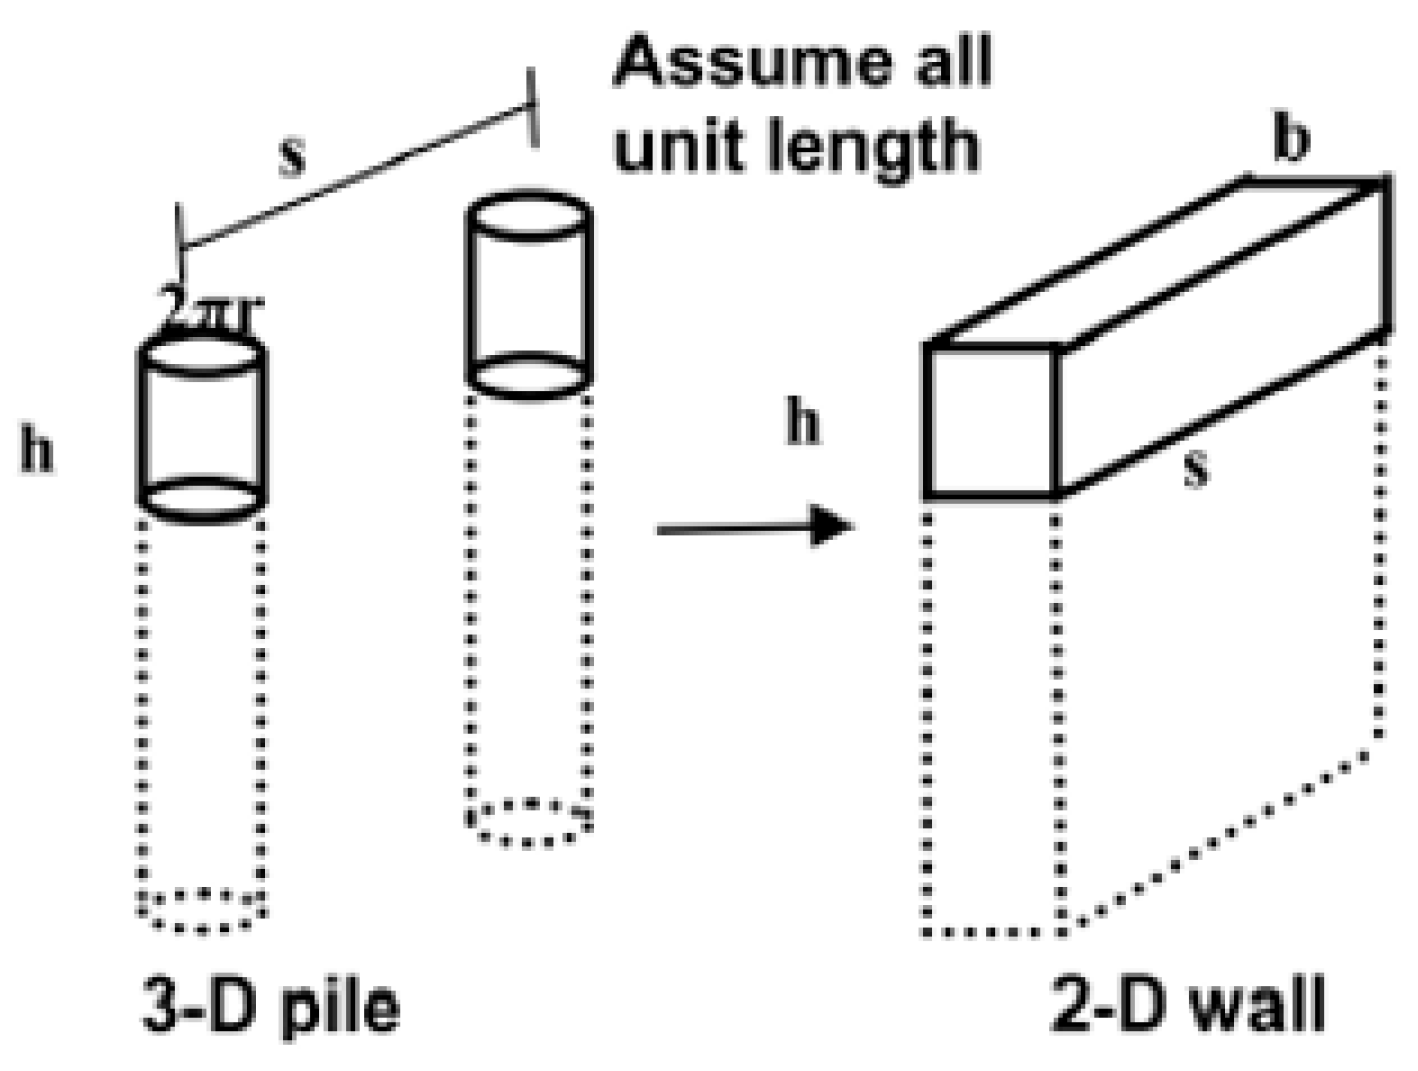
Figure 9.
Details of ground anchor and anchor strands.
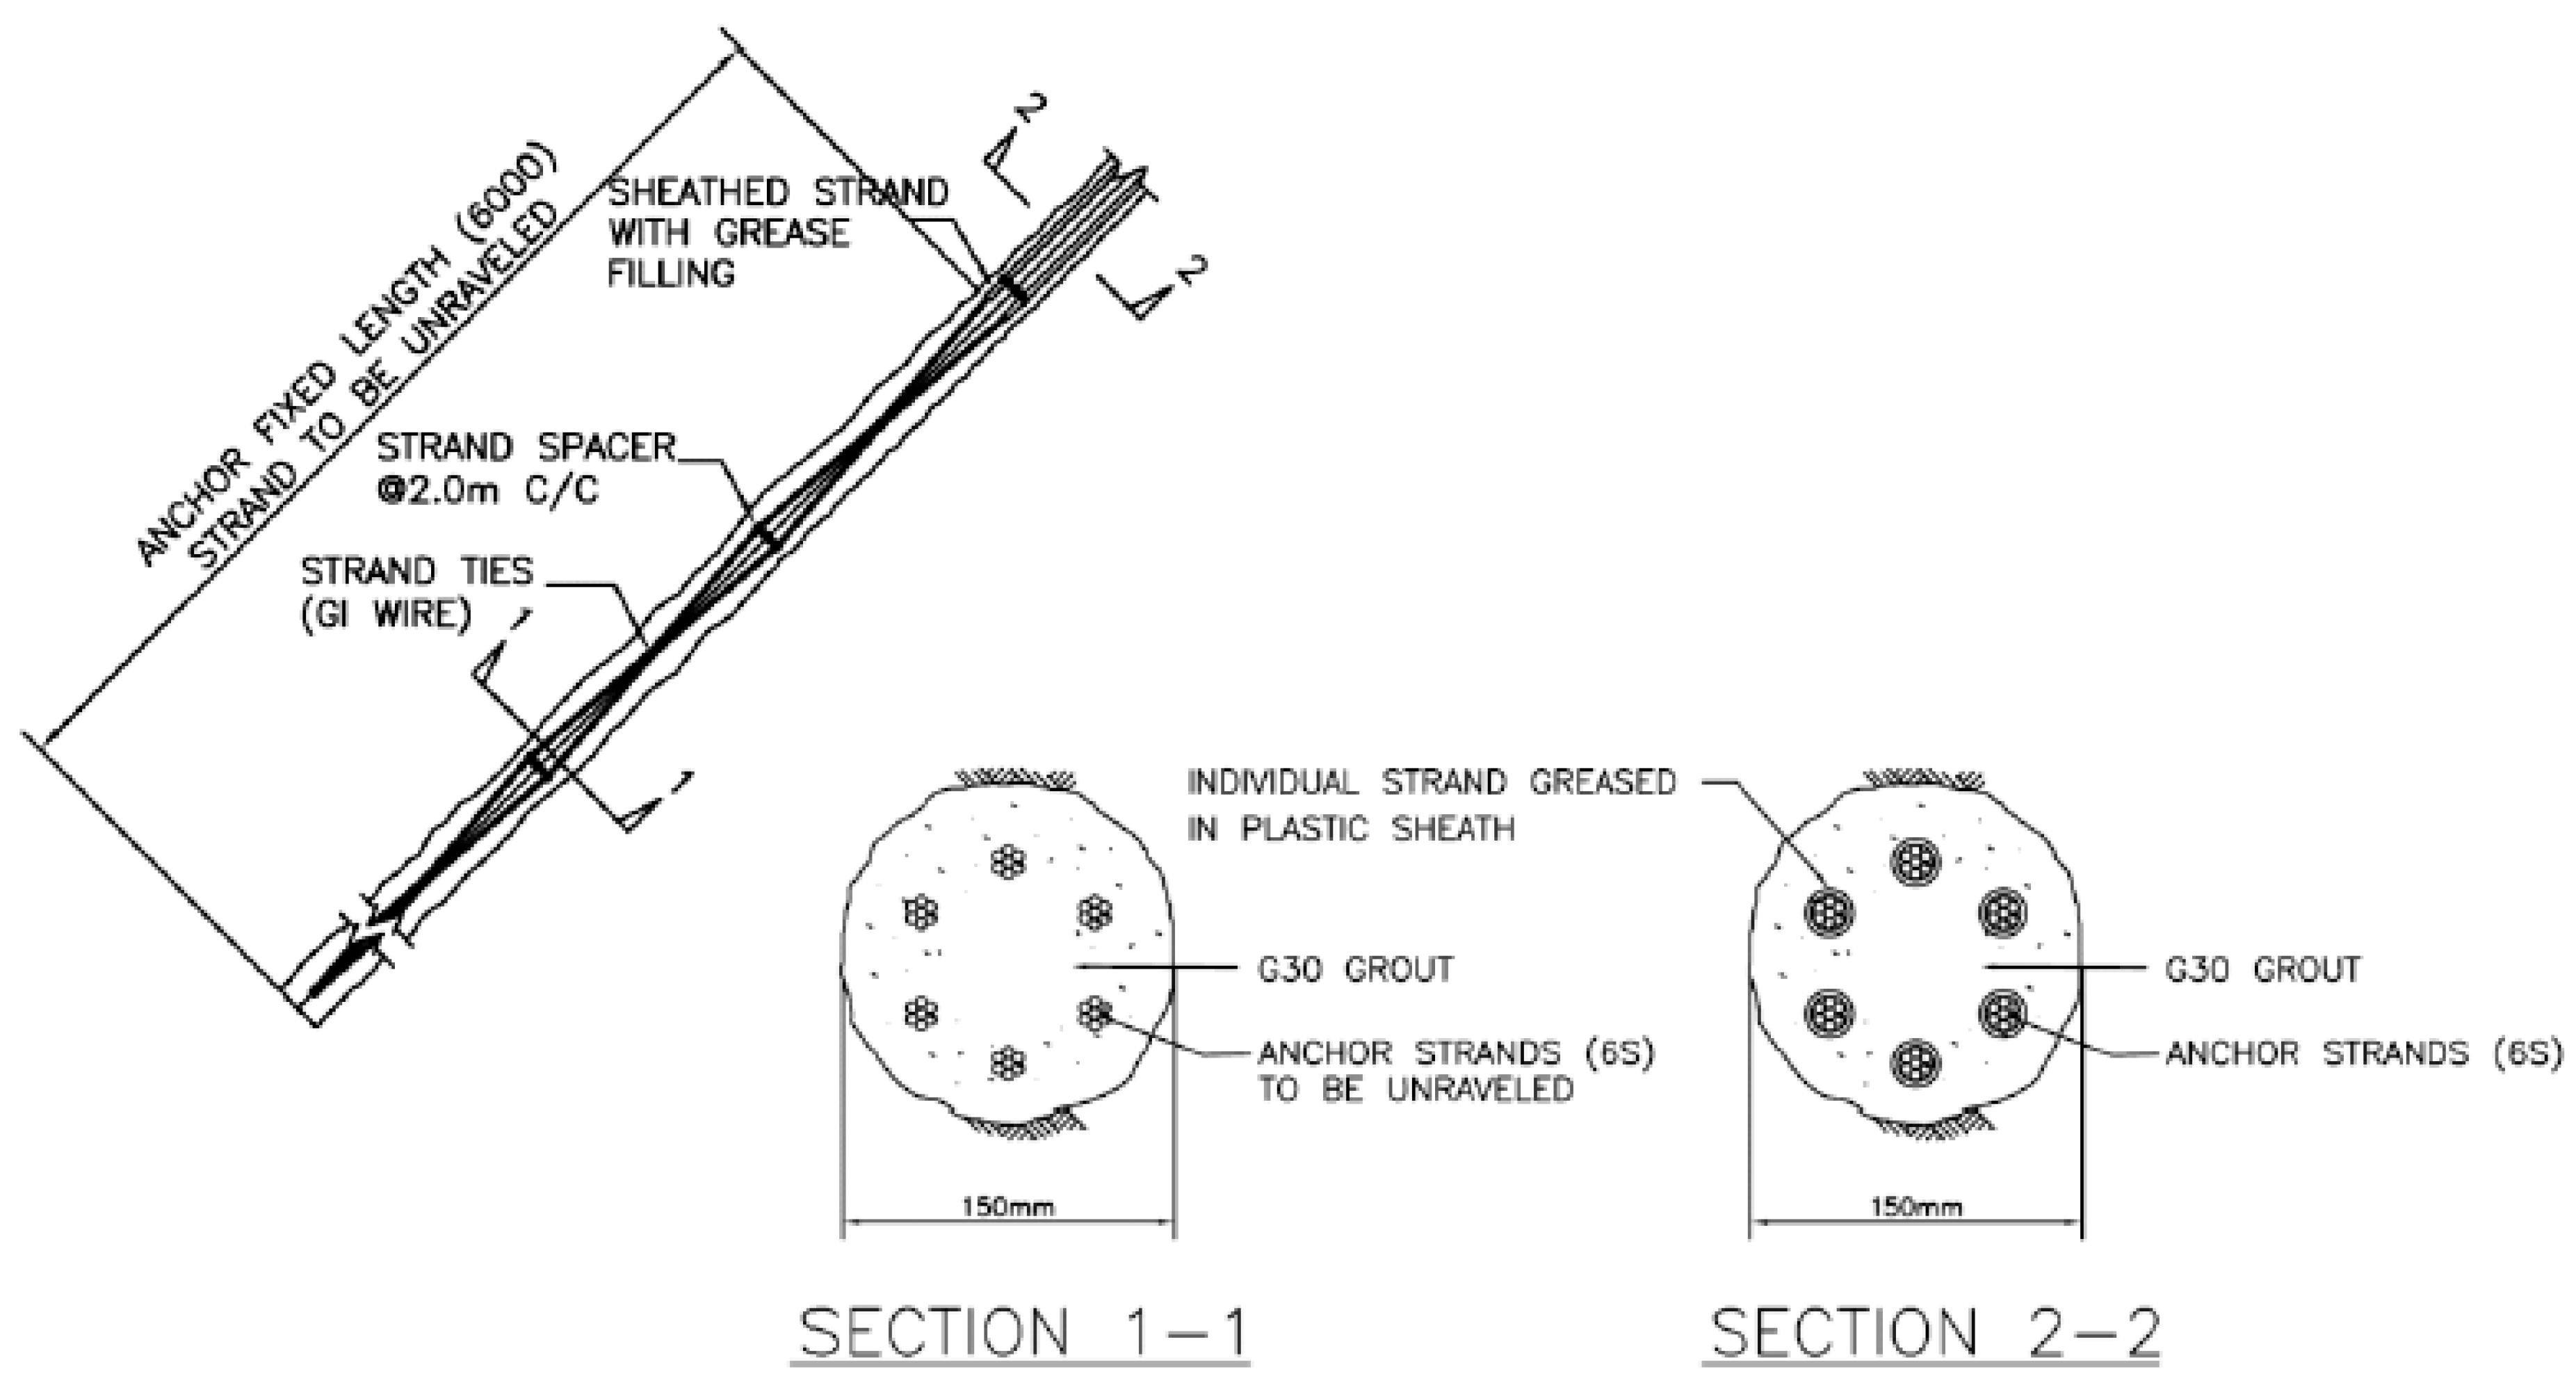
Figure 10.
Typical GeoStudio SEEP/W calibration of hydrogeological or groundwater drawdown: (a) SP1 location considering flow-through ‘permeable wall’ with 50 mm gaps between successive bored piles, and (b) considering ‘impermeable wall’ but with leakage at the locations of ground anchor heads near SP1.
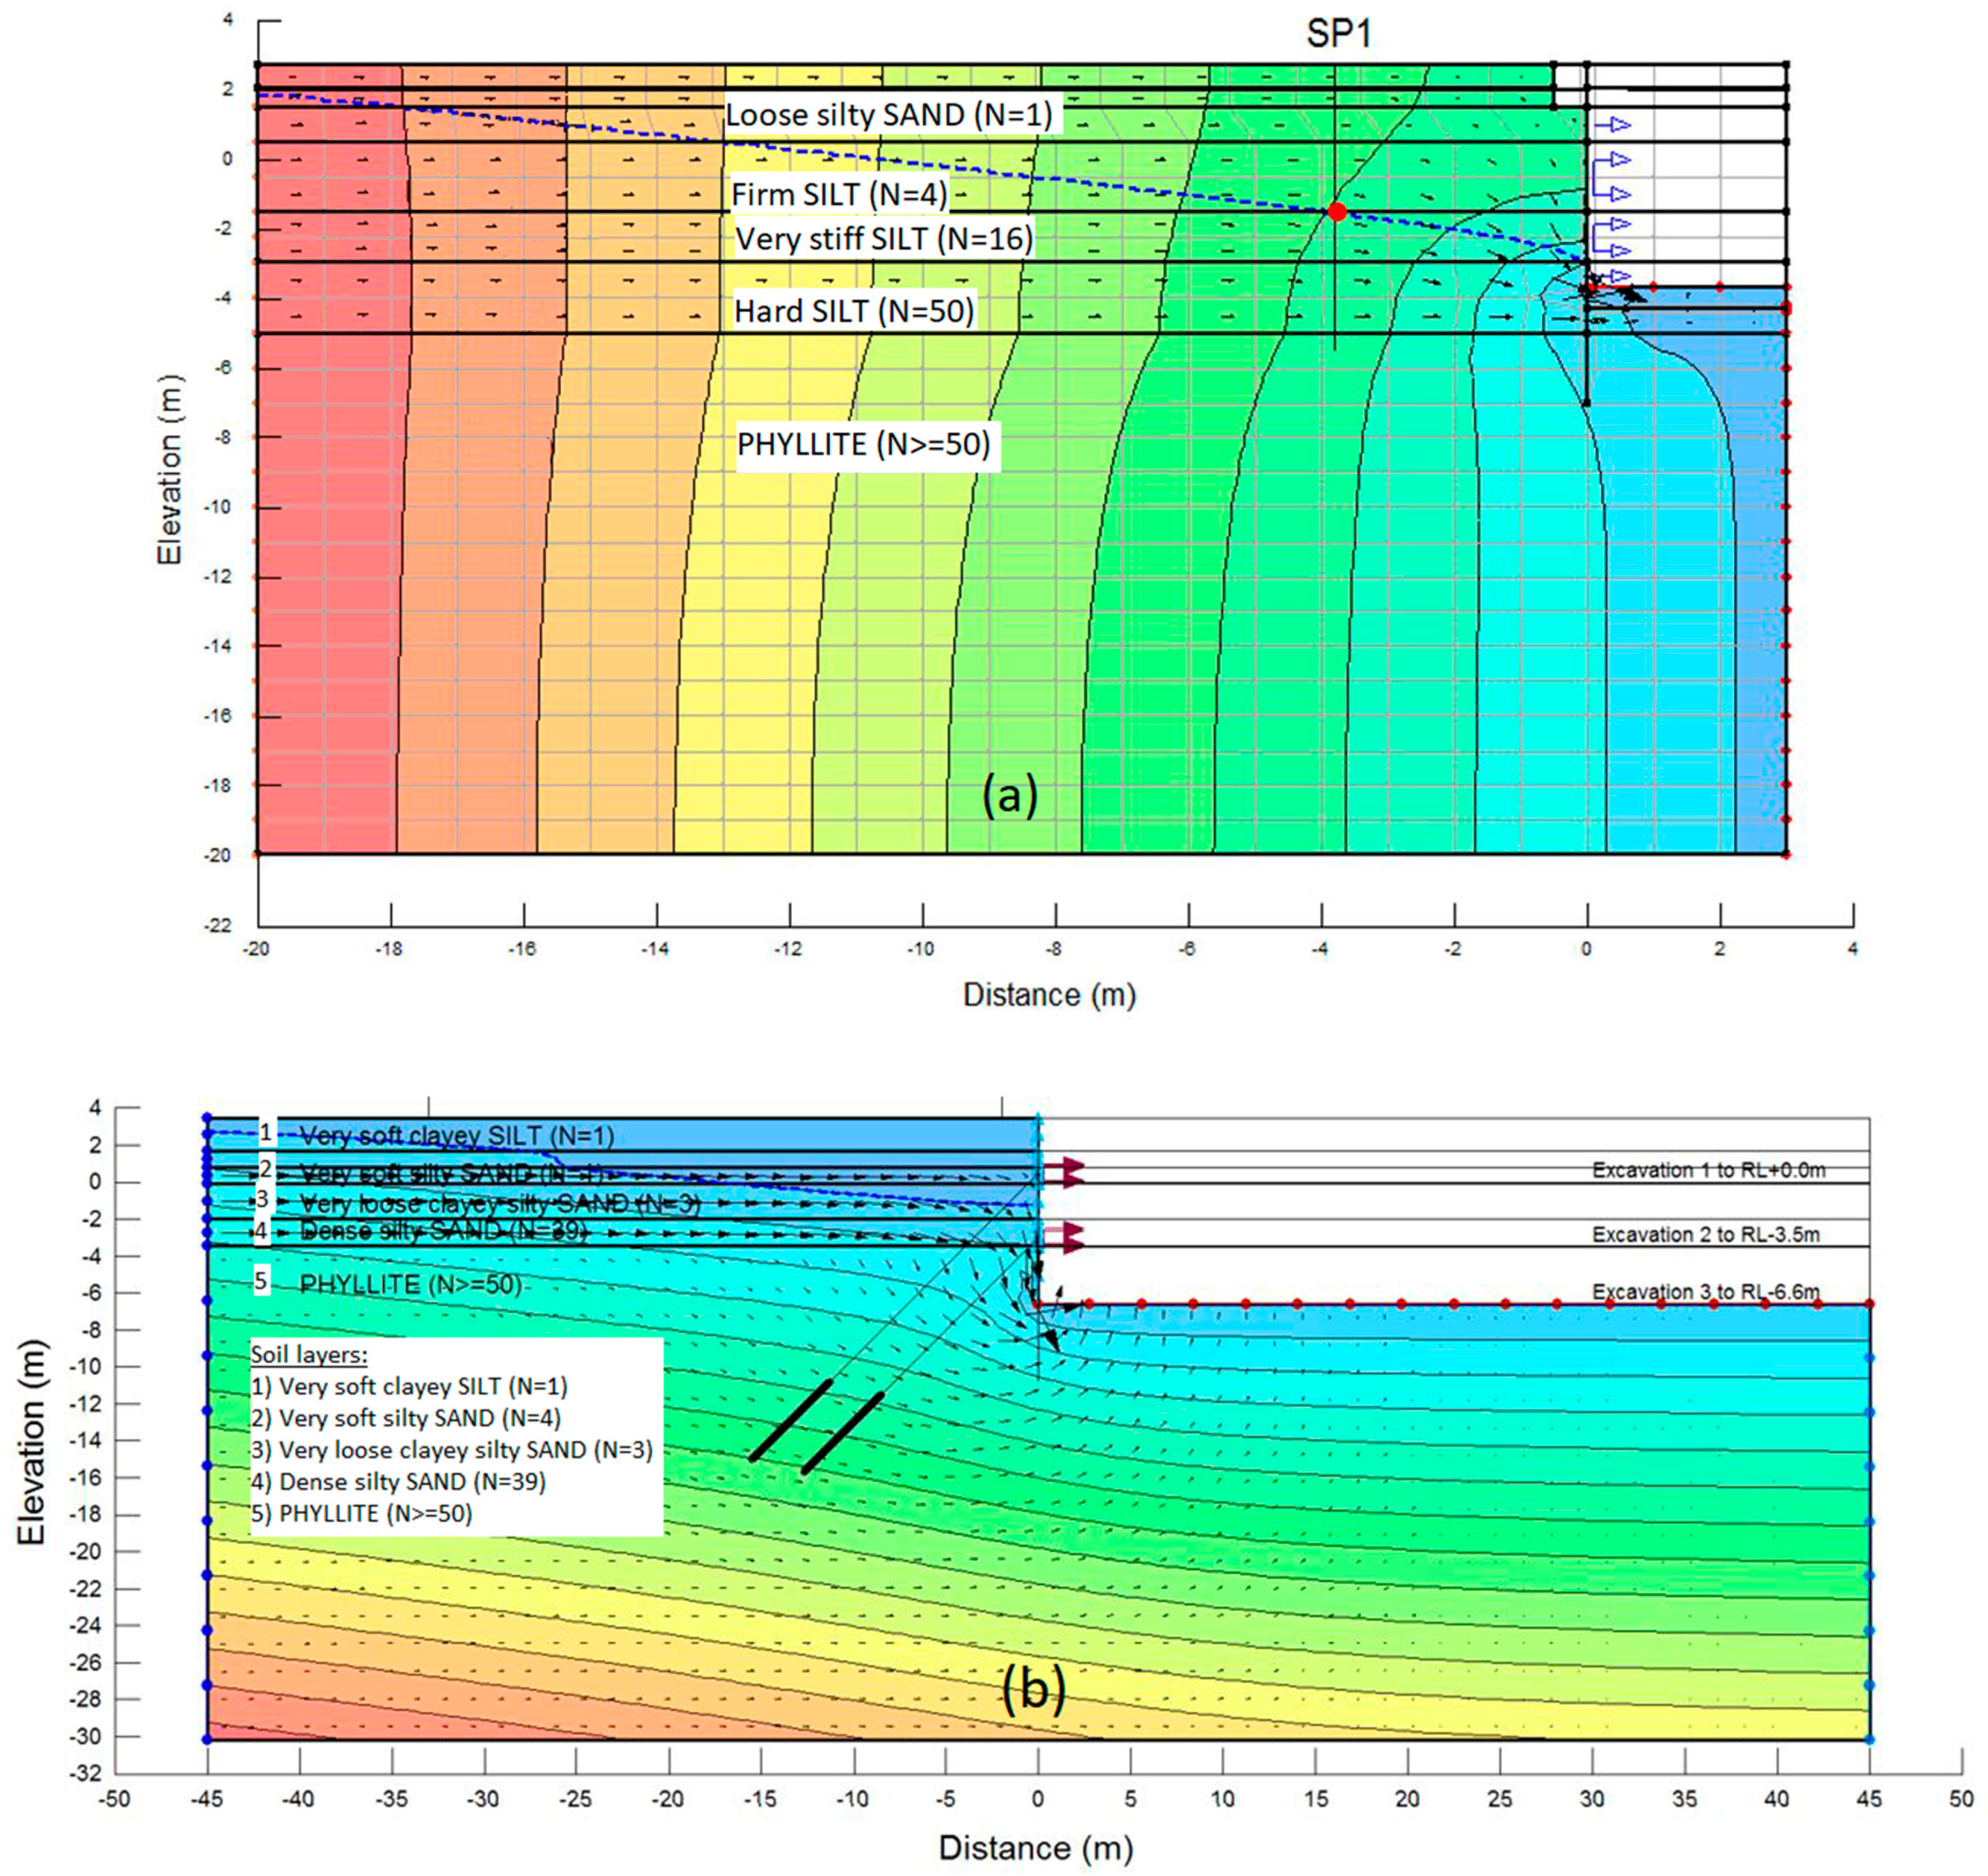
Figure 11.
Comparison of predicted and measured hydrogeology level at (a) SP1 and (b) SP2 using the equivalent permeability technique.
Figure 11.
Comparison of predicted and measured hydrogeology level at (a) SP1 and (b) SP2 using the equivalent permeability technique.
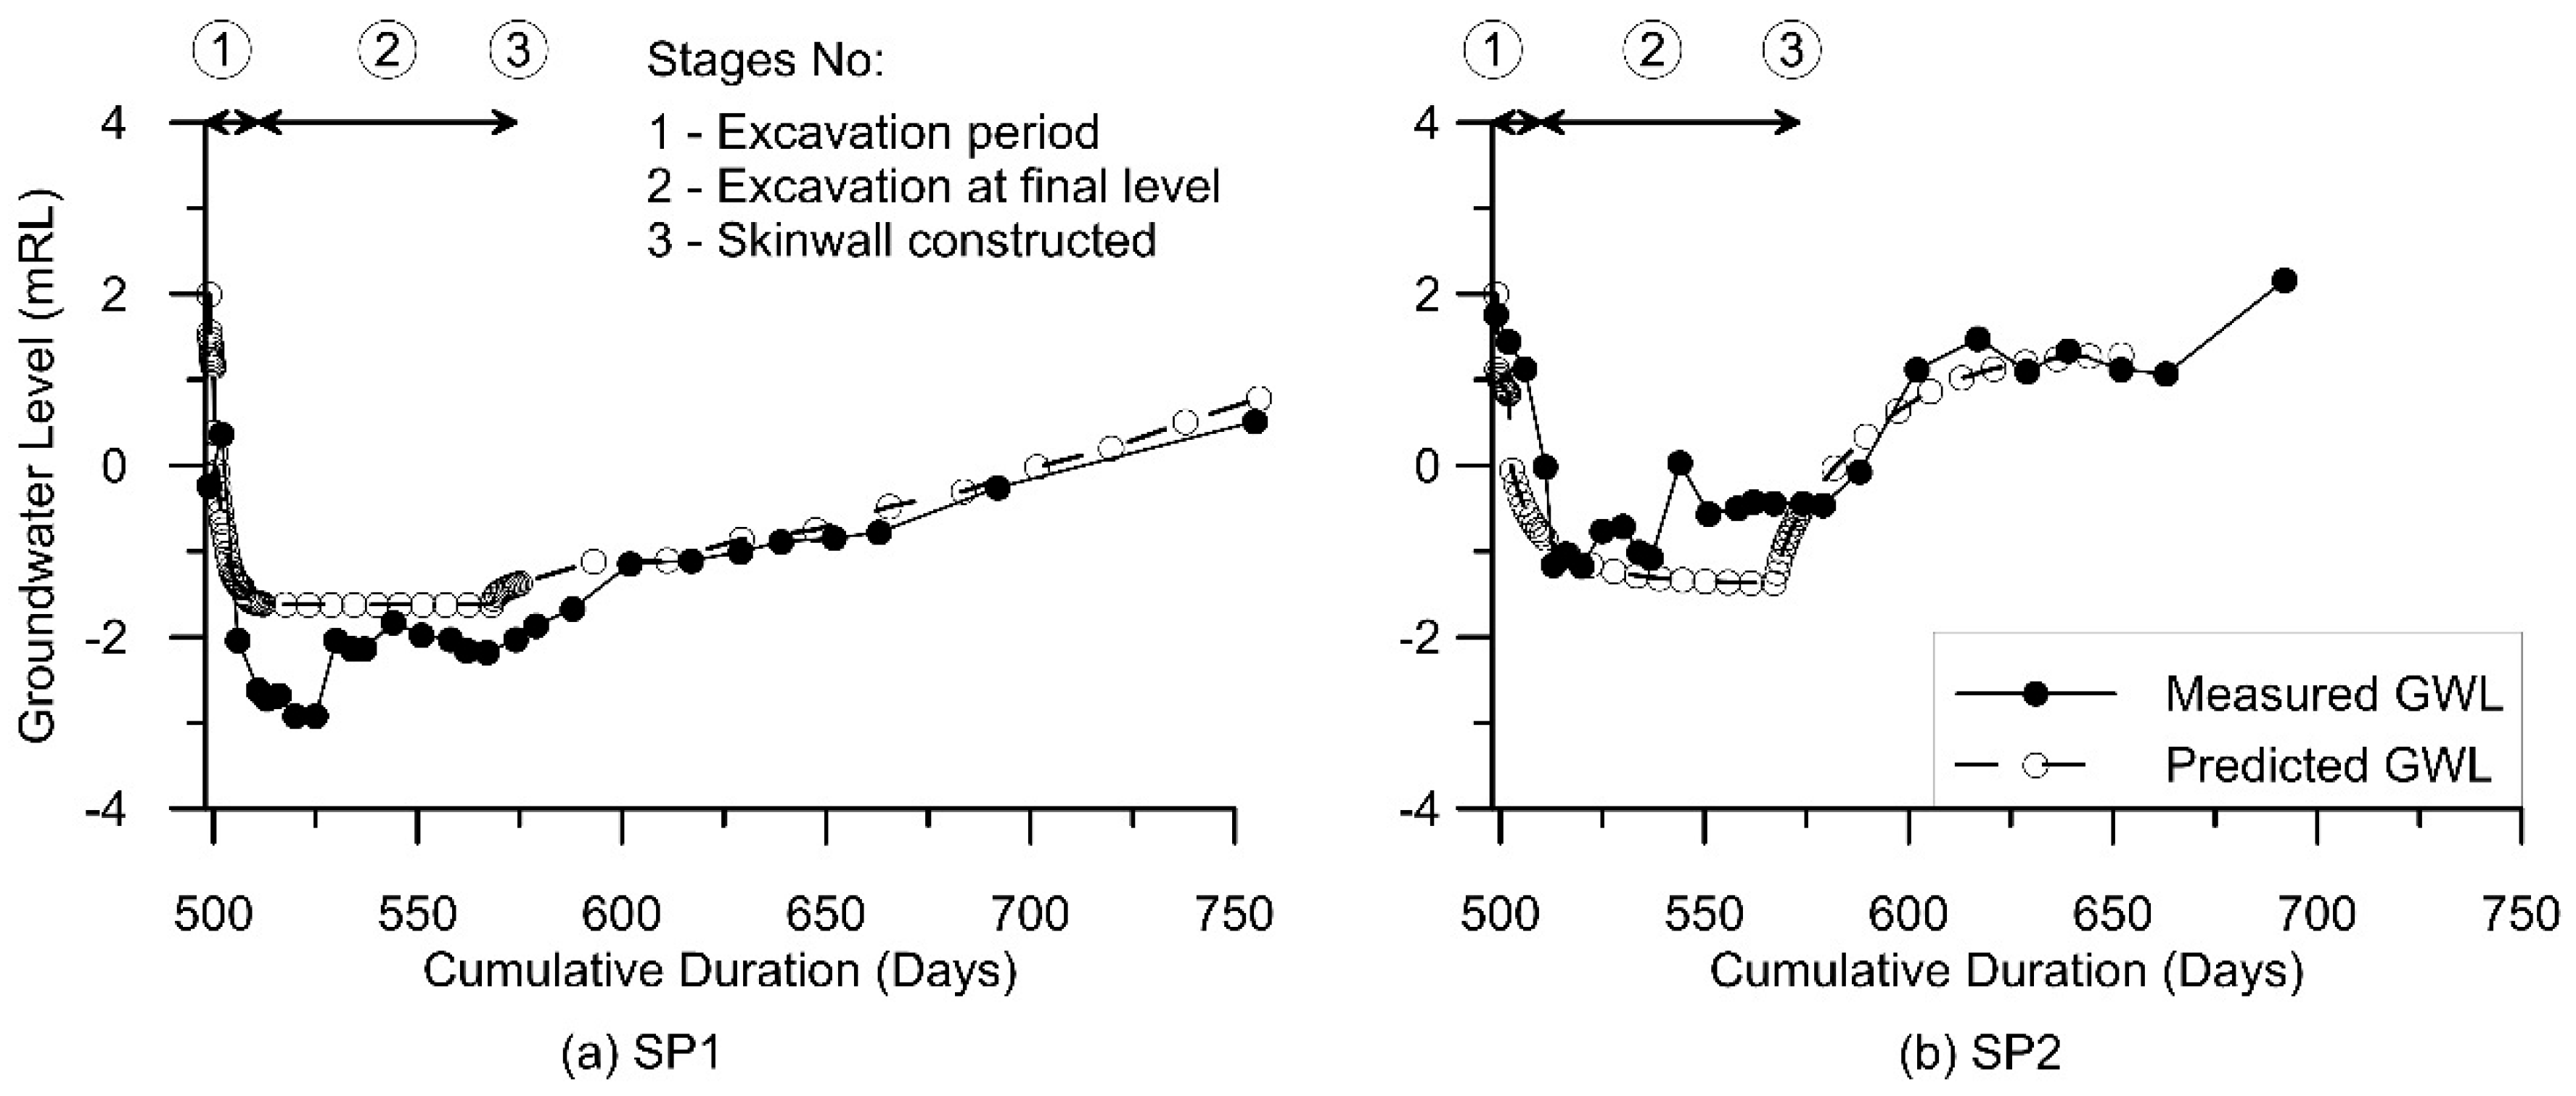
Figure 12.
SEEP/W predicted groundwater levels at the main basement excavation using equivalent permeability technique for (a) CBP465, (b) CBP506, (c) CBP465, and (d) CBP506.
Figure 12.
SEEP/W predicted groundwater levels at the main basement excavation using equivalent permeability technique for (a) CBP465, (b) CBP506, (c) CBP465, and (d) CBP506.
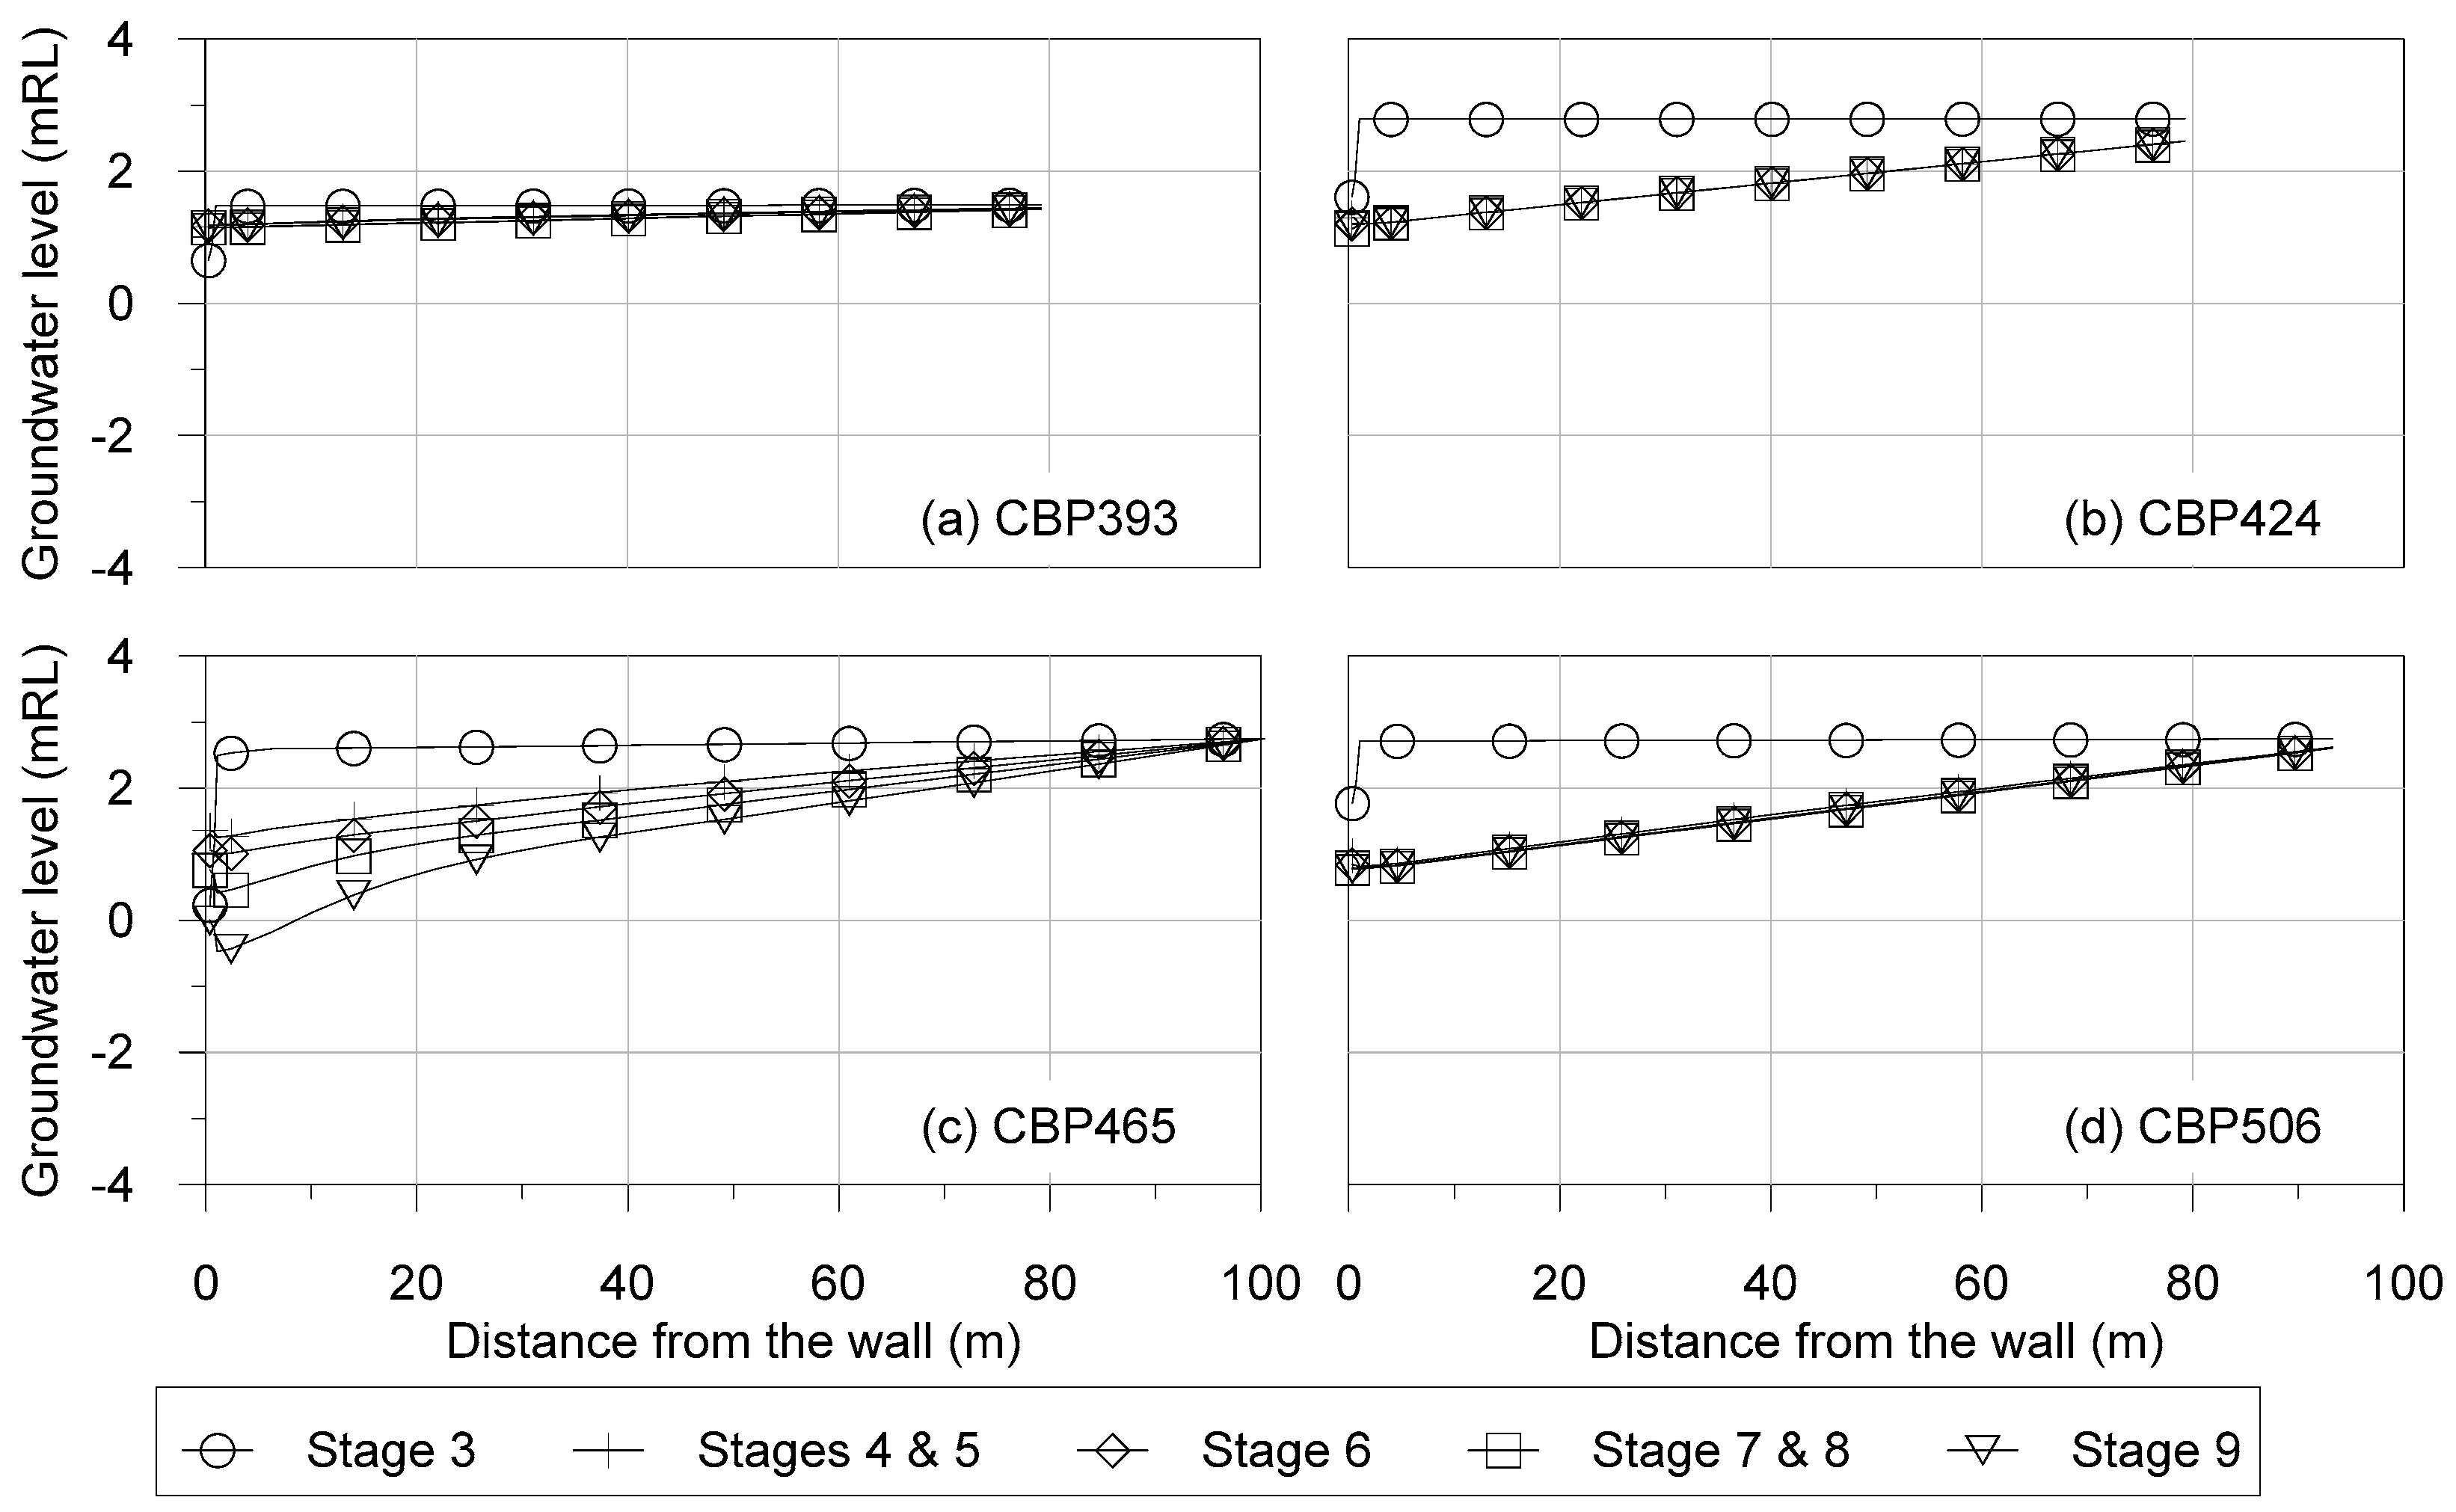
Figure 13.
Atypical model of the Z-water table method, represented by the blue mesh phreatic surface using PLAXIS 3D.
Figure 13.
Atypical model of the Z-water table method, represented by the blue mesh phreatic surface using PLAXIS 3D.

Figure 14.
Capping beam represented with (a) line load and (b) point load in PLAXIS 2D.
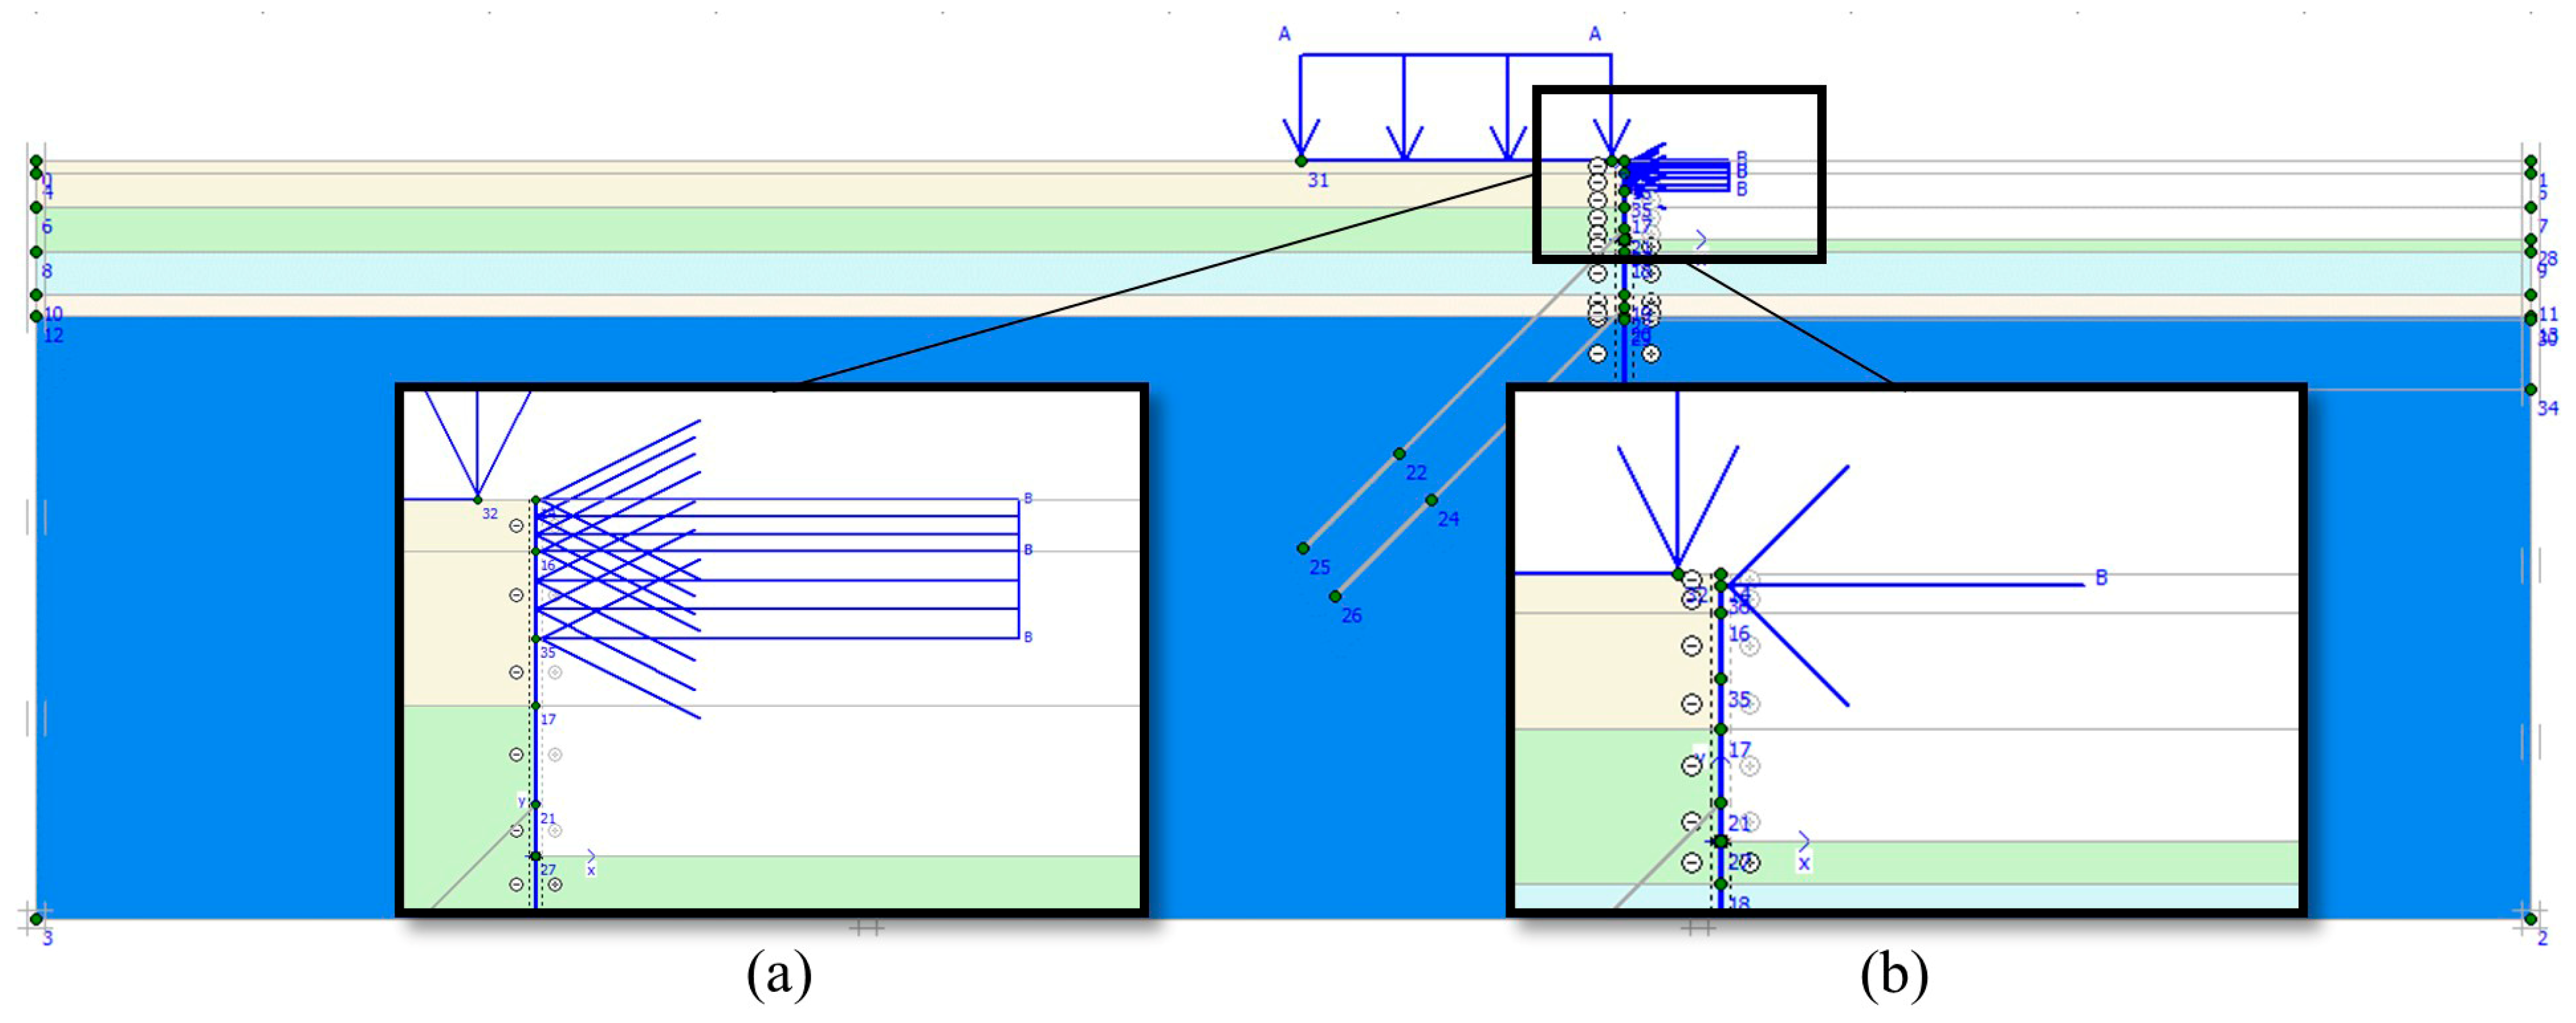
Figure 15.
Relationship for modeling capping beam technique between line load and point load.
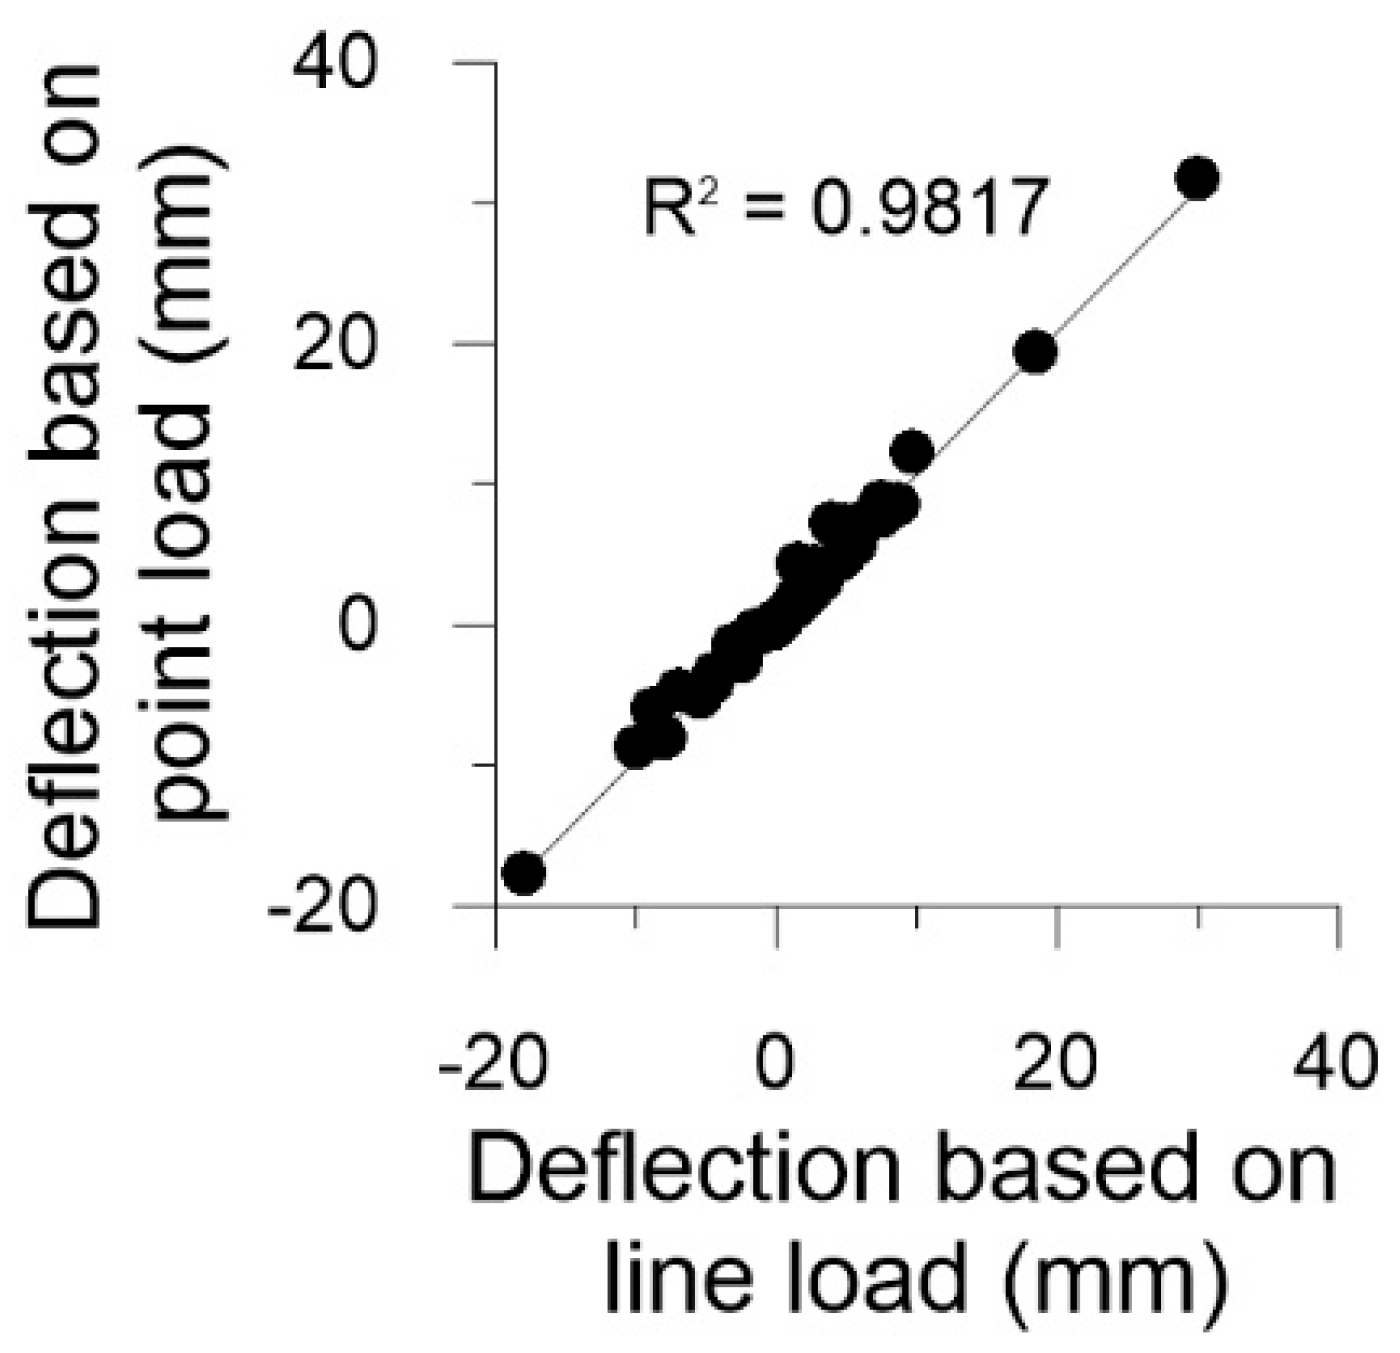
Figure 16.
Typical outcomes of geology-sensitive parametric studies performed to study the effect of real-life capping beam restraining loads on the continuous CBP wall for Stages 3, 6, and 9 at CBP465.
Figure 16.
Typical outcomes of geology-sensitive parametric studies performed to study the effect of real-life capping beam restraining loads on the continuous CBP wall for Stages 3, 6, and 9 at CBP465.
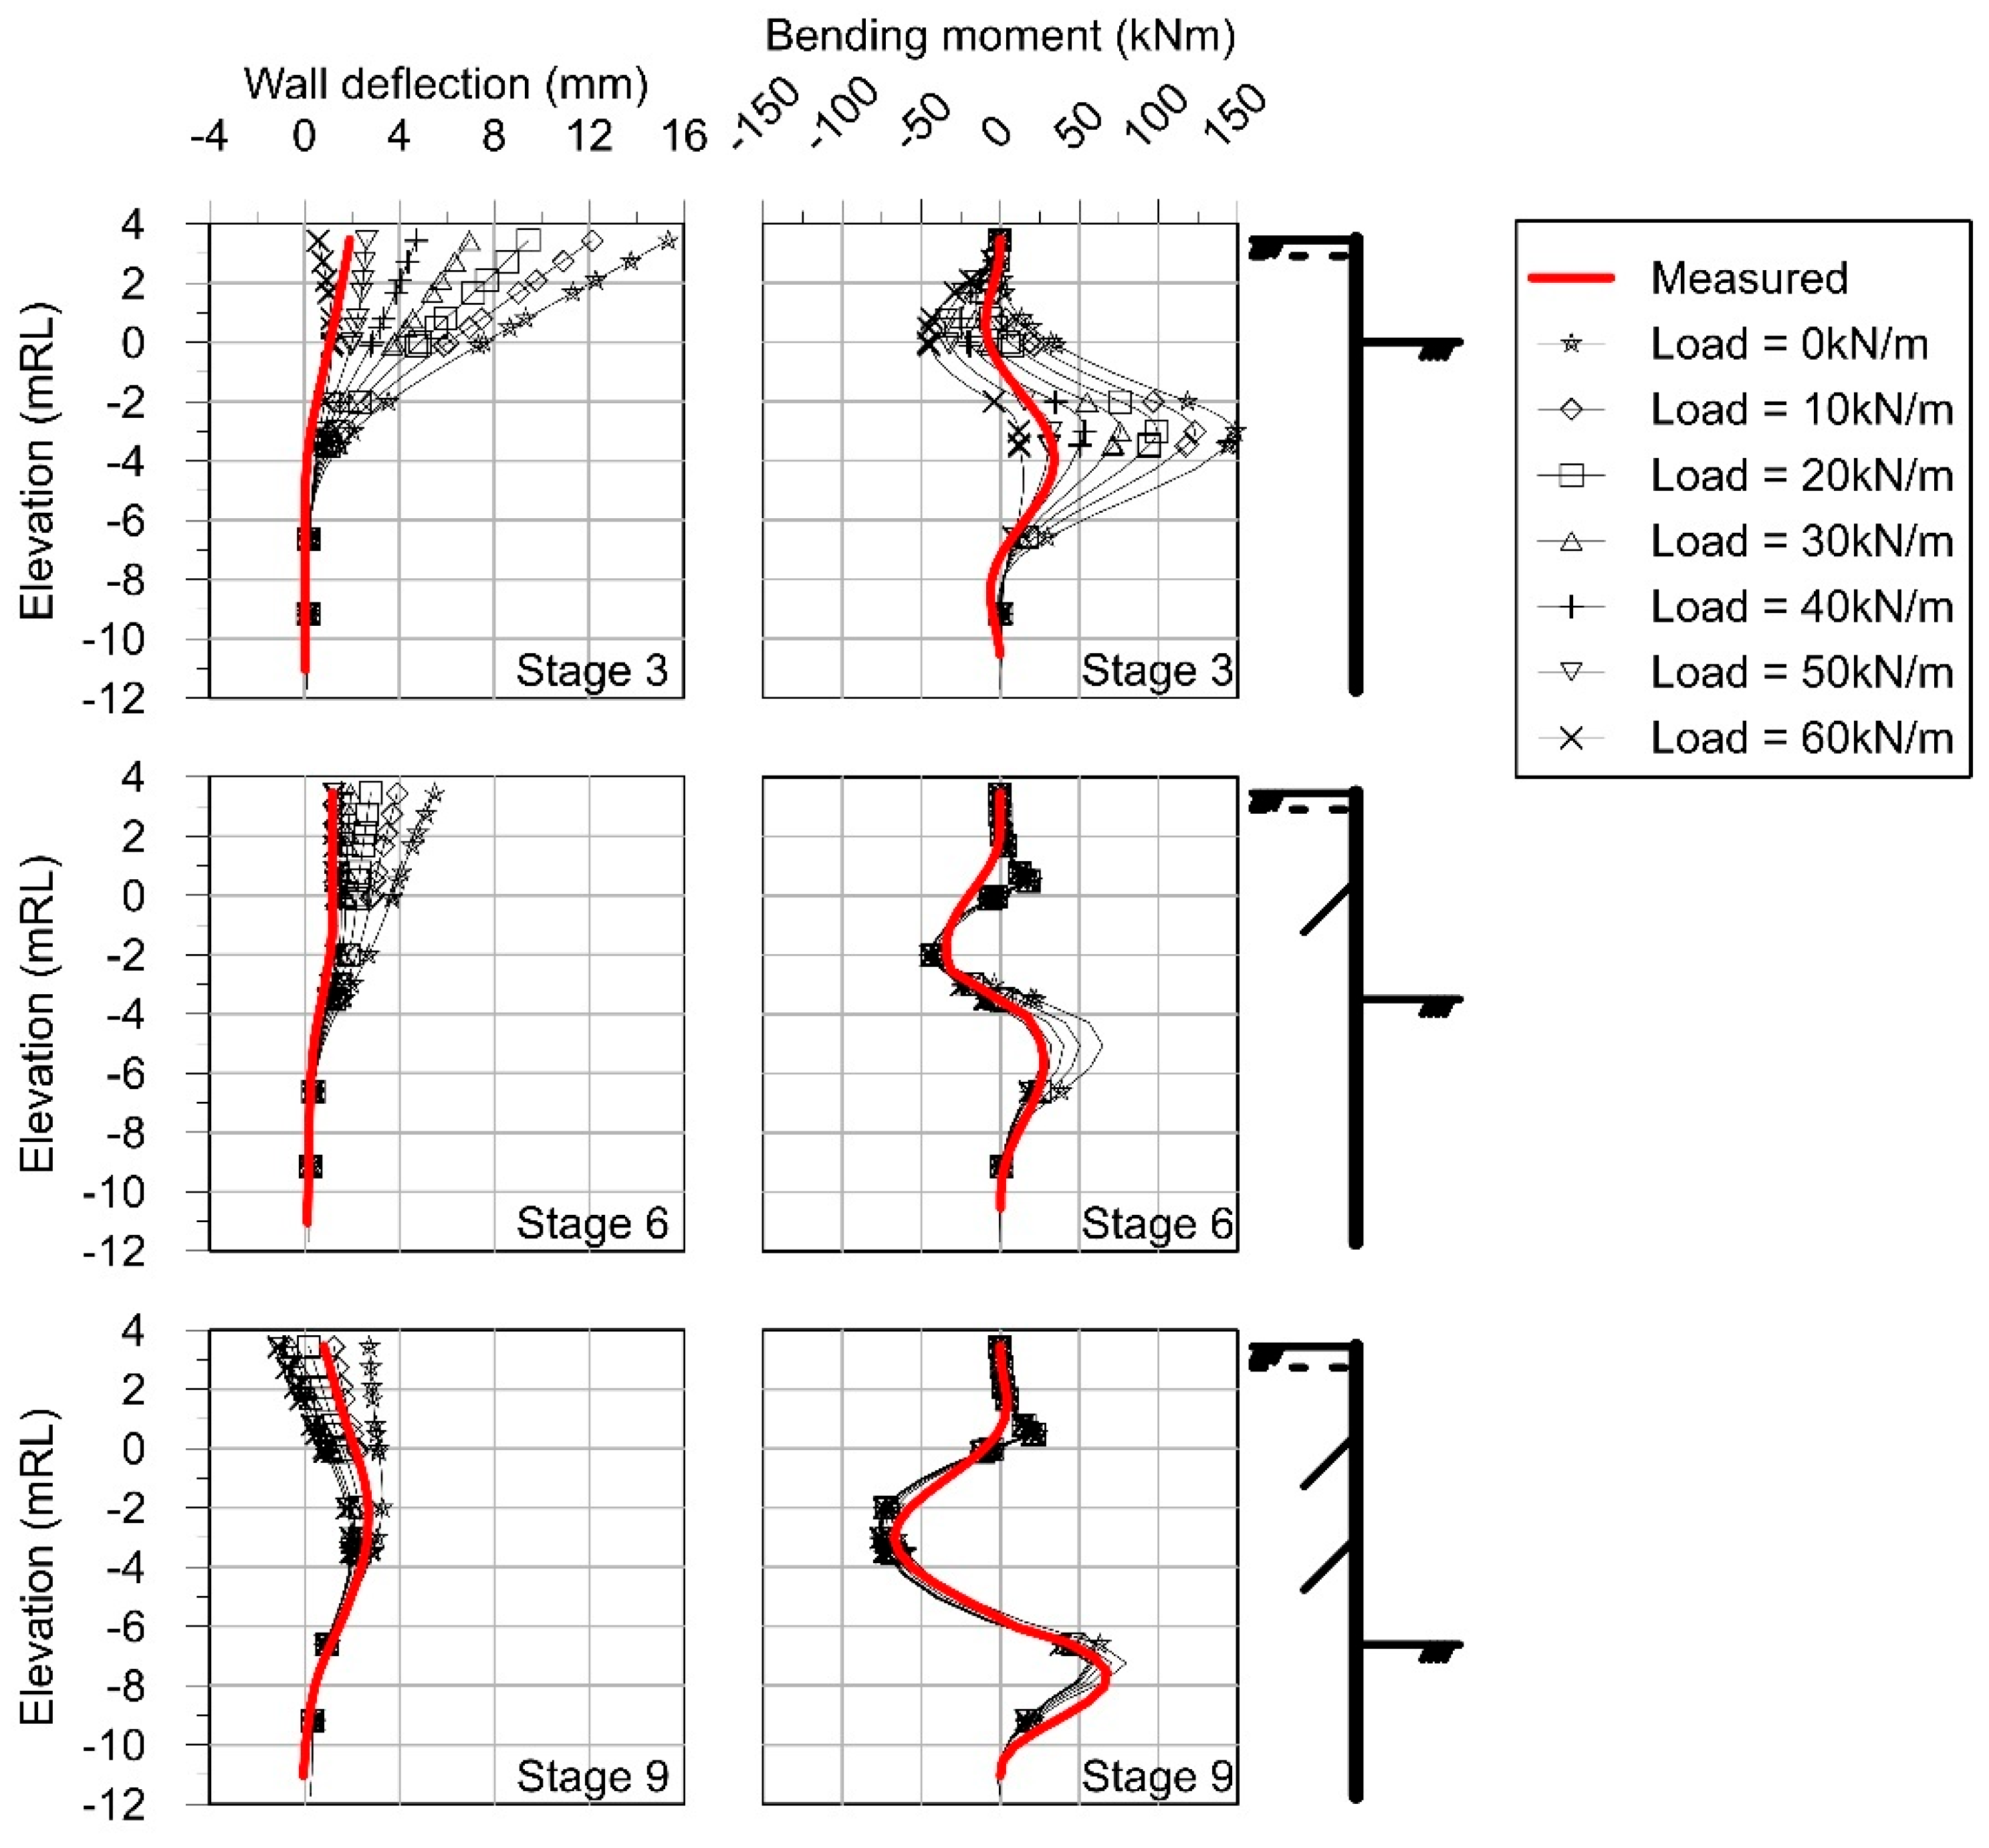
Figure 17.
Field measured versus predicted wall deflection and bending moment profiles, considering groundwater drawdown due to ground anchor puncturing for (a) CBP 393, (b) CBP424, (c) CBP465, and (d) CBP506.
Figure 17.
Field measured versus predicted wall deflection and bending moment profiles, considering groundwater drawdown due to ground anchor puncturing for (a) CBP 393, (b) CBP424, (c) CBP465, and (d) CBP506.
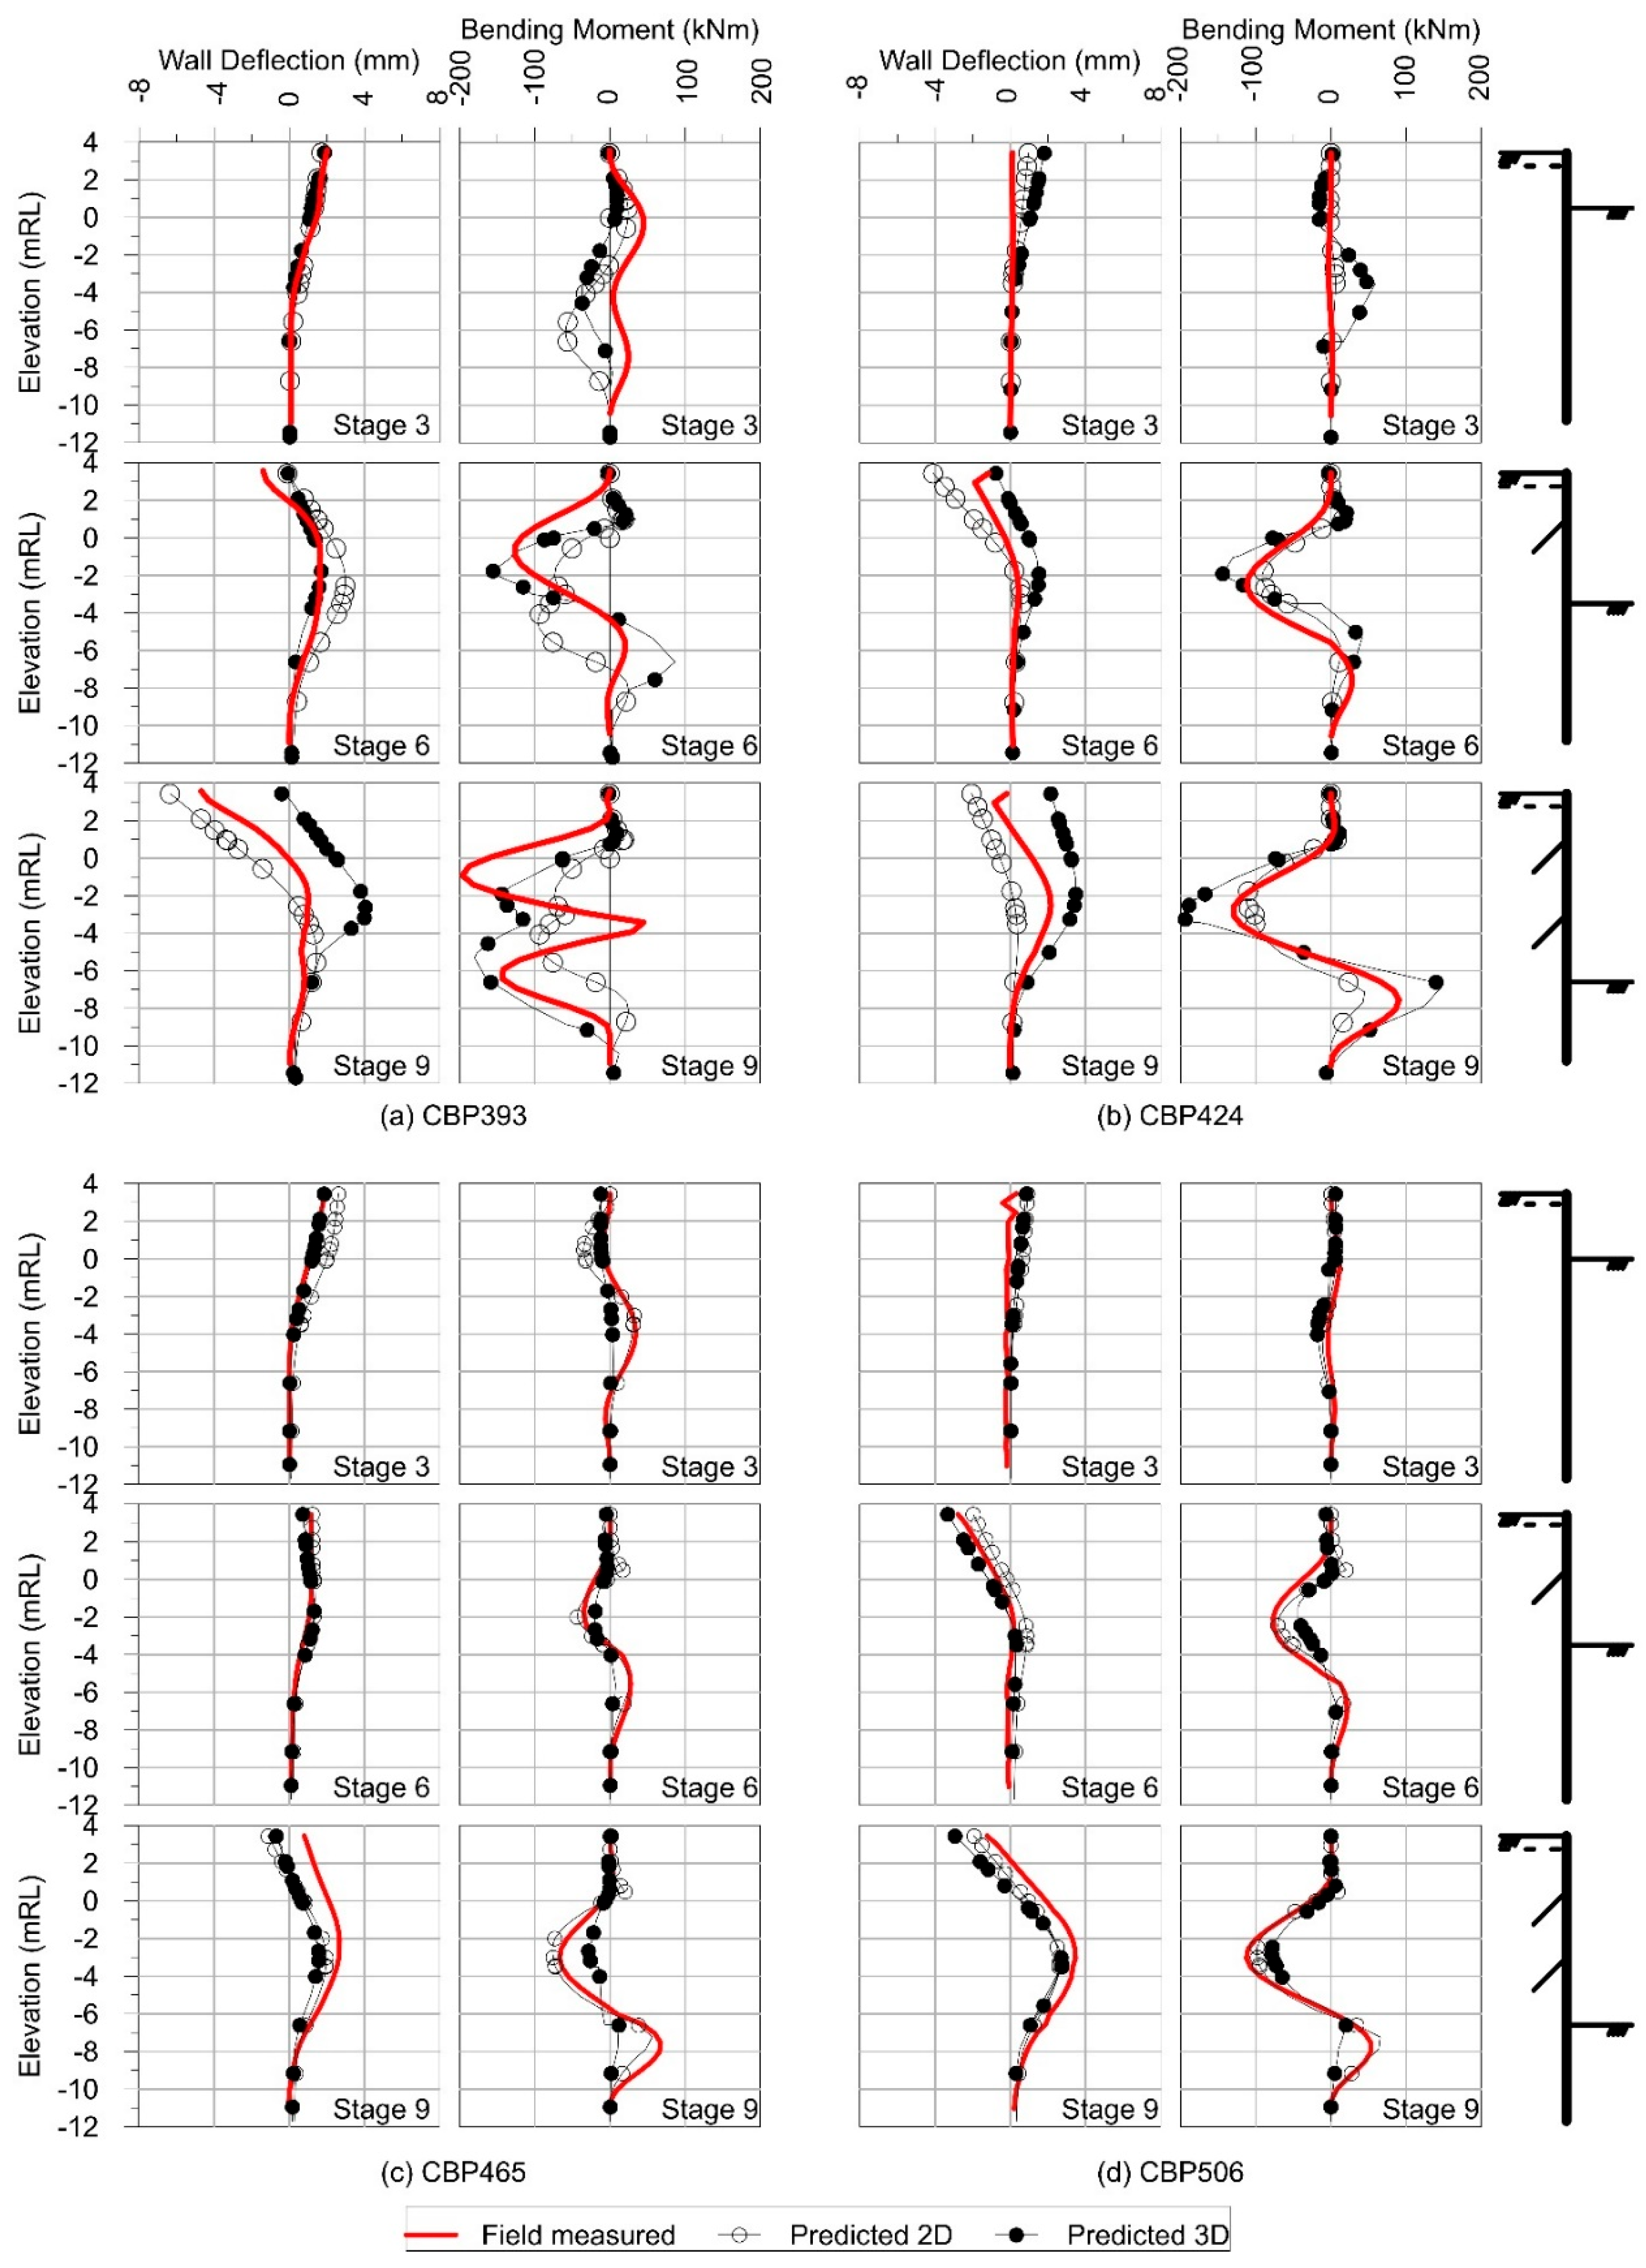
Figure 18.
Field measured building and ground settlement markers (BM and GM) versus predicted ground settlement using 2D and 3D models for (a) CBP393, (b) CBP424, (c) CBP465 and (d) CBP506.
Figure 18.
Field measured building and ground settlement markers (BM and GM) versus predicted ground settlement using 2D and 3D models for (a) CBP393, (b) CBP424, (c) CBP465 and (d) CBP506.

Table 1.
Construction activities and sequence.
| Stage | Construction Activity | Cumulative Days | |
|---|---|---|---|
| Wall E | Wall F | ||
| 1 | Installation of CBP Wall | 144 | 160 |
| 2 | Casting of Pile Capping Beam | 250 | 259 |
| 3 | Excavation to 0.5 m below GA1 (B1) (RL +0.5 m) | 292 | 309 |
| 4 | Installation of the first level of ground anchor (GA1) (RL +1.0 m) | 299 | 324 |
| 5 | Stressing of the first level of ground anchor (GA1) | 315 | 337 |
| 6 | Excavation to 0.5 m below GA2 (B2) (RL −3.5 m) | 320 | 345 |
| 7 | Installation of the second level of ground anchor (GA2) (RL −3.0 m) | 344 | 365 |
| 8 | Stressing of the second level of ground anchor (GA2) | 365 | 189 |
| 9 | Excavation to the formation level (B3) (RL −6.6 m) | 373 | 380 |
Table 2.
Geological properties for Mohr–Coulomb models.
| Material | SPT ‘N’ | γ (kN/m3) | E′ (kN/m2) | ν | c′ (kPa) | ϕ′ (°) | Ψ″ (°) | k (m/s) |
|---|---|---|---|---|---|---|---|---|
| Very soft silt | 0–4 | 18 | 5217 | 0.3 | 1 | 22 | 0 | 1 × 10⁻⁶ |
| Firm silt | 5–10 | 18 | 6957 | 0.3 | 5 | 30 | 0 | 1 × 10⁻⁶ |
| Hard silt | >35 | 18 | 86,957 | 0.3 | 15 | 32 | 2 | 1 × 10⁻⁶ |
| Very loose sand | 0–4 | 17 | 5217 | 0.3 | 1 | 28 | 0 | 1 × 10⁻⁴ |
| Medium-dense sand | 10–30 | 18 | 6957 | 0.3 | 1 | 30 | 0 | 1 × 10⁻⁴ |
| Dense sand | >35 | 18 | 86,957 | 0.3 | 15 | 32 | 2 | 1 × 10⁻⁴ |
| Phyllite | >50 | 22 | 250,000 | 0.3 | 45 | 46 | 16 | 1 × 10⁻⁸ |
Table 3.
Properties of CBP walls for use in PLAXIS 2D and 3D models.
| Parameter | PLAXIS 2D | PLAXIS 3D |
|---|---|---|
| Element | Plate | Plate |
| Material behavior | Elastic | Elastic |
| Equivalent thickness, deq (m) | 0.606 | 0.606 |
| Unit weight, g (kN/m3) | - | 6 |
| Young’s modulus, Ep (kN/m2) | 2.8 × 10⁷ | 2.8 × 10⁷ |
| Poisson’s ratio, ν | 0.15 | 0.15 |
| Axial stiffness, EpAp (kN/m) | 1.44 × 10⁷ | - |
| Bending rigidity, EpIp, (kNm2/m) | 4.40 × 10⁷ | - |
| Weight, w (kN/m/m) | 1.290 | - |
Table 4.
Properties of the node-to-node free length ground anchor.
| Axial Stiffness, EaAa (kN) | Centre-to-Centre Spacing (m) | Pre-Stress Force (kN/m) |
|---|---|---|
| 2.289 × 10⁵ | 2.25 | 293 |
Table 5.
Properties of 6 m grouted ground anchor fixed length with 6 15.24 mm dia. strands.
| Parameter | PLAXIS 2D | PLAXIS 3D |
|---|---|---|
| Element | Geogrid | Embedded pile |
| Axial stiffness, EbAb (kN/m) | 2.20 × 10⁵ | - |
| Material behavior | Elastic | Elastic |
| Young’s modulus, Ea (kN/m2) | - | 2.8 × 10⁷ |
| Unit weight, g (kN/m3) | - | 24 |
| Pile type | - | Predefined massive circular pile |
| Diameter (m) | - | 0.15 |
| Skin friction distribution | - | Linear |
| Skin resistance at the top of the embedded pile, Ttop,max (kN/m) | - | 293.0 |
| Skin resistance at the bottom of the embedded pile, Tbottom,max (kN/m) | - | 0 |
| Base resistance, Fmax | - | 0 |
Disclaimer/Publisher’s Note: The statements, opinions and data contained in all publications are solely those of the individual author(s) and contributor(s) and not of MDPI and/or the editor(s). MDPI and/or the editor(s) disclaim responsibility for any injury to people or property resulting from any ideas, methods, instructions or products referred to in the content. |
© 2023 by the authors. Licensee MDPI, Basel, Switzerland. This article is an open access article distributed under the terms and conditions of the Creative Commons Attribution (CC BY) license (https://creativecommons.org/licenses/by/4.0/).
Share and Cite
MDPI and ACS Style
Ong, D.E.L.; Chong, E.E.M. Soil–Structure Interactions in a Capped CBP Wall System Triggered by Localized Hydrogeological Drawdown in a Complex Geological Setting. Geosciences 2023, 13, 304. https://doi.org/10.3390/geosciences13100304
AMA Style
Ong DEL, Chong EEM. Soil–Structure Interactions in a Capped CBP Wall System Triggered by Localized Hydrogeological Drawdown in a Complex Geological Setting. Geosciences. 2023; 13(10):304. https://doi.org/10.3390/geosciences13100304
Chicago/Turabian StyleOng, Dominic Ek Leong, and Elizabeth Eu Mee Chong. 2023. "Soil–Structure Interactions in a Capped CBP Wall System Triggered by Localized Hydrogeological Drawdown in a Complex Geological Setting" Geosciences 13, no. 10: 304. https://doi.org/10.3390/geosciences13100304
Note that from the first issue of 2016, this journal uses article numbers instead of page numbers. See further details here.