

3D Bayesian Inversion of Potential Fields: The Quebec Oka Carbonatite Complex Case Study

1
Geomatics Research & Development s.r.l., c/o ComoNExT, Via Cavour 2, 22074 Lomazzo (CO), Italy
2
Dipartimento di Matematica e Geoscienze, Università degli studi di Trieste, Piazzale Europa 1, 34127 Trieste, Italy
*
Author to whom correspondence should be addressed.
†
These authors contributed equally to this work.
Geosciences 2022, 12(10), 382; https://doi.org/10.3390/geosciences12100382
Submission received: 22 June 2022
/
Revised: 29 September 2022
/
Accepted: 4 October 2022
/
Published: 13 October 2022
(This article belongs to the Topic Potential Fields for Solid Earth and Exploration Geophysics)
Abstract
:Potential fields methods, based on the exploitation of gravity and magnetic fields, are among the most important methods to recover fundamental information on the Earth crust structure at global, regional and local scales. The bottleneck for this kind of geophysical methods is often represented by the development of ad-hoc techniques to fully exploit the available data. In fact, each different technique can observe the effect of a single property of the subsurface and when we want to estimate this property from the observed field (the so-called inverse problem), several problems such as non-uniqueness and instability arise. A possible solution to these problems consists in jointly inverting, in a consistent way, different observed fields, possibly also incorporating all the available geological constraints. In the current work, we present an innovative Bayesian algorithm aimed at performing a full 3D joint inversion of gravity and magnetic fields constrained by geological a-priori qualitative information. The algorithm is tested on a real-case scenario, namely, a local study to estimate a complete 3D model of the Oka carbonatite complex. This complex is a composite pluton in Quebec (Canada), important for mining operations related to critical raw material such as Niobium and other rare earth. This example shows the reliability of the developed inversion algorithm and gives hints on the fundamental role that potential fields can play in mining activities.
1. Introduction
The inversion of potential fields, namely, gravity and magnetic, is commonly used to infer specific characteristics of the Earth lithosphere. In particular, gravity inversion consists of the determination of the mass density distribution producing a given gravitational signal. Magnetic inversion instead can be exploited to model the magnetic susceptibility distribution that generates a certain anomalous magnetic signal. From the mathematical point of view, inversion is an ill-posed problem presenting two main issues [1,2,3]: the solution of the inverse problem is not unique (there are many different density/magnetic susceptibility distributions generating the same response) and is unstable (a small difference in the observed signals can lead to a significantly different distribution of the sought property).
Different solutions have been developed in order to solve the gravity and magnetic inverse problems. Among others, we recall here the classical algorithm from Li and Oldenburg. Published in 1996 [4] for magnetic and in 1998 [5] for gravity data, it is a full 3D algorithm to solve the linear inverse problem of estimating the magnetic susceptibility or the density distribution in a given region. In the Li-Oldenburg algorithm, the non-uniqueness of the solution is mitigated by minimising, together with the residuals with respect to the observed gravitational field, also the directional derivatives of the density volume in a Tikhonov fashion [6]. Li and Oldenburg also introduced a weighting function in order to prevent the concentration of the density variations close to the surface (minimum energy solution). The strong point of the method is that it represents a 3D inversion scheme but it has also several cons: the choice of minimising the directional derivatives leads to smooth solutions (erasing the sharp discontinuities between different lithological units) and, moreover, the depth weighting function has to be determined in an empirical way [5]. For both these aspects, over the years, many contributions have tried to improve this algorithm both regarding the mass concentration and the criteria to choose the weighting function (see, for instance, [7] and the references therein).
When considering the joint gravity and magnetic inversion, the link between mass density and magnetic susceptibility has to be added into the modelling. This is a hard task usually carried out in different ways: either evaluating possible cross-correlations between the two quantities (see e.g., [8] and references therein) or by establishing empirical relationships between two or more physical parameters (these are the so-called petrophysical methods [9]) or through the introduction of geological constraints. A review of the pro and cons of the first two methods is reported in [9], while in the following we will focus on the last methodology. In this respect, we recall here the pioneering works of [10], where the authors used the generalised inverse method to estimate the shape of causative bodies in a 2.5-D model (i.e., supposing the model parameters to be constant in one of the planar directions), fixing densities and susceptibilities. In a later work [11], the authors used a similar approach to invert for densities, susceptibilities and the vertices of 2.5-D bodies. The authors of [12] instead developed a first algorithm for 3D joint inversion and the authors used geological constraints to reduce the space of the solutions and the steepest descent algorithm to find the result minimising residuals with respect to the observed fields and which is close to the a-priori model. In 2006, [13] formalised the joint inverse problem in statistical terms by means of the Bayes theorem. In their work, the authors used a Monte Carlo inversion method to estimate 3D model parameters computing their posterior probabilities. The main disadvantage of this methodology is that it requires the complete a-posteriori probability, thus de-facto allowing the inversion of simplified small problems only. Following the approach described in [13], several other methodologies have been developed, e.g., [14,15]; however, the reported examples are usually limited to extremely simplified models and to the study of very localised anomalies.
In the present work, the 3D Bayesian gravity-only inversion algorithm, presented in [3,16,17] and tested in several synthetic and real-case scenarios [18,19,20], is extended to allow also for magnetic only or joint gravity and magnetic inversions. In Section 2, the new elements introduced in the inversion algorithm are presented, while in Section 3 the joint inversion is applied to a real case study on the Oka carbonatite complex (Quebec, Canada). Finally, Section 4 summarises the major conclusions and principal results.
2. Bayesian Inversion of Potential Fields Algorithm
The most challenging aspect of the proposed inversion regards the possibility to estimate, at the same time, the 3D density and magnetic susceptibility distributions and the geometrical shapes of main geological units in the given region, the latter defined by means of a discrete variable (that we will call “label”). Therefore, we have to deal in the inversion with both continuous (density and susceptibility distributions) and discrete unknowns. The Bayesian approach, allowing the connection of the different quantities by means of statistical inference [21], seems to be the most appropriate technique to solve the problem. In our proposed method, the studied volume is divided into a set of volumetric elements (voxels): we will suppose to work in planar approximation dividing the volume into right rectangular prisms. However, the proposed method can easily be adapted in case of a spherical approximation with voxels made by tesseroids. For each voxel , with index , we define three unknown parameters, namely, its density , its magnetic susceptibility and its label . This last variable is used for assigning to a certain geological unit, chosen from an a-priori set (e.g., water, sediment, salt, crust, etc.). As mentioned before, and are continuous variables, while is a discrete one among the M integers denoting the various materials present in the studied volume. We will call the set of all the unknown parameters, namely, . We suppose that information on is, in general, available from different sources: in fact, studying a certain area, a geologist generally builds up a complex model considering a lot of different information, at different scales and with different levels of confidence. Typical sources can be: regional studies, regional maps, scientific publications, seismic images (2D profiles or 3D volumes), seismic velocities (2D–3D, reflection–refraction), well logs, etc. A compilation of all this information can be summarised in terms of an a-priori 3D structural model. Moreover, in agreement with geologists, it is possible to introduce information on the level of uncertainty about this initial model that can be used to build an a-priori probability function for the unknown parameters . Note that, if no a-priori information is available, we can always relay on global models for the major layers (i.e., basement and Moho) or even suppose just one label on the whole cube supposing a certain range of variability for both density and susceptibility.
Once is set, we can exploit the Bayes theorem in its classical form [22]:
to obtain the posterior distribution of , given the observations . In Equation (1), represents the likelihood, i.e., the probability of observing given , or, in other words, the compatibility of the evidence with the given hypothesis.
In the following subsections, we will formalise and for the proposed inverse problem, we will compute and, finally, we will present a solution to find the set maximising the posterior distribution.
2.1. The Prior Probability
As stated above, the prior probability density function , namely , should represent the prior knowledge about our 3D volume. The simplest way to formalise is to decompose the whole probability density function into different factors according to the rule of conditioned probability:
Even more, we suppose that and are statistically independent, so that Equation (2) is further simplified in:
meaning that, once a label has been chosen for the voxel , the corresponding density and susceptibility follow the laws and , which in our case are truncated normal distributions:
where the characteristic function truncates the distribution between and . An analogous term is written for .
In Equation (4), the mean and the variance represent the expected density of and its variability for the label ℓ. Basically, they are the link between label and density, and are given in terms of geological a-priori information. Similar is the expected magnetic susceptibility and its variability . Note also that the relation between and is introduced by .
The independence between and introduced in Equation (3) basically means that it is not expected that there is a relation between density and magnetic susceptibility inside a specific geological unit. We did not find proof of such a relation in the literature. The correlation between density and susceptibility is useful instead when geological units are not explicitly modelled in the inversion (as in [8,9]). In this case, in fact, variations in density can be reflected in variations in susceptibility since they are implicitly subtended by a variation in the material.
As for , we assume a Gibbs distribution [23]:
where the energy depends on the values provided by the a-priori geological model for each label and from cliques [24] of order two expressing the fact that the value of is more likely to be equal to the value of the labels of the nearest neighbour voxels according to the following rules:
where and are parameters to be empirically tuned and, considering the voxel , the neighbourhood of the voxel ,
defined by the cliques of order two, as mentioned above.
2.2. The Likelihood
The likelihood distribution is defined by assuming that the observation noise is normally distributed. We define the vector of gravity anomalies observations , its noise covariance matrix , the forward modelling operator from densities to gravity anomalies and the vector composed by the set of densities . In a similar way, we also define the vector of total magnetic intensity anomalies observation , its noise covariance matrix , the forward modelling operator from magnetic susceptibility to total magnetic field intensity and the vector composed by the set of susceptibilities . Thanks to the assumptions of statistical independence between the uncertainties of gravity and magnetic methods, the joint likelihood can be modelled again as the product of the likelihood of each geophysical method, thus obtaining:
2.3. The Posterior Probability
The posterior distribution is computed by means of Equations (1), (4), (6) and (9):
where we used the subscript ℓ to indicate the dependency of the variable from . Equation (10) is highly non-linear, non-convex and contains a huge number of unknowns, so it is particularly difficult to be sampled or even plotted. Due to these factors, the chosen solution is to find the set of parameters , and maximising the posterior distribution. We observe that, modelling the whole volume with just a unique label, in absence of prior information, is equivalent to removing Equation (5) from Equation (10), thus obtaining the new posterior function:
The maximisation of Equation (11) has the form of a regularised least squares adjustment and gives a solution comparable to that obtained by classical Li–Oldenburg algorithms [3].
To close this section, we want to mention that several other qualitative geological constraints can be added in the inversion (both in a deterministic or probabilistic way). Just to give a few examples, we can force an increasing density with depth or we can impose contacts between different geological horizons or the presence of a layered volume, etc., depending on the different case studied.
2.4. Maximum a-Posteriori by Monte Carlo Methods
In the previous sections, we retrieved the expression for the posterior probability (Equation (10)), and, due to its characteristics, we chose to find only the set of unknown parameters which maximise it. This will be performed by means of a simulated annealing algorithm (SA) combined with a Gibbs sampler [16]. In fact, the SA provides a mechanism to escape local minima, thus finding the global optimum a posteriori [25], while the Gibbs sampler allows to simplify the sampling of the joint distribution [24]. To find the aaximum a posteriori (MAP), we start by defining the target function as the opposite of the logarithm of the posterior distribution:
as a consequence, the MAP problem is translated into a minimisation one, suitable for the simulated annealing. The probability density function to be sampled in the simulated annealing procedure is:
where is a normalisation constant, and T is the simulating annealing temperature. In order to sample , the Gibbs sampler is introduced. The advantage of the Gibbs sampler is that it allows sampling a multidimensional random variables by drawing samples from its conditional probability distributions. In the proposed solution, at each step of the iterative procedure a sample of the set label-density-susceptibility for the voxel i is drawn from their conditional distributions . Here, , and represent all the density and labels apart from those related to the voxel i. This is a three-dimensional conditional probability that can be decomposed into the product between the conditional probability of the density given the label , of the susceptibility given the label and of the marginal probability of the label , namely:
where again the statistical independence between density and susceptibility has been exploited.
Therefore, the three-dimensional joint probability of label density and susceptibility shown in Equation (14) can be sampled by first drawing a sample from the label marginal distribution and then, according to the extracted label value, from the density and susceptibility conditional ones and . This procedure can be repeated iteratively for all the voxels, updating each time the previous parameters realisation. Once all the voxels are updated, the temperature is slowly decreased and a new stage of the Gibbs sampler is started again, as shown in the flow chart of Figure 1.
In detail, we select a geometrical cooling law for T with a variable cooling factor, namely, , where k is the simulated annealing iteration and the constants , a, b and c are estimated as described in [16]. For a more detailed description of the above optimisation algorithm, the interested reader can refer to Sections and of [3]. Since the sampling of , and is a random process, it is possible to repeat the simulated annealing procedure several times starting from different random seeds. This is equivalent to performing a set of independent inversions, each arriving to a slightly different 3D model (in principle) close to the actual absolute MAP. We call the solution of the inversion n for the voxel i. Analogously, we will have a set of and with and N the number of independent inversions performed. The final result is computed by taking the mode of the label of each voxel , and the average of the density and magnetic susceptibility considering only the solutions where .
Moreover, the frequency of with and the standard deviation of the extracted densities and susceptibilities, always considering only the solutions where , give a voxel-wise estimate of the accuracy of the retrieved model.
3. The Oka Case Study
As reported in the Introduction, the proposed optimisation algorithm has already been intensively tested for the gravity-only inversion. We propose here a real case study on the Oka carbonatite Complex in the Monteregian Igneous Province, Canada [26,27,28], to show the quality of achievable results.
3.1. The Oka Carbonatite COMPLEX
The Monteregian Igneous Province (MIP) is a large area in the south of Québec, Canada, which consists of nine alkaline intrusions and dikes arranged in an approximately east–west direction, starting 60 km west of Montreal, across St. Lawrence Lowland. Its characteristic quasi-linear trend suggests that the pluton positioning was controlled by a deep-seated fault [29]. Starting from the Easternmost intrusion, there is a progressive change from an area with an abundance of felsic rocks and quartz-satured rocks towards more westerly carbonatites complex with silica-undersaturated rocks, while content of Fe increase from west to east [29]. These differences in silica content between complexes arose because of the different periods of rock emplacements, occurring in two different magmatic events, from 117 to 141 Ma, and in response to an upward transport of a metasomatic fluids in mantle [30]. The Oka pluton is the westernmost and youngest complex in the entire MIP. The intersection of two different tectonic lineaments, the northwest trending Beauharnois arch and eastward trending faults associated with the Ottawa-Bonnechere graben, is thought to have constrained the emplacement of the complex [31]. Pluton is a bean-shaped body, composed in the central part by both carbonatite and Si-undersaturated rocks such as okaite, ijoite, alnoite, and jacupirangite [32], boarded by strongly metasomatized rocks (feniti), as usual with carbonatites bodies, and intruded in a Precambrian gneiss an anorthosites ground. Oka carbonatite are mainly a coarse-grained calcite-carbonatite, which under these conditions are called sovite. It is composed of a high percentage of calcite, and other accessories minerals such as apatite, biotite, wollastonite, magnetite, and pyrochlore. Presence of pyrochlore is very relevant as it is the main mineral from which Niobium is extracted. Mining activity, in fact, was carried out in the past in this area. Okaite is composed by a large volume of melilite, and a minor amount of apatite, biotite, perovskite, and magnetite. Ijolite includes a wide variety of mafic rocks and is composed essentially by nepheline and pyroxenes, while jacupirangite is made up of a great percentage of fassaite (a variety of augite, pyroxene) and other small percentages of nepheline and magnetite [32]. Carbonatite rocks and Okaite have the largest percentages of magnetite in their composition, so we imagine they are the most magnetized rocks in the complex. Jacupirangite is the rock with the major density, while for the carbonatite system, densities go from 2840 kg/m for sovite, which forms the biggest part of the complex, to 3410 kg/m for the magnetite-carbonatite [28].
3.2. The A-Priori Model
As stated in the previous section, the complex is made up of two close intrusive centres resembling a distorted figure-eight shape in plan view. Each centre has a central plug of carbonatite surrounded by alkalic silicate rocks and an aureole of fenitization of the gneissic country rocks. In order to build the a-priori model, in the absence of better knowledge, we started by adopting a simplified scheme (see Figure 2), according to [33], continued up to a depth of 10 km in a constant cylindrical way.
We suppose that each boundary between the different units can expand up to about 1 km or reduce to the boundary of the inner geological units. This will represent our a-priori information about the geometries. As for the a-priori densities and magnetic susceptibilities, they are supposed to be constant in the vertical direction with the value reported in Table 1 and Table 2.
We want to underline here that this simplified model represents the actual available information on the study volume. The inversion algorithm will modify the boundaries between the different geological units and will introduce voxel by voxel variations in the density and magnetic susceptibility coherently with the specified range of variability of each parameter.
3.3. Gravity and Magnetic Observations
Gravity and magnetic data were downloaded from the Natural Resources of Canada webpage [34]. In detail, considering gravity observations, we started from a set of point-wise ground Bouguer anomalies (corrected with a density value of 2670 kg/m), derived from several surveys and with accuracy ranging between and 5 mGal. We build a complete grid on the study area with a spatial resolution of 100 m × 100 m, together with its predicted accuracy (see Figure 3) by exploiting a least square collocation procedure (details can be found in [35]).
Looking to the gravity grid, it can be seen how it well represents the main geological units in the area: we can notice the low gravity in the northwest corner corresponding to the presence of light anorthosite and the high gravity due to the silicated rocks. Looking to the predicted accuracy, we can recognise regions where gravity observations are actually available (blue regions in the map) from regions where the grid has been interpolated. Note also that in the easternmost area data are missing, thus resulting in an inaccurate gravity estimate.
As for the magnetic field, an helicopter borne grid of total magnetic intensity anomalies at 137 m above sea level were used (Figure 4).
The original grid downloaded from [34] has a spatial resolution of 50 m m and comes from data acquired with line spacing of 200 m at a bearing of N16W [33]. In our work, the original grid was downsampled to a spatial resolution of 100 m.
In addition, in this case, the observations well correlate with the a-priori model, showing high magnetisation values for silicate. No information on the accuracy of the magnetic grid is provided by the Natural Resources of Canada webpage. The inducing magnetic field is computed from the CHAOS-7.8 model [36].
3.4. Inversion Results
Starting from the a-priori information described in Section 3.2, namely, geometries of the main geological units, average density and susceptibility and the corresponding expected accuracy, we are able to build the a-priori density and susceptibility cubes of our volume. In doing this, we considered a spatial resolution in the planar direction of about 100 m both in x and y. As for the vertical, we considered voxels with a thickness ranging between 50 m at the surface to 500 m at the base of the model, here fixed at a depth of 10 km for a total number of volumetric elements of corresponding to about unknowns. The discretization was assumed following the principles explained in [37], also extended to the magnetic field, here supposed to be known with an accuracy of 2 nT. The and parameters in Equation (10) were fixed at and by empirically equalising the order of magnitude of the different terms of Equation (10). As for the computational time, the inversion arrives at convergence after 200 iterations of the SA, taking about 10 hours on an Intel i3 8 Gb Ram computer. In order to estimate the accuracy, the SA optimisation was repeated 10 times starting from different random seeds; however, this is a parallel procedure which does not requires extra computational time if enough CPUs are available. Some tests have shown that down-sampling the problem to a resolution of 150 m or even to 200 m gives same major features in terms of results, reducing the computational time to about 2 h (for the 200 m resolution) with just a slightly worse fitting of the data in the high frequencies.
We report in Figure 5 the residuals for the gravity and magnetic fields of the a-priori (before applying the inversion) and of the a-posteriori (after applying the inversion) models.
What we can observe is that the inversion has been able to noticeably reduce the misfit with respect to the observed fields from mGal and 1130 nT of the a-priori model to mGal and 210 nT of the final solution. Focusing on the gravity residuals, we see that the residuals of the a-priori model are dominated by high negative values, close to the southernmost limit of the Oka formation and by a general southwest–northwest trend. These main characteristics have been properly corrected in the final results, which just shows two small anomalies, opposite in sign, in correspondence of the core and in the northern part of the carbonanite complex. In any case, we can see, comparing Figure 3 and Figure 5, that the obtained residuals are compatible with the predicted accuracy, namely, they are always smaller than the three times the standard deviation reported in the accuracy map.
As for the magnetic field, we can see that higher residuals of the a-priori model are found for the core and in the southernmost part of the complex and are remarkably reduced in the final results with very small features probably associated to detailed geology of the area. These residuals are indicative of a too poor a-priori modelling of that specific region. In this sense, our solution tends to force the cooperation between geophysicists and geologists for a good formalisation of the a-priori model and of the relative constraints. To improve the fitting of the magnetic fields, two possibilities can be foreseen: either to suppose, in contrast with the available geological information, a low magnetisation also in the sovite core, or to have a slightly less dense carbonatite core with the intrusion of more magnetised bodies. Small intrusions of few hundreds metres thickness magnetised silicate could, in principle, explain these residuals. However, this is something that can be hardly discriminated by potential fields alone without any constraints based on further geological or geophysical evidences.
Looking to the results in terms of geometries of geological units, we found a fanning of silicate and fenitized rocks in the shallowest part (up to a depth of about km) of the model. Here, the fenitized gneiss extension has been increased from about 100 m of the a-priori model to about 600 m. This is coherent with what is described in [38]. The inversion also slightly reduced here and there the silicate annular rings in favour of carbonatite and fenitized gneiss. Figure 6 shows the density and susceptibility distribution obtained by the joint inversion at 1 km depth.
We can notice in both the maps the presence of well-defined sharp variations in the specific property at the boundary of different geological units. Looking to the density maps, we can also see high density values (of about 3000 kg/m) in the northern part of the complex that can be associated to the presence of the okaite series while, when moving south, lower density values around 2900 kg/m are found in correspondence of the melteigite-urtite series. This corresponds well to the detailed geological maps and to our knowledge of the detailed geological formations retrieved from tje literature (which foresees densities of 2970 kg/m and 2880 kg/m; see [27]). The estimated sovite density is of about 2860 kg/m, which is again well-aligned with the literature (see, e.g., [39]). Looking to the susceptibility map, we can observe how the inversion predicts significant susceptibility only in the silicate rocks with values radially decreasing from the core of the anomaly. Figure 7 shows some slices of the full 3D density model.
We can observe from the figure that the Oka complex extends downwards in a cylindrical way for at least 10 km and possibly more. Okaite seems to be present only in the first few kilometres (up to a depth of 2 km), while fenitized rocks slightly decrease their thicknesses with depth and disappears at a depth of about 4 km. The Bayesian inversion also allows obtaining the accuracy of the model. We report in Figure 8, as an example, the accuracy map of density, susceptibility and label at 1 km depth.
We can observe that the largest uncertainty in terms of density are in the background where, in any case, the uncertainty has been reduced from 100 kg/m (see Table 1) to less than 40 kg/m. As for the susceptibility, very localised uncertainties are found mainly close to the boundary of the silicate rings. Finally, looking to the labels, we can see that the most uncertain region is the fenitized rocks which bounded the complex.
The developed software allows to perform also gravity-only or magnetic-only inversions, by considering only the corresponding terms in the objective function (Equation (10)). We report in Figure 9 the gravity and magnetic signals along the profile shown in Figure 5 for the gravity-only, magnetic-only and joint inversions.
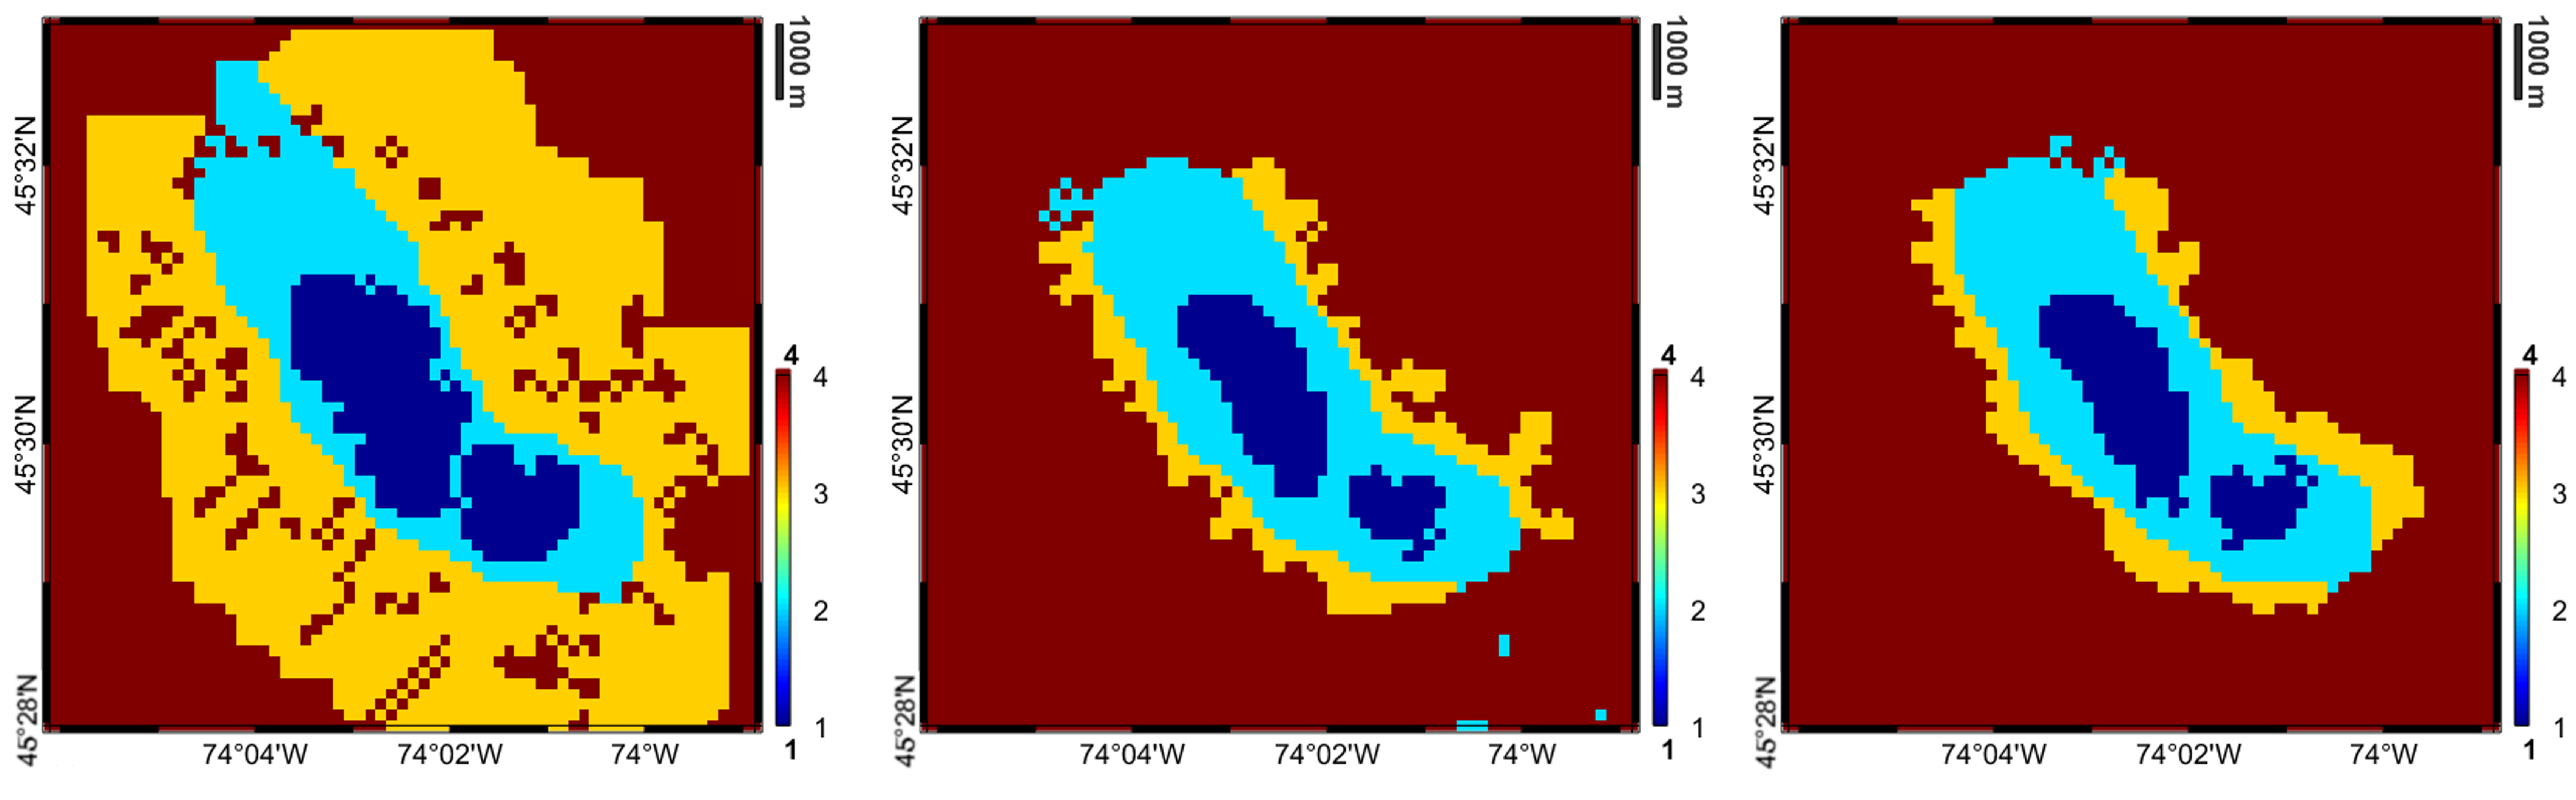
We can see that all the inversions are able to predict the observations, with slightly worse performance for the joint results. This is expected, since the joint-inversion fitting at the same time the gravity and magnetic fields puts more constraints on the final solution. However, comparing the results of the different solutions in terms of labels, we can note that there are important differences between the joint and the gravity-only, magnetic-only inversions. We report in Figure 10 the results of the three inversions in terms of labels at km depth.
We see that the gravity-only inversion is not able to discriminate in a proper way between the different layers. This is somehow an expected result looking to the important overlays in terms of a-priori densities of the different layers. On the contrary, the magnetic field is able to discriminate between the layers but shows only almost constant susceptibilities within each single layer (see also Figure 6).
In order to understand the impact of the a-priori model on the inversion results, two further inversions, degrading the a-priori model, were performed. In the former, we assume a non-informative prior model considering just one label for the whole volume with constant a-priori density and susceptibility. In the latter test, we removed the hypothesis of cylindrical geometry of the carbonatite complex. Both these inversions (reported in the Supplementary Material https://www.mdpi.com/article/10.3390/geosciences12100382/s1), give results well aligned with those presented in this section, thus giving robustness to our solution.
4. Conclusions
In the current work, we presented a Bayesian approach to perform joint gravity and magnetic inversion. The algorithm can effectively change density and magnetic susceptibility distribution together with the geometries of the main geological units in a full 3D approach, fitting the gravity and magnetic data and respecting all qualitative and quantitative constraints. If compared with classical solutions, the proposed method is superior for different points:
- Once the a-priori model and constraints have been formalised, starting from the available information, the algorithm is able to properly manage the complexity of the problem providing meaningful new solutions in terms of geometries preserving sharp (in terms of density and susceptibility distribution) boundaries between different lithologies;
- Results will not require an additional interpretation step (e.g., the selection of equi-density or equi-susceptability surfaces to delineate the boundary of geological units);
- Available information (e.g., interpreted seismic profiles, boreholes, etc.) and a-priori knowledge can be entered in an easy and coherent way into the inversion algorithm, allowing to obtain results statistically coherent with the a-priori model;
- The proposed solution is also able to estimate information about the accuracy of the final results, in terms of density, susceptibility and geometries.
Looking to the Oka complex example, we can see how the ground Bouguer anomaly and the helicopter-borne total magnetic intensity maps well correlated with the available simplified geological knowledge: with the expected density and susceptibility of the sovite core lower than that of the annular rings of silicate rocks and of the background gneiss. The inversion of gravity and magnetic data confirms the cylindrical shape of the complex, at least up to 10 km depth, with a small radial expansion at the surface of the fenitized layer.
The 3D magnetic susceptibility distribution suggests that only the silicate rocks have an important magnetisation, while the carbonatite core and the background are almost non-magnetic. The obtained 3D density distribution well correlated with detailed geological information available in the area (which was not included into the a-priori model), for instance, retrieving high-density values of the okaite series, or the presence of the melteigite-urtite silicate rocks in the southern part of the complex. Residuals in terms of magnetic field in the obtained solution suggest the possible presence of highly magnetised bodies (with few hundred metres thickness) in the carbonatite core.
Supplementary Materials
The tests performed to evaluate the dependence of the solution proposed in the manuscript from the a-priori model can be downloaded at: https://www.mdpi.com/article/10.3390/geosciences12100382/s1.
Author Contributions
D.S. supervised the study; M.C. and D.S. conceived of and performed the study; D.S., M.C. and G.M. performed the bibliographic research; M.C., D.S. and G.M. wrote the paper. All authors have read and agreed to the published version of the manuscript.
Funding
This research was funded by the European Space Agency grant number 4000136884/21/I-DT-lr.
Data Availability Statement
The data presented in this study are available on request from the corresponding author.
Conflicts of Interest
The authors declare no conflict of interest.
References
- Sampietro, D.; Sanso, F. Uniqueness theorems for inverse gravimetric problems. In VII Hotine-Marussi Symposium on Mathematical Geodesy; Springer: Berlin/Heidelberg, Germany, 2012; pp. 111–115. [Google Scholar]
- Sansò, F.; Capponi, M.; Sampietro, D. Up and down through the gravity field. Handbuch der Geodäsie 2018, 6, 91–144. [Google Scholar]
- Sansó, F.; Sampietro, D. Analysis of the Gravity Field: Direct and Inverse Problems; Springer Nature: Berlin/Heidelberg, Germany, 2021. [Google Scholar]
- Li, Y.; Oldenburg, D.W. 3-D inversion of magnetic data. Geophysics 1996, 61, 394–408. [Google Scholar] [CrossRef]
- Li, Y.; Oldenburg, D.W. 3-D inversion of gravity data. Geophysics 1998, 63, 109–119. [Google Scholar] [CrossRef]
- Tikhonov, A.N. On the solution of ill-posed problems and the method of regularization. In Doklady Akademii Nauk; Russian Academy of Sciences: Pushchino, Russia, 1963; Volume 151, pp. 501–504. [Google Scholar]
- Portniaguine, O.N. Image Focusing and Data Compression in the Solution of Geophysical Inverse Problems; The University of Utah: Salt Lake City, UT, USA, 1999. [Google Scholar]
- Fregoso, E.; Gallardo, L.A. Cross-gradients joint 3D inversion with applications to gravity and magnetic data. Geophysics 2009, 74, L31–L42. [Google Scholar] [CrossRef]
- Zhang, Y.; Wang, Y. Three-dimensional gravity-magnetic cross-gradient joint inversion based on structural coupling and a fast gradient method. J. Comput. Math. 2019, 37, 758–777. [Google Scholar]
- Menichetti, V.; Guillen, A. Simultaneous interactive magnetic and gravity inversion. Geophys. Prospect. 1983, 31, 929–944. [Google Scholar] [CrossRef]
- Serpa, L.F.; Cook, K.L. Simultaneous inversion modeling of gravity and aeromagnetic data applied to a geothermal study in Utah. Geophysics 1984, 49, 1327–1337. [Google Scholar] [CrossRef]
- Zeyen, H.; Pous, J. 3-D joint inversion of magnetic and gravimetric data with a priori information. Geophys. J. Int. 1993, 112, 244–256. [Google Scholar] [CrossRef] [Green Version]
- Bosch, M.; Meza, R.; Jiménez, R.; Hönig, A. Joint gravity and magnetic inversion in 3D using Monte Carlo methods. Geophysics 2006, 71, G153–G156. [Google Scholar] [CrossRef]
- Frey, M.; Weinert, S.; Bär, K.; van der Vaart, J.; Dezayes, C.; Calcagno, P.; Sass, I. Integrated 3D geological modelling of the northern Upper Rhine Graben by joint inversion of gravimetry and magnetic data. Tectonophysics 2021, 813, 228927. [Google Scholar] [CrossRef]
- Pollack, A.; Cladouhos, T.T.; Swyer, M.W.; Siler, D.; Mukerji, T.; Horne, R.N. Stochastic inversion of gravity, magnetic, tracer, lithology, and fault data for geologically realistic structural models: Patua Geothermal Field case study. Geothermics 2021, 95, 102129. [Google Scholar] [CrossRef]
- Rossi, L. Bayesian Gravity Inversion by Monte Carlo Methods. Ph.D. Dissertation, Politecnico di Milano, Milan, Italy, 2017. [Google Scholar]
- Marchetti, P.; Sampietro, D.; Capponi, M.; Rossi, L.; Reguzzoni, M.; Porzio, F.; Sansò, F. Lithological constrained gravity inversion. A Bayesian approach. In Proceedings of the 81st EAGE Conference and Exhibition 2019, London, UK, 3–6 June 2019; EAGE Publishing BV: Houten, The Netherlands, 2019; pp. 1–5. [Google Scholar]
- Sampietro, D.; Capponi, M. Gravity for Lithosphere Architecture Determination and Analysis: The Central Eastern Mediterranean case study. Geophys. Prospect. 2021, 70, 173–192. [Google Scholar] [CrossRef]
- Capponi, M.; Sampietro, D.; Ebbing, J.; Ferraccioli, F. Antarctica 3-D crustal structure investigation by means of the Bayesian gravity inversion: The Wilkes Land case study. Geophys. J. Int. 2022, 229, 2147–2161. [Google Scholar] [CrossRef]
- Sampietro, D.; Capponi, M. Seismic Constrained Gravity Inversion: A Reliable Tool to Improve Geophysical Models Away from Seismic Information. Geosciences 2021, 11, 467. [Google Scholar] [CrossRef]
- Mosegaard, K.; Tarantola, A. Monte Carlo sampling of solutions to inverse problems. J. Geophys. Res. Solid Earth 1995, 100, 12431–12447. [Google Scholar] [CrossRef]
- Bayes, T. LII. An essay towards solving a problem in the doctrine of chances. By the late Rev. Mr. Bayes, FRS communicated by Mr. Price, in a letter to John Canton, AMFR S. Philos. Trans. R. Soc. Lond. 1763, 53, 370–418. [Google Scholar]
- Azencott, R. Simulated annealing. Semin. Bourbaki 1988, 697, 161–175. [Google Scholar]
- Geman, S.; Geman, D. Stochastic relaxation, Gibbs distributions, and the Bayesian restoration of images. IEEE Trans. Pattern Anal. Mach. Intell. 1984, 6, 721–741. [Google Scholar] [CrossRef]
- Nikolaev, A.G.; Jacobson, S.H. Simulated annealing. In Handbook of Metaheuristics; Springer: Berlin/Heidelberg, Germany, 2010; pp. 1–39. [Google Scholar]
- Treiman, A.H.; Essene, E.J. The Oka carbonatite complex, Quebec: Geology and evidence for silicate-carbonate liquid immiscibility. Am. Miner. 1985, 70, 1101–1113. [Google Scholar]
- Gold, D. Alkaline ultrabasic rocks in the Montreal area, Quebec. Ultramafic Relat. Rocks 1967, 288–302. [Google Scholar]
- Thomas, M.; Ford, K.; Keating, P. Exploration geophysics for intrusion-hosted rare metals. Geophys. Prospect. 2016, 64, 1275–1304. [Google Scholar] [CrossRef]
- Gold, D.P. Carbonatites, Diatremes and Ultra-Alkaline Rocks in the Oka Area, Quebec; Geological Association of Canada: Ottawa, ON, Canada, 1986. [Google Scholar]
- Eby, G.N. Geochronology of the Monteregian Hills alkaline igneous province, Quebec. Geology 1984, 12, 468–470. [Google Scholar] [CrossRef]
- Eby, G.N. Abundance and distribution of the rare-earth elements and yttrium in the rocks and minerals of the Oka carbonatite complex, Quebec. Geochim. Cosmochim. Acta 1975, 39, 597–620. [Google Scholar] [CrossRef]
- Chen, W.; Simonetti, A. Evidence for the multi-stage petrogenetic history of the Oka carbonatite complex (Québec, Canada) as recorded by perovskite and apatite. Minerals 2014, 4, 437–476. [Google Scholar] [CrossRef] [Green Version]
- Geophysics, S. The Oka Carbonatite Complex, Quebec: Deep Structure from Joint 3D Gravity and Magnetic Data Inversion. 2019. Available online: http://www.sgl.com/technicalpapers/Interpretation%20Example%203%20-%20Oka_Carbonatite_Complex_short-v3.pdf (accessed on 12 May 2022).
- Canada, N.R. Geoscience Data Repository for Geophysical Data. 2016. Available online: https://www.re3data.org/repository/r3d100011990 (accessed on 12 May 2022).
- Sampietro, D.; Capponi, M.; Mansi, A.; Gatti, A.; Marchetti, P.; Sansò, F. Space-Wise approach for airborne gravity data modelling. J. Geod. 2017, 91, 535–545. [Google Scholar] [CrossRef] [Green Version]
- Finlay, C.C.; Kloss, C.; Olsen, N.; Hammer, M.D.; Tøffner-Clausen, L.; Grayver, A.; Kuvshinov, A. The CHAOS-7 geomagnetic field model and observed changes in the South Atlantic Anomaly. Earth Planets Space 2020, 72, 1–31. [Google Scholar] [CrossRef]
- Sampietro, D.; Capponi, M. Practical tips for 3D regional gravity inversion. Geosciences 2019, 9, 351. [Google Scholar] [CrossRef] [Green Version]
- Lentz, D.; Eby, N.; Lavoie, S.; Park, A. Diatremes, Dykes, and Diapirs: Revisiting the Ultra-Alkaline to Carbonatitic Magmatism of the Monteregian Hills. Available online: https://faculty.uml.edu/nelson_eby/Field%20Trip%20guides/GAC-MAC%202006%20Field%20Guide%20B4.pdf (accessed on 12 May 2022).
- Ramberg, I.B. Gravity studies of the Fen complex, Norway, and their petrological significance. Contrib. Mineral. Petrol. 1973, 38, 115–134. [Google Scholar] [CrossRef]
Figure 1.
Flow chart of the proposed solution.
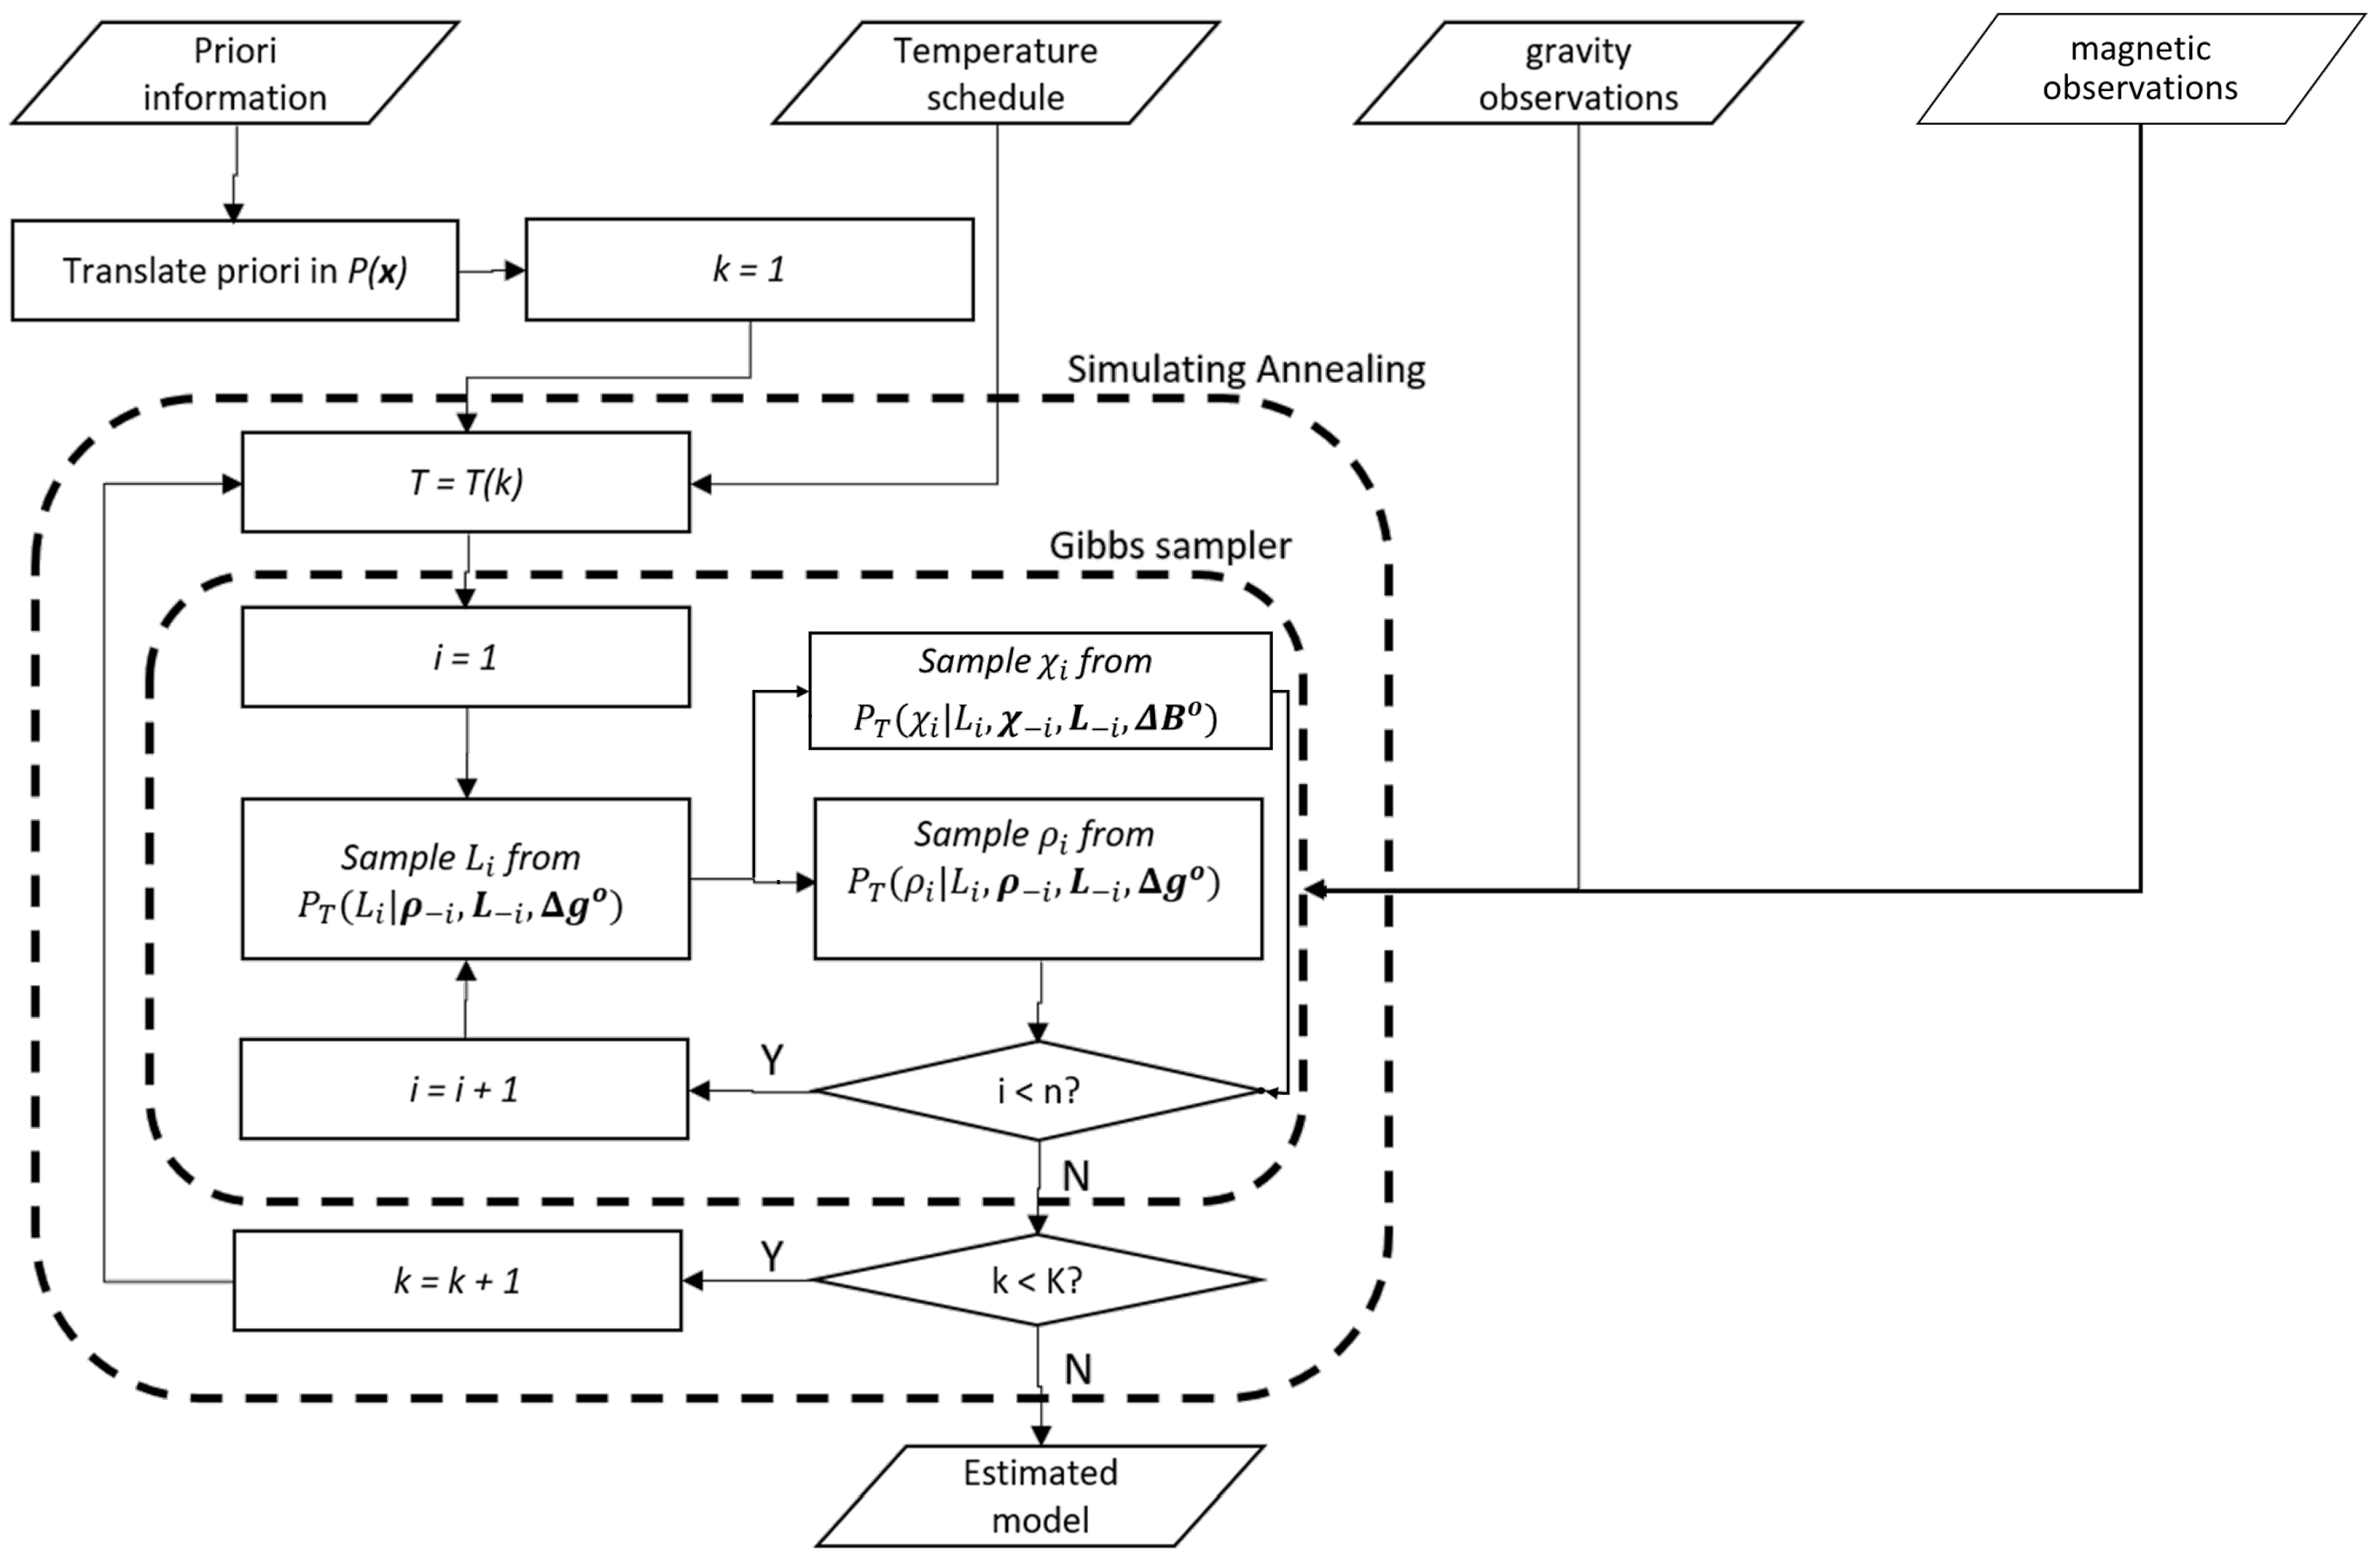
Figure 2.
Detailed geological model of Oka Carbonatite complex from [29,33] (left) and simplified geological model used to build the a-priori model (right).

Figure 3.
Computed grid of Bouguer gravity anomalies (left) and predicted accuracy (right). Red lines represents the boundaries of main units of the Oka complex.
Figure 3.
Computed grid of Bouguer gravity anomalies (left) and predicted accuracy (right). Red lines represents the boundaries of main units of the Oka complex.
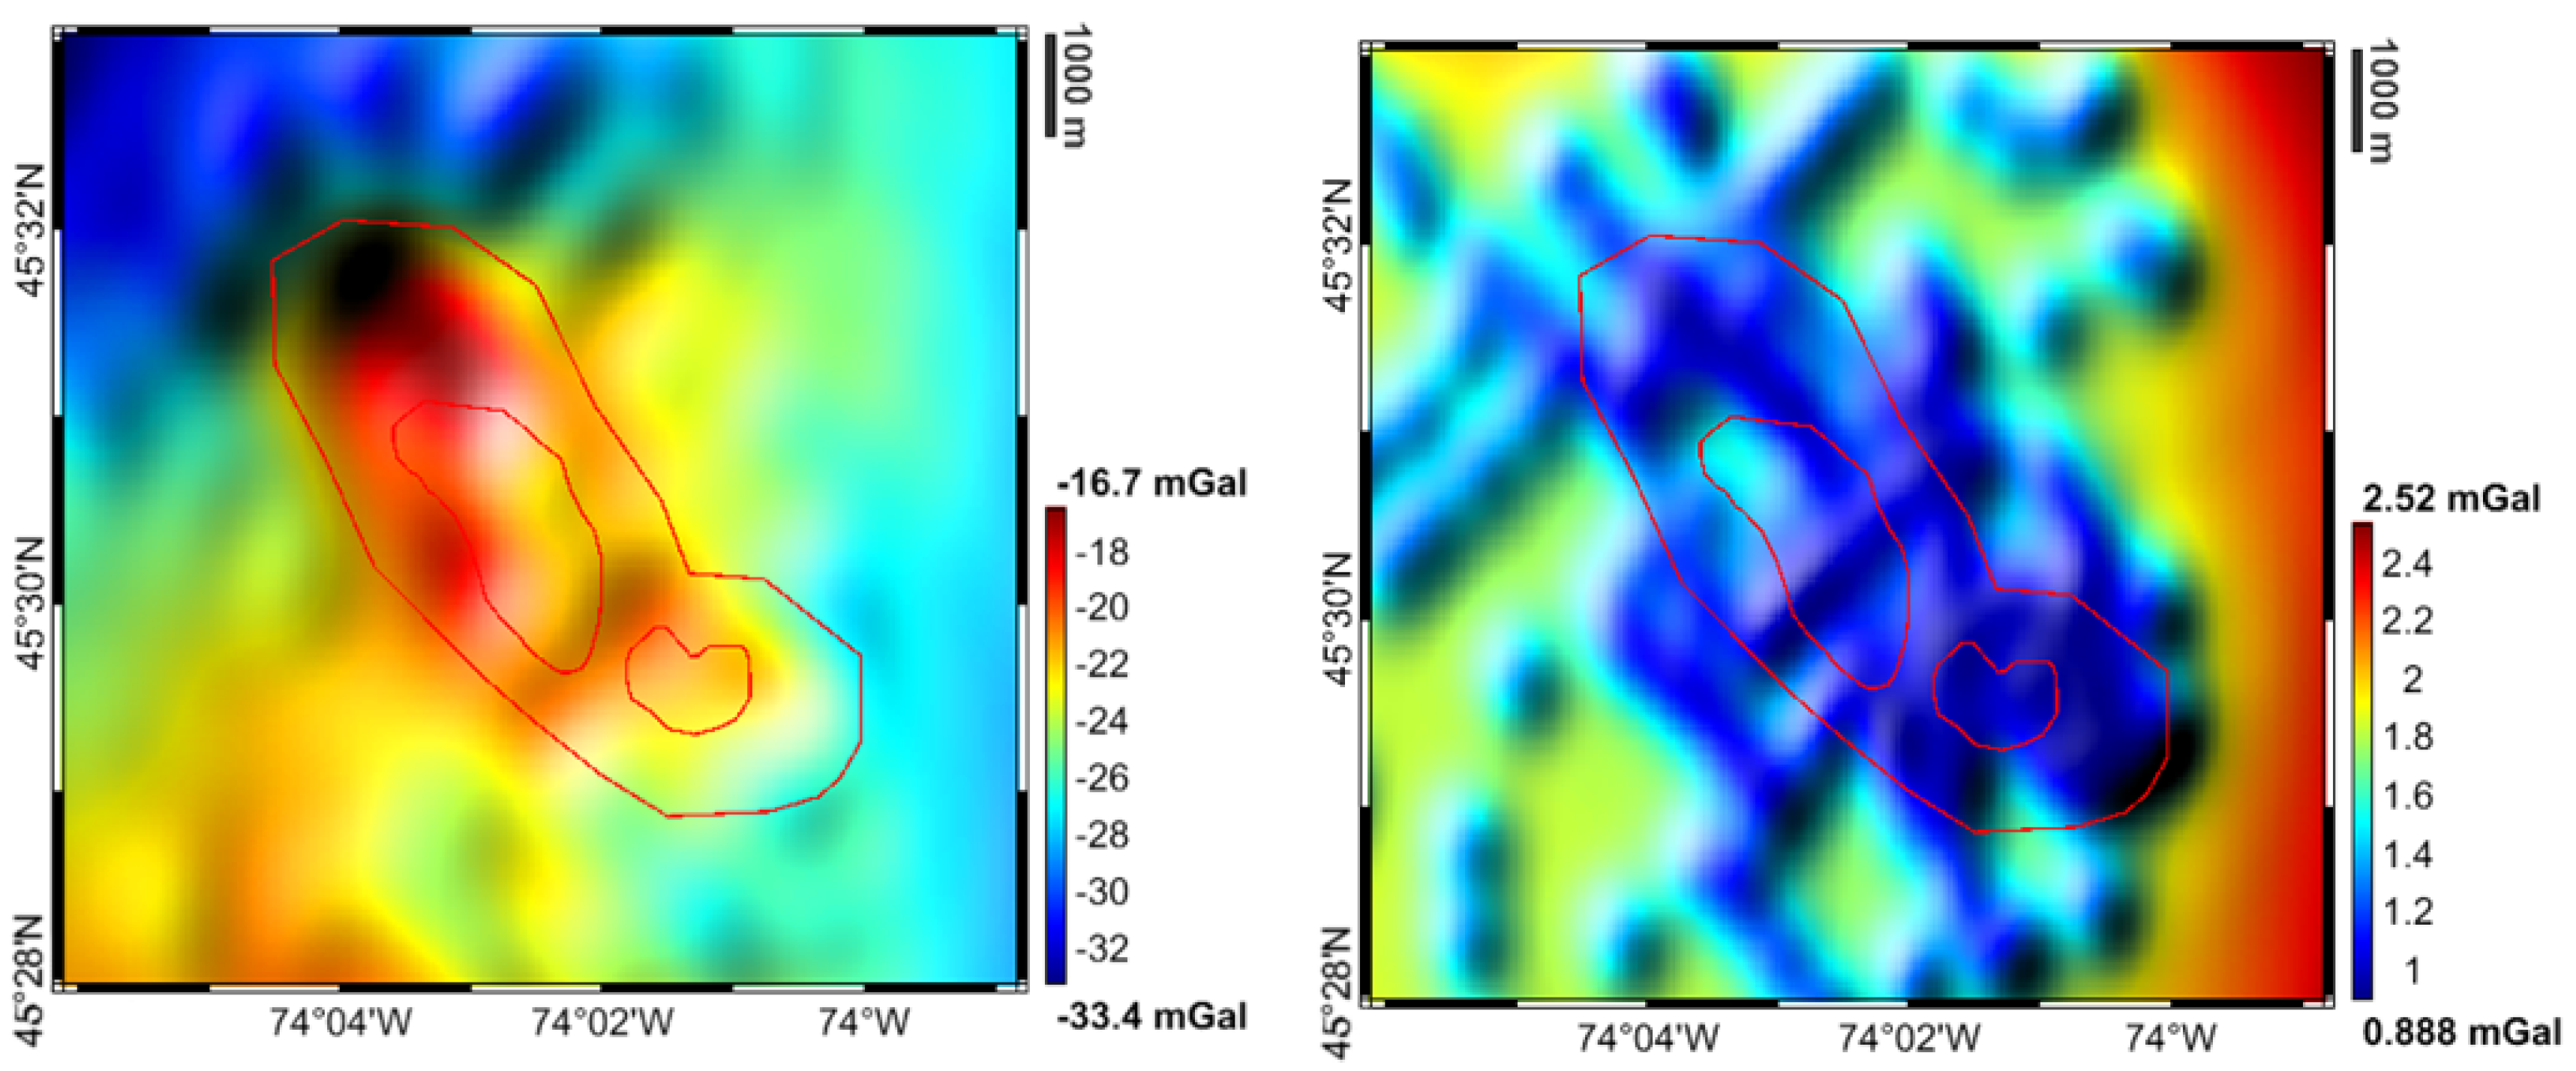
Figure 4.
Grid of total magnetic intensity anomalies downloaded from [34]. Red lines represents the boundaries of main units of the Oka complex.
Figure 4.
Grid of total magnetic intensity anomalies downloaded from [34]. Red lines represents the boundaries of main units of the Oka complex.
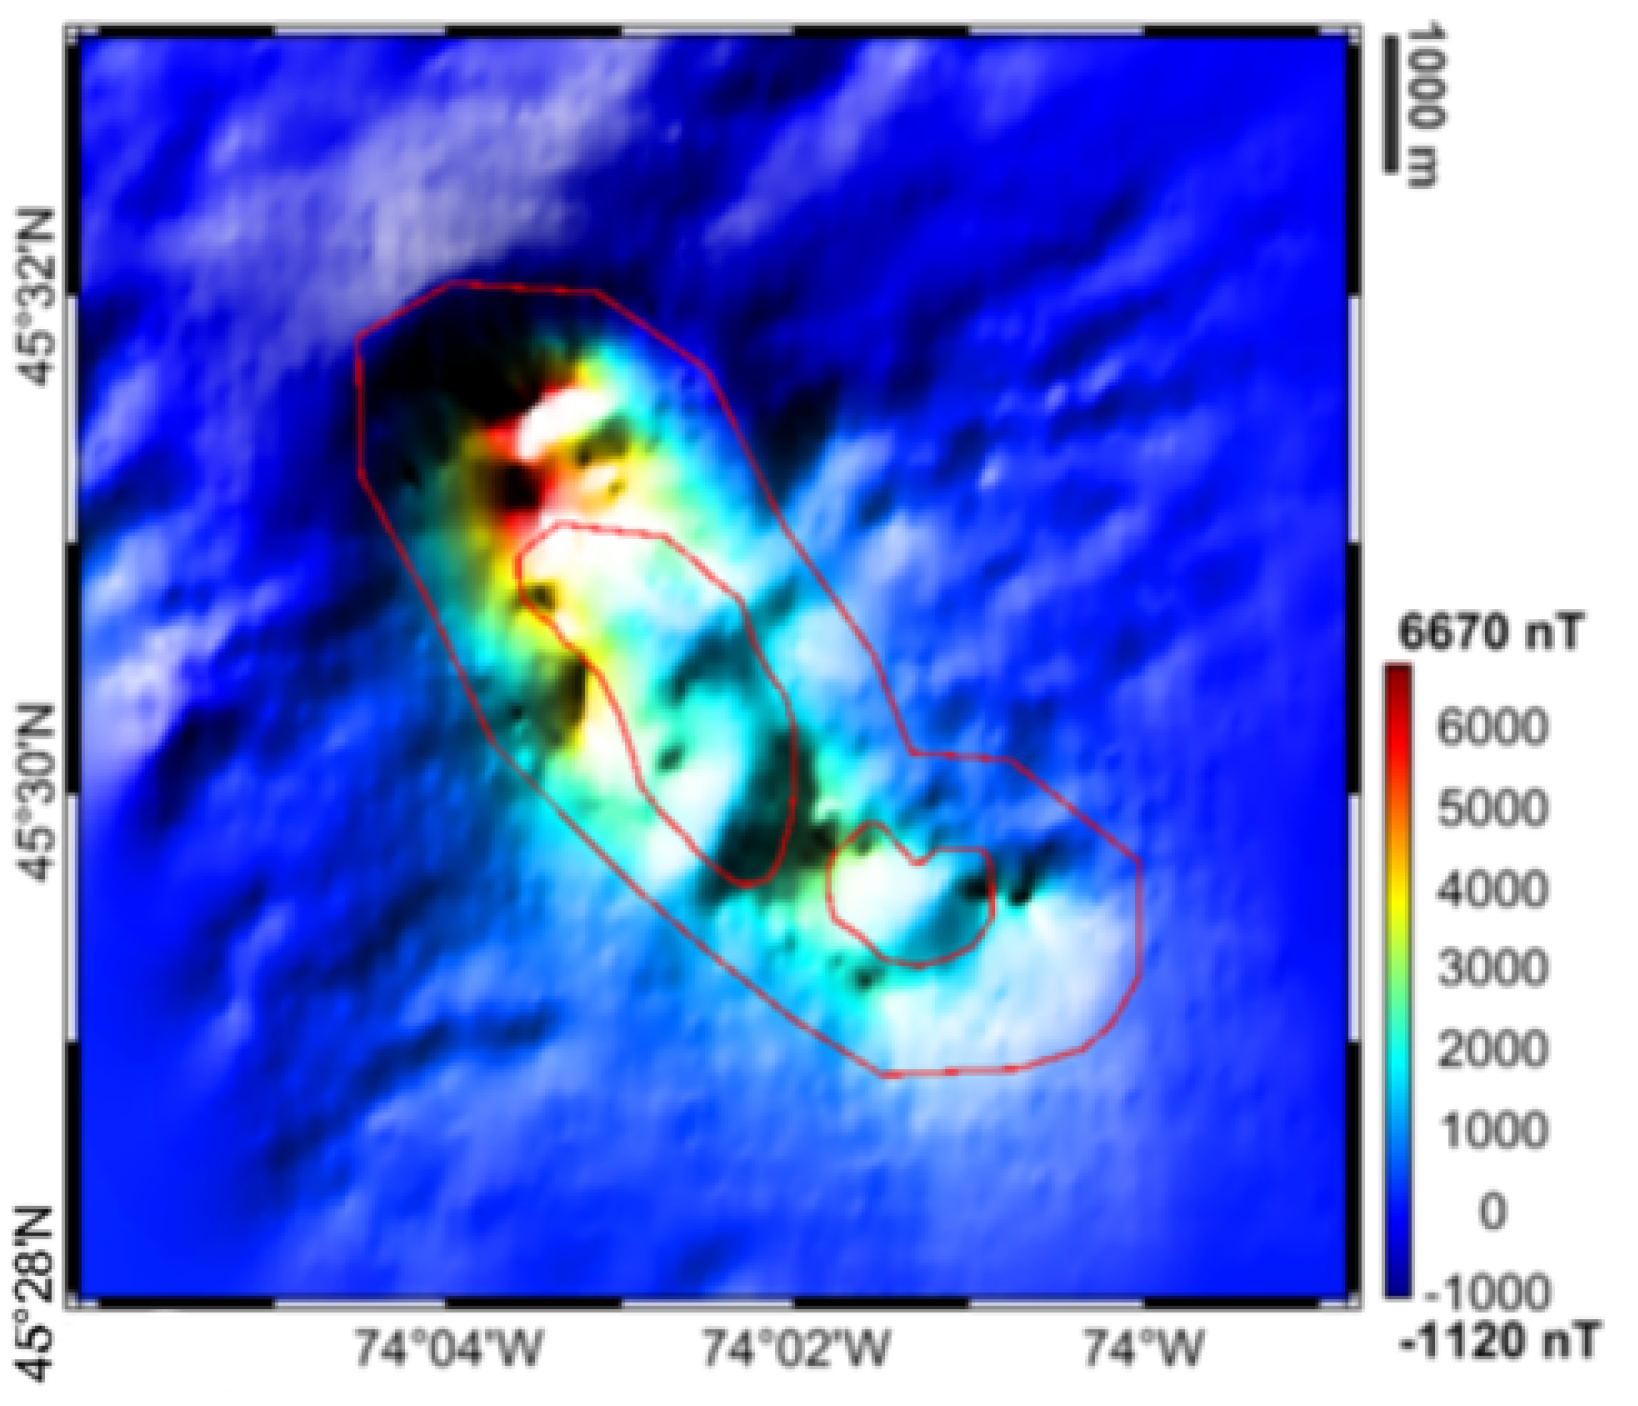
Figure 5.
Residuals before (left) and after (right) applying the joint inversion for the gravity (up) and magnetic (down) fields. Red lines represents the boundaries of main units of the Oka complex. Red dashed line is the profile shown in Figure 9.
Figure 5.
Residuals before (left) and after (right) applying the joint inversion for the gravity (up) and magnetic (down) fields. Red lines represents the boundaries of main units of the Oka complex. Red dashed line is the profile shown in Figure 9.
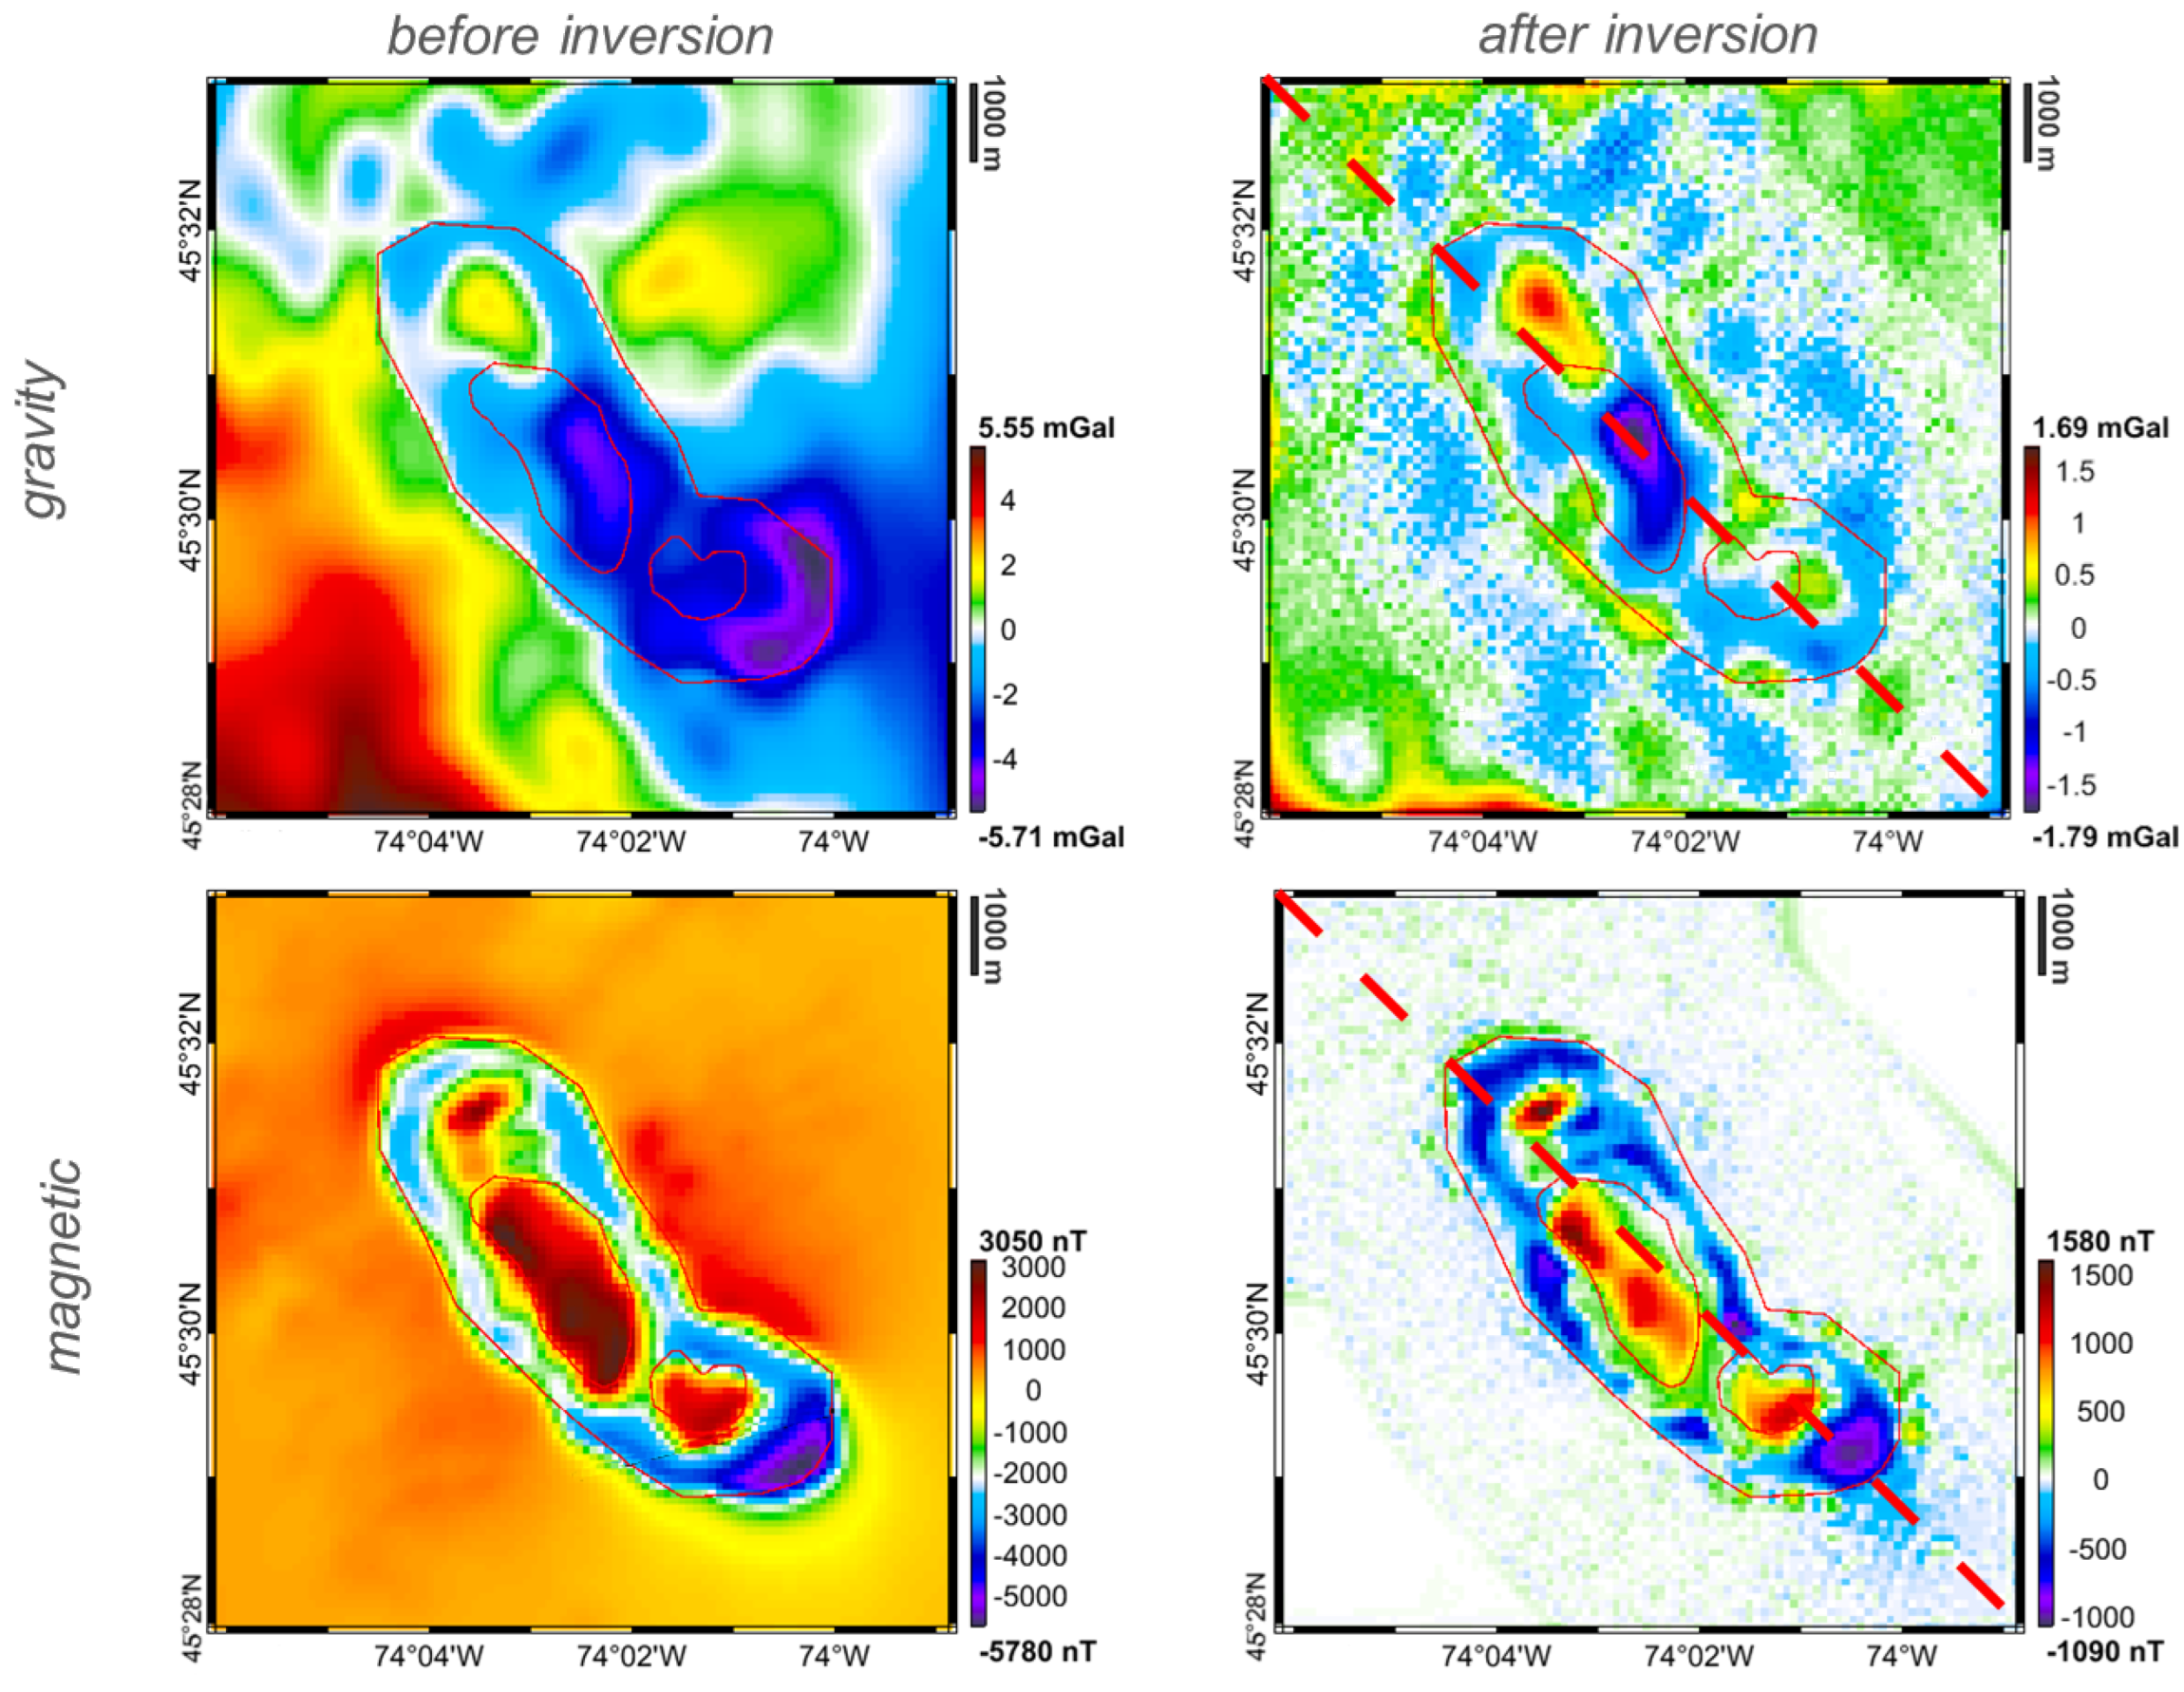
Figure 6.
Density and susceptibility distributions and label model from the final solution at 1 km depth. White lines are boundaries of known main okaite formations and black lines are boundaries of main melteigite-urtite formations digitized from Figure 2.
Figure 6.
Density and susceptibility distributions and label model from the final solution at 1 km depth. White lines are boundaries of known main okaite formations and black lines are boundaries of main melteigite-urtite formations digitized from Figure 2.

Figure 7.
Estimated 3D density model. Units are kg/m.
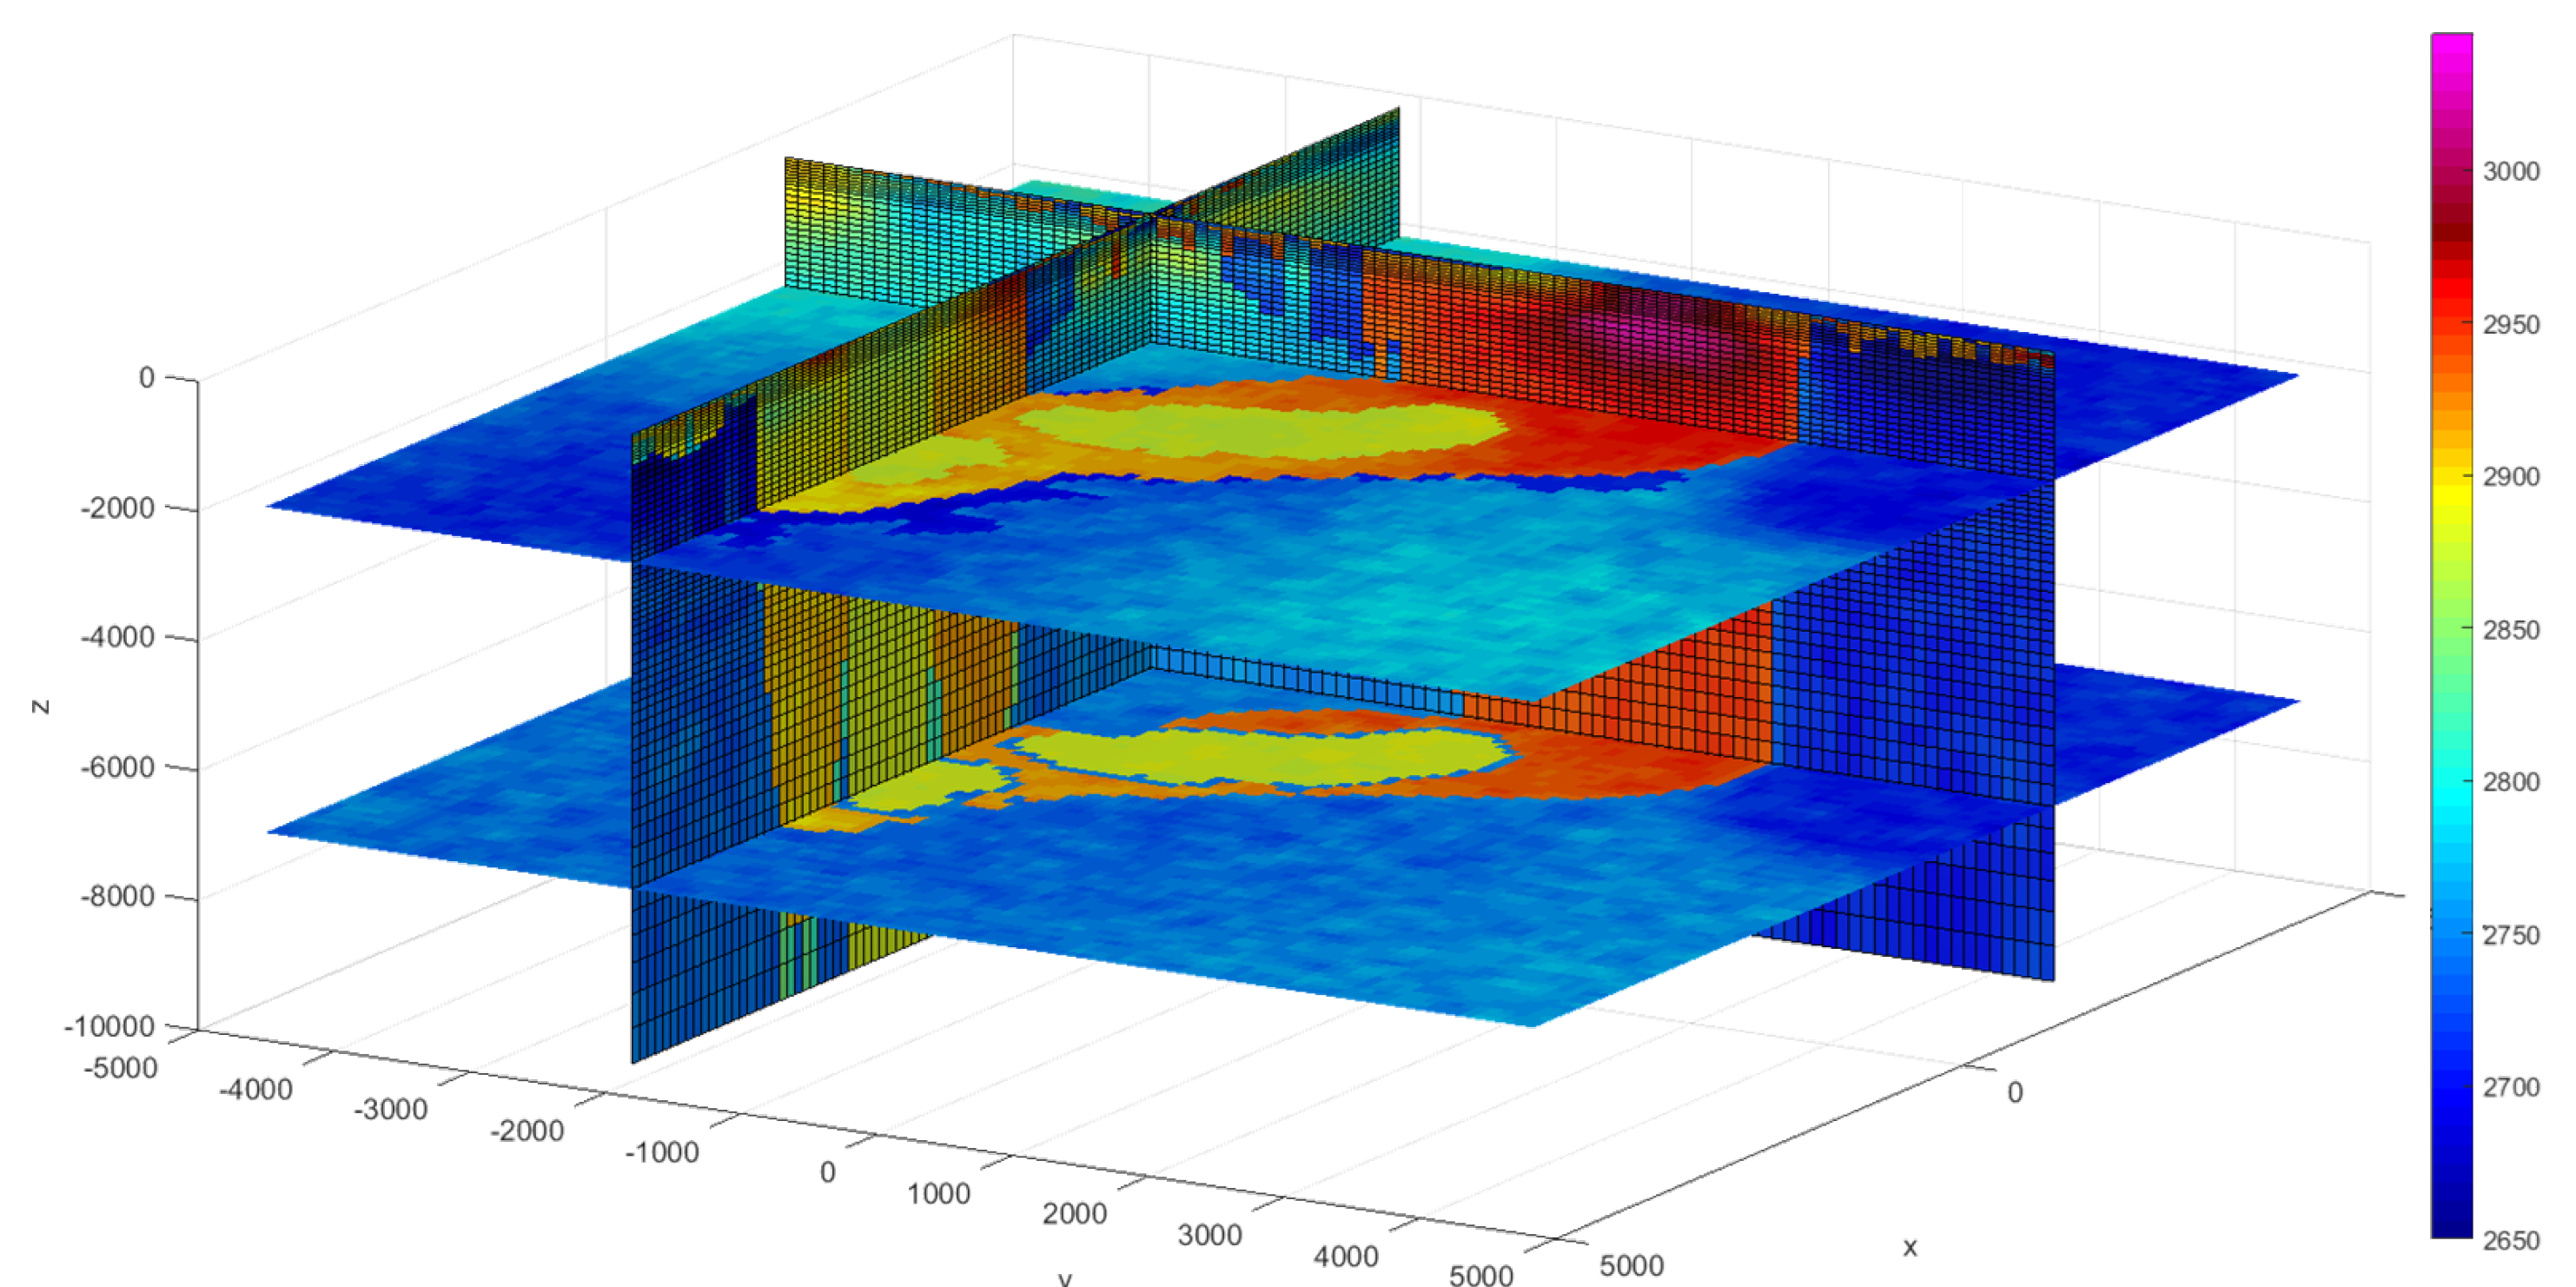
Figure 8.
Predicted accuracy at 1 km depth in terms of density (left), susceptibility (centre) and label (right).
Figure 8.
Predicted accuracy at 1 km depth in terms of density (left), susceptibility (centre) and label (right).
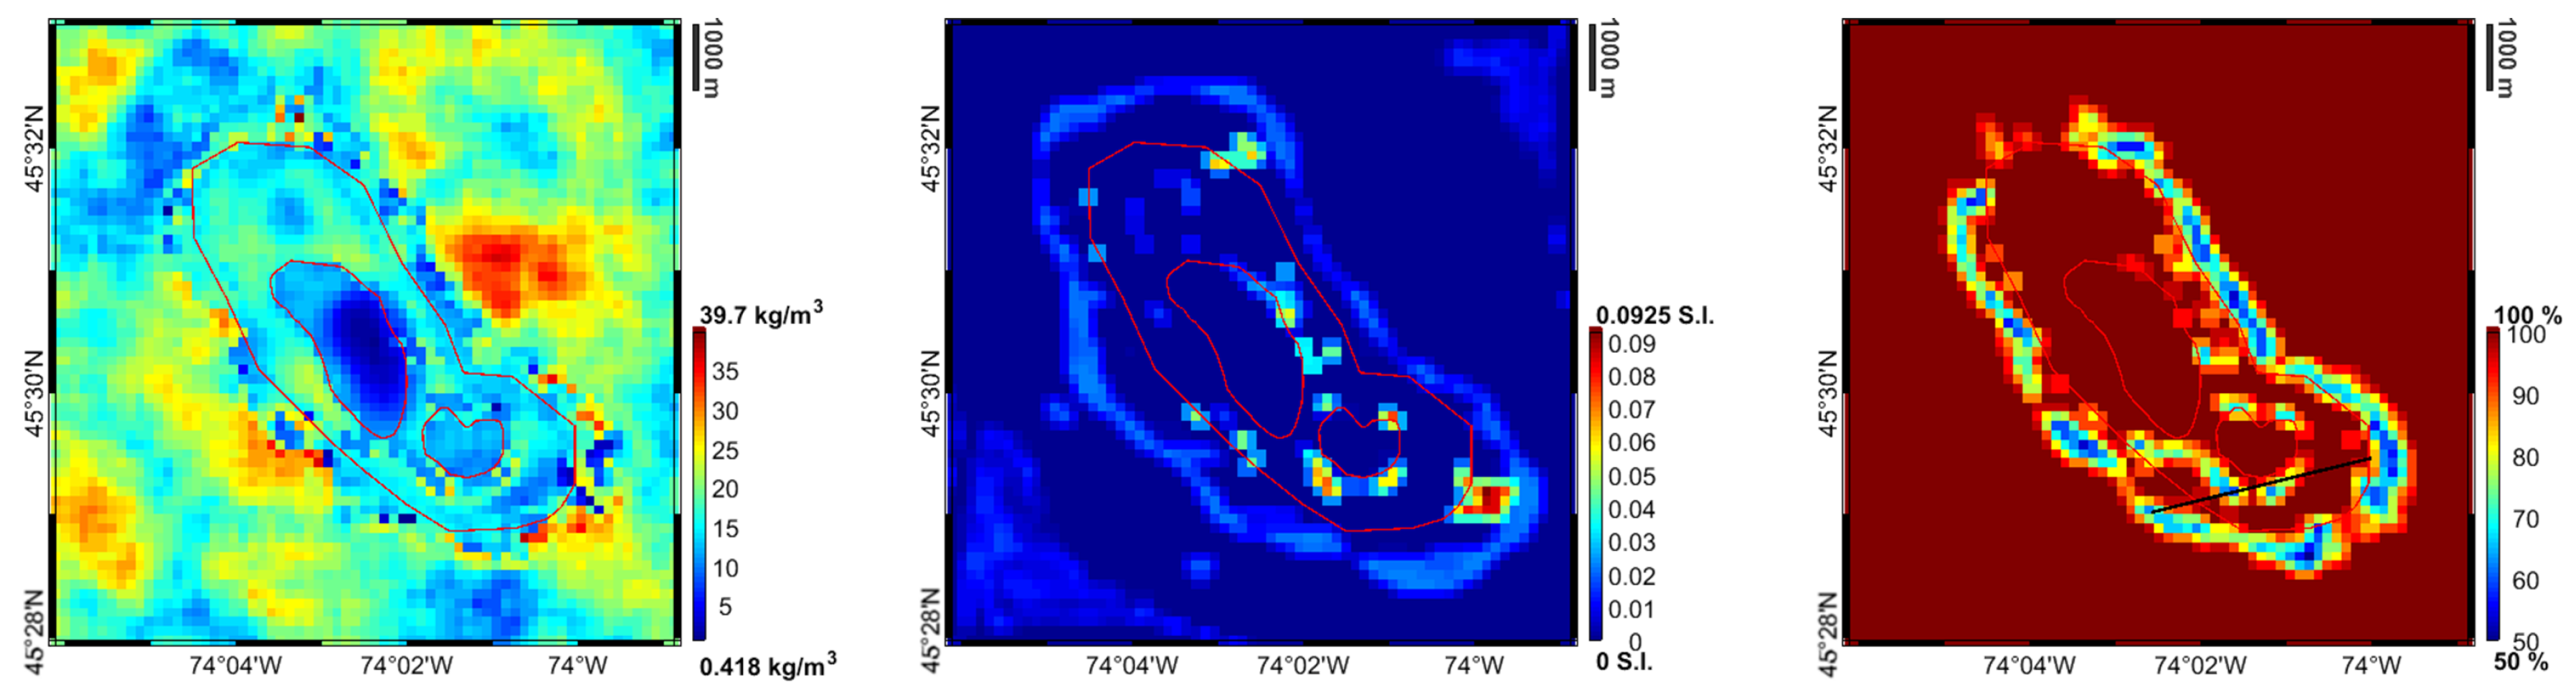
Figure 9.
Predicted gravity and magnetic signal from gravity-only, magnetic-only and joint gravity and magnetic inversions.
Figure 9.
Predicted gravity and magnetic signal from gravity-only, magnetic-only and joint gravity and magnetic inversions.
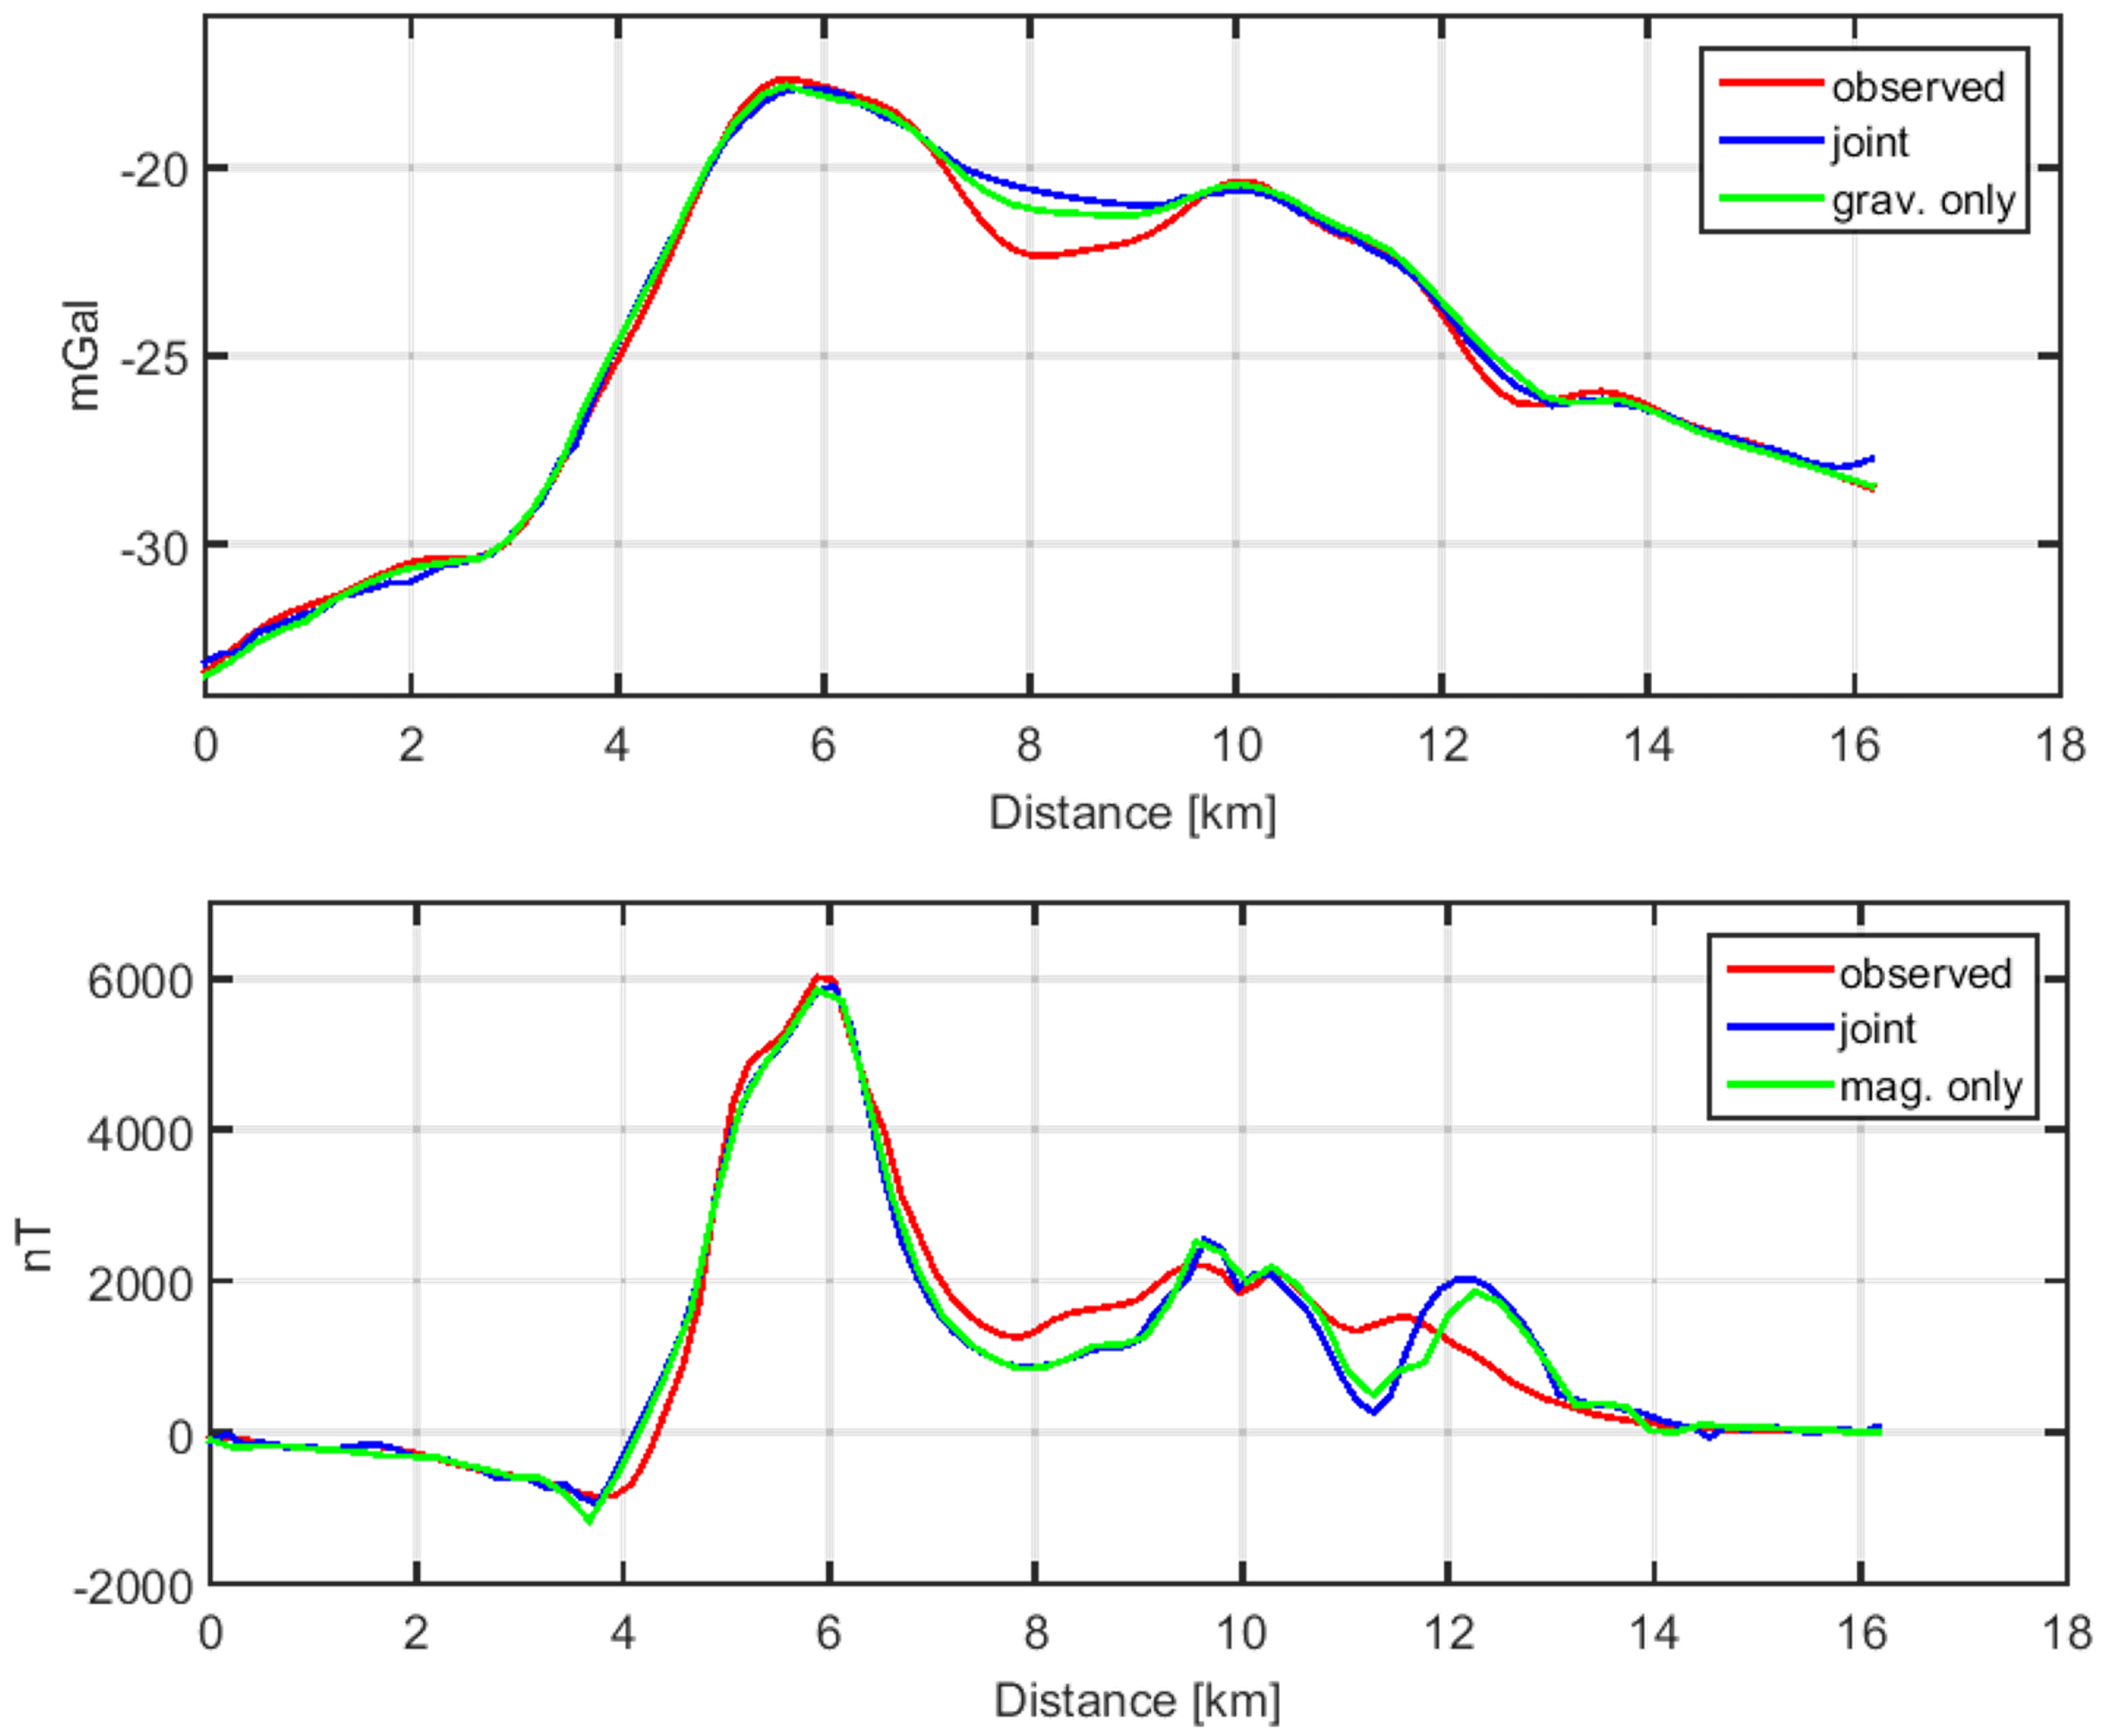
Figure 10.
Estimated labels at 1.5 km from gravity-only inversion (left), magnetic-only inversion (centre) and joint inversion (right).
Figure 10.
Estimated labels at 1.5 km from gravity-only inversion (left), magnetic-only inversion (centre) and joint inversion (right).

Table 1.
A-priori model in terms of density, expressed as average values and variability.
| Layer | Mean [kg/m] | Density Variability [kg/m] |
|---|---|---|
| Carbonatite | 2880 | 25 |
| Silicate | 2930 | 100 |
| Fenite | 2700 | 52 |
| Gneiss/anorthosite | 2740 | 52 |
* A lateral density variation is considered for the background with average density of 2740 kg/m3 in correspondence with gneiss and of 2700 kg/m3 in correspondence with anorthosite in the northwest corner of the study area.
Table 2.
A-priori model in terms of magnetic susceptibility, expressed as average values and variability.
Table 2.
A-priori model in terms of magnetic susceptibility, expressed as average values and variability.
| Layer | Mean [S.I.] | Susceptibility Variability [S.I.] |
|---|---|---|
| Carbonatite | 0 | 3 |
| Silicate | 0.3 | 0.016 |
| Fenite | 0 | 3 |
| Gneiss/anorthosite | 0.03 | 0.01 |
Publisher’s Note: MDPI stays neutral with regard to jurisdictional claims in published maps and institutional affiliations. |
© 2022 by the authors. Licensee MDPI, Basel, Switzerland. This article is an open access article distributed under the terms and conditions of the Creative Commons Attribution (CC BY) license (https://creativecommons.org/licenses/by/4.0/).
Share and Cite
MDPI and ACS Style
Sampietro, D.; Capponi, M.; Maurizio, G. 3D Bayesian Inversion of Potential Fields: The Quebec Oka Carbonatite Complex Case Study. Geosciences 2022, 12, 382. https://doi.org/10.3390/geosciences12100382
AMA Style
Sampietro D, Capponi M, Maurizio G. 3D Bayesian Inversion of Potential Fields: The Quebec Oka Carbonatite Complex Case Study. Geosciences. 2022; 12(10):382. https://doi.org/10.3390/geosciences12100382
Chicago/Turabian StyleSampietro, Daniele, Martina Capponi, and Gerardo Maurizio. 2022. "3D Bayesian Inversion of Potential Fields: The Quebec Oka Carbonatite Complex Case Study" Geosciences 12, no. 10: 382. https://doi.org/10.3390/geosciences12100382
Note that from the first issue of 2016, this journal uses article numbers instead of page numbers. See further details here.