Article

Tectonic and Stratigraphic Evolution Based on Seismic Sequence Stratigraphy: Central Rift Section of the Campos Basin, Offshore Brazil

by
Renata dos Santos Alvarenga
1,*,
Juliano Kuchle
1,
David Iacopini
2,
Karin Goldberg
3,
Claiton Marlon dos Santos Scherer
1,
George Pantopoulos
1 and
Patrycia Leipnitz Ene
1
1
Instituto de Geociências, Universidade Federal do Rio Grande do Sul, Porto Alegre 91501-970, Brazil
2
Dipartimento di Scienze Della Terra, dell Ambiente e Delle Risorse (DISTAR), Universita Degli Studi di Napoli Federico II, 80126 Naples, Italy
3
Department of Geology, Kansas State University, Manhattan, KS 66502, USA
*
Author to whom correspondence should be addressed.
Geosciences 2021, 11(8), 338; https://doi.org/10.3390/geosciences11080338
Submission received: 6 April 2021 / Revised: 28 July 2021 / Accepted: 9 August 2021 / Published: 12 August 2021

Abstract

:
The rift section of the Brazilian basins represent the sedimentary record associated with the first stages of Gondwana break-up in the Early Cretaceous phase (Berriasian to Aptian). The rift succession of the Campos Basin constitutes one of the main petroleum systems of Brazil’s marginal basins. This interval contains the main source rock and important reservoirs in the Lagoa Feia Group deposits. The Lagoa Feia Group is characterized by siliciclastic, carbonate and evaporite sediments deposited during the rift and post-rift phases. Despite the economic relevance, little is known in stratigraphic terms regarding this rift interval. To date, most studies of the Lagoa Feia Group have adopted a lithostratigraphic approach, while this study proposes a tectonostratigraphic framework for the deep-rift succession of the Campos Basin (Lagoa Feia Group), using the fundamentals of seismic sequence stratigraphy. This work also aims to establish a methodological and practical procedure for the stratigraphic analysis of rift basins, using seismic data and seismofacies, and focusing on tectonicstratigraphic analysis. The dataset comprised 2D seismic lines, core and lithological logs from exploration wells. Three seismic facies were identified based on reflector patterns and lithologic data from well cores, providing an improved subdivision of the pre-, syn- and post-rift stages. The syn-rift stage was further subdivided based on the geometric patterns of the reflectors. Tectonics was the main controlling factor in the sedimentary succession, and the pattern and geometry of the seismic reflectors of the syn-rift interval in the Campos Basin allowed the identification of three tectonic systems tracts: (i) a Rift Initiation Systems Tract; (ii) a High Tectonic Activity Systems Tract and (iii) a Low Tectonic Activity Systems Tract.

1. Introduction

The Campos Basin is one of the largest hydrocarbon-producing basins of the Brazilian margin [1], with substantial oil reserves first discovered in its shallower part during the 1970s [2]. Since then, exploration has focused on the deeper parts of the basin, reaching turbidite and carbonate deposits at the beginning of the 21st century [3]. The discovery of the pre-salt reservoirs [4] in 2006 shifted the exploration focus to deeper, larger accumulations. Similar petroleum system and geological conditions are also shared with the neighboring Santos Basin to the south. Consequently, the Lagoa Feia Group, recording the rift and sag phases, has a central role on the Campos Basin’s petroleum system, comprising both the main source rock and reservoir formations (mainly rudstone accumulations, also known as “coquinas”). However, a chronostratigraphic framework for the rift section based on sequence stratigraphic premises and a tectonostratigraphic framework for these deposits is still lacking [5,6]. Previous studies have only provided a lithostratigraphic partition [3,7,8], dividing the rift section into units defined mainly by lithological changes [9].
The absence of a sequence stratigraphic framework is mainly due to (i) difficulties of seismic acquisition in the deeper parts of the basin, (ii) the complex interaction of tectonics and sedimentation and (iii) the lack of extensive rock data (drill and sidewall cores) for seismic-to-rock correlation. Recent advances in seismic imaging and processing (directly related to computational processing evolution), as well as in the understanding of rift basins in the last two decades (especially regarding the evolutionary history of the rift section in the Campos Basin), have minimized the first two problems. However, even after the increased exploratory efforts in recent years (e.g., drilling), core samples are still limited to allow a high-resolution correlation between seismic and rock.
Consequently, this article proposes an evolutionary model of the rift section in the Campos Basin based on sequence stratigraphy, with the identification of stratigraphic units and discussion of their sedimentary control, providing stratigraphic patterns that can be compared with neighboring areas. The proposed stratigraphic framework is unfolded through regional mapping and seismic characterization based on the sedimentation model first proposed by Goldberg et al. [10], providing seismic criteria for the recognition of stratigraphic units within the rift section.

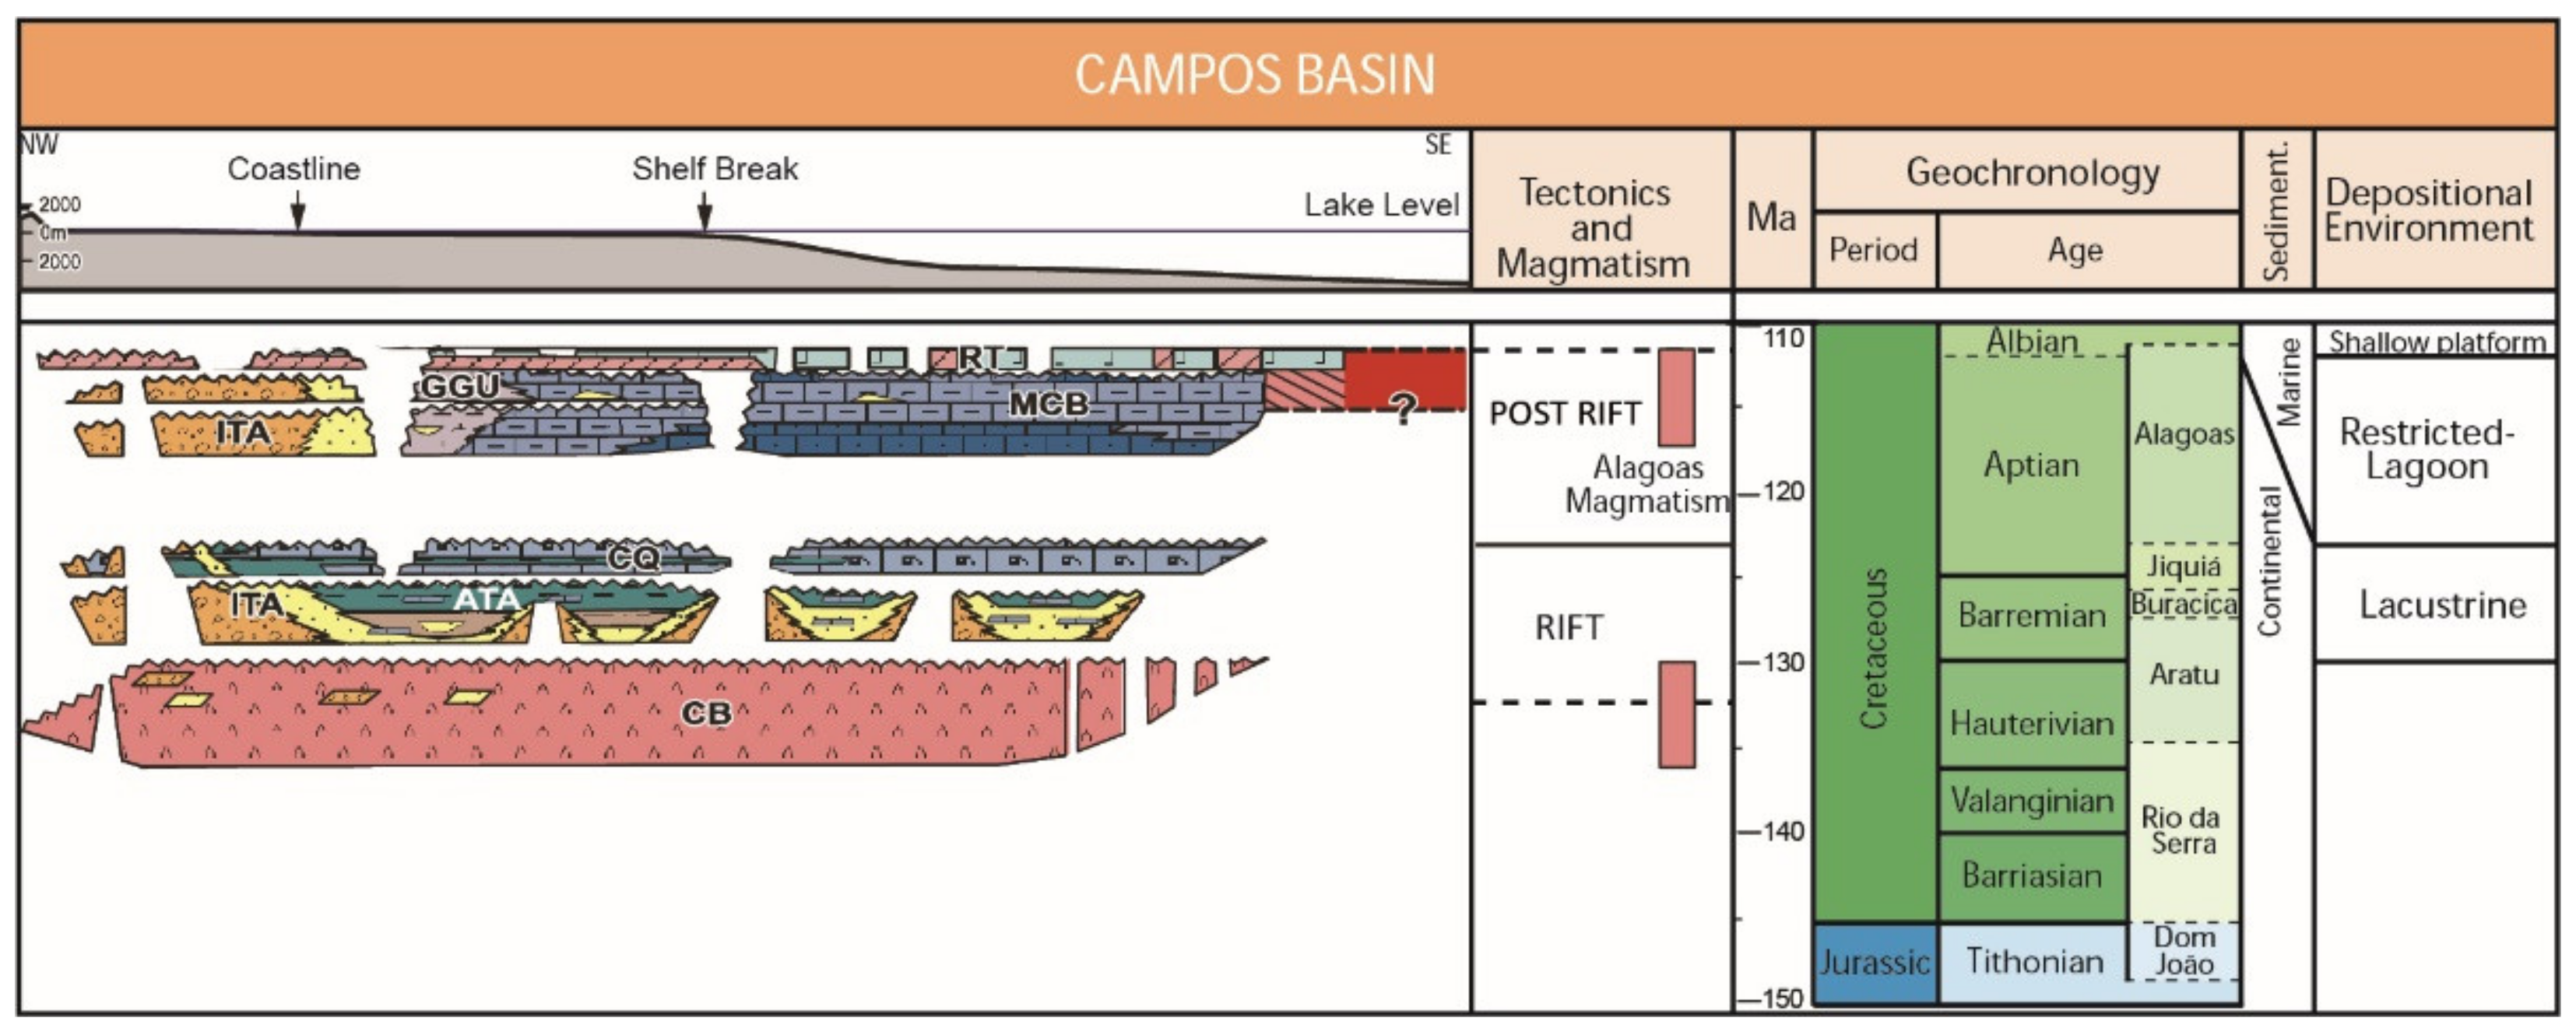
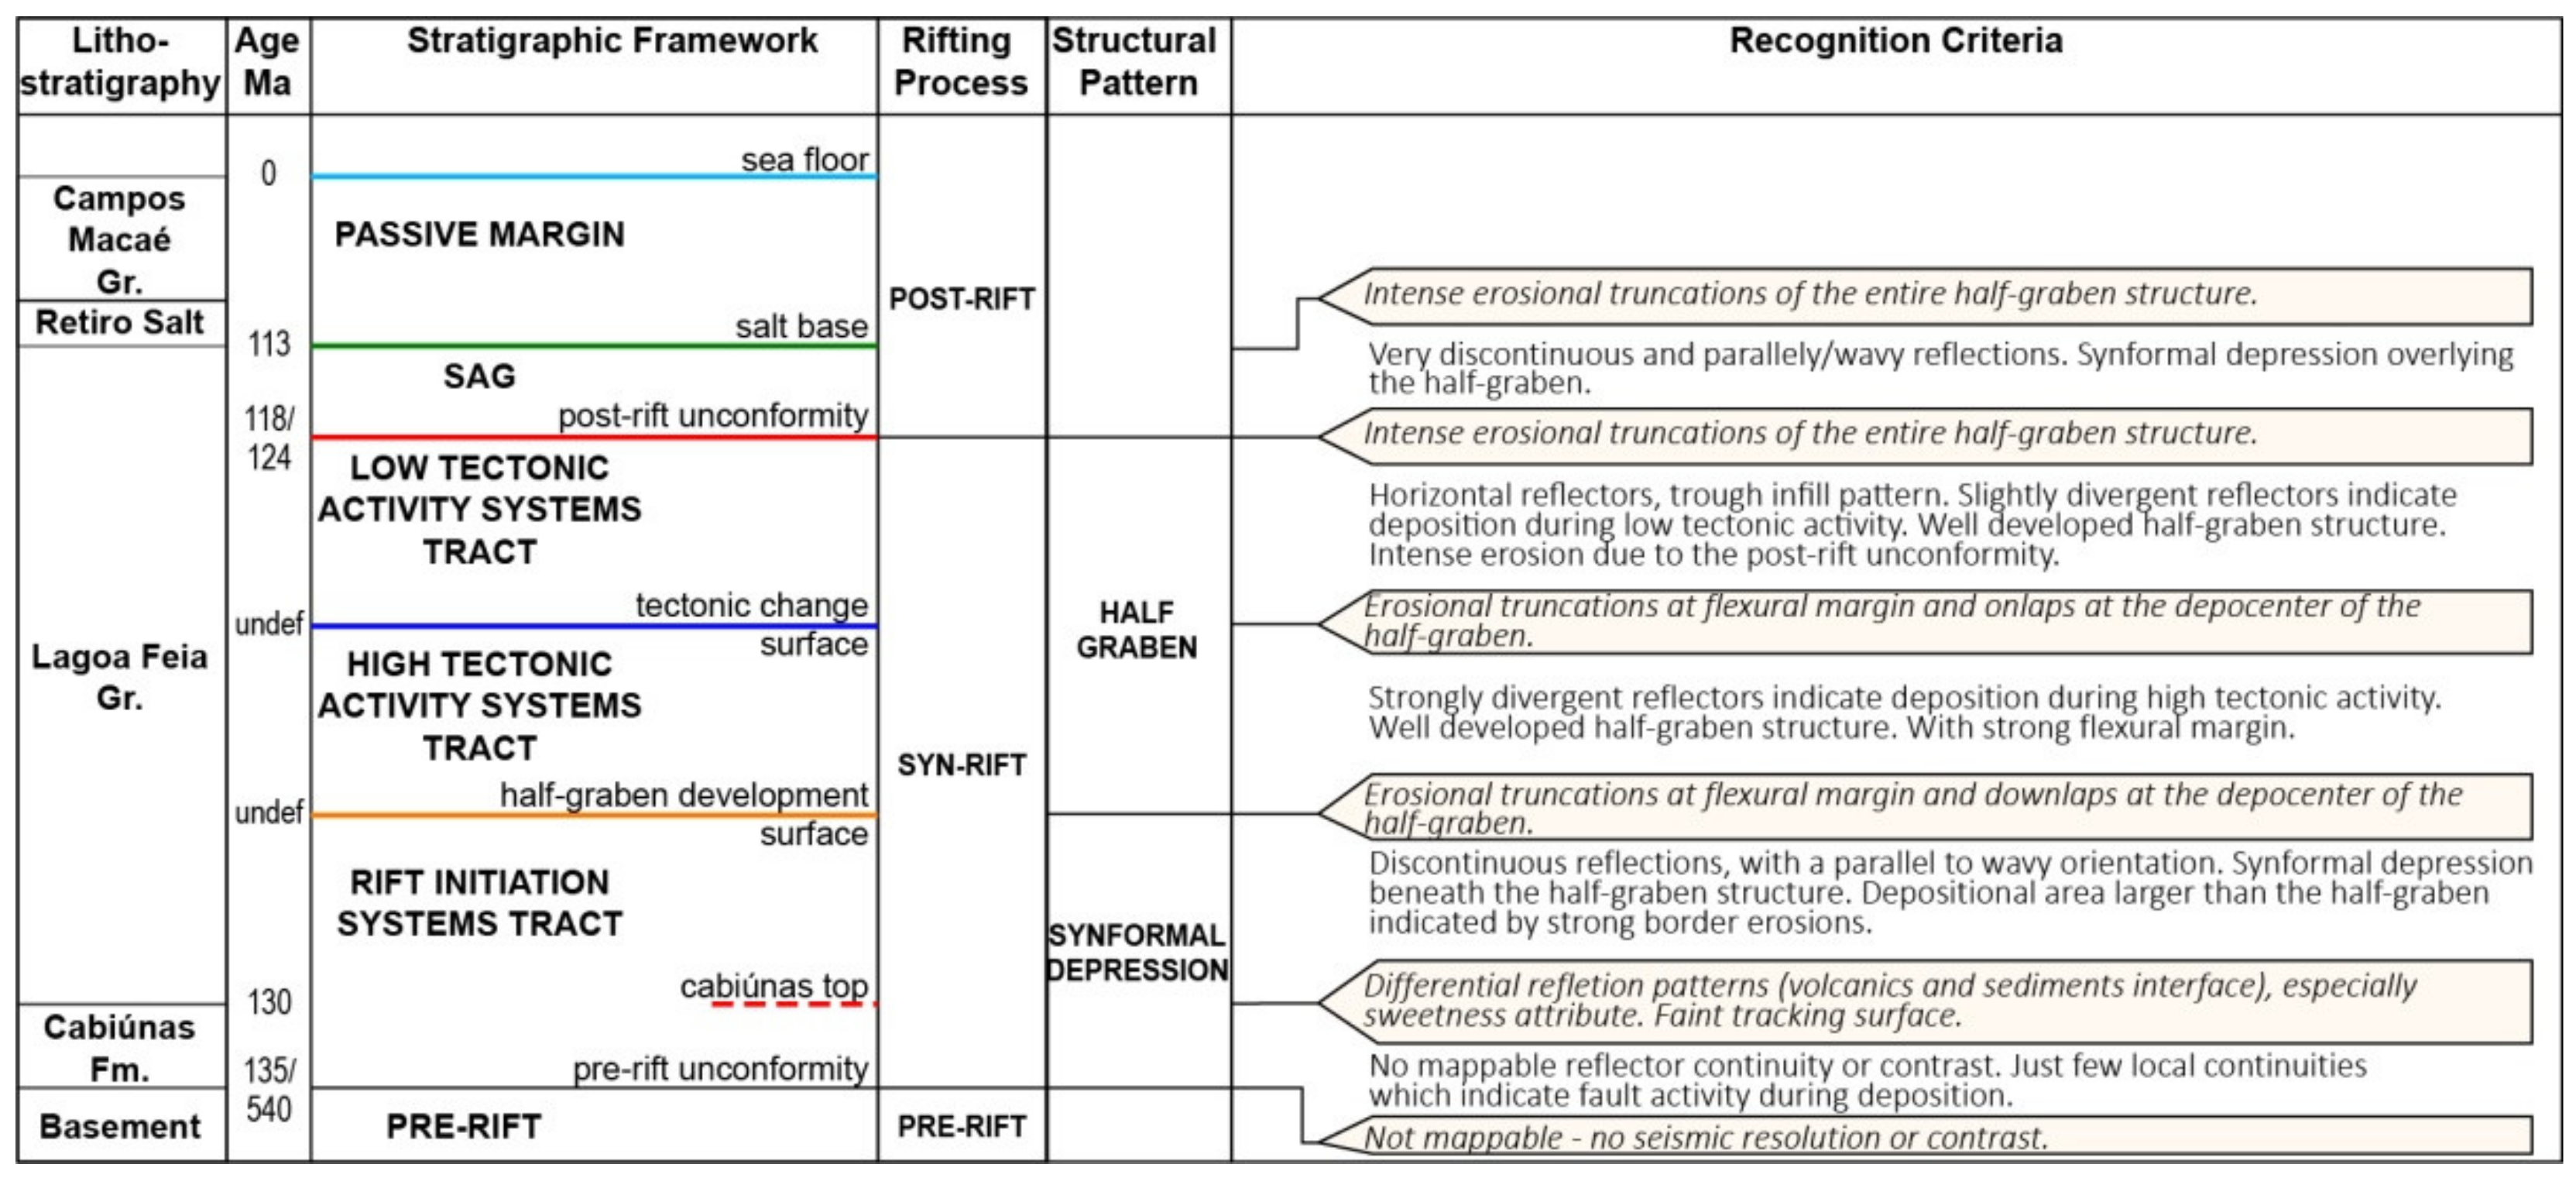
2. Geological Setting

The Campos Basin comprises a part of the Brazilian eastern margin basins, which have a geological evolution characterized by three distinct geotectonic phases [11,12]: (i) an initial pre-rift phase, dominated by intracontinental convergence in the Late Jurassic; (ii) an Early Cretaceous rift phase, where the extensional regime was intense, leading to the break-up of Gondwana; and (iii) a post-rift phase of continental drift and installation of a passive margin, which started in the Albian and is still ongoing.
The Campos Basin extends from the Cabo Frio High (at the south) to the Vitória High (at the north) along southeast Brazil (Figure 1A). Covering an area of 115,800 km2, the Campos Basin has a limited onshore area of 5800 km2, with the remaining area located offshore. This study focused on an area of 11.913 km2 along the inner offshore part of the basin (Figure 1B) and was based on seismic data covering this area.
The first stratigraphic chart for the Campos Basin was introduced by Schaller [13] and modified by Rangel et al. [7], and more recently modified by Winter et al. [14] (Figure 2). Initiation of the basin is associated with rifting and intense volcanic activity [7,13,14], which resulted in an extrusive volcanic substrate (the Cabiúnas Formation) with ages between 120 and 113 Ma [15].The basin fill was divided into three large stratigraphic units (Figure 2), associated with tectonic phases: (i) a rift, (ii) a transitional and (iii) a marine unit, the latter deposited on a passive margin [9]. The rift unit includes the oldest rocks of the basin (Upper Neocomian–Barremian) [14]. They consist of interbedded volcaniclastic rocks of the Cabiúnas Formation and lacustrine deposits of the basal-intermediate Lagoa Feia Group (Figure 2). The transitional unit comprises the upper Lagoa Feia Group, composed primarily of a thick basal clastic package, which is interlayered with lacustrine carbonates in the middle-upper section (known as the pre-salt reservoirs) and succeeded by evaporites at the top (Figure 2). This succession is of Aptian age and marks the transition from a continental to a marine environment [14]. In the study by Winter et al. [14], the Lagoa Feia Group was subdivided into the Atafona, Itapaboana, Coqueiros, Macabu, Gargaú and Retiro Formations. The Atafona and Coqueiros Formations correspond to the rift phase, while the Itapaboana Formation spans both the rift and sag phases, diachronously recording the basin margin, which comprises coarse clastic facies belts. The Macabu, Gargaú and Retiro Formations are related to the post-rift (sag) phase [14]. The rift section, studied in this work, is characterized by conglomerates with basalt clasts, comprising fan-delta and apron deposits associated with the border faults, fine- to coarse-grained sandstones, organic-rich shales and siltstones (Atafona Member), and rudstones/grainstones (Coqueiros Member). High-porosity facies are found in rudstone/grainstone deposits, with a thickness up to 200 m. These rocks represent continental deposition in a lacustrine environment. The rudstones/grainstones are bioclastic deposits composed of bivalves and ostracods with little reworking. The top of the Lagoa Feia Group, formed during the sag phase, is composed of thick continental deposits, with conglomerates of Aptian age, as well as Late Aptian red shales that pass upward to evaporites of the Retiro Member, comprising a rhythmic interbedding of halite and anhydrite [16].
Dias et al. [9] divided the Lagoa Feia Group into four lithostratigraphic units: (i) a basal, (ii) a talc-stevensitic, (iii) a coquina and (iv) a clastic-evaporite unit. Rangel and Carminatti [8] further separated the Lagoa Feia Group into 10 depositional units, named Unit A to Unit J. However, in the proposals for the Lagoa Feia Group by Dias et al. [9] and Rangel and Carminatti [8], the subdivisions bear no stratigraphic control. The units in the study by Dias et al. [9] are based on lithological criteria, and these authors do not present any stratigraphic surfaces for the division of the units and/or systems tracts as formally established by Catuneanu [17]. Rangel and Carminatti [8] used biozones and unconformities (identified in seismic and well logs) to identify and define the units. According to these authors, units D and E, referred as “Coquinas,” occur in areas restricted to structural highs. In the latest chronostratigraphic chart by Winter et al. [14], there is an extensive discussion of the lithological characteristics of the formations and members in the Lagoa Feia Group, but no chronostratigraphic boundaries between them or spatial and temporal controls have been identified. As we discuss in this work, the studied deposits are not located in a specific interval and can occur geographically and stratigraphically anywhere within the Campos Basin half-grabens.

3. Sequence Stratigraphy and Adaptation for Rift Basins

The principles of sequence stratigraphy were initially defined based on the seminal work of Peter Vail and collaborators [19,20], who recognized seismic units to map unconformities and define depositional sequences. Their proposals were subsequently evolved through later studies by Posamentier et al. [21], who developed conceptual models, and Van Wagoner et al. [22], who adapted and applied the model to outcrops, well logs and cores. After decades of tests and adaptations, Catuneanu [17], Catuneanu et al. [23] and Catuneanu [24] re-defined and summarized all the existing terminology in the literature (from basin-wide seismic studies, logs, cores and outcrops), establishing a coherent nomenclature and procedures in a model-independent perspective. Nowadays, sequence stratigraphy procedures can be applied to any kind of basin, regardless of the tectonic context, when defined by its basic controlling factors. The initial sequence stratigraphy approach to rift basins was proposed by Prosser [5], defining tectonic systems tracts—genetic units, as originally defined by Brown and Fischer [25]—related to specific tectonic patterns during rift evolution. In a later study, Bosence [26] defined syn-rift deposit as having a divergent stratal pattern, related to border fault growth during deposition, bounded by unconformities from the pre-rift strata—parallel and tilted—and post-rift strata—parallel and horizontal. This basic model works as a proxy to define syn-tectonic sedimentation and the stratigraphic interval of a rift occurrence. Gawthorpe and Leeder [27] proposed the fault linkage theory, where the faults start with small displacements and small lengths. With increased tectonic activity, fault displacement increases, and faults start to connect, generating long major faults. Morley [28] proposed the fault propagation theory, which is very similar to the fault linkage model proposed by Gawthorpe and Leeder [27]. Morley [28] argued that rifting starts with crustal stretching, generating numerous short and non-connected faults, with small displacements, which result in a sinformal depression, with a size larger than the subsequent half-graben structure. Increased tectonic activity connects the faults, enlarges the displacement and concentrates deformation along some specific faults, thus generating half-graben structures. Kuchle and Scherer [6] used these concepts to develop a seismic sequence stratigraphy analysis in the Recôncavo Basin (located in northeastern Brazil, with similar age and geotectonic context to the Campos Basin), based on the tectonic systems tracts of Prosser [5], the stratal patterns of Bosence [26] and the rift geometric phases of Morley [28]. Martins-Neto and Catuneanu [29] proposed a sequence-stratigraphic model for rift basins using stratigraphic patterns. Their methodology provides a definition of key surfaces for stratigraphic correlation and a framework for understanding the process–response relationship between the controls on accommodation and the resulting stratigraphic architecture of rift basins. For these authors, a typical rift depositional sequence is composed of stratigraphic cycles dominated by progradational depositional trends with coarsening-upward successions. Deposition starts with a flooding surface overlain by a relatively thin transgressive systems tract and a well-developed highstand systems tract. All these models converge into a basic methodology for mapping rift sections: identify changes in stacking patterns, representing stratigraphic surfaces such as the maximum flooding surface or maximum regressive surface of Catuneanu [17], the classic recognition of unconformities of Vail et al. [19], or the method proposed by Hubbard et al. [30] to manage large-scale sequences on rift basins, which uses the Unconformity Bounded Stratigraphic Unit (UBSU) of Salvador [31]. However, as Kuchle and Scherer [6] showed, a rift tectonic pulse commonly leads to uplift on the footwall and simultaneous subsidence on the hangingwall due to block rotation on the flexural margin. This movement generates erosion at the proximal zone of the flexural margin (creating an unconformity) and deposition at the distal zone of the flexural margin (depocenter). Consequently, an unconformity on a rift trough is very restricted to the proximal zones and connected to a correlative conformity (sensu Catuneanu [17]) at the depocenter. Moreover, as depicted by Rosendhal et al. [32], during a rifting process, not all half-graben structures (or troughs) move at the same time or with the same intensity. Hence, the best practice is to carefully map rift sequences based on seismic stratal patterns, stacking patterns changes and proximal zone unconformities, expressed by erosive truncations connected to correlative conformity at the distal zone. The mapping needs to be individualized in each trough branch (half-graben or connected grabens pack). Thus, large regional or interbasin connection attempts are very doubtful.

4. Campos Basin Sequence Stratigraphy

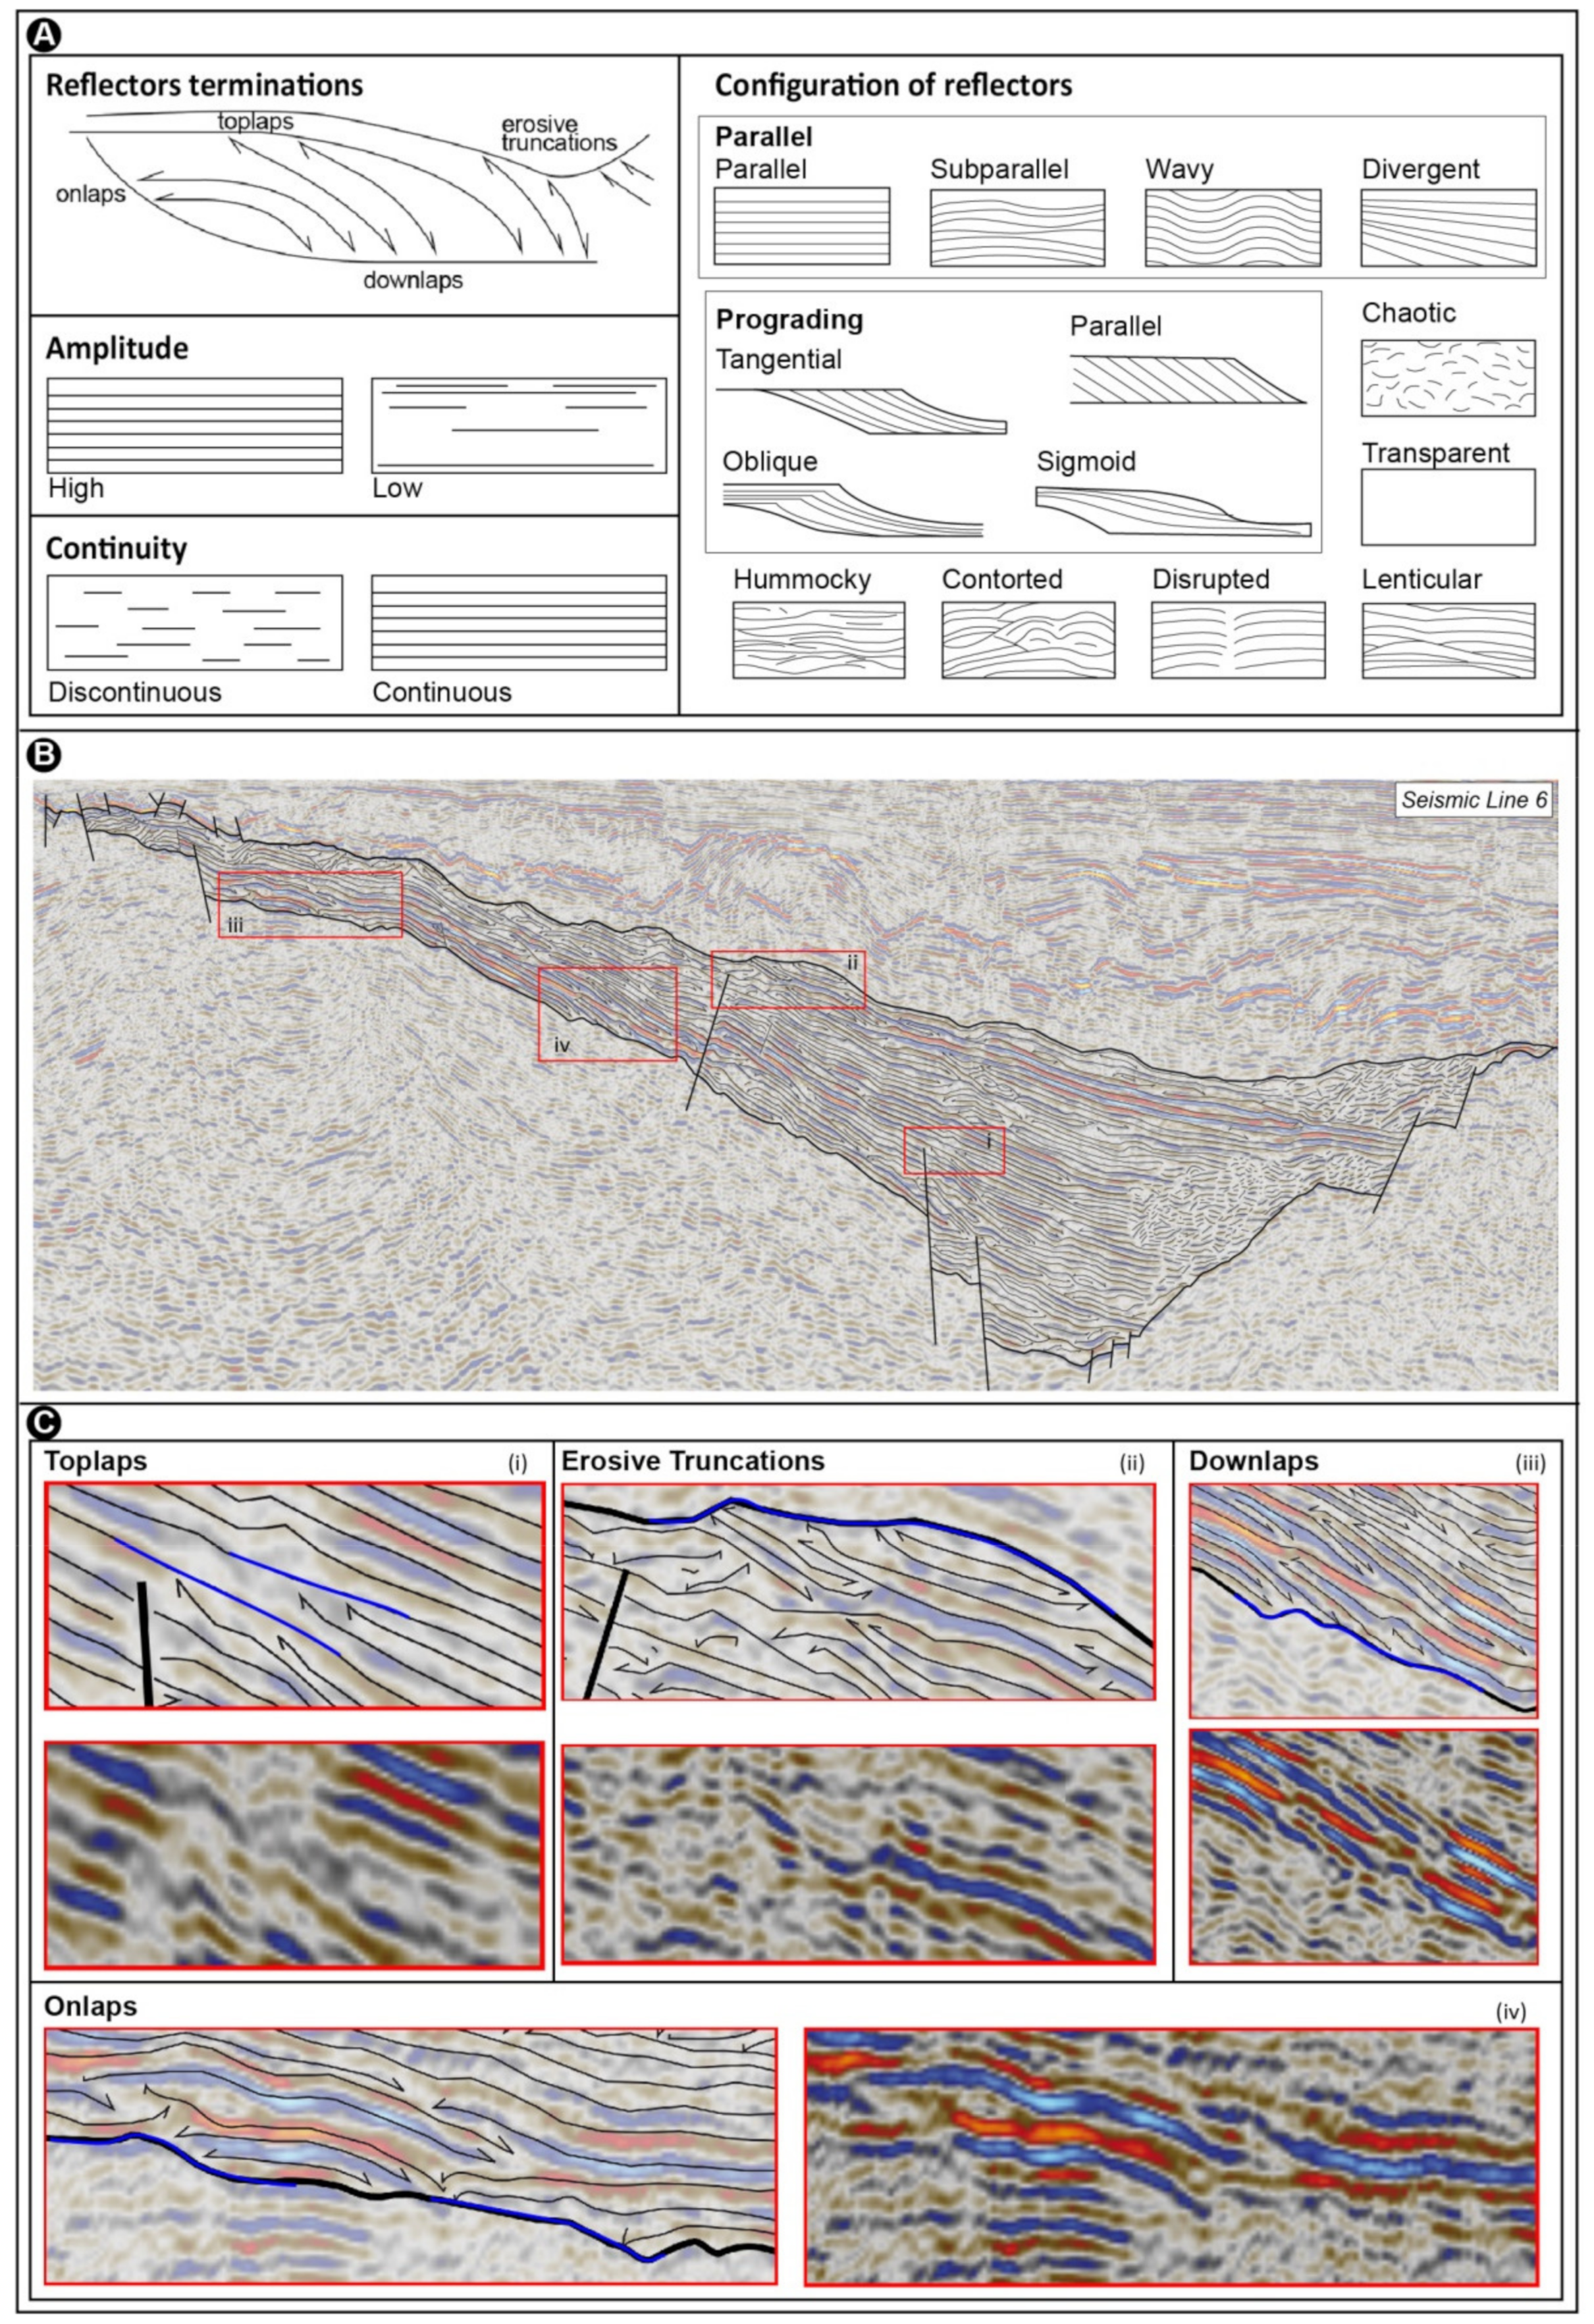
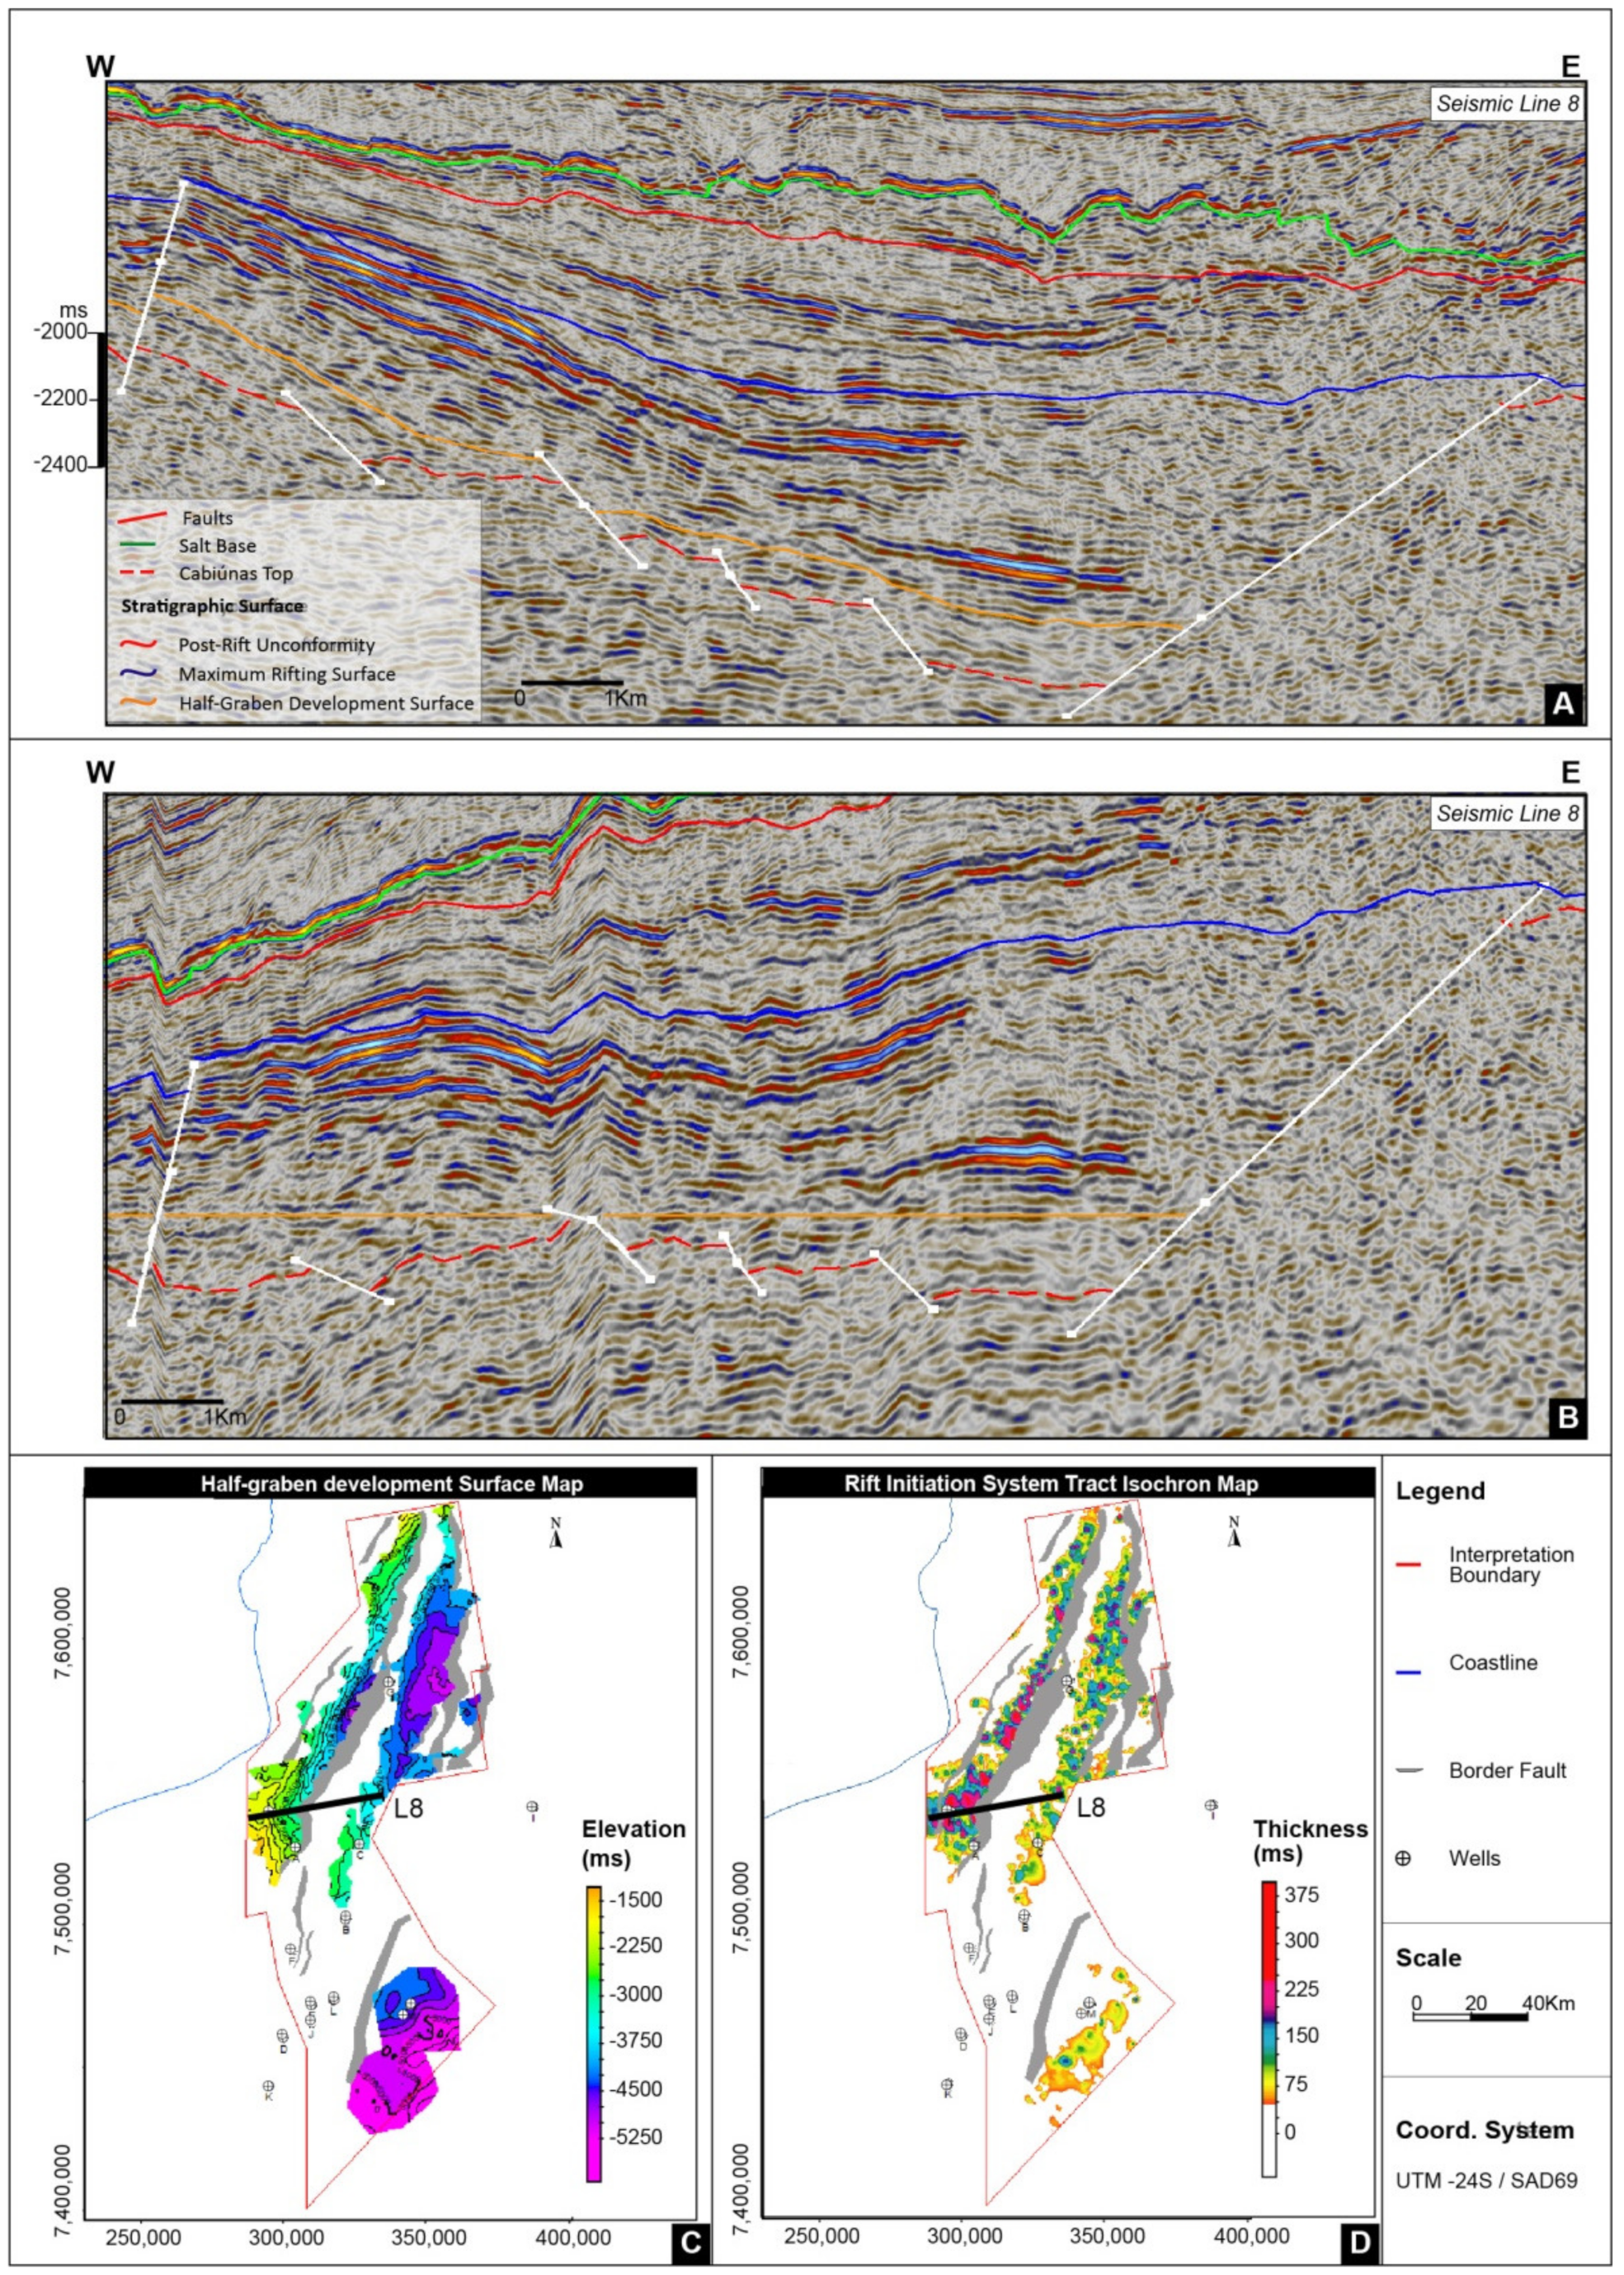
4.1. Seismic Analysis Procedure

The model proposed here is grounded by systematic seismic stratigraphic mapping of 2D seismic lines in the Campos Basin, based on the methodology proposed by Vail and Mitchum [33], Abreu [34], Neal and Abreu [35], and Kuchle and Scherer [6]. The seismic stratigraphic analysis performed comprised the following steps: (1) Reflector interpretation, consisting of determining reflector terminations with a stratigraphic significance. After determining the top and bottom of the studied interval, all the reflectors were tracked based on their continuity, amplitude and frequency. The reflectors can be differentiated by their type of termination, such as erosive truncation, toplap, onlap and downlap (Figure 3A,C), indicating stratigraphic significance related to depositional events. (2) Definition of seismic stratigraphic units, in which the unit is a set of chronostratigraphically related strata that displays seismic expression, being delimited at the top and bottom by reflector terminations (onlaps, downlaps, toplaps and erosive truncations). Not all the stratigraphic units may be bounded by key surfaces, in which case they are simply successions of depositional events. However, is important to individualize these units to perform a sequential depositional history. (3) Definition of seismic facies to define patterns related to architectural elements, depositional systems or sedimentation environments that depend on the scale and resolution. Seismic facies were defined by Brown and Fisher [25] as a three-dimensional unit, with a defined area, consisting of seismic reflections whose inherent parameters differ from the adjacent facies. Seismic facies constitute the seismic reflection of the geological factors that generate them, such as the type of lithology, stratification, depositional features, etc. The analysis of seismic facies is made through the geological interpretation and description of the seismic reflection parameters, such as continuity, configuration, amplitude, frequency of the reflectors and interval speed [20] (Figure 3A). (4) Construction of a chronostratigraphic chart, as originally proposed by Wheeler [36]. This step consists of an all-data integration within a chronostratigraphic diagram, using geological time as vertical scale. The diagram summarizes the erosive events, depositional packages and their filling, as well as their filling patterns (seismic facies), depositional trends and controlling variables. The integration of sedimentological data (core, petrographic data) and seismic stratigraphy (seismic stratigraphic units, seismofacies and chronostratigraphic charts) allows the definition and internal characterization of a stratigraphic framework, formed by surfaces considered fundamental and mappable within the study area. Thus, the chronostratigraphic chart constitutes the best integrative way to present a complete stratigraphic scenario based on the data available.
The seismic analysis procedure described above was performed on five 2D seismic lines in two-way travel time (TWT, milliseconds). By analyzing these five lines, the general stratigraphic framework was defined. Key surfaces were also identified, which were mapped on 115 seismic lines (63 dip-and 52 strike-oriented). The selection of lines to be interpreted was based on the following criteria: (1) their spatial distribution in the study area, (2) the quality of the seismic signal in each line and (3) their representation of the structures and patterns of reflections in the study area.
In the study area, 10 segments of border faults were mapped (Figure 4). Of those, nine showed a fault plane dipping to the west, and only the southern border fault segment dipped to the east. These segments connect at places, generating complex structures such as relay ramps and deformation accommodation zones (internal, relative highs). Thus, the mapped border fault segments defined the occurrence of three main structures in the form of half-grabens (Figure 4B). In the northern region of the study area, two half-grabens with a vergence to the east (flexural margin to the west and faulted margin to the east) are laterally adjacent to each other. To the north, the mapping was limited by the low quality of the seismic data, but the trend is toward thinning and termination of the border fault (as proposed by Rosendhal et al., 1986 [32]). Toward the south, the half-grabens also display thinning terminations, generating in the south-central region a wide shallow homoclinal footwall ramp. To the south lies a half-graben that is spatially inverted in relation to the northernmost ones, with a faulted margin on the west and a flexural margin on the east, defining a half-graben with a west vergence.
The interpretation of reflectors was performed systematically, with mapping of all reflectors and their terminations within the analyzed interval. Afterward, the units that make up different temporal events and represent depositional changes were defined. The seismofacies were identified by the combination of lithologic data (from wells), use of seismic attributes (sweetness, cosine phase, RMS amplitude and relative acoustic impedance) and properties of the reflectors, which allowed the inference of depositional systems. The characterization and interpretation of the controlling variables of the studied stratigraphic interval was carried out through the definition of systems tracts from seismic stratigraphic units based on geometric patterns and their spatial distribution. Finally, construction of the chronostratigraphic diagram allowed the integration of all data in a temporal scale. A detailed description of each step in the seismic stratigraphic analysis is presented below.

4.1.1. Reflector Terminations Analysis

The first step for seismic stratigraphic analysis comprises the interpretation of reflector terminations. Through the configuration of their geometric patterns, amplitude, frequency and continuity, the reflectors were used to separate the stratigraphic units. A systematic mapping of reflectors in the entire rift section was performed in 14 seismic lines, shown in Figure 1. Reflector termination types were determined in several stratigraphic levels. As an example, toplap terminations are uncommon, scattered or found in couples (Figure 3C(i)). This scarcity is related to the absence of clinoforms or sigmoidal geometries, and to the high accommodation levels in the rift troughs, which maintain a high accommodation-to-supply ratio. Erosive truncations (Figure 3C(ii)) are concentrated at the top of the studied rift interval, marked by an erosive and irregular surface, typical of an unconformity. In addition, an internal surface shows minor erosive truncations, indicating possible erosive events on a flexural margin. Downlaps (Figure 3C(iii)) are very common, and usually follow a succession surface or a pair with opposite directions, suggesting mound geometry. These downlaps possibly indicate a sediment input as pulses on a rift trough. They are commonly related to onlaps (as couples), with geometries interpreted as stacked mounds (mound complexes). Likewise, onlaps are common and follow specific surfaces, but they also appear scattered in the entire rift section. The basal isochron mapped shows a succession of onlaps (Figure 3C(iv)), indicating the continuous creation of accommodation.

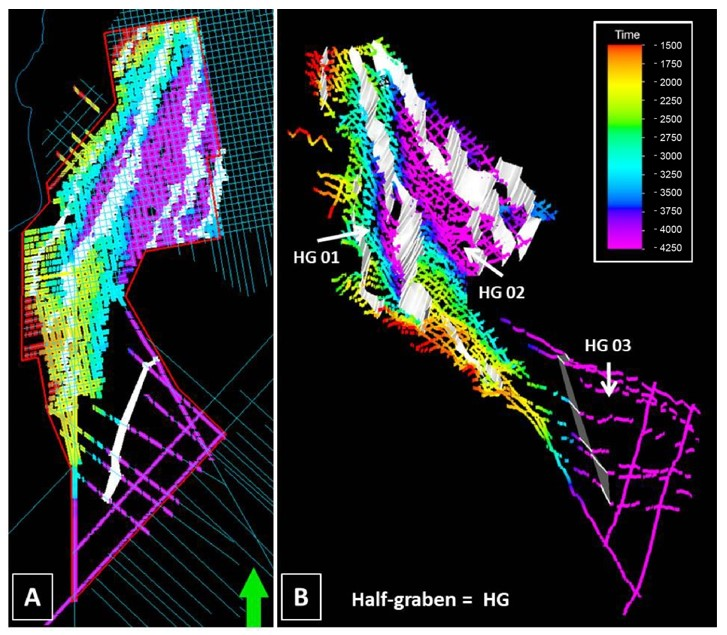
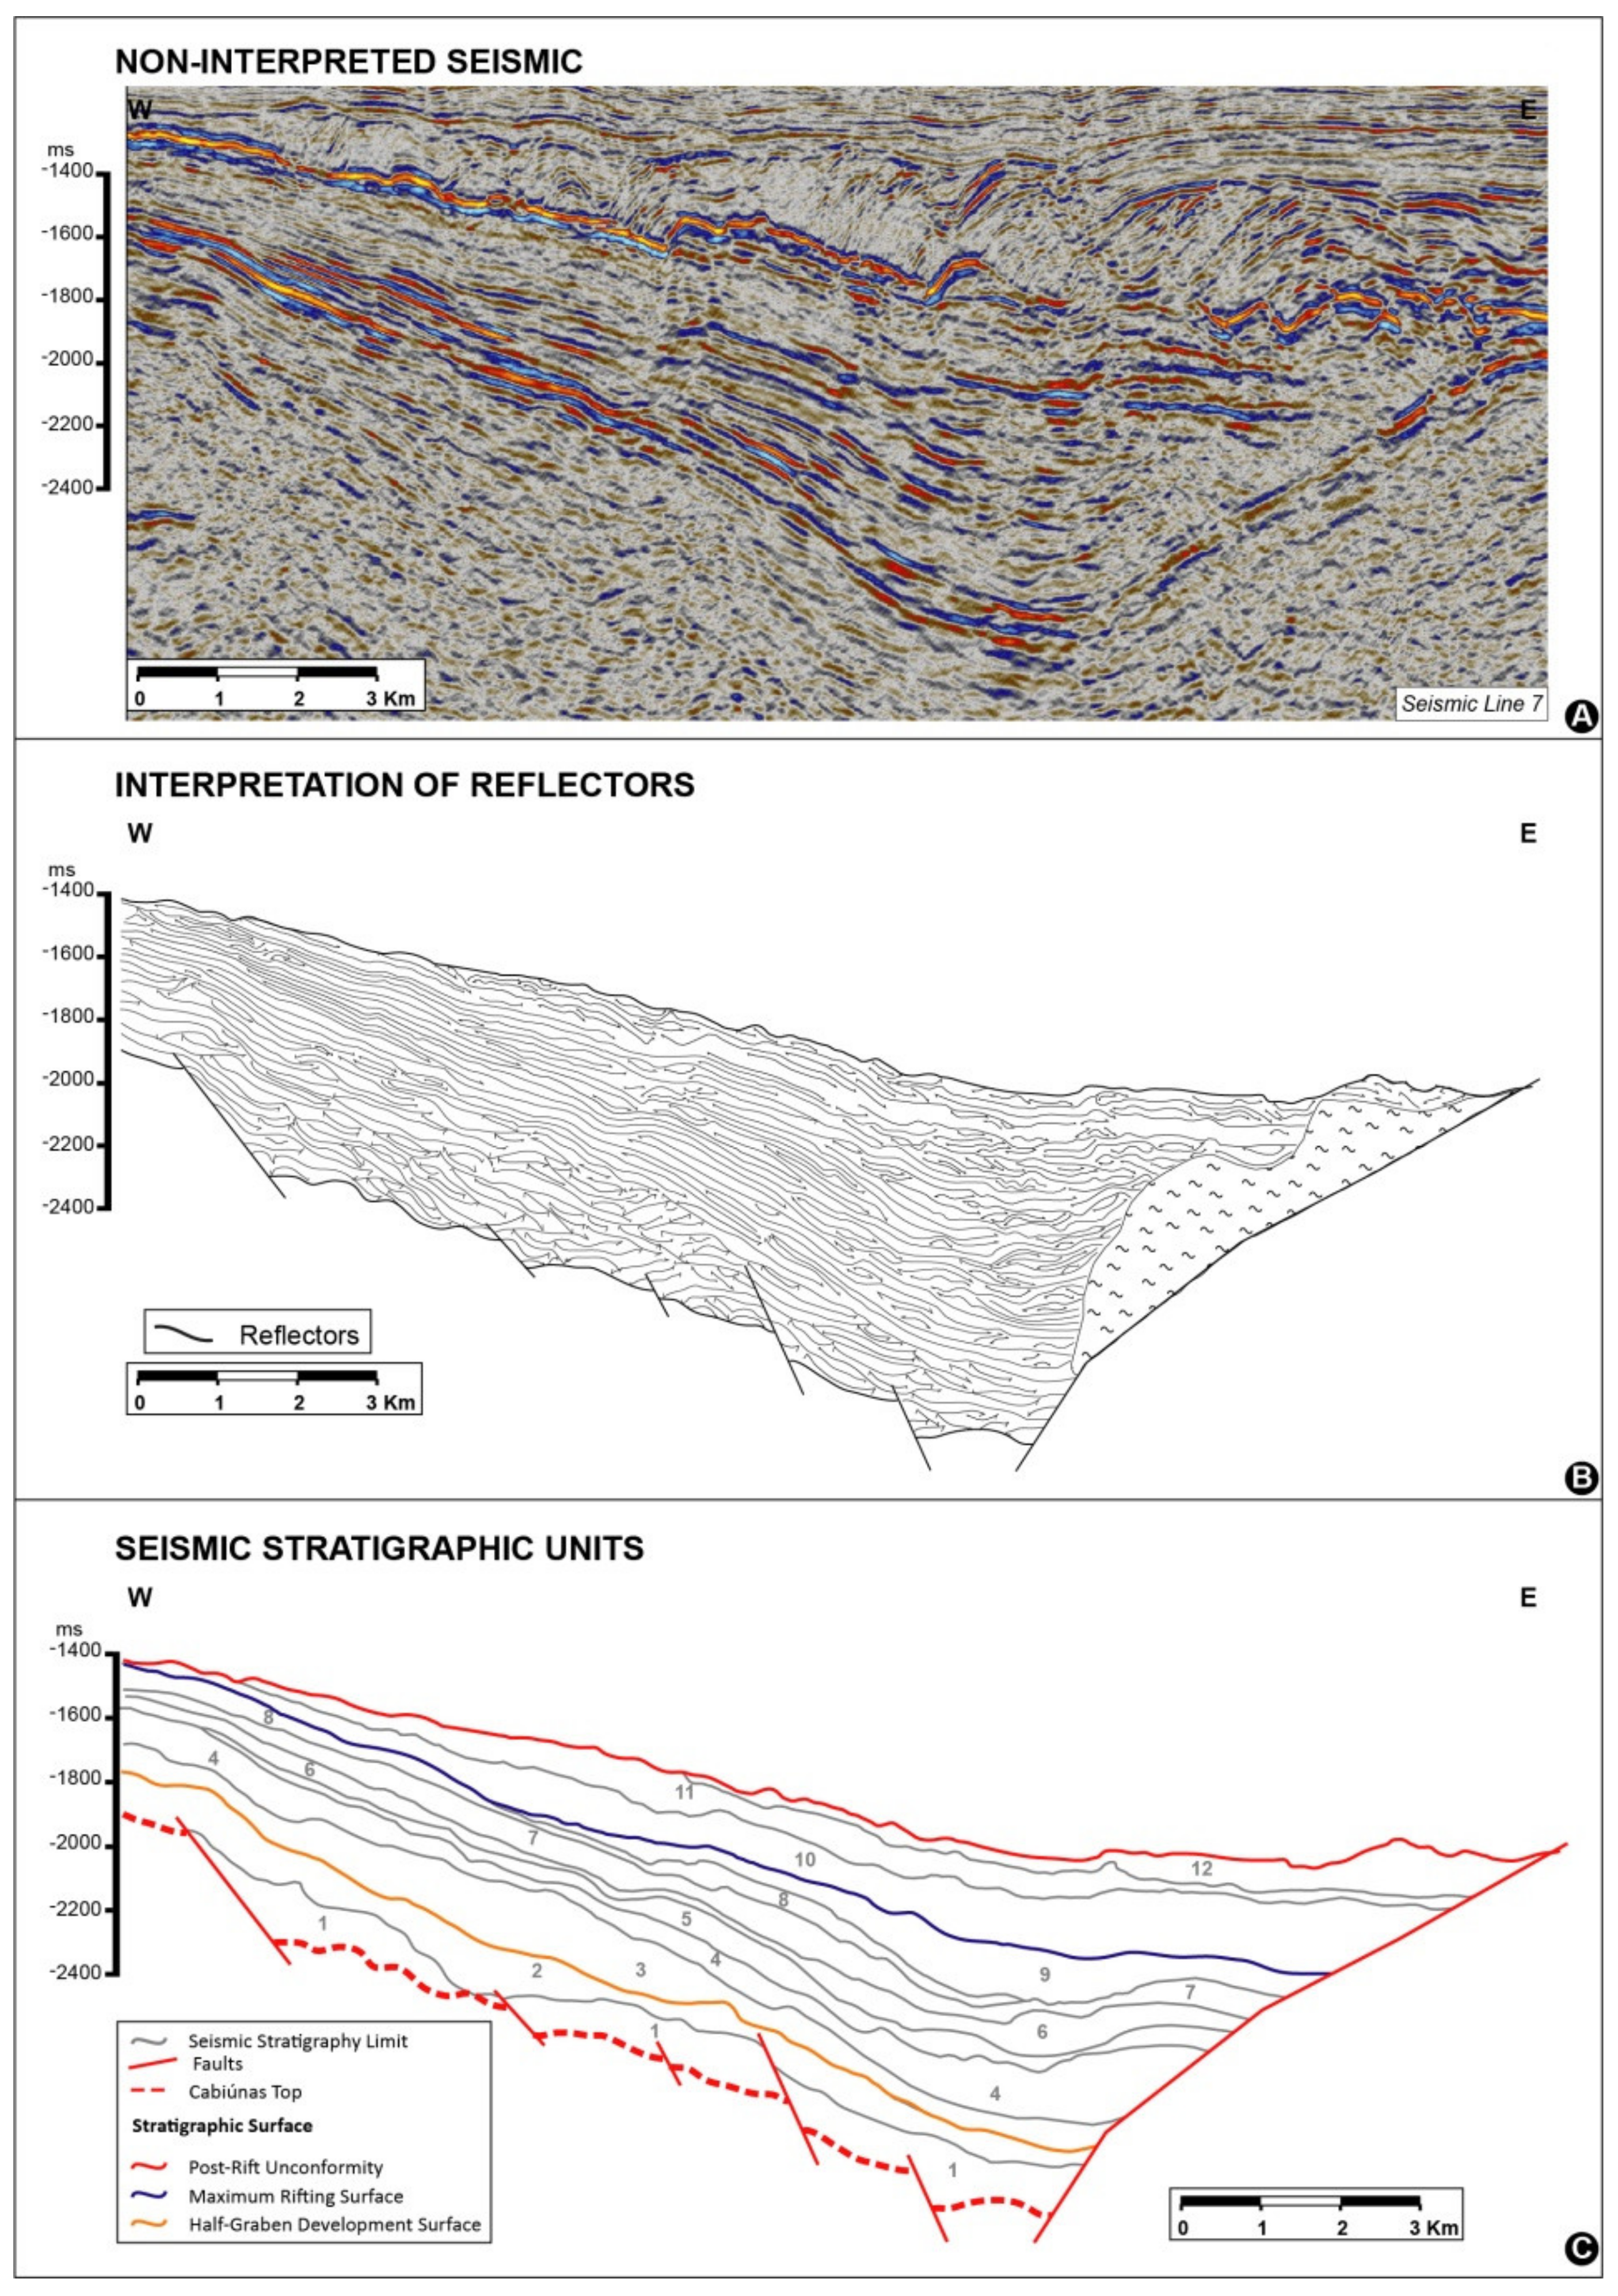
4.1.2. Seismic Stratigraphic Units

Tracking successive reflector terminations on specific surfaces allowed the characterization of 12 seismic stratigraphic units (SUs) (Figure 5). Seismic stratigraphic units are depositional units related to different temporal events [20]. Occasionally, they are separated by stratigraphic surfaces, but they can also mark only successive depositional events without changes in patterns and trends. The 12 SUs identified represent a successive depositional infill within a half-graben structure. Some units were deposited across the half-graben, as in SU3 and SU4, extending from the flexural margin to border fault. Others, such as SU5 and SU9, are restricted to the central zone of the half-graben and the border faults, and absent in the upper flexural margin due to erosion. Erosion is always marked by erosive truncations and interpreted resulting from block rotation, which generates accommodation in the depocenter (hangingwall), close to the border fault, and uplift and erosion in the upper flexural margin (footwall), at the same time.
The seismic “thickness” of these stratigraphic units and its relation with the time of deposition may not be similar for all units. It is directly related to the seismic resolution and the capacity to identify a relevant amount of reflector terminations to separate units. Thus, in deeper parts of the section, it is more difficult to recognize thinner units. The geological complexity and imprinting of depositional events on seismic must also be considered. The timeframe of the observed SUs is presented here as relative, as no age data were available. Biostratigraphic analysis and isotope dating efforts would be valuable to position the observed SUs on a geological time chart and define the real-time rate of accumulation of the units.

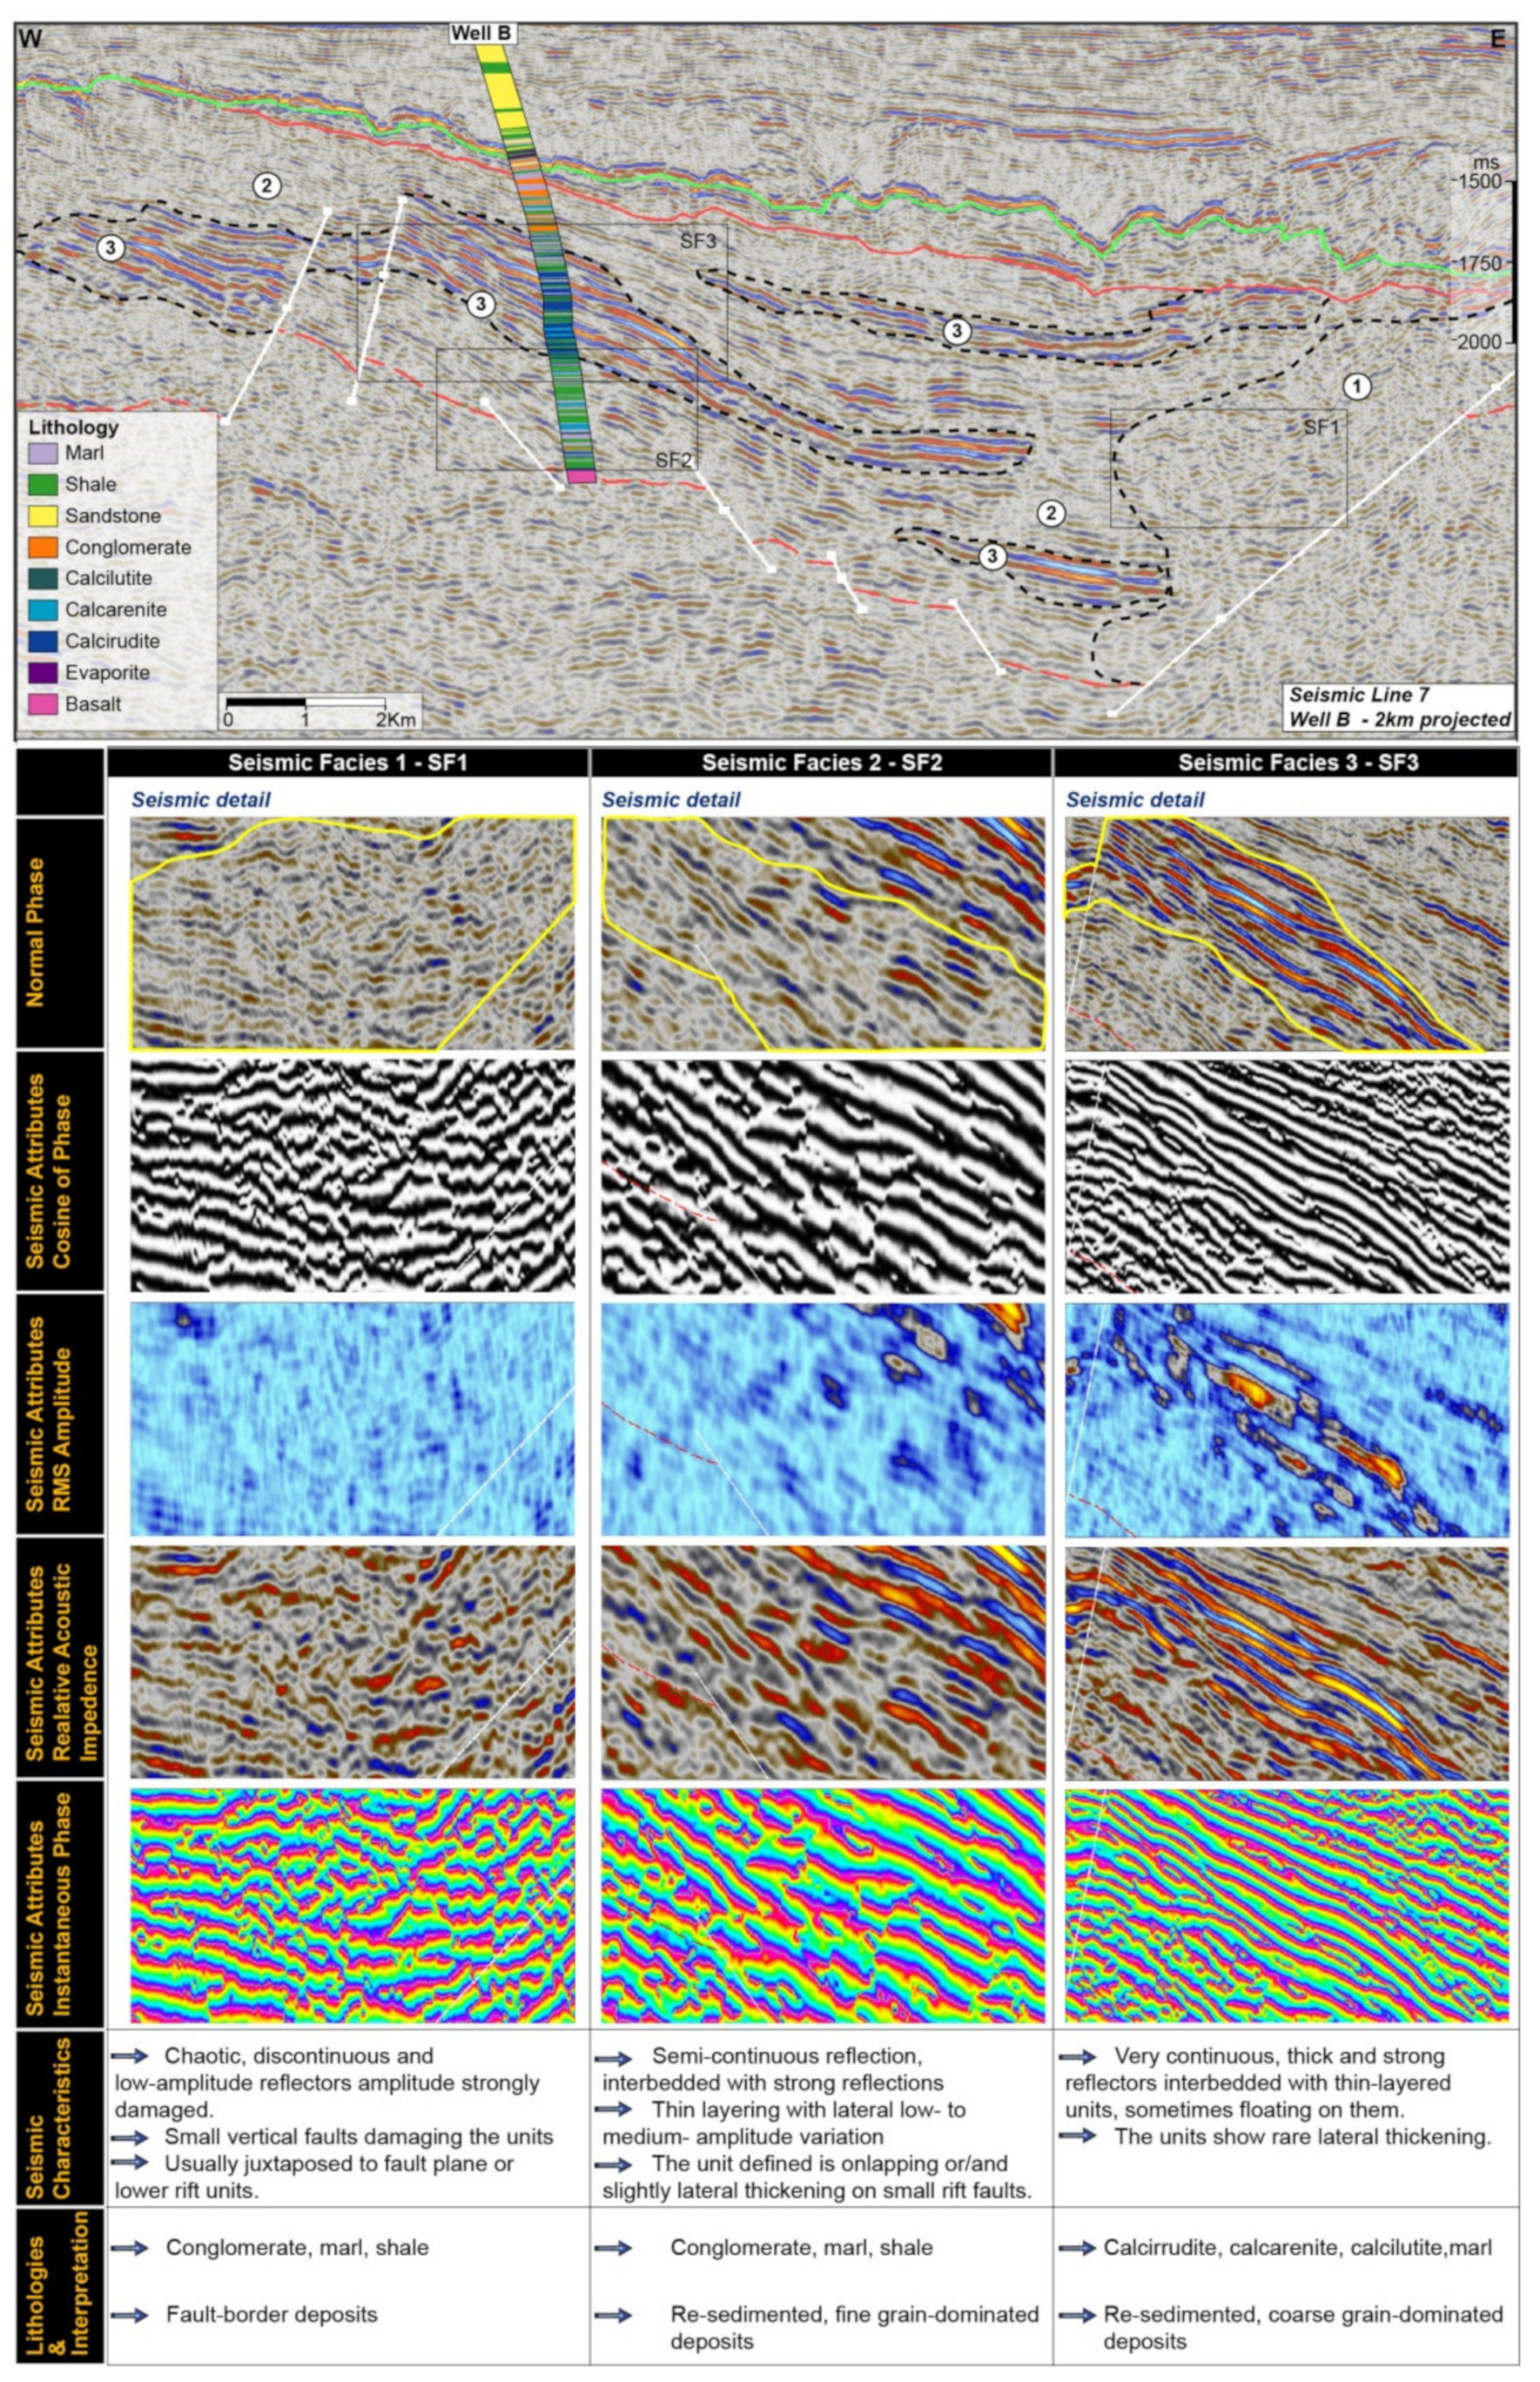
4.1.3. Seismic Facies

Seismic facies characterization was used to define patterns related to architectural elements, depositional systems or sedimentary environments, depending on the scale and resolution. Seismic data and well information were used to characterize a set of three-dimensional seismic units, comprising groups of reflectors with behavioral parameters that differ from adjacent the units, defining seismofacies [20]. The main types of seismic features applied in seismofacies mapping were: (i) seismic amplitude, (ii) geometry of reflectors, (iii) continuity of reflectors and (iv) when possible, their seismic frequency properties (Figure 3A). For this, several seismic attributes were used. In the same stratigraphic interval (rift section of the Campos Basin), Alvarenga et al. [18] applied the same set of seismic attributes to identify hydrothermal vents and define seismic facies. The information obtained from seismic recognition was tied to well data to construct a seismic facies model that allowed correlation and the determination of the lithological composition of the seismic facies recurrent in the entire study area.
The geological interpretation of the three recognized seismic facies was based on data from exploratory wells drilled near the seismic sections analyzed. Goldberg et al. [10] proposed a new depositional model for the Lagoa Feia Group based on well log data and approximately 300 m of described cores, observing the following: (i) sediment composition characterized by mixing of clastic, stevensitic and carbonate particles; (ii) high fragmentation of bivalve bioclasts; (iii) the absence of sedimentary structures indicative subaerial exposure; (iv) the absence of bioturbation; (v) the dominance of medium-to coarse-grained, massive or faintly laminated deposits, with rare structures indicative of tractive and oscillatory flows; and (iv) the co-occurrence of incompatible constituents, such as stevensite and bivalves. According to Goldberg et al. [10], all the previously mentioned observations tend to support a depositional model mainly characterized by re-sedimentation of shallow-lacustrine sediments through subaqueous gravity flows, formed in different periods and/or localities within the rift lakes comprising the Lagoa Feia Group. In a related study, Armelenti et al. [37] analyzed more than 150 thin sections from Campos Basin rift deposits that were quantified for their primary constituents. The sections demonstrated diagenetic features and lithological classification, providing information regarding their burial history and depositional petrofacies. Based on results of the latter study, the rift section is mainly comprised by fine-grained, background lacustrine deposits, interbedded with re-sedimented deposits from shallower regions of the half-graben (no longer preserved). The observed re-sedimented deposits were interpreted as mass transfer deposits triggered by tectonics, as defined by Playton et al. [38]. These re-sedimented deposits can be either fine-grained (and then the distinction from lacustrine background sediments in seismic would be impossible) or coarse-grained (usually rudstones/grainstones). Clastic conglomerates were also recognized along the border faults, interpreted as fan-delta to apron deposits. The previous interpretations of Goldberg et al. [10] and Armelenti et al. [37] were used in this study as a basis for defining the depositional systems and related seismic facies characteristics.
Seismic facies 1 comprises chaotic reflectors without lateral continuity and with low to medium amplitude (Figure 6). They are interpreted as primarily composed of conglomerate deposits, and their occurrence is geographically associated with the border faults, suggesting that deposition is controlled by tectonically triggered movements along the border faults (Figure 6). This seismic facies is interpreted as fan-delta to apron deposits [10] originating from uplift and erosion of the footwall block along border faults.
Seismic facies 2 displays a divergent configuration in most parts of the basin, along with portions with hummocky reflections configuration close to the basin depocenters. The reflectors show a low amplituderanging from continuous to discontinuous, with onlap terminations being the dominant reflector type (Figure 6). The spatial arrangement of this facies varies along the studied interval, with no particular concentration, occurring temporally and spatially dispersed across the entire basin (Figure 6). Data from well B show a predominance offine-grained lithological types (shales, marls and calcilutites), although, in some few intervals, coarse-grained lithotypes (conglomerates) may occur. Seismic facies 2 is interpreted as background lacustrine deposits.
In seismic facies 3, the reflectors display a parallel configuration, with high to medium amplitude and good lateral continuity (Figure 6). The predominant reflector terminations are mainly onlaps and downlaps. Seismic facies 3 transitions laterally and along the dip to seismic facies 2, demonstrating mounded geometries. Lateral reflector transitions are complex along the flexural margin. In some cases, seismic facies 3 occurs fully immersed in seismic facies 2. This complexity does not allow the determination of proximal or distal trends in relation to seismic facies 2. The composition of seismic facies 3 on Well B is predominantly rudstones and calcarenites, with some shale intervals. Seismic facies 3 occurs scattered in space within several stratigraphic units, both on the flexural margin and the depocenter of the half-graben (Figure 6). This is in stark contrast with the observations by Rangel and Carminatti [8], and Abrahão and Warme [39], who asserted that these deposits, interpreted as shallow marginal deposits, were only found in structural highs. Previous works have also stated that rudstone deposits (“coquinas”) occurred exclusively in a stratigraphic interval (named “coquina sequence”). However, seismic facies 3 is interpreted in the present study due to the reworking and erosion of shallow marginal sediments, mainly bivalve accumulations [10]. Tectonic pulses caused the uplift and destabilization of the carbonate deposits, which resulted in the re-deposition of these sediments by gravitational flows. This sedimentological interpretation is related to single re-sedimentation events, rather than the total observed thickness of seismic facies 3. Thus, the 330 m-thick interval with seismic facies 3 on Well B (Figure 6) represents a complex series of several re-sedimented deposits, probably reflecting a period of intense tectonic activity.

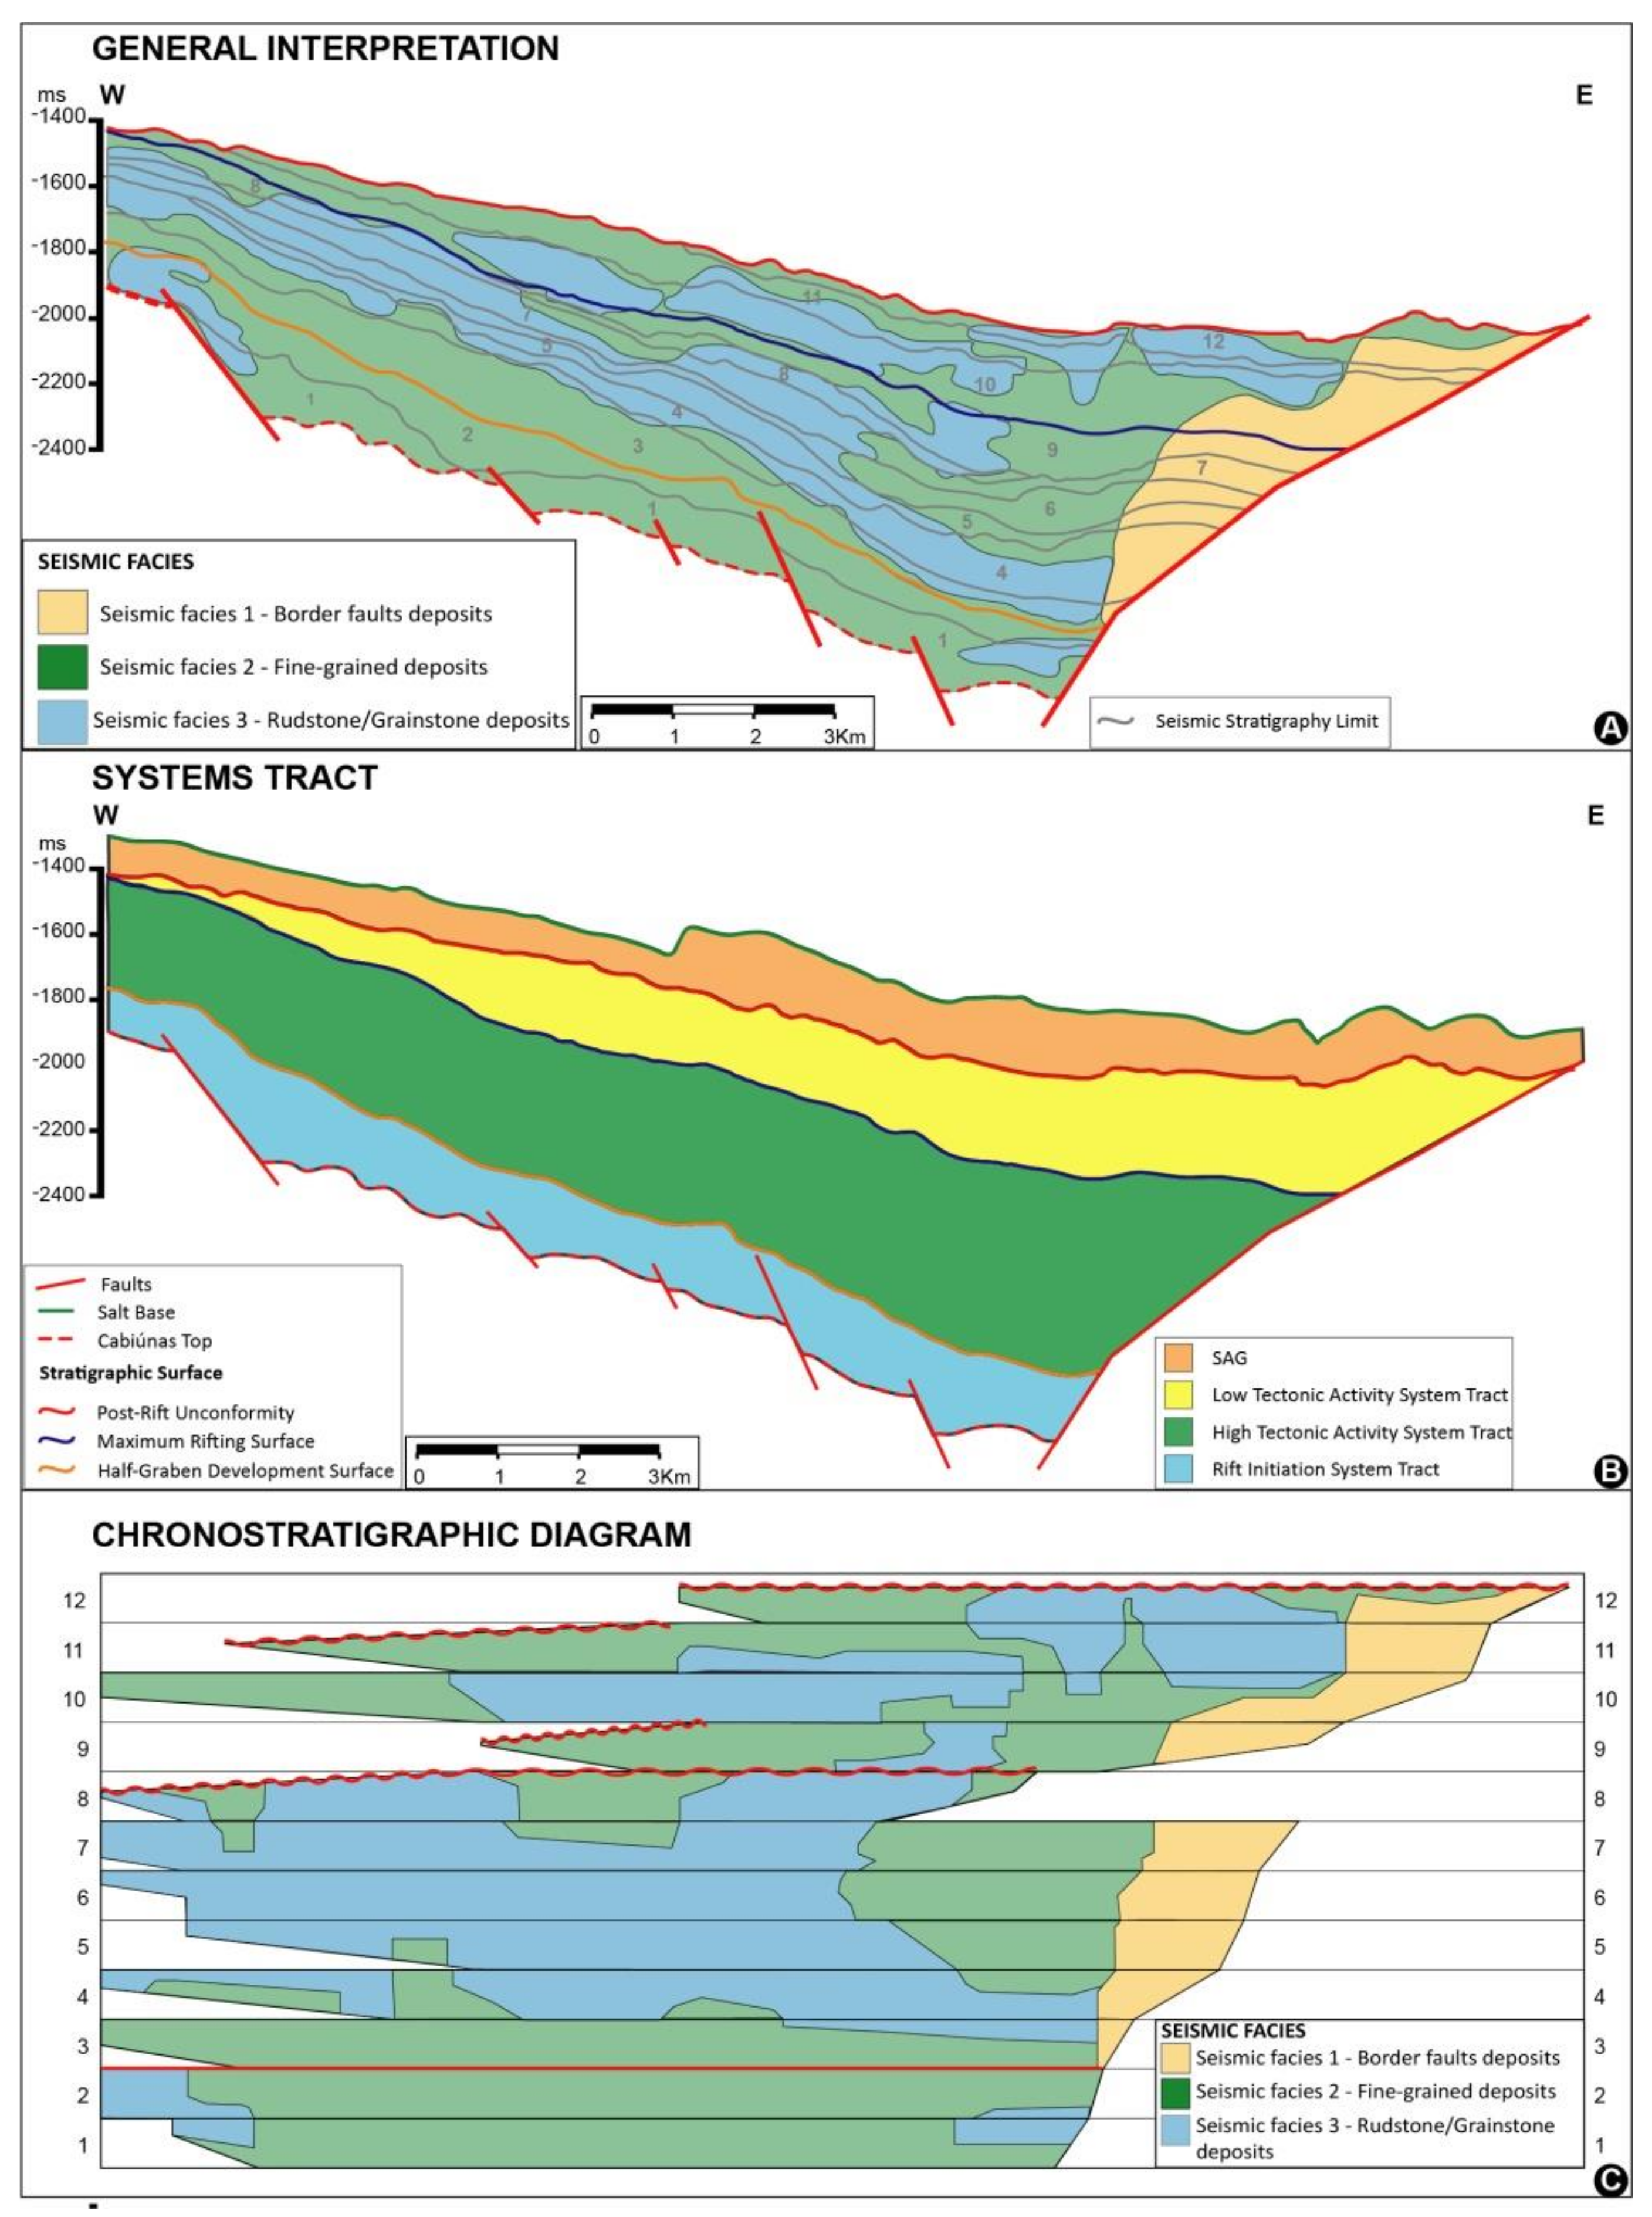
4.1.4. Chronostratigraphic Chart

The constructed chronostratigraphic chart (Figure 7C) integrates the stratigraphic units, seismic facies and key surfaces for the stratigraphic framework, resulting in a diagram that displays the joint temporal and spatial distribution of units and basin infill as defined by the seismic data.
The interpretation of the chronostratigraphic chart allowed the definition of regionally significant surfaces that mark changes on the controls of rift basin evolution, recorded by the different seismic stratigraphic units (SUs). SU1 and SU2 show a more flat and multi-fault-controlled pattern than the upper units. They are characterized by few occurrences of seismic facies 3 (calcirudites) and the absence of seismic facies 1 (border fault deposits). From SU3 to SU9, an onlap surface marks the base of each unit, and an upward continuation of onlapping successions indicates the continuous creation of accommodation, resulting in a high accommodation-to-supply rate. Erosional features are few, and abundant seismic facies 3 (calcirudites) from the upper flexural margin to the central part of the rift trough was observed, along with the expansion of the conglomerate fan from the border fault (seismic facies 1). From SU10 to SU12, the onlapping is less intense, and erosions are more frequent and more prominent. Seismic facies 3 is still present, in contrast with seismic facies 1, which shows a retreat close to the border fault. Despite the lack of stacking patterns observed, the geometry, surface type and distribution of seismic facies in the chronostratigraphic chart allowed the identification of significant units based on controlling variables.

5. Discussion

5.1. Interpretation of the Controlling Variables and Seismic Stratigraphic Framework

The usual definition of controlling variables is based on stratigraphic surfaces and stacking patterns [17]. However, in the case of the Campos Basin rift, no clear stacking patterns could be defined by the relations between seismic facies. Only border fault fan delta deposits (seismic facies 1) and a complex interplay (with no trends or shifts) between lacustrine background and re-sedimented mass transfer deposits (seismic facies 2 and 3) were observed. All the stratigraphic units bounding surfaces are related with abrupt accommodation creation and half-graben expansion, and some of them are related to erosion of the upper flexural margin due to block rotation.
The stratigraphic framework proposed here (Figure 8) for the rift section of the Campos Basin comprises units that are representative of distinct events and based on specific conditions defined by controls. These include bounding (stratigraphic) surfaces and operational surfaces, which are tracked surfaces without stratigraphic significance (no temporal context established, or whose control is uncertain).
The internal subdivision of the syn-rift section was based on concepts proposed for the evolution of rift basins by: (i) Prosser [5], especially regarding tectonic systems tract (temporal units composed of arrays of depositional systems, based on a specific and different tectonic control of each unit); (ii) Morley [28], to define the structural pattern and basin geometry, and to characterize the rift initiation phase; (iii) Gawthorpe and Leeder [27], to define evolutionary models of the half-graben structure and propagation of border faults; (iv) Bosence [26], regarding the definition of bedding patterns and criteria for separation of the sections in pre-, syn- and post-rift; and (v) Kuchle and Scherer [6], to apply the concepts of rift basin evolution, using sequence stratigraphic and seismic stratigraphic characterization.
The proposed stratigraphic framework includes three tectonic systems tracts in the syn-rift phase: (i) the Rift Initiation Systems Tract (RIST), (ii) the High Tectonic Activity Systems Tract (HTAST) and (iii) the Low Tectonic Activity Systems Tract (LTAST). Each tectonic systems tract is delimited by stratigraphic surfaces characterized on seismic lines, which were mapped along the entire seismic dataset. In all figures illustrating seismic sections, the color of mapped surfaces follows the color pattern shown in Figure 8.
According to Kuchle and Scherer [6], the half-graben filling displays a reciprocal stratigraphy, characterized by opposed stratal stacking patterns on the two sides of a half graben. The HTAST is characterized by a progradational stacking pattern of the border fault conglomerates, while the flexural margin is marked by a retrogradational stacking pattern of the coastal systems. In the present paper, it was possible to define the stacking patterns along the border fault, characterized by a progradation of the conglomeratic wedge in HTAST and a retrogradation in the LTAST. However, it was not possible to define stacking patterns along the half-graben flexural margin, since the dominant deposits are re-sedimented turbidite systems, with no contemporaneous coastal systems preserved. Re-sedimented turbidite deposits consist of fine- and coarse-grained sediments that interlayer laterally and vertically, not defining clear stacking patterns. Thus, it was impossible to demonstrate reciprocal stratigraphy between the flexural and faulted margin of the half-graben. As a result, the HTAST and LTAST were defined not based on the stacking patterns, but on the geometric patterns of the reflectors that evidence the geometry and the degree of tectonic activity of the basin.

5.1.1. Rift Initiation Systems Tract (RIST)

The Rift Initiation Systems Tract (RIST) encompasses the interval between the Cabiúnas Fm. top surface (at its base) and the half-graben development surface (at the top), comprising SU-1 and SU-2 (Figure 5, Figure 9 and Figure 10A). The Cabiúnas Fm. top surface is marked by onlaps that represent the transition from the lower, volcanic-dominated interval (Cabiúnas Formation) to the upper, sedimentary-dominated interval (Lagoa Feia Group). In depth maps (using seismic time), the Cabiúnas Fm. top surface (Figure 9D) may be located deeper in the depocenter of the half-graben, toward W-SW. The half-graben development surface (Figure 10C) indicates a change in the structural geometric pattern of the basin, from an early synformal depression to a half-graben structure. The ‘isochronpach’ map (thickness in seismic time) of the RIST (Figure 10D) shows similar thicknesses with little lateral variation, and small displacement associated with faults, to subsequently control the structure of the half-graben.
The RIST interval is characterized by low-amplitude reflections with low lateral continuity (Figure 5A and Figure 9). This interval also shows some dispersed reflection patterns, which suggest syn-depositional tectonic activity (divergence and change of reflectors dip). However, along the seismic sections, there is no clear pattern continuity to allow mapping. During evolution of the half-graben, two seismic facies are repeated laterally: the rudstones/grainstones, marked by high amplitude reflectors, which are commonly thick and continuous, and the fine sediments with low amplitude, little lateral continuity and variable thickness (Figure 5, Figure 7 and Figure 10A). In general, the reflectors have good lateral continuity, but also show some undulations (Figure 5B).
The basic structure of this system’s tract is a synformal depression, characterized by small syn-depositional faults that are well distributed, showing that tectonic activity was distributed across a larger area instead of concentrated along the border fault. Tectonic activity was low (when compared with the upper units), reflected in the small displacements of every fault (including the border fault or any secondary fault), suggesting that each fault had approximately the same intensity [6,28]. The use of horizontal flattening in the half-graben development surface (Figure 10B) allowed us to observe the synformal structure. However, we did not observe the development of the half-graben, a structure which indicates that the (future) border fault was active, but with an intensity that was not greater than the other faults. The RIST shows an erosional top, particularly in elevated regions (footwalls) and in the upper portions of the region that would become the future flexural margins (Figure 10A,B). Thinning of the RIST toward structural highs is commonly observed, and complete erosion of this section may occur at the upper portions of the flexural margin. This erosion is associated with uplift and block rotation after the RIST stage, which created space in the trough (hangingwalls) and uplifted highs (footwalls) of the half-graben. Consequently, the occurrence of the RIST is restricted to the hangingwalls of the half-graben (Figure 10C).

5.1.2. High Tectonic Activity Systems Tract (HTAST)

The High Tectonic Activity Systems Tract (HTAST) comprises the interval that starts with the half-graben development surface at the base and ends with the tectonic change surface, including SU-3 to SU-9 (Figure 5C, Figure 11 and Figure 12). The half-graben development surface is marked by toplaps that cover the surface from the flexural margin to the border fault. The tectonic change surface (Figure 11 and Figure 12) separates the HTAST and LTAST. This surface consists of an erosive truncation at the flexural margin, passing to a conformity in the trough of the half-graben (Figure 11D). This erosive event affected both the HTAST and RIST. The isochronpach map of the HTAST (Figure 12A) shows a strong control of the half-graben structure on this systems tract, with thickening of the section towards the border fault. The thinning towards the flexural margin is associated with erosion of the high tectonic activity interval along the tectonic change surface, as discussed above.
The HTAST is characterized by the occurrence of downlaps at the flexural margin, passing to a series of onlaps near the border fault (Figure 5B). At the top of the HTAST, the reflectors are parallel to the tectonic change surface while internally, they display a divergent pattern. This systems tract is represented by an alternation of seismic facies 3, related to rudstone/grainstone deposits, with seismic facies 2, comprised of fine-grained deposits, in a pattern that changes from the flexural margin to the depocenter of the half-graben (Figure 7A). Seismic facies 1, related to border faults, also occurs in this systems tract, represented by footwall marginal deposits passing up laterally to the seismic facies 2 and 3 alternations. Although seismic facies 3 extends toward the depocenter, its occurrence is marked by an east to west alternation with seismic facies 2, which prevents the characterization of a reliable stacking pattern.
The HTAST mainly reflects the geometric change of the basin structure. During the onset of the rift, the basin had a synformal depression geometry, characterized by small displacements in practically all faults. In the HTAST, increasing rates of stretching caused the deformation to concentrate on a specific fault, decreasing intensity in the others and developing a half-graben structure [28,37]. Thus, the HTAST is defined by two fundamental elements: (i) the half-graben geometry basin, and (ii) the remarkable divergence of reflectors, which indicates deposition under conditions of intense creation of accommodation [26]. The divergent pattern of reflectors from the flexural margin toward the central trough of the half graben, seen in Figure 10A, changes to horizontal reflectors (flattening) at the top of the HTAST (Figure 11B). Hence, this tract is initially marked by a restriction in the basin area, with the synformal depression passing to a half-graben, followed by intense expansion of the depositional area. Expansion is marked by numerous onlaps on the flexural margin (Figure 11C). These onlaps indicate that the creation of accommodation was continuous and occurred at high rates, expanding the area of the half-graben onto the elevated regions of the flexural margin. The thinning toward the flexural margin is associated with the erosion of the high tectonic activity interval along the tectonic change surface, as discussed above. The seismic depth map of the tectonic change surface (Figure 12B) shows that most of the west half-graben, in the northern sector of the study area, was filled during HTAST. This is evident because, after this phase, the surface barely marks an inherited half-graben structure. However, in the eastern and southern parts, the half-graben structure was still observed, marked by border fault(s). This indicates that the subsequent stage experienced continued creation of accommodation and/or infill of relict accommodation inherited from the HTAST.

5.1.3. Low Tectonic Activity Systems Tract (LTAST)

The Low Tectonic Activity Systems Tract (LTAST) is limited by the tectonic change surface at the base and the post-rift unconformity at the top, comprising from SU-10 to SU-12 (Figure 5C and Figure 13). The tectonic change surface is marked by toplaps and continuous reflectors below this surface close to the flexural margin. The post-rift unconformity is an obvious, very irregular, well-marked erosional truncation with good lateral continuity. This surface marks the end of the rift phase and the re-adjustment of the basin to a sag phase, with broad exposure and erosion across the study area (Figure 13C,D). The depth map (in seismic time) of the post-rift unconformity (Figure 14A) shows the extension of the erosive event in the rift troughs, indicating that it occurred across practically the entire study area (Figure 14B).
The LTAST is characterized by several downlaps at the base and erosive truncations at the top (Figure 5B and Figure 13A–C). This systems tract is dominated by seismic facies 2 and seismic facies 3, occurring either in highs or lows, interbedded and laterally graded with seismic facies 1, which displays subordinate occurrence along the border fault (Figure 6). The decreased deposition of seismic facies 1 is associated with the waning of the border fault activity, reflecting decreasing subsidence rates and/or an overall reduction in sediment supply. The ‘isochronpach’ map of the LTAST (Figure 13E) shows the final infilling of the rift troughs by deposits of this systems tract, with a clear thickening of the unit towards the border fault.
The LTAST is interpreted in comparison with the HTAST, using the same criteria: (i) the continuation of a half-graben structure, and (ii) divergent stratal patterns of reflectors. However, in the LTAST, the reflectors show slight divergence or mainly parallelism. The latter suggests lower rates of tectonic activity in this system’s tract compared with HTAST, and/or the filling of space inherited from the HTAST. The border fault was still active, but the displacement was smaller, and seismic facies 1 (border fault conglomerates) consistently displayed a retreating pattern. The abundant occurrence of downlaps onto the tectonic change surface (at the base of this systems tract) in the central region of half-graben (Figure 5A,B and Figure 13A–C) indicates a progressive filling of the trough. The post-rift unconformity (at the top) marks a change in the tectonic configuration of the basin, from a half-graben into a wide synformal, tectonically controlled sag basin. Figure 14C shows the intense erosive character of the post-rift unconformity in detail.

6. Conclusions

This study proposes a stratigraphic framework, based on seismic sequence stratigraphic concepts, derived from the systematic analysis of 2D seismic lines in the rift section of the inner offshore part of the Campos Basin.
In total, 12 stratigraphic units were recognized and grouped in three tectonic system tracts: (i) rift initiation, (ii) high tectonic activity and (iii) low tectonic activity system tracts. Three seismic facies, along with their lithological and sedimentological interpretations, were also defined: (i) border fault conglomerates, related with fan delta and apron deposits (seismic facies 1); (ii) lacustrine deposits, intercalated with thin fine-grained re-sedimented deposits (seismic facies 2); and (iii) coarse-grained bioclastic, re-sedimented deposits (seismic facies 3).
Due to the complex interaction between the lacustrine background and the re-sedimented deposits (fine- and coarse-grained), sedimentation patterns were recognized based on reflector truncations, succession surfaces, erosion recurrence, syn-depositional fault control, depositional basin geometry, and mainly, based on reflector divergence or parallelism related to tectonic activity.
The systematic mapping of the stratigraphic surfaces allowed the recognition of complex rift structures, and their distribution, thickness (TWT relative thickness) and preserved geometries within the study area.
The main results of this study can be summarized as follows. The original rift trough was much larger than the preserved section. The upper flexural margin showed recurrent erosional surfaces in the syn-rift section, especially in the low tectonic activity system tract, but mainly along the post-rift unconformity.
The remaining section in the depocenter of the rift trough encompasses large volumes of re-sedimented rudstones, with the minor or complete absence of the primary accumulation of bioclasts along original shores, as predicted by Goldberg et al. [10].
No classical shoreline geometries, such as sigmoids and clinoforms, were recognized from the flexural margin to the depocenter. In addition, no extensive erosional surfaces related to subaerial exposure, were observed, excluding the possibility of lake-level falls (and consequent shoreline regression) to account for the accumulation of the rudstones located near the depocenter.
Based exclusively on seismic analysis, it is impossible to separate fine-grained re-sedimented deposits from lacustrine background deposits due to their similar lithology.
The coarse-grained re-sedimented deposits (rudstones) are here recognized as complexes formed by multiple depositional events. Their complex interaction with the fine-grained re-sedimented deposits (possibly as transitions) and with the lacustrine background does not allow the establishment of a predictive pattern or trend. However, they are more abundant in the high and low tectonic activity system tracts than the rift initiation system tract, possibly because the former allowed the development of a deep lacustrine system to receive the re-sedimented deposits, whereas the basin geometry in the rift initiation system tract was not conducive to the formation of deep lakes.
The rift initiation and the high and low tectonic activity system tracts point to a classic evolution of a rift basin when compared with previous models by Morley [28], Gawthorpe and Leeder [27], Bosence [26], Prosser [5], and Kuchle and Scherer [6]. However, a direct comparison and name usage for the system tracts was not appropriate due to the particularities of the Campos Basin tectonic evolution and nature of sedimentation.
The main reservoir of the rift section, the rudstone deposits (previously called “coquinas”), were originally deposited on structural highs and subject to storm-base wave reworking, as proposed by Abrahão and Warme [39] and Rangel and Carminatti [8]. This study agrees that bioclastic rudstones occur on highs (both current highs, due to intense post-rift erosion which removed the rift borders, and original, paleohighs), but it also highlights the possibility of finding these reservoir facies in depocenters and deeper zones of the rift section. Recently, Olivito and Souza [40], Thompson et al. [41], and Muniz and Bosence [42] have once again assigned a shallow water, wave-induced selection process to the bioclastic rudstone accumulations. However, there has been no mention of the mixture of bioclasts with stevensite that Goldberg et al. [10] discussed. All the interpretations of (fairweather or storm) wave processes are based on the occurrence of faint undulated structures, but no clear wave-induced structures were observed. Previous works have focused only on bioclastic rudstones stuck on paleohighs, with no mention of bodies or seismic facies in the depocenter or deeper zones of the grabens. These previous interpretations may relate to the original deposits, from which the gravity-driven, re-sedimented deposits discussed here were derived. On the other hand, the study by Harris [43] on the Toca Carbonate of the Congo Basin, a possible depositional analogous counterpart to the rudstones discussed here, interpreted the origin of these deposits as driven by a gravity flow. In a study in the adjacent Santos Basin, Barnett et al. [44] showed syn-rift progradational clinoforms, with structured lateral growth, which may also indicate the original shallow water deposits in the Santos Basin. Alvarenga et al. [45], based on seismic facies and attribute texture analysis, pointed to seismic facies similarities between the Campos and the Santos Basins, with the same distribution in time and space, since these seismic facies occur along the entire syn-rift section, and from shallow paleohighs to the central depocenter zones. These early studies in the Santos Basin indicate a similar situation to the Campos Basin, with some shallow zones preserving the original sediments and re-sedimented, gravity-driven deposits in deeper zones of the rifts.
Nonetheless, the work presented here was based exclusively on seismic analysis and, hence, could not validate the existence of any wave-induced sedimentary structures. It is possible that the original, non-re-sedimented “coquinas” still exist in some areas (possibly in preserved, non-eroded structural highs), but they do not comprise these large, extensive complexes of rudstones, shown here by the spatial arrangement of seismic facies 3.
The traditional exploratory belief that relates the occurrence of rudstones to structural highs seems to not always hold, as shown by our results. Large rudstone bodies may also be found in depocenters and deeper zones of the troughs. Detailed seismic facies analysis, along with core and well-log information, are extremely helpful to refine this new exploration model. The proposed new petroleum play is valid not only for the Campos Basin, but it can also be extended to the neighboring Santos and Espírito Santo basins.

Author Contributions

Conceptualization, R.d.S.A., J.K., D.I., K.G. and C.M.d.S.S.; methodology, R.d.S.A., J.K. and D.I.; validation, R.d.S.A., J.K., D.I., K.G., C.M.d.S.S.; formal analysis, R.d.S.A. and P.L.E.; investigation, R.d.S.A. and P.L.E.; resources, K.G.; data curation, R.d.S.A. and J.K.; writing—original draft preparation, R.d.S.A. and J.K.; writing—review and editing, R.d.S.A., J.K., K.G., C.M.d.S.S. and G.P.; supervision, J.K., D.I., K.G. and C.M.d.S.S.; project administration, K.G. All authors have read and agreed to the published version of the manuscript.

Funding

This research was developed at the Universidade Federal do Rio Grande do Sul, funded by former BG Brasil (now Shell Energia Ltda.), supported by the Brazilian Petroleum Law from National Petroleum Agency (ANP).

Informed Consent Statement

Not applicable.

Data Availability Statement

The data are available at http://www.anp.gov.br/exploracao-e-producao-de-oleo-e-gas/dados-tecnicos (accessed on 6 April 2021).

Acknowledgments

This work is part of the Ph.D. of the first author (RA) in the Graduate Program in Geosciences, integrated into the Deep Rift Project, developed at the Universidade Federal do Rio Grande do Sul, funded by former BG Brasil (now Shell Energia Ltda.), supported by the Brazilian Petroleum Law. We thank the National Petroleum Agency (ANP) for the commitment to investment in research and development.

Conflicts of Interest

The authors declare no conflict of interest.

References

  1. ANP. Painel Dinâmico de Produção de Petróleo e Gás Natural. 2021. Available online: https://www.gov.br/anp/pt-br/assuntos/exploracao-e-producao-de-oleo-e-gas/paineis-dinamicos-de-producao-de-petroleo-e-gas-natural (accessed on 31 March 2021).
  2. Tessari, E.; Tsubone, K.; Brisola, N. Acumulações petrolíferas da Bacia de Campos. In Proceedings of the Offshore Brazil Conference, Rio de Janeiro, Brazil, 24–26 October 1978; Volume 5, pp. 1–14. [Google Scholar]
  3. Guardado, L.R.; Spadini, A.R.; Brandão, J.S.L.; Mello, M.R. Petroleum system of the Campos Basin, Brazil. In Petroleum Systems of South Atlantic Margins; Katz, B.J., Mello, M.R., Eds.; AAPG Memoir: Tulsa, OK, USA, 2000; pp. 317–324. [Google Scholar]
  4. Formigli, J. Pre-salt reservoirs offshore Brazil. In Proceedings of the Perspectives and Challenges Energy Conference, Miami, FL, USA, 6–10 November 2007. [Google Scholar]
  5. Prosser, S. Rift-related linked depositional systems and their seismic expression. In Tectonics and Seismic Sequence Stratigraphy; Williams, G.D., Dobb, A., Eds.; Geological Society Special Publication: London, UK, 1993; pp. 35–66. [Google Scholar]
  6. Kuchle, J.; Scherer, C.M.S. Sismoestratigrafia de bacias rifte: Técnicas, métodos e sua aplicação na Bacia do Recôncavo. Bol. Geociências Petrobras 2010, 18, 179–206. [Google Scholar]
  7. Rangel, H.D.; Martins, F.A.L.; Esteves, F.R.; Feijó, F.J. Bacia de Campos. Bol. Geociências Petrobras 1994, 8, 203–218. [Google Scholar]
  8. Rangel, H.D.; Carminatti, M. Rift lake stratigraphy of the Lagoa Feia Formation, Campos Basin, Brazil. In Lake Basins through Space and Time; Gierlowski-Kordesch, E.H., Kelts, K.R., Eds.; AAPG Studies in Geology: Tulsa, OK, USA, 2000; pp. 225–244. [Google Scholar]
  9. Dias, J.L.; Scarton, J.C.; Esteves, F.R.; Carminatti, M.; Guardado, L.R. Aspectos da evolução tectono-sedimentar e a ocorrência de hidrocarbonetos na Bacia de Campos. In Origem e Evolução de Bacias Sedimentares; Raja Gabaglia, G.P., Milani, E.J., Eds.; Petrobras, CENSUD: Rio de Janeiro, Brazil, 1990; pp. 333–360. [Google Scholar]
  10. Goldberg, K.; Kuchle, J.; Scherer, C.; Alvarenga, R.S.; Ene, P.L.; Armelenti, G.; de Ros, L.F. Re-sedimented deposits in the rift section of the Campos Basin. Mar. Pet. Geol. 2017, 80, 412–431. [Google Scholar] [CrossRef]
  11. Chang, H.K.; Kowsmann, R.O.; Bender, A.A.; Mello, U.T. Origem e evolução termomecânica de bacias sedimentares. In Origem e Evolução de Bacias Sedimentares; Raja Gabaglia, G.P., Milani, E.J., Eds.; Petrobras, CENSUD: Rio de Janeiro, Brazil, 1990; pp. 49–71. [Google Scholar]
  12. Moraes, M.A.S. Diagenetic evolution of Cretaceous-Tertiary turbidite reservoirs, Campos Basin, Brazil. AAPG Bull. 1989, 73, 598–612. [Google Scholar]
  13. Schaller, H. Estratigrafia de bacia de Campos. In Proceedings of the 27th Brazilian Congress of Geology, Aracaju, SE, Brazil, October 1973; pp. 247–258. [Google Scholar]
  14. Winter, W.R.; Jahnert, R.J.; França, A.B. Bacia de Campos. Bol. Geociências Petrobras 2007, 15, 511–529. [Google Scholar]
  15. Mizusaki, A.M.P.; Thomaz Filho, A.; Valença, J.G. Volcano-Sedimentary Sequence of Neocomian age in Campos Basin (Brazil). Rev. Bras. Geociências 1988, 18, 247–251. [Google Scholar] [CrossRef]
  16. Grassi, A.D.A.; Castro, A.H.A.; Albertão, G.A. Bacias Sedimentares Brasileiras—Bacia de Campos. Inf. Fundação Paleontológica Phoenix 2004, 65, 1–6. [Google Scholar]
  17. Catuneanu, O. Principles of Sequence Stratigraphy; Elsevier: Amsterdam, The Netherlands, 2006; p. 375. [Google Scholar]
  18. Alvarenga, R.S.; Iacopini, D.; Kuchle, J.; Scherer, C.M.S.; Goldberg, K. Seismic characteristics and distribution of hydrothermal vent complexes in the cretaceous offshore rift section of the Campos Basin, Offshore Brazil. Mar. Pet. Geol. 2016, 74, 12–25. [Google Scholar] [CrossRef]
  19. Vail, P.R.; Mitchum, R.M., Jr.; Todd, R.G.; Widmier, J.M.; Thompson, S.; Sangree, J.B.; Bubb, J.N.; Hatlelid, W.G. Seismic stratigraphy and global changes of sea level. In Seismic Stratigraphy—Applications to Hydrocarbon Exploration; Payton, C.E., Ed.; AAPG Memoir: Tulsa, OK, USA, 1977; pp. 49–212. [Google Scholar]
  20. Mitchum, R.M., Jr.; Vail, P.R.; Sangree, J.B. Seismic stratigraphy and global changes of sea level, part 6: Stratigraphic interpretation of seismic reflection patterns in depositional sequences. In Seismic Stratigraphy—Applications to Hydrocarbon Exploration; Payton, C.E., Ed.; AAPG Memoir: Tulsa, OK, USA, 1977; pp. 117–133. [Google Scholar]
  21. Posamentier, H.W.; Jervey, M.T.; Vail, P.R. Eustatic controls on clastic deposition I—Conceptual framework. In Sea-Level Changes: An Integrated Approach; Wilgus, C.K., Hastings, B.S., Posamentier, H., van Wagoner, J., Ross, C.A., Kendall, C.G.S.C., Eds.; SEPM Special Publication: Tulsa, OK, USA, 1988; pp. 109–124. [Google Scholar]
  22. Van Wagoner, J.C.; Mitchum, R.M.; Champion, K.M.; Rahmanian, V.D. Siliciclastic Sequence Stratigraphy in Well Logs, Cores, and Outcrops: Concepts for High Resolution Correlation of Time and Facies; Methods in Exploration Series, N° 7; American Association of Petroleum Geologists: Tulsa, OK, USA, 1990. [Google Scholar]
  23. Catuneanu, O.; Abreu, V.; Bhattacharya, J.P.; Blum, M.D.; Dalrymple, R.W.; Eriksson, P.G.; Fielding, C.R.; Fisher, W.L.; Galloway, W.E.; Gibling, M.R.; et al. Towards the standardization of sequence stratigraphy. Earth Sci. Rev. 2009, 92, 1–33. [Google Scholar] [CrossRef] [Green Version]
  24. Catuneanu, O. Model-independent sequence stratigraphy. Earth Sci. Rev. 2019, 188, 312–388. [Google Scholar] [CrossRef]
  25. Brown, L.F., Jr.; Fischer, W.L. Seismic interpretation of depositional systems: Examples from Brazilian rift and pull-apart basins. In Seismic Stratigraphy—Applications to Hydrocarbon Exploration; Payton, C.E., Ed.; AAPG Memoir: Tulsa, OK, USA, 1977; pp. 213–248. [Google Scholar]
  26. Bosence, D.W.J. Stratigraphic and sedimentological models of rift basins. In Sedimentation and Tectonics of Rift Basins: Red Sea—Gulf of Aden; Purser, B.H., Bosence, D., Eds.; Chapman & Hall: London, UK, 1998; pp. 9–25. [Google Scholar]
  27. Gawthorpe, R.L.; Leeder, M.R. Tectono-sedimentary evolution of active extensional basins. Basin Res. 2000, 12, 195–218. [Google Scholar] [CrossRef]
  28. Morley, C.K. Evolution of large normal faults: Evidence from sesmic reflection data. AAPG Bull. 2002, 86, 961–978. [Google Scholar]
  29. Martins-Neto, M.A.; Catuneanu, O. Rift sequence stratigraphy. Mar. Pet. Geol. 2010, 27, 247–253. [Google Scholar] [CrossRef]
  30. Hubbard, R.J.; Pape, J.; Roberts, D.G. Depositional sequence mapping as technique to establish tectonic and stratigraphic framework and evaluate hydrocarbon potential on a passive continental margin. In Seismic Stratigraphy II: An Integrated Approach to Hydrocarbon Exploration; Berg, O.R., Woolverton, D.G., Eds.; AAPG Memoir: Tulsa, OK, USA, 1985; Volume 39, pp. 79–91. [Google Scholar]
  31. Salvador, A. International Stratigraphic Guide: A Guide to Stratigraphic Classification, Terminology and Procedure; The International Union of Geological Science and the Geological Society of America: Boulder, CO, USA, 1994. [Google Scholar]
  32. Rosendahl, B.R.; Reynolds, D.J.; Lorber, P.M.; Burgess, C.F.; Mcgill, J.; Scott, D.; Lambiase, J.J.; Derksen, S.J. Structural expressions of rifting: Lessons from Lake Tanganyika, Africa. In Sedimentation in the African Rifts; Special Publication; Frostick, L.E., Ed.; Geological Society: London, UK, 1986; pp. 29–43. [Google Scholar]
  33. Vail, P.R.; Mitchum, R.M., Jr. Overview. In Seismic Stratigraphy—Applications to Hydrocarbon Exploration; Payton, C.E., Ed.; AAPG Memoir: Tulsa, OK, USA, 1977; pp. 51–52. [Google Scholar]
  34. Abreu, V. Evolution of the Conjugate Volcanic Passive Margins: Pelotas Basin (Brazil) and Offshore Namibia (Africa): Implication for Global Sea-Level Changes. Ph.D. Thesis, Rice University, Houston, TX, USA, 1998. [Google Scholar]
  35. Neal, J.; Abreu, V. Sequence stratigraphy hierarchy and the accommodation succession method. Geology 2009, 37, 779–782. [Google Scholar] [CrossRef]
  36. Wheeler, H.E. Time Stratigraphy. AAPG Bull. 1958, 42, 1047–1063. [Google Scholar]
  37. Armelenti, G.; Goldberg, K.; Kuchle, J.; de Ros, L.F. Deposition, diagenesis and reservoir potential of non-carbonate sedimentary rocks from the rift section of Campos Basin, Brazil. Pet. Geosci. 2016, 22, 223–239. [Google Scholar] [CrossRef]
  38. Playton, T.E.; Jason, X.; Kerans, C. Carbonate slopes. In Facies Models; James, N.P., Dalrymple, R.W., Eds.; Geological Association of Canada: St. John’s, NL, Canada, 2010; pp. 449–476. [Google Scholar]
  39. Abrahão, D.; Warme, J.E. Lacustrine and associated deposits in a rifted continental margin—Lower cretaceous lagoa feia formation, Campos Basin, offshore Brazil. In Lacustrine Basin Exploration: Case Studies and Modern Analogs; Katz, B.J., Ed.; AAPG Memoir: Tulsa, OK, USA, 1990; pp. 287–305. [Google Scholar]
  40. Olivito, J.P.R.; Souza, F.J. Depositional model of early Cretaceous lacustrine carbonate reservoirs of the Coqueiros formation—Northern Campos Basin, southeastern Brazil. Mar. Pet. Geol. 2020, 111, 414–439. [Google Scholar] [CrossRef]
  41. Thompson, D.L.; Stilwell, J.D.; Hall, M. Lacustrine carbonate reservoirs from Early Cretaceous rift lakes of Western Gondwana: Pre-Salt coquinas of Brazil and West Africa. Gondwana Res. 2015, 28, 26–51. [Google Scholar] [CrossRef]
  42. Muniz, M.; Bosence, D. Lacustrine carbonate platforms: Facies, cycles and tectonosedimentary models for the presalt Lagoa Feia Group (Lower Cretaceous), Campos Basin, Brazil. AAPG Bull. 2018, 102, 2569–2597. [Google Scholar] [CrossRef]
  43. Harris, N.B. Toca carbonate, Congo Basin: Response to an evolving rift lake. In Petroleum Systems of South Atlantic Margins; Melo, M.R., Katz, B.J., Eds.; AAPG Memoir: Tulsa, OK, USA, 2000; pp. 341–360. [Google Scholar]
  44. Barnett, A.J.; Fu, L.; Rapasi, T.; Scotellaro, C.; Guha, J.; Cabolova, A.; Domingues, A.L. Seismic characterisation and origin of clinoforms in lacustrine depositional environments: A case study from the Cretaceous of the South Atlantic. Geol. Soc. Lond. Spec. Publ. 2020, 509, 127–145. [Google Scholar] [CrossRef]
  45. Alvarenga, R.S.; Kuchle, J.; Iacopini, D.; Ene, P.; Scherer, C.M.S.; Goldberg, K. Reconhecimento e análise das fácies sísmicas nas sucessões rift das bacias de Campos e Santos. Pesqui. Geociências 2018, 43, 325–334. [Google Scholar] [CrossRef] [Green Version]
Figure 1. Location map of the Campos Basin. (A) Location of the Campos Basin (GIS positioning of structures based on from Moraes [12]). (B) Location map of the study area, with 2D seismic lines studied.
Geosciences 11 00338 g001
Figure 2. Stratigraphic chart of the rift section in the Campos Basin. The end of the rift section varies according to different authors. Modified from Alvarenga et al. [18]. (CB = Cabiúnas Fm., ITA = Itapaboana Fm., ATA = Atafona Fm, CQ = Coqueiros Fm., GGU = Gargaú Fm., MCB = Macabu Fm., RT = Retiro Fm.).
Geosciences 11 00338 g002
Figure 3. Summary chart for reflector termination analysis. (A) Types of terminations, amplitude, continuity and configuration of the reflectors. (B) Example of studied seismic line with interpretation of reflectors. (C) Detailed view of types of reflector terminations found: (i) toplaps, (ii) erosive truncations, (iii) downlaps and (iv) onlaps.
Geosciences 11 00338 g003
Figure 4. Map of a reference surface (Cabiúnas Top) and border faults (in white) in the study area. (A) Half-grabens mapped at seismic depth. (B) Three-dimensional view of the study area, showing the structure of the mapped half-grabens.
Geosciences 11 00338 g004
Figure 5. Seismic line L3 (Figure 1B) (A) in normal phase without interpretation, (B) with reflectors interpretation and (C) with interpretation of seismic stratigraphic units.
Geosciences 11 00338 g005
Figure 6. Seismic line III, from Figure 1B. Representative seismic section and description of the main seismic facies observed in the rift interval of the Campos Basin.
Geosciences 11 00338 g006
Figure 7. Seismic line L3 (Figure 1B). (A) Integrated interpretation with seismofacies, seismic stratigraphic units and surfaces. (B) Delimitation and interpretation of systems tracts. (C) Chronostratigraphic diagram.
Geosciences 11 00338 g007
Figure 8. Chart of the stratigraphic framework in the Campos Basin rift, relating the lithostratigraphy data, general age of surfaces, surfaces defining the systems tract framework, rifting process, structural pattern and the recognition criteria of the observed units and surfaces.
Geosciences 11 00338 g008
Figure 9. (A) Seismic pattern of the Cabiúnas Fm. below the Cabiúnas top surface (red dashed reflector), showing some scattered reflections indicative of deposition under tectonic activity, but without a clear definition for mapping. (B) Relative acoustic impedance attribute seismic pattern of the Cabiúnas Fm. (C) Sweetness attribute seismic pattern of the Cabiúnas Fm. (D) Map of the Cabiúnas top surface.
Geosciences 11 00338 g009
Figure 10. The Rift Initiation Systems Tract (RIST). (A) Seismic line 8 shows the structure of the rift initiation section (between orange and red dashed reflectors) and the occurrence of seismic facies 2. (B) Seismic line 8 shows the flattening of the half-graben development surface. Observe that all faults (in white) show similar displacement and occur in a general synformal depression configuration during the early section of the rift. (C) Isochron map (in seismic time) of the half-graben development surface. (D) ‘Isochronpach’ map (thickness in seismic time) of the RIST.
Geosciences 11 00338 g010
Figure 11. The High Tectonic Activity Systems Tract (HTAST). (A) Seismic line 7 shows the divergent pattern of the reflectors in the HTAST (section between orange and blue reflectors). (B) Seismic line 7 shows the flattening of the HTAST top (tectonic change surface), highlighting the divergent pattern of HTAST reflectors (section between the orange and blue horizons). (C) Seismic line 5 shows the onlap pattern of the HTAST base (onto the orange surface) along the flexural margin. (D) Seismic line 10 shows the tectonic change surface, changing from an erosive truncation in the flexural margin to conformity within the half-graben.
Geosciences 11 00338 g011
Figure 12. (A) ‘Isochronpach’ map (thickness in seismic time) of the HTAST. (B) Isochron map (in seismic time) of the tectonic change surface.
Geosciences 11 00338 g012
Figure 13. The Low Tectonic Activity Systems Tract (LTAST). (A) Seismic line 7 shows decreasing displacement of the border fault in the LTAST, dominated by seismic facies 2, with some occurrences of seismic facies 3. (B) Seismic line 3 shows the dominance of seismic facies 2, with localized concentrations of seismic facies 3 in LTAST (interval between blue and red surfaces). (C) Seismic line 2 shows the extremely erosive signature of the post-rift unconformity (red surface), not only at the flexural margin, but also across the half-graben. (D) Seismic line 2 shows flattening of the LTAST top (post-rift unconformity surface), highlighting the erosive truncation in red surface. (E) ‘Isochronpach’ map (thickness in seismic time) of the LTAST.
Geosciences 11 00338 g013
Figure 14. Post-rift unconformity. (A) Isochron map (in seismic time) of the post-rift unconformity. (B) Occurrence map of erosive truncation of the post-rift unconformity, marked in magenta. (C) Examples of erosional truncation recognized along the post-rift unconformity.
Geosciences 11 00338 g014
Publisher’s Note: MDPI stays neutral with regard to jurisdictional claims in published maps and institutional affiliations.

