Article

Assessment of the Photosynthetic Response of Posidonia oceanica (Linneaus) Delile, 1813 along a Depth Gradient in the Northern Tyrrhenian Sea (Latium, Italy)

1
Laboratory of Experimental Oceanology and Marine Ecology, University of Tuscia, 00053 Civitavecchia, Italy
2
Ocean Predictions and Applications Division, Centro Euro-Mediterraneo sui Cambiamenti Climatici, 73100 Lecce, Italy
3
Institute for Environmental Protection and Research (ISPRA), 00144 Rome, Italy
*
Author to whom correspondence should be addressed.
Geosciences 2021, 11(5), 202; https://doi.org/10.3390/geosciences11050202
Submission received: 15 March 2021 / Revised: 24 April 2021 / Accepted: 27 April 2021 / Published: 5 May 2021
(This article belongs to the Special Issue Coastal Environment Monitoring)

Abstract

:
Posidonia oceanica (L.) Delile meadows are recognized to be one of the most productive ecosystems of the Mediterranean basin. Due to the impacts of human activities in coastal areas, seagrasses are experiencing a critical decline. In this context, the understanding of the dynamics of production and photosynthesis in response to the environmental factors is essential to address efficient conservation strategies that limit this trend and to assess the ecological status of marine ecosystems. Pulse Amplitude Modulated (PAM) fluorometry has been widely implemented to assess seagrass health and productivity. Here we analyzed the photosynthetic dynamics of P. oceanica according to its bathymetric distribution and daily light availability along a depth gradient to be used as baseline for monitoring purposes on the health status of the seagrass meadows in the Northern Tyrrhenian Sea. Moreover, to investigate the effects of the environmental factors on the health status of P. oceanica within the study area through a multidisciplinary approach, the models contained in the Civitavecchia Coastal Environmental Monitoring System were used. In this study, significant photo-physiological changes have been observed among the investigated meadows. Moreover, the integration of physiological and hydrodynamic information allowed the description of how P. oceanica modulates its photosynthetic capacity at different environmental conditions.

1. Introduction

Seagrasses are among the most productive marine ecosystems, sequestering and storing a significant amount of blue carbon in their rich organic sediments and in their living and non-living biomass. The Blue Carbon Initiative, coordinated by Conservation International (CI), the International Union for Conservation of Nature (IUCN), and the Intergovernmental Oceanographic Commission of the United Nations Educational, Scientific, and Cultural Organization (IOC-UNESCO) strongly promotes the restoration and sustainable use of these ecosystems as “Nature-based Solutions”, estimating to provide 37% of climate change mitigation needed to meet the goal of keeping climate warming below 2 °C [1]. In recent decades, seagrass ecosystems have been widely recognized as good bioindicators of coastal ecosystems status [2], due to their wide distribution along the Mediterranean coasts [3], their high susceptibility to changing environmental conditions [4], their sensibility to direct and indirect anthropogenic pressures [5] and, finally, the large amount of knowledge of the biology and ecology of this species [6]. In the framework of the European environmental policy, P. oceanica is one of the main targets of protection and management of the Mediterranean marine environment, being included among the priority habitats (Habitat 1120*: P. oceanica beds—Posidonion oceanicae) of the Habitat Directive 92/43/CEE [7] and receiving a dedicated Action Plan under the “Specially Protected Areas and Biological Diversity Protocol” of the Barcelona Convention, SPA/BD Protocol [8]. Moreover, each member state has defined its own method and monitoring program in accordance with the Annex V of the Water Framework Directive 2000/60/EC [9], where Angiosperms are listed as one of the Biological Quality Elements [10]. Finally, within the Marine Strategy Framework Directive MFSD 2008/56/EC [11], the evaluation of the ecological integrity of meadows is fundamental for the assessment of the Good Environmental Status (GES) of benthic habitats within Descriptor 1 “Biodiversity”.
In recent years, human development in coastal areas has caused a significant shift in ecosystem dynamics and a critical decline of seagrass ecosystems has been noted [12,13]. Several studies have reported an alarming reduction of P. oceanica, especially in the north-western side of the Mediterranean Sea [14,15,16]. Establishing the causal relationships between pressure factors and the observed reduction in ecosystem quality is difficult [17] but a big effort has been made in the latest years to deepen the knowledge of such complex ecological processes. In details, many authors have demonstrated that local hydrodynamic conditions strongly influence P.oceanica distribution, production and fate [18,19], although further research is necessary to get a deeper insight on its quantification [20]. Intense sediment dynamics involving excessive burial or erosion have also been identified as widespread causes of loss [21,22]. Moreover, light reduction caused by increased turbidity or in combination with other side effects of human activities, has been identified as one of the main causes of seagrass decline [12,23,24,25,26,27]. In fact, in reduced light environments, the high respiratory demand of the massive belowground biomass of P. oceanica may cause physiological stress [28] and affect its photosynthesis and productivity [29]. Therefore, the estimation of primary production capacity requires a deep knowledge of the relationship between photosynthetic efficiency and the environmental factors that may regulate it [30,31].
Pulse Amplitude Modulated (PAM) fluorometry has been widely used for assessing seagrass health and productivity, allowing the detection of plant exposure to stress before morphological or density-based changes are evident [32]. Several studies have implemented the application of chlorophyll a fluorescence to identify photo-physiological changes in seagrasses [33], particularly in response to contaminants and herbicides [34,35,36,37,38,39,40,41,42], light reduction [29,43,44,45,46,47,48], high salinity stress [49] or heat waves [50], being increasingly included in monitoring programs as it is a reliable technique, adequately sensitive to varying environmental conditions [34,51]. In particular, it allows insight into the plant photosynthetic response through the analysis of the fluorometric and derived photosynthetic parameters. Among the fluorometric parameters, the maximum quantum yield of PSII, calculated as the ratio between the increase in fluorescence (Fv = Fm −Fo) and the maximum fluorescence (Fm), under dark-adapted conditions [52] is considered to be a useful indicator of photo-adaptation, giving information on the maximum photosynthetic efficiency that can potentially be reached by the plants when growing at optimal conditions: Fo, the initial fluorescence, is generally stable for a healthy plant but can increase with photodamage; Fm is more sensitive, decreasing under stress conditions (salt stress, high or low temperature, presence of toxicants, elevated light) [53]. On the contrary, Rapid Light Curves (RLCs) provide information on the immediate physiological state of a plant tissue [53], determining the effective photochemical quantum yield of PSII (Y(II)), and electron transport rate (ETR, µmol photons m−2 s−1) at increasing irradiance values. RLCs derived parameters, ETRmax (maximum electron transport rate, µmol photons m−2 s−1), α (photosynthetic rate in light limited region of RLC, electrons/photons), and Ek (minimum saturating irradiance, µmol photons m−2 s−1) complete the description of the photoacclimative condition, attaining anexhaustive frame of the seagrass physiological state in response to light availability.
The cost-effective Junior-PAM fluorometer (Heinz Walz GmbH, 2007) has been commonly used for terrestrial and submerged macrophytes [54,55,56,57], macro- and microalgae [58,59,60] and for seagrasses under controlled conditions [61,62,63,64]. In this study, we use the Junior-PAM to assess the photosynthetic response of P. oceanica according to its bathymetric distribution and the daily light availability along a Northern Tyrrhenian coast (Latium, Italy). Given theinfluenceof site-specific hydrodynamic conditions and morphological featureson light availability for seagrass photosynthesis, PAM fluorometry dataset was compared with the effects of the wave action on the bottom (WA), the burial rate of the fine sediment (BR) and the light attenuation (LA), estimated using the C-CEMS numerical models [65] as well as with the description of the morphological traits of the investigated meadows. Finally, this work contributes to define a baseline dataset useful to address monitoring activities of the P.oceanica photosynthetic dynamics in relation to light availability for the evaluation of its health status, remarking the importance of the adoption of a multidisciplinary approach that integrates in situ observations with mathematical models.

2. Materials and Methods

The study area is in the northern Latium coast (Tyrrhenian Sea, Italy). Samples were collected by scuba diving in three different sites of P. oceanica meadows, designated as POS-1m (42.05005° N, 11.81961° E), POS-5m (42.04995° N, 11.81781° E) and POS-10m (42.04983° N, 11.81605° E), at 1, 5 and 10 m depth, respectively. These sites are situated inside the Site of Community Importance (SCI) SCI IT6000006 (Figure 1).
The coastal morphology is characterized by the presence of rocky terraces and natural depressions covered by sediments. The area is also crossed by minor streams that originate from the nearby Tolfa Mountains, whose promontory determines the coastal morphotype. The coastal line is influenced by the presence of littoral currents, which are mainly directed from south to north, following the coastal local dynamics determined by the diversified sea bottom [66]. Additionally, the area is characterized by moderate to high wave conditions, with seasonal oscillation of wave intensity, with maximum values in autumn and winter (1.5–3 m) and minimum in summer (0.5–1.5 m) [67]. In this area, P. oceanica meadows have a discontinuous distribution, reflecting the heterogeneity of the local environments and the presence of multiple human activities [68]. The meadow’s substrate coverage is medium-low, partly due to the geo-morphological variability of the sea bottom and to water turbidity, accentuated by the presence of several ditches along the coast and by the touristic and recreational activities typical of this area, especially during the summer period. Moreover, the presence of the Civitavecchia harbor and the related commercial traffic and cruise passenger, contribute to reduce the transparency of water [69].

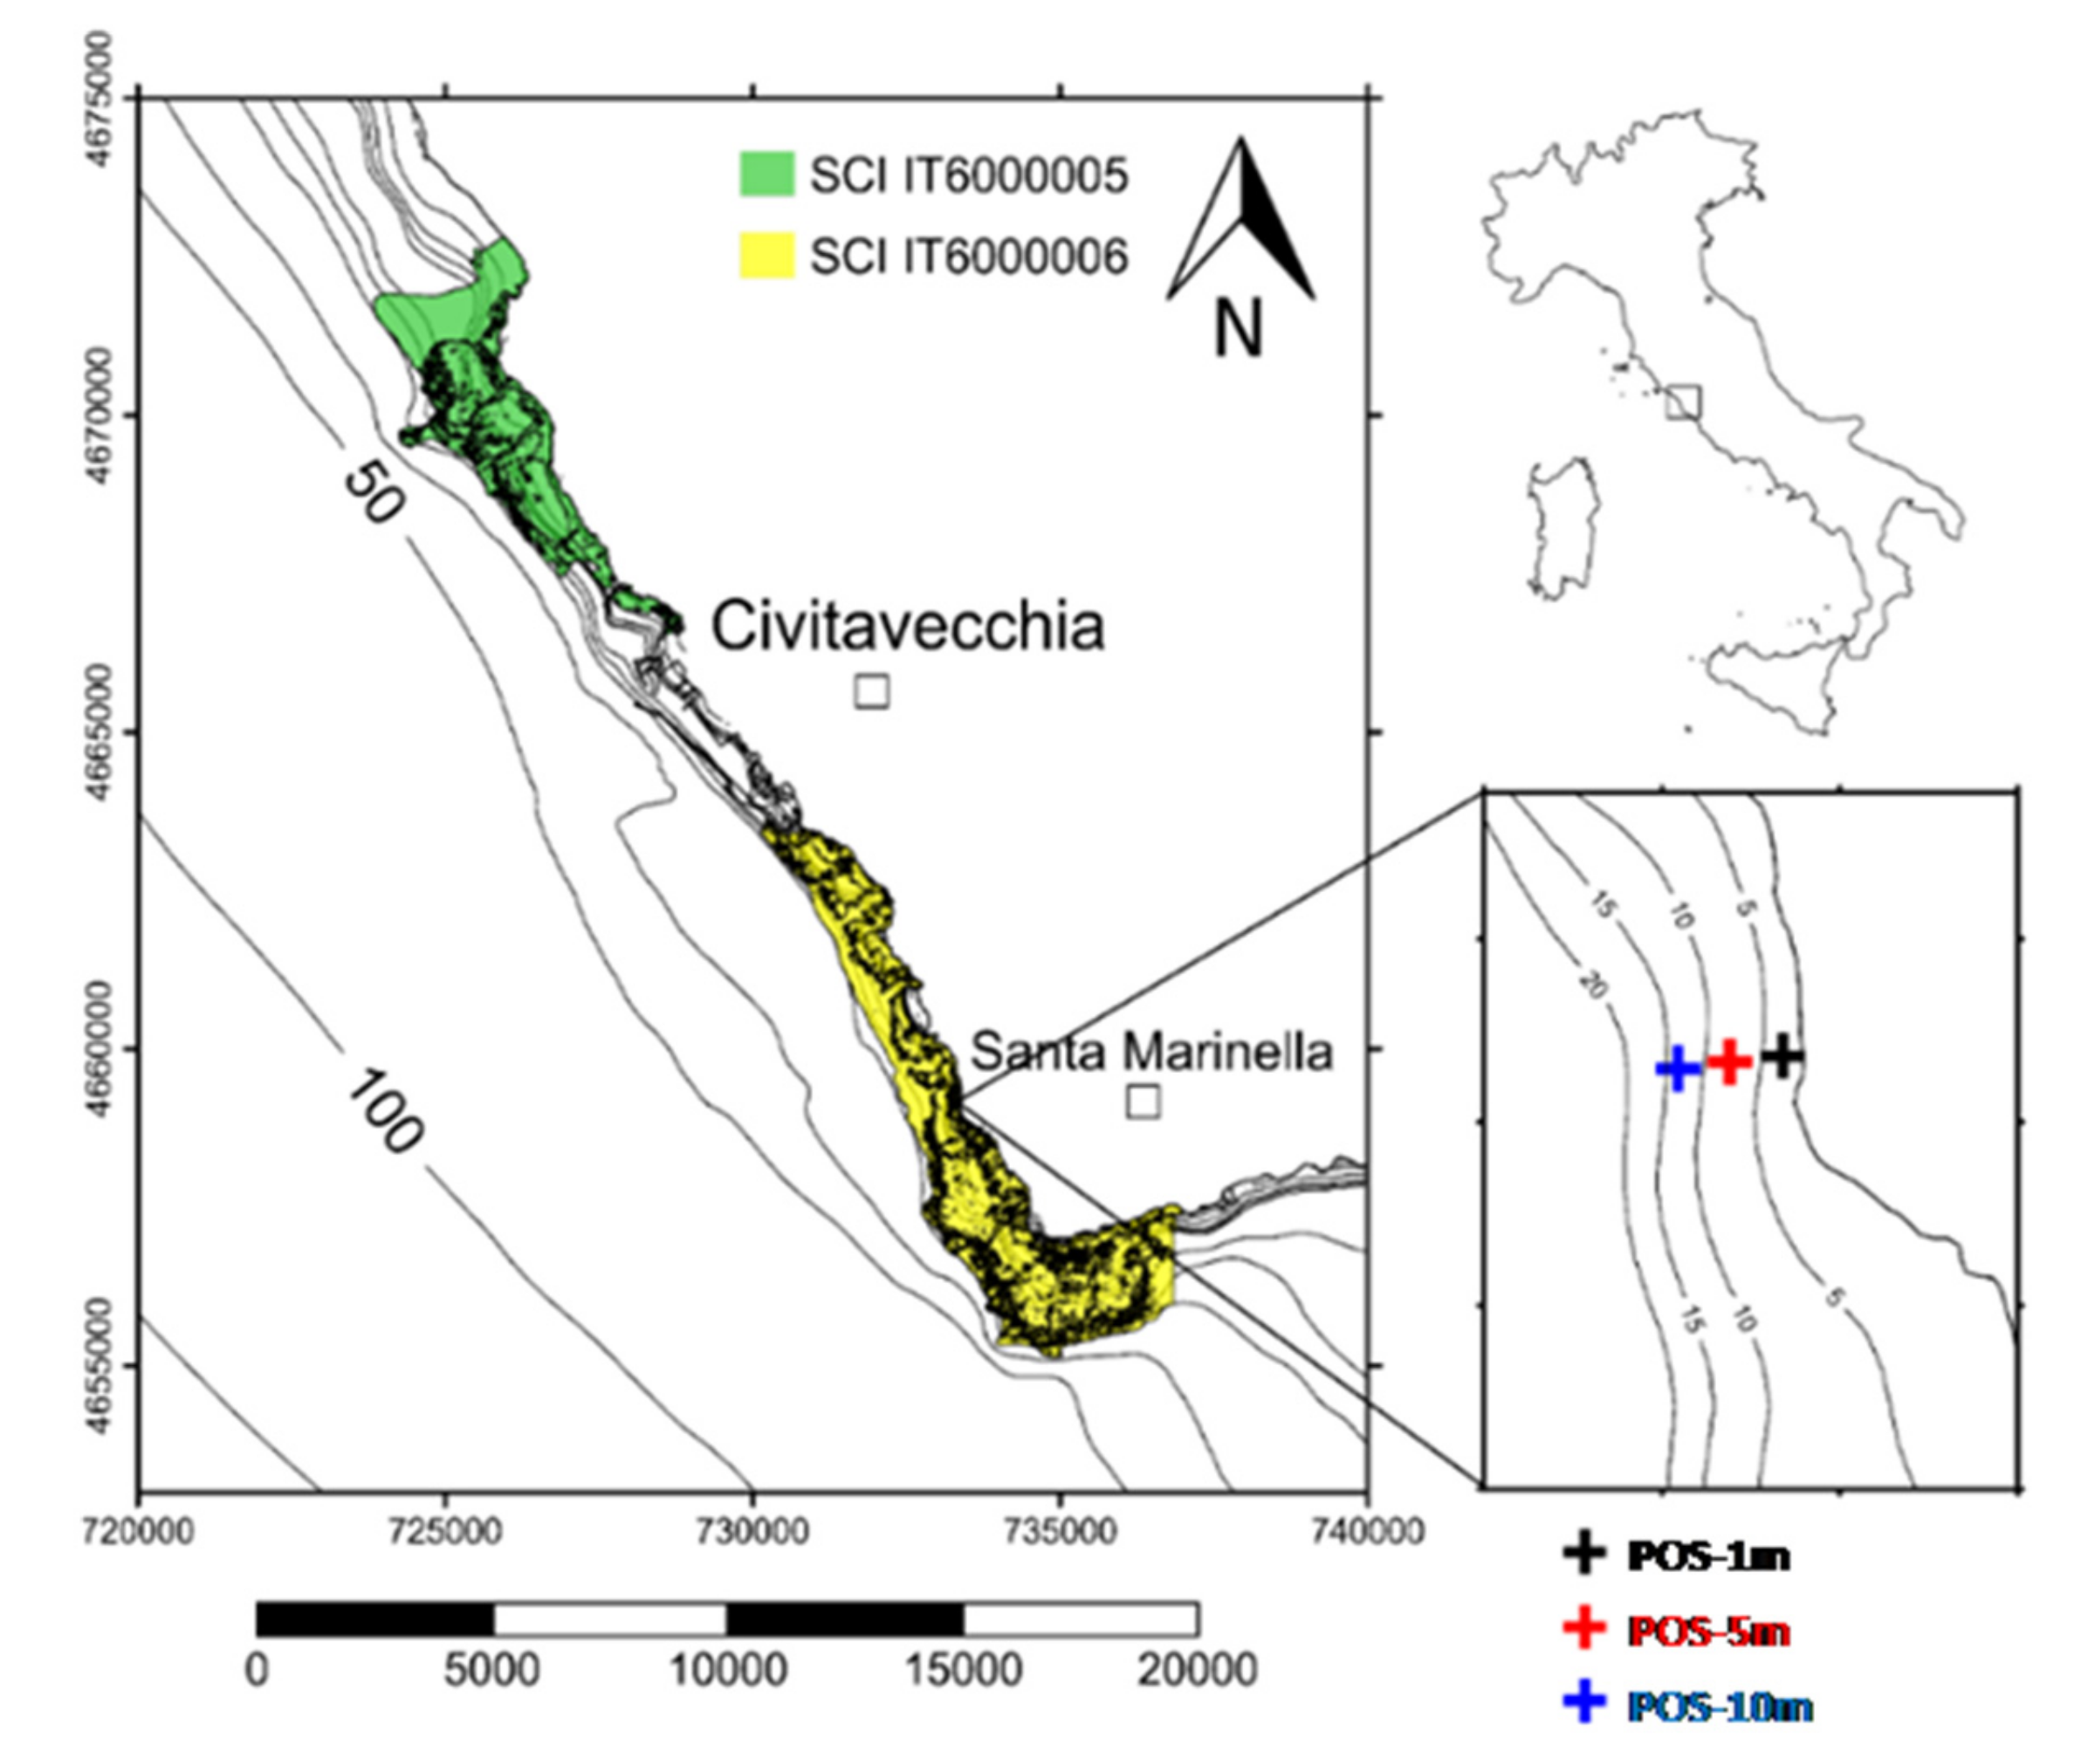
2.1. Analysis of Local Hydrodynamic Conditions

In this study, wave action on the bottom (WA), burial rate of the fine sediment (BR) and light attenuation (LT) were considered to be the main abiotic parameters that have an influence on light availability thus affecting the health status of P.oceanica in the study area. They were investigated by using the numerical models included in DELFT3D package that enable the analysis of coastal processes at high spatial and temporal resolution. Specifically, we used the SWAN model [70] to obtain wave orbital velocity near bottom and DELFT3D-WAQ to calculate sedimentation rate and light attenuation coefficient due to the fine sediment fraction (silt and clay). The setup of both the models is reported in detail in [65], within the description of the Civitavecchia Coastal Environment Monitoring System (C-CEMS) applications. In the study area the model resolution is about 30 m thus allowing proper analysis of the temporal variation of the environmental factors in the three sample sites. To characterize thehydrodynamic conditions of the investigated area, the percentage of the exceeding of specific threshold limits (Percentage Exceeding Threshold, PET) were calculated by using a numerical simulation reproducing weather and wave conditions occurring during a representative year. In detail, we consider the limits reported in [71] for wave orbital velocity near the bottom, in [72] for burial rate of the fine sediment fraction and in [12] for light attenuation coefficient.

2.2. Sampling Strategy

To test and optimize an operative protocol for the application of the Junior-PAM fluorometer (© Heinz Walz GmbH, 2007) to P. oceanica, the preliminary survey POSI-Jun, was arranged on 7th June 2018. A meteorological station was assembled in the proximity of the same area to register incident Photosynthetic Active Radiation (PAR) values simultaneously to the sampling operations. Shoots were collected from two stations, POS-1m and POS-5m, at 1 and 5 m depth (sites = 2, replicate shoots = 3, total n = 6) in the morning between 9:00 and 11:00 a.m. (UTC), during the period of maximum daily irradiance. Once removed, samples were stored into isothermal containers with seawater, kept away from light sources and directly analyzed in situ. A second campaign, POSI-Aug was conducted on 9th, 10th, and13thAugust 2018, during which besides the shallower stations POS-1m and POS-5m, a third and deeper station at 10 m depth (POS-10m) was sampled. To describe the photosynthetic response as a function of the daily light availability, shoots were collected at three different times during the same day (8:00, 11:00 and 14:00 UTC) per each sampling site (sites = 3, replicate shoots = 3, sampling times = 3, total n = 27). Hence, each of the three-sampling day was dedicated to one station, considering that the weather conditions were similar. In this occasion, samples were immediately transferred to the laboratory, located at 10 min away from the study area, to execute all the measurements in more controlled conditions. Incident PAR was registered by the meteorological station of the C-CEMS [67], while a Quantum Li-Cor U.W sensor was positioned inside the meadow at canopy height to measure underwater PAR.

2.3. PAM Fluorometry

To perform the photosynthetic measurements, the first two intermediate leaves [73] of each shoot were selected, after gently scraping off epiphytes with a razor blade. All the selected leaves were dark-acclimatedfor at least 15 min, to allow all the reaction centers to be completely open [43]. After that, each leaf was positioned inside the magnetic clip at 4 cm from meristem [44] and kept inside a dark box.
Through the Saturating Pulse Analysis (SPA), Fo and Fm were measured before and after a saturating irradiance pulse, respectively, allowing the calculation ofFv/Fm, which estimates the fraction of absorbed quanta used for PSII photochemistryunder dark-adapted conditions [52]. as:
ETR = PAR × ETRfactor × 0.5 × Y(II)
Through RLC analysis, samples were exposed to increasing intensities of actinic illumination (0–1500 µmol photons m−2 s−1). During each RLC essay,Y(II), which estimates the photochemical use of excitation energy in the light and calculated as the ratio between the increase in fluorescence (ΔF = Fm’ − F) and the maximum fluorescence (Fm’) under light-exposed conditions [74], and ETR (µmol photons m−2 s−1) were calculated. ETRmax, α, Ek, were calculated by plotting ETR versus PAR and fitting an exponential-saturated function [75] to the RLCs dataset, by using the Grapher8 software.
During POSI-Jun, both type of fluorometric analysis were repeated twice on each leaf (sites = 2, replicate shoots = 3, total leaves = 11). Since the duration of the full cycle analysis (20 min) involved a significant statistical variability between the repeated measures, during POSI-Aug they were reduced to one single repetition on each replicate (sites = 3, replicate shoots = 3, total leaves = 54).

2.4. Morphometric Analysis

Once the fluorometric analyses is complete, morphological and biometric characteristics of the examined leaves, as well as the belonging shoots, were measured according to the standard protocol reported in [76] (POSI-Jun: total shoots = 6, total leaves = 38; POSI-Aug: total shoots = 27, total leaves = 197). Parameters were then averaged by sampling site, shoot, and age, defined according to [77] scheme, as “intermediate” and “adult” leaves.

2.5. Pigments Content

For each treated leaf, a segment of 1 cm2 from the leaf portion inside the magnetic leaf, was cut, placed in 3 mL of 100% acetone and stored in a dark refrigerator at −20 °C until laboratory analysis (POSI-Jun: total n = 16; POSI-Aug: total n = 56). Pigments were extracted and measured spectrophotometrically (Shimadzu UVmini-1240) as described by [78]. Concentration of chlorophyll a+b was calculated according to [79]. Concentration of total carotenoids were calculated according to [80], considering a spectrophotometer resolution of 1 nm.

2.6. Statistical Analysis

Morphological and photosynthetic parameters were statistically analyzed by using PAST3, through the Analysis of Variance (ANOVA). This test was employed to identify the potential variability between the sites, as function of depth and time of sampling.

3. Results

3.1. Assessment of the Environmental Conditions

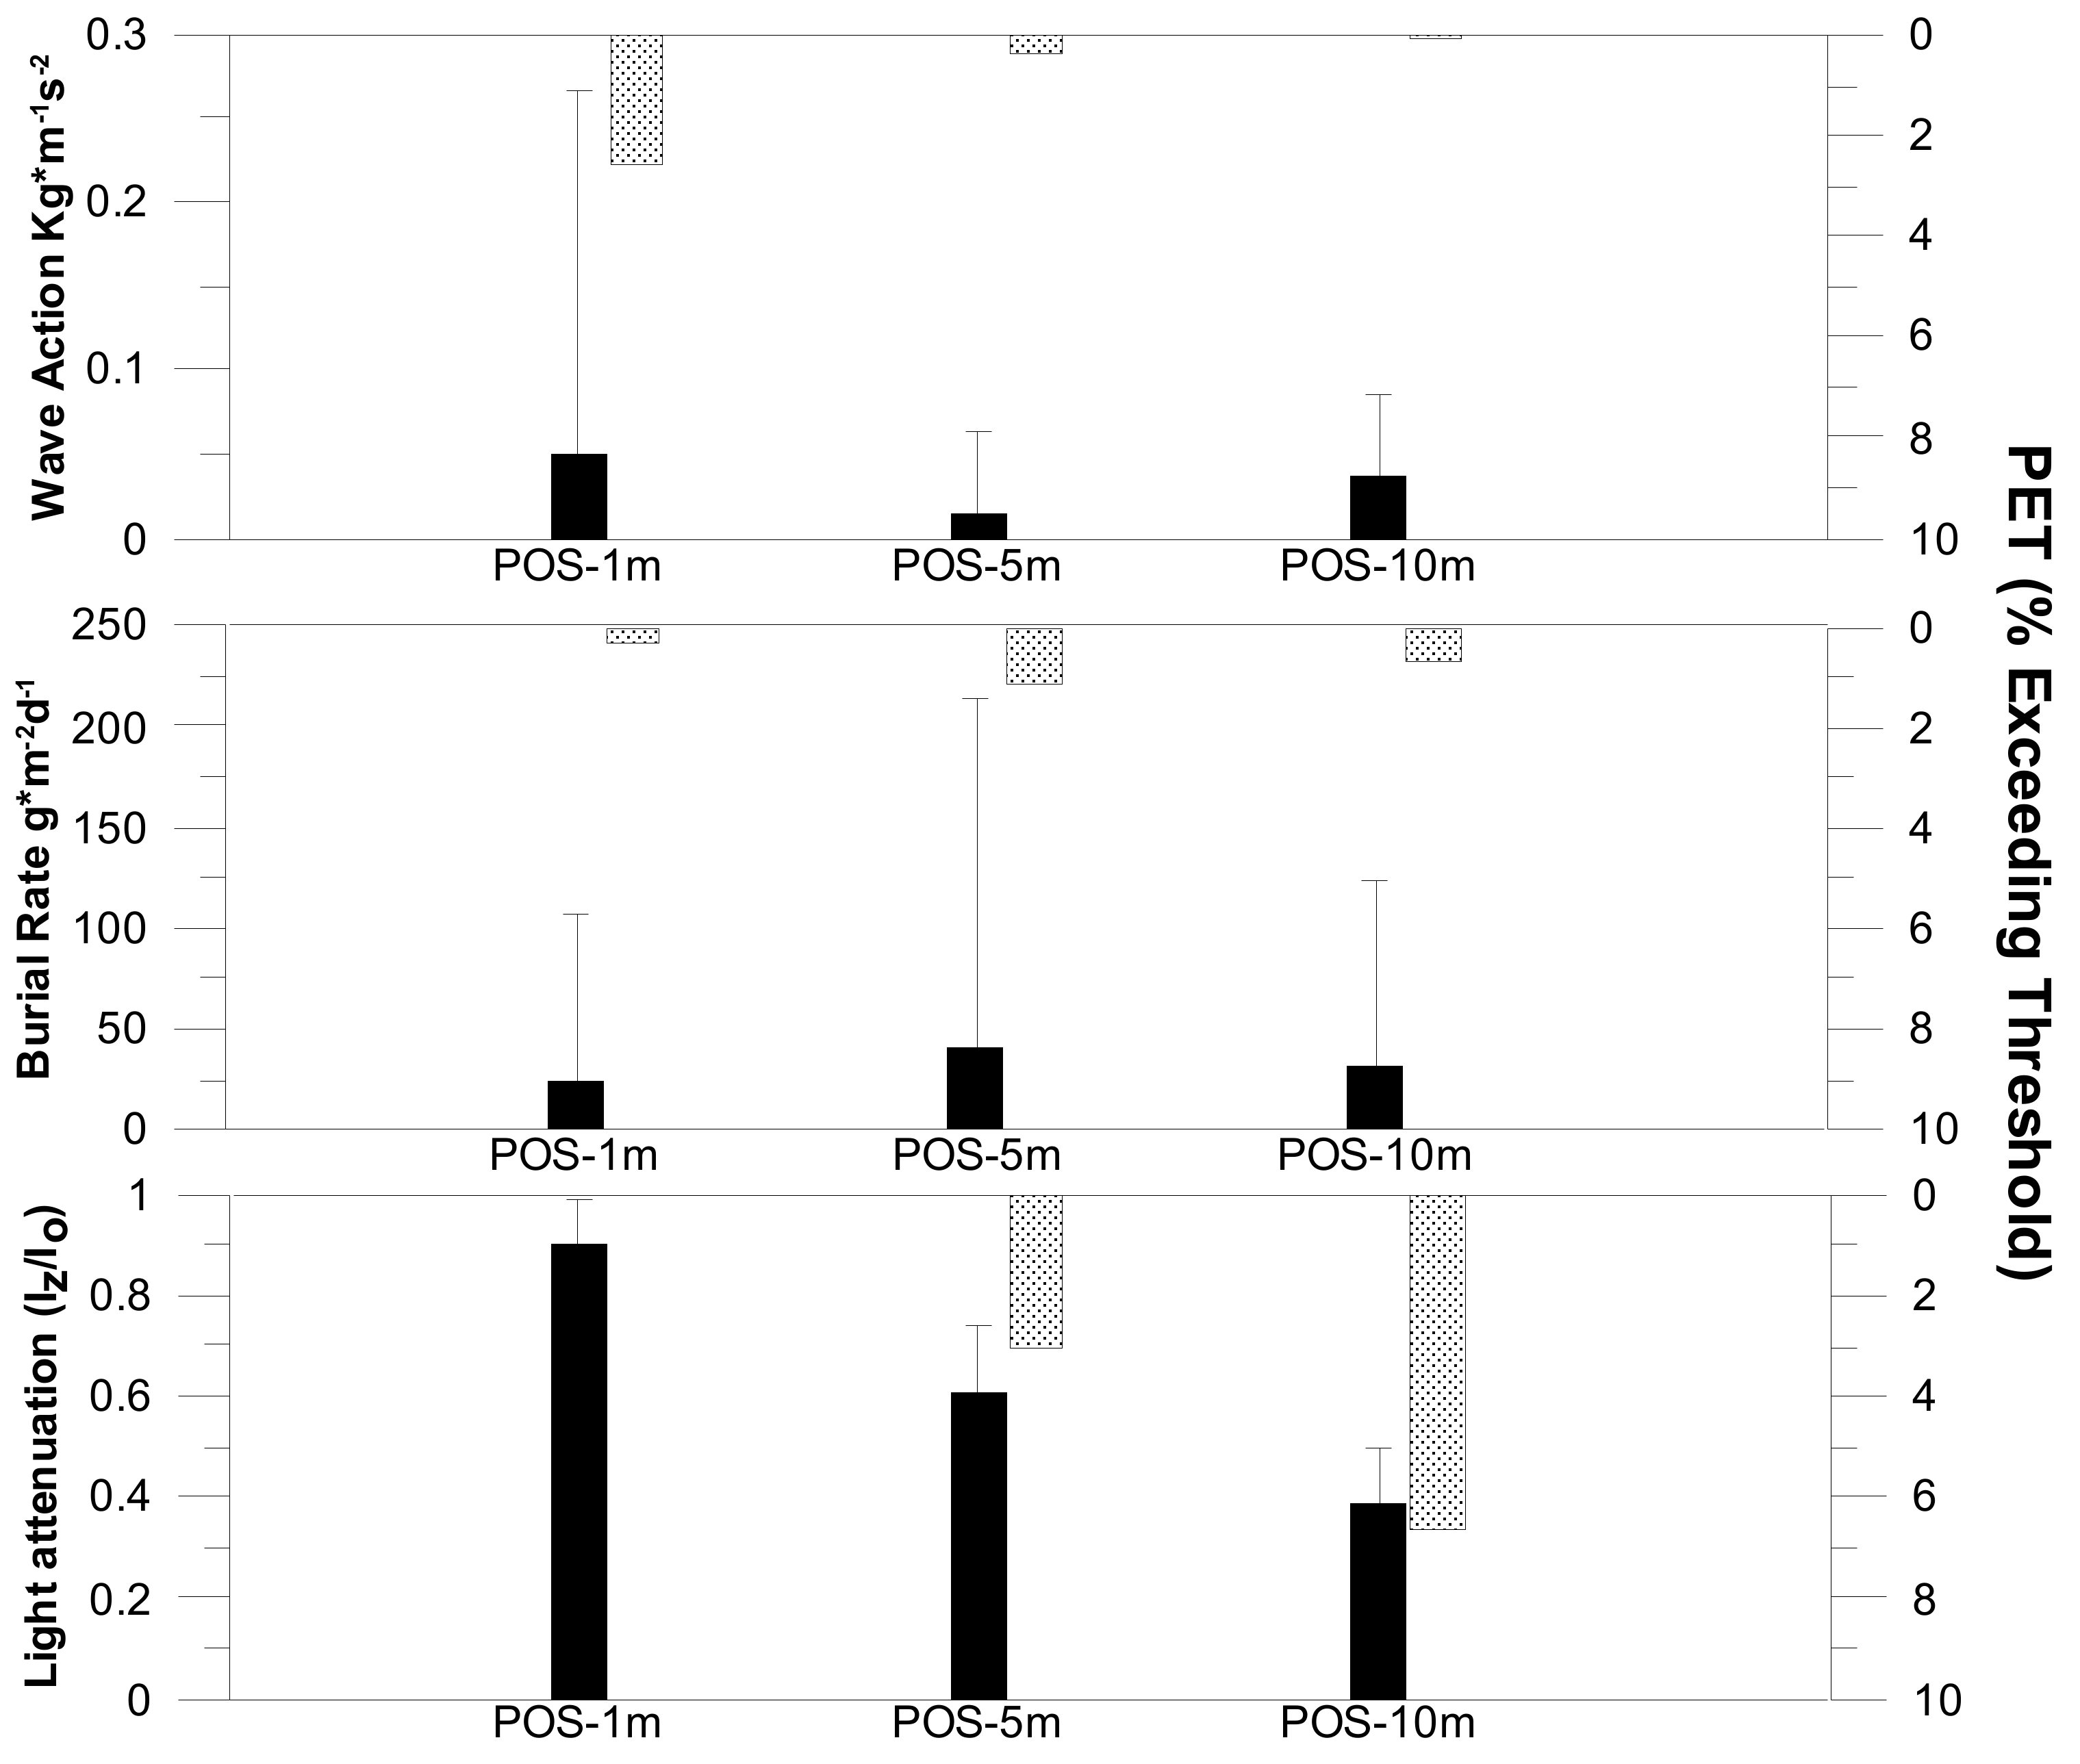
3.1.1. Abiotic Factors

The use of the C-CEMS numerical models [65] allowed the analysis of the main factors that affect the health status of P.oceanica in the investigated area (Figure 2). The results show that the station POS-1m is characterized by the highest values of WA (0.05 ± 0.21 Kg s−1m−2) with a maximum PET of 2.59%, identifying a high hydrodynamic condition, considerably variable during the simulated year. As expected, WA values decrease in the two deeper stations, attaining PET values of 0.39% and 0.07% in correspondence of POS-5m and POS-10m, respectively. BR factor presents the highest values at the mid-depth station POS-5m (40.9 ± 173.3 g m−2 d−1; PET = 1.16%), followed by the deepest station POS-10m (32.2 ± 91.6 g m−2 d−1; PET = 0.71%), consistent with a minimum impact at the shallowest one POS-1m (PET = 0.34%), where the high hydrodynamic energy on the bottom limits the occurrence of sedimentation processes. Concerning LA, a depth-dependent gradient is observed, with maximum PET values at POS-10m due to the highest water column light attenuation (PET = 6.64%), diminishing to 3.23% at POS-5m, and being equal to 0 at POS-1m.

3.1.2. Biotic Factors

Morphological Traits

In POSI-Jun all morphometric parameters increased with depth being higher in the deepest station POS-5m, except the brown tissue length of adult leaves, which was greater in the shallower station POS-10m (Table 1).
By comparing the two stations, ANOVA results show significantly difference for the leaf width, both for intermediate (p < 0.001) and adult ones (p < 0.001), as well as for the brown tissue length of adult leaves (p < 0.05). Within each station, the intermediate leaves present higher values of leaf blade length, green tissue length, and green tissue area, even though the number of adult leaves per shoot is higher than the intermediate ones. By considering all the leaves per station ignoring their age, the percentage of photosynthetic tissue is higher in POS-5m compared to POS-1m (99% and 92.2% respectively). As observed in POSI-Jun, in POSI-Aug the morphometric parameters are higher at 5 m depth station and do not increase with depth (Table 2): the total leaf area per shoot, the green leaf area per shoot and the percentage of photosynthetic tissue are greater in POS-5m, even though the number of leaves per shoot is higher in POS-10m. Differently from POSI-Jun, adult leaves present higher morphometric values than the intermediate ones. Finally, ANOVA results suggest a high variability between the sites and leaves for all parameters (generally p < 0.001) except for the brown tissue length (p > 0.05). Density measurements at meadow level available from a previous survey conducted in 2017 [81] show higher values at POS-10m (206.3 ± 68.8 shoot m−2) and minimum ones at POS-1m (82.6 ± 37.3 shoot m−2).

Pigments Content

POSI-Jun results (Table 3) show higher values of pigment concentrations in the deepest station, POS-5m, even if no significant difference was observed between the two investigated sites (p > 0.1). The same results have been obtained in POSI-Aug, with mean values higher in POS-5m for all types of photosynthetic pigments, except for the total carotenoids, which are higher in POS-1m. As occurred in POSI-Jun, no significant difference was observed between the sites (p > 0.1). By comparing the results of the two campaigns, the concentrations of all pigments decrease from June to August 2018.

3.2. Photo-Physiological Characterization

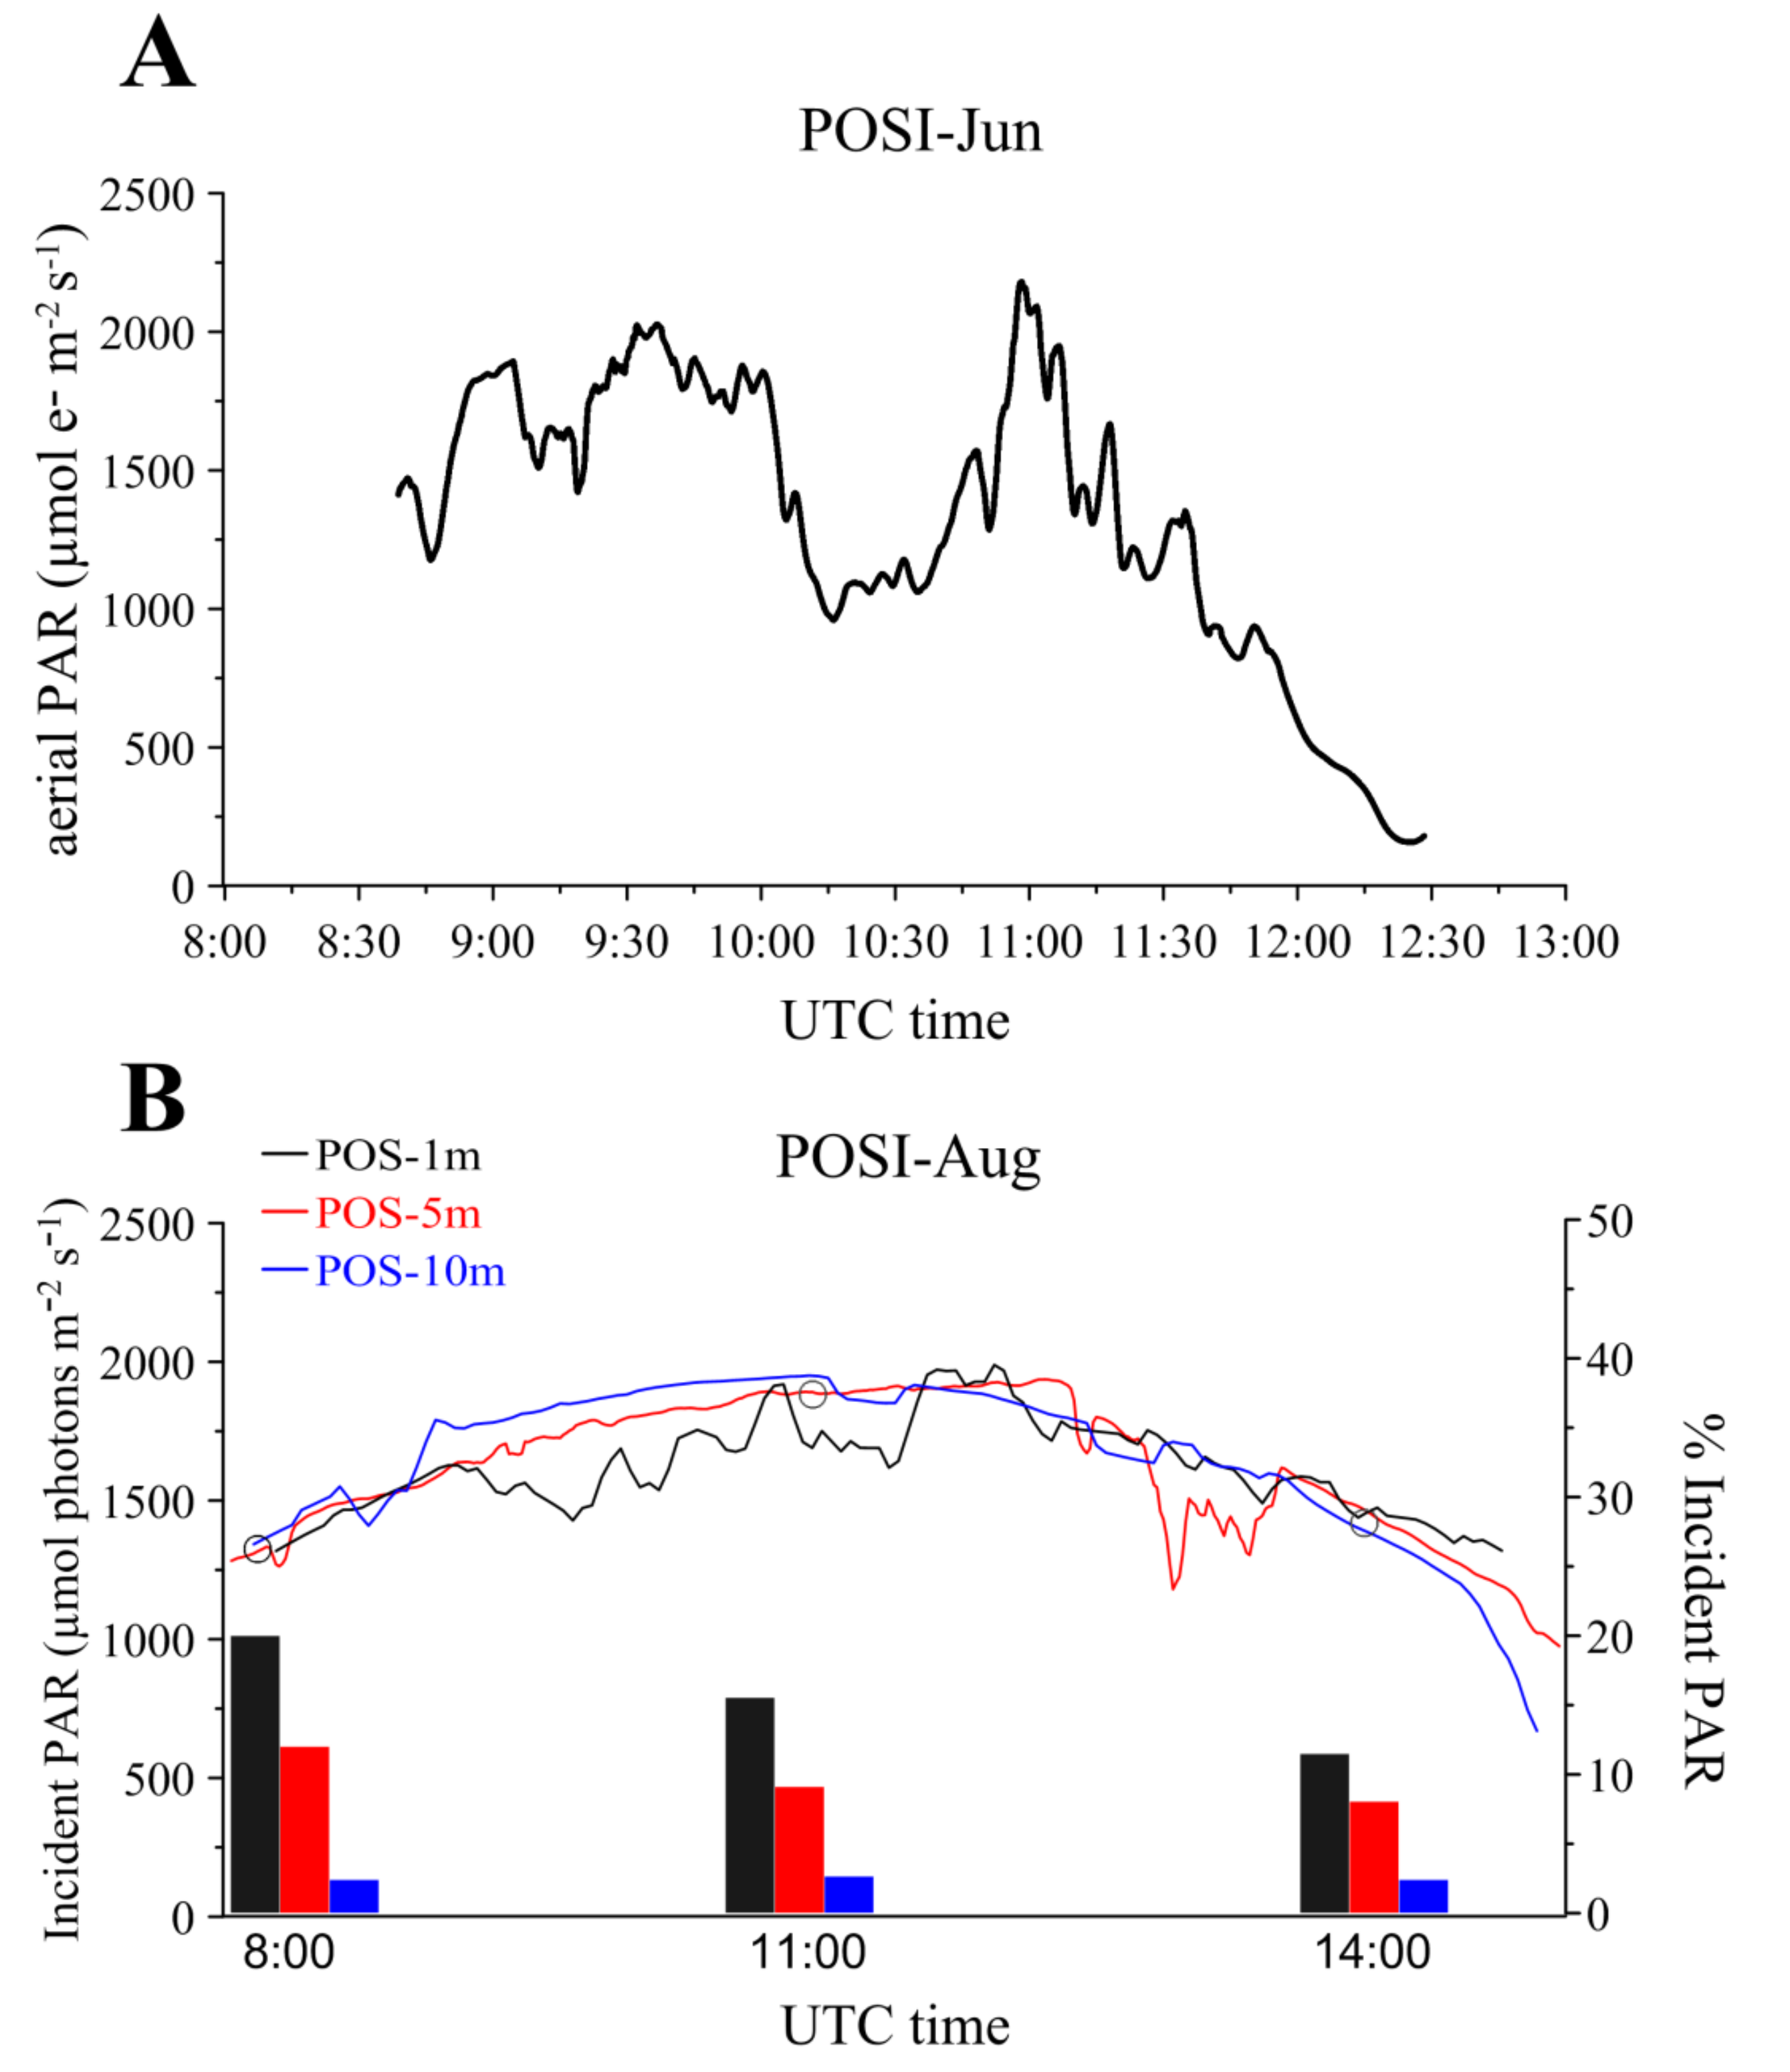
3.2.1. Light Conditions

During POSI-Jun (Figure 3A), incident PAR fluctuated between 1000 and 2000 µmol photons m−2 s−1 from 9:00 to 10:00 UTC. After this period, a rapid reduction of PAR intensity was recorded due to the high cloud coverage until 11:00 UTC, when the maximum peak of 2333 µmol photons m−2 s−1has been registered.
After 11:00 UTC, a progressive decreasing trend to the minimum value of 153 µmol photons m−2 s−1 was observed in correspondence to an intense atmospheric precipitation event. In POSI-Jun (Figure 3B), the typical trend of the incident PAR was observed, with a progressive increase of light availability from 8:00 to 10:00 UTC, reaching a maximum peak of about 1700 µmol photons m−2 s−1at 11:00 UTC. The percentage of incident PAR measured at canopy height reached the maximum values atPOS-1mwith decreasing values from 8:00 (20%) to 14:00 (11.5%). Also, at the -5m station, maximum values of % of incident PAR were registered at 8:00 (12%) with a minimum of 8% at 14:00 The lowest values were recorded at the deepest station (POS-10m), with a constant value of 2% of PAR.

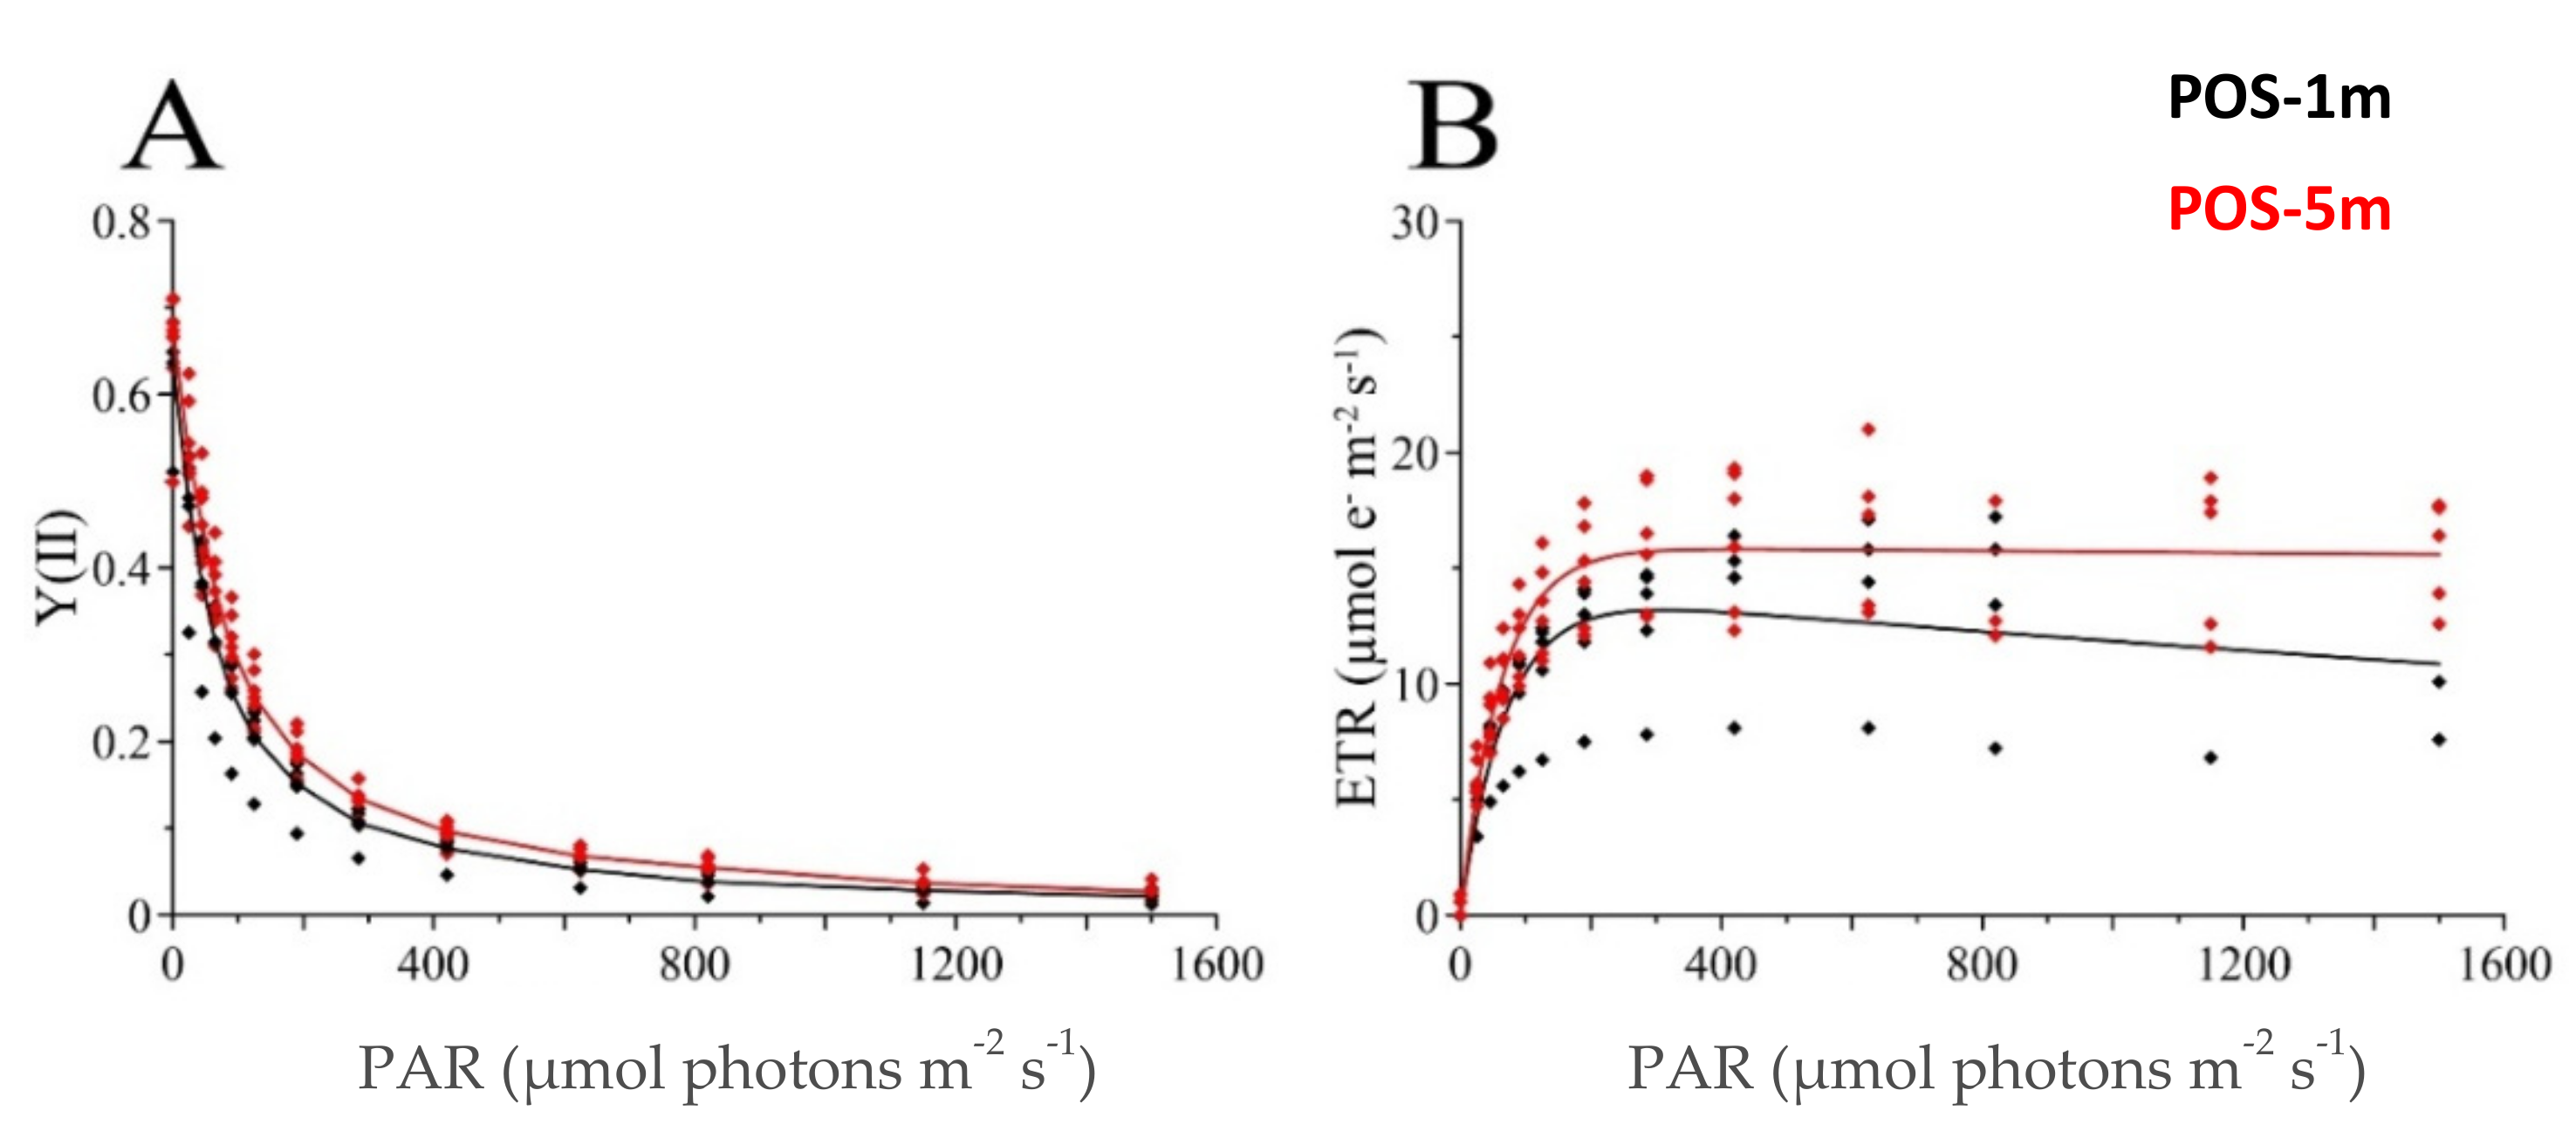
3.2.2. PAM Fluorometry

The Fv/Fm values obtained from SPA analysis and reported in Table 4 did not vary significantly between the two sites during POSI-Jun (ANOVA p > 0.05). Conversely, in POSI-Aug a significant differenceof the same parameter was observed considering the whole dataset (ANOVA p < 0.05). In detail, such difference was attributed to the statistical variability obtained within data sampled at 11:00 (ANOVA p < 0.001), with significant differences demonstrated by ANOVA post hoc (p < 0.05) between the stations located at 1 and 5 m with the deepest one. A significant difference was observed for the ETR values between the stations in both the campaigns (ANOVA p < 0.001). In particular, ANOVA post hoc results showed significant differences between POS-1m and POS-5m at 8:00; significant pairwise differences between all the three stations at 11:00; no significant differences between POS-1m and POS-10m at 14:00.
The RLCs results obtained during POSI-Jun showed higher values of both Y(II) and ETR curves in POS-5m than in POS-1m (Figure 4), with a significant difference observed for the ETR parameter (ANOVA p < 0.01). The same trend was attained in POSI-Aug (Figure 5), with maximum values of both Y(II) and ETR curves measured at POS-5m for each sampling time. Once more, such difference between the sites is statistically confirmed for the ETR parameter (ANOVA 11:00: p < 0.001; 14:00: p < 0.01). The application of the Platt’s fit to the RLCs curves allowed the retrieval of the photosynthetic parameters ETRmax, α and Ek for the two campaigns.
In POSI-Jun, ETRmax and α increase with depth, being higher in the deepest station, POS-5m, while Ek is higher in the shallowest station, POS-1m. In POSI-Aug both ETRmax and α reach their maximum values in POS-5m respectively at 11:00 and 14:00. Once again, Ek show the highest value in the shallowest station, POS-1m at 8:00.

4. Discussion

This study describes the photosynthetic dynamics of P.oceanica through the analysis of the fluorometric (Fv/Fm, Y (II), ETR) and derived photosynthetic parameters (α, β, Ek, Pmax) obtained by PAM fluorometry along a depth gradient in the Northern Tyrrhenian coast in response to different environmental conditions.
To investigate the effects of the environmental factors that mainly affect the health status of P.oceanica within the study area, the models contained in the C-CEMS system were used [65], developed to properly analyze the potential impacts on coastal marine ecosystems with a high spatial and temporal resolution. The model’s outputs as well asPET values have highlighted a different environmental profile of the investigated sites. The shallower one undergoes a major hydrodynamic stress, which is known to strongly affects seagrass primary production and distribution, setting its upper depth limit [19,72,82]. Such condition is related to the lowest total leaf area detected during both POSI-Jun and POSI-Aug campaigns at POS-1m (POSI-Jun: 60.9 cm2 shoot−1; POSI-Aug: 89.5 cm2 shoot−1) as well as to the related percentages of photosynthetic tissue (POSI-Jun: 56.2%; POSI-Aug: 65.9%). This trend is consistent with more spatial fragmentation in shallow waters in wave-exposed environments [83,84]. Differently from what found at shallower depths, in the mid-depth site (−5 m) the factor that mostly weighs on the environmental feature of the local meadow is the burial rate of sedimentation. The sedimentation rate seems to have a positive effect on the photosynthetic capacity of plants which are stimulated to growth to overcome the related burial level, within the range of limits not exceeded in this station. In fact, at this station a greater foliar production is observed, given by the highest percentage of photosynthetic tissue and pigment contents. Indeed, P.oceanica has a relatively high capacity to sustain burial, with burial thresholds of 10.2–14 cm for 50% mortality, and 14–15 cm for 100% mortality [22]. In the deepest station (−10m), light is the main assessed stressor to which P.oceanica meadows are subjected. Such results are in line with the photosynthetic responses of plants performed at this depth, confirming the role of light as the dominant regulator of their photosynthetic capacities in absence of nutrients limitation [85]. Differently from most marine macrophytes, seagrasses have unusually high light requirements, ranging from 10% to as much as 37% of sea-surface irradiance, making them particularly vulnerable to deteriorated water quality and eutrophication phenomena [86].
To investigate the biotic factors that condition the physiological state of P.oceanica, morphological measurements together with the content of photosynthetic pigments as indicators of the health status, growth conditions, and photosynthetic adaptation of P. oceanica [76,87] were considered, allowing confirmation of the photoacclimative strategies described above. In fact, seagrasses, as with other photosynthetic organisms, present a considerable morphological plasticity to environmental changes, enabling them to compensate for shifts in abiotic and biotic parameters [88]. Light acclimation is a hierarchical process that can be observed at different scales, including leaf responses, shoot-scale responses and alterations to the meadow structure [89,90,91]. Concerning the foliar attributes, foliar architecture and growth pattern can modulate physiological responses along a single leaf and among the leaves of a single shoot [92]. Shoot plasticity can be fundamental to maximize exposure to light of the photosynthetic apparatus and minimize respiratory demands [90]. Finally, in reduced light environment, leaf pigment content and composition can vary to optimize light absorption and conversion to chemical energy, thus adjusting the carbon fixation capacity of the plant [93,94,95,96].
The analysis of photo-physiological features of P.oceanica located at the investigated sites highlighted that Fv/Fm values did not vary significantly between 1 and 5 m depths during POSI-Jun and POSI-Aug (ANOVA p > 0.05). Conversely, a high significant difference was observed considering the third station located at 10 m depth during POSI-Aug (ANOVA p < 0.001) at 11:00 UTC, when the solar irradiance reaches its maximum value (Figure 3). This result indicates a general homogeneous level of photo-adaptation of P.oceanica at the three monitored stations, belonging to the same genetic unit [69]. Moreover, based on the evidence from studies regarding photoacclimation, P. oceanica is a species with a low physiological plasticity [47,91,97]. As a climax species with a longer life span, it regulates more strongly at the leaf, shootand meadowlevel in response to light availability [98,99,100] than it does at the physiological level, in contrast to seagrass species with shorter life spans. However, such potential photosynthetic capacity, also supported by a similar percentage of available photosynthetic tissue of the intermediate leaves (Table 2 and Table 3), is substantially modulated at depths greater than 5 m according to the daily irradiance cycle, reflecting different photoacclimative and photoprotective processes that distinguish shallow from deep plants in response to high light stress in the central hours of the day [47,99]. Diurnal variations can strongly mask the photosynthetic response to changing environmental conditions thus it is fundamental to consider them for the retrieval of accurate physiological information [32]. Differently from Fv/Fm, a significant difference was observed for the ETR values between the stations in both campaigns (ANOVA p < 0.001). As captured in detail by the RLC curves, at the shallowest POS-1m station P. oceanica tolerates wide light ranges, not showing significant variation of its photosynthetic capacity throughout the day. At the POS-5m station, a heliophilous behavior of the plants is detected, as the capacity to use light in relation to incident radiation (α) as well as to move electrons along the electronic chain (ETRmax) increases at higher incident and underwater PAR during midday. Conversely, plants located at POS-10m exhibits a sciaphilous pattern typical of plants adapted to an oligophotic environment, showing a reduced ability to perform photosynthesis at the highest daily light levels, as a photoprotective strategy to avoid photoinhibition and damage to the photosynthetic centers [86]. As also reported by [101] deep plants present a stronger shade adaptation strategy in respect to shallow plants, performing rapid photoprotection capacities. The obtained results confirmed the expected higher ability of shallow plants in harvesting light for photosynthesis compared to the slightly lower leaf absorbance that characterize deep plants [89,96,102]. Moreover, this trend is in line with the estimates of P.oceanica net primary production along a transect around Ischia Island [103], where lower values were reported for blades at 10 m than those related to the station located at 5 m depth.
Another interesting feature of the photoacclimative response of P.oceanica is described by Ek, a parameter that indicates the minimum saturating irradiance, expected to be higher in shallow plants [104,105,106,107] and to raise to maximum values in the central hours of the day [103]. Our results confirmed this general trend when values are compared between sites, with higher values founded at the shallowest sites. By looking at the diurnal variation, Ek values increased at midday in POS-5m (62.7 µmol photons m−2 s−1), while they dropped in POS-1m (39.7 µmol photons m−2 s−1) and POS-10m (42.1 µmol photons m−2 s−1), needing less energy to perform photosynthesis. Ek values are in accordance with the ranges reported for P. oceanica in [108] (36–354 µmol photons m−2 s−1). The higher photosynthetic performance attained in POS-5m site is supported by similar results of morphometric characteristics and content of photosynthetic pigments in both campaigns. In fact, this site showed a higher percentage of photosynthetic tissue, estimated as the total leaf green area per shoot (POSI-Jun: 92.2 and 99.0% for POS-1m and POS-5m respectively; POSI-Aug: 65.9, 97.4 and 94.9% for POS-1m, POS-5m, and POS-10m, respectively). Even if the mean number of leaves per shoot was higher in the deepest site, POS-10m (6.89 ± 1.17, 6.78 ± 2.73 and 8.22 ± 3.60 for POS-1m, POS-5m, and POS-10m, respectively), adult and intermediate leaves of POS-5m were significantly longer (p < 0.001) than those observed in POS-10m. Such results are consistent with the density values measured at each site, attaining the highest value at POS-10m (206.3 ± 68.8 shoot m−2) and minimum ones at POS-1m (82.6 ± 37.3 shoot m−2).
Concerning the photosynthetic pigments, greater concentrations of chlorophyll a, b and a+b were found in POS-5m in both campaigns (Table 4), while the concentration of total carotenoids was particularly higher in POS-1m during POSI-Aug. Since concentration of carotenoids generally increases to provide protection against the formation of free radicals [33], a light stress condition is denoted in this station, where also longer brown tissues were accounted.

5. Conclusions

This study allows detection of P. oceanica photosynthetic activity in response to light and site-specific environmental factors. Our results show that Junior-PAM fluorometer can detect photo-physiological changes and diurnal variations of photosynthetic activity of P.oceanica. In this context, the development of new monitoring methods based on the relationships between the submarine light field and photosynthesis of submerged plant canopies give a fundamental tool for the management of these coastal resources. However, more research is still required to increase the knowledge of the interaction between light and plant canopies. Indeed, this research field is also crucial for remote sensing quantification of vegetation abundance and distribution as well as for estimating seagrass primary production and blue carbon stocks in the framework of the international initiatives aimed at preserving the capacity of blue carbon Mediterranean ecosystems in mitigating climate changes. This study also demonstrates the importance of a multidisciplinary approach in marine ecological research for which the integration of physiological and hydrodynamic studies is fundamental to gain a better understanding of complex and variable ecosystems such as the coastal ones. Moreover, allowing identification of the occurrence of a site-specific stress caused by the repeated exceeding of a threshold limit for a defined parameter, PET values provide useful information for the definition of future monitoring programs.

Author Contributions

Conceptualization, A.M., G.C., M.P., S.B. and M.M.; methodology, A.M., M.P.; software, G.C.; S.B.; validation, M.M., A.M. and M.P.; formal analysis, G.C., S.B.; investigation, A.M., G.C.; resources, M.M., M.P.; data curation, G.C., S.B.; writing—original draft preparation, G.C., A.M.; writing—review and editing, A.M., M.P.; visualization, A.M., G.C.; supervision, M.M., M.P.; project administration, M.M.; funding acquisition, M.M., M.P. All authors have read and agreed to the published version of the manuscript.

Funding

This research received no external funding.

Conflicts of Interest

The authors declare no conflict of interest.

References

  1. Díaz, S.M.; Settele, J.; Brondízio, E.S.; Ngo, H.T.; Guèze, M.; Agard, J.; Arneth, A.; Balvanera, P.; Brauman, K.A.; Butchart, S.H.M.; et al. The Global Assessment Report on Biodiversity and Ecosystem Services: Summary for Policy Makers; IPBES Secretariat: Bonn, Germany, 2019; p. 56. [Google Scholar] [CrossRef]
  2. Pergent-Martini, C.; Leoni, V.; Pasqualini, V.; Ardizzone, G.D.; Balestri, E.; Bedini, R.; Belluscio, A.; Belsher, T.; Borg, J.; Boudouresque, C.F.; et al. Descriptors of Posidonia oceanica meadows: Use and application. Ecol. Indic. 2005, 5, 213–230. [Google Scholar] [CrossRef]
  3. Procaccini, G.; Buia, M.C.; Gambi, M.C.; Perez, M.; Pergent, G. The western mediterranean. In World Atlas of Seagrasses; Green, E.P., Short, F.T., Eds.; University of California Press: London, UK, 2003; pp. 48–58. [Google Scholar]
  4. Pergent-Martini, C.; Pergent, G. Marine phanerogams as a tool in the evaluation of marine trace-metal contamination: An example from the Mediterranean. Int. J. Environ. Pollut. 2000, 13, 126. [Google Scholar] [CrossRef]
  5. Romero, J.; Martínez-Crego, B.; Alcoverro, T.; Pérez, M.M. A multivariate index based on the seagrass Posidonia oceanica (POMI) to assess ecological status of coastal waters under the water framework directive (WFD). Mar. Pollut. Bull. 2007, 55, 196–204. [Google Scholar] [CrossRef]
  6. Romero, J. Posidònia: Els Prats Del Fons Del Mar. la Mirada Del Biòleg a Un Ecosistema Mediterrani; Col.lecció Norai 9; Ajuntament de Badalona: Badalona, Spain, 2004; p. 159. [Google Scholar]
  7. Directive, H. Council Directive 92/43/EEC of 21 May 1992 on the conservation of natural habitats and of wild fauna and flora. Off. J. Eur. Union 1992, 206, 7–50. [Google Scholar]
  8. Protocol concerning specially protected areas and biological diversity in the Mediterranean. OJEU 1999, L 322, 3–17. Available online: https://www.ecolex.org/details/treaty/protocol-concerning-specially-protected-areas-and-biological-diversity-in-the-mediterranean-tre-001220/ (accessed on 5 May 2021).
  9. Directive 2000/60/EC of the European Parliament and of the Council of 23 October 2000 Establishing a Framework for Community Action in the Field of Water Policy. OJEU 2000, L 327, 1–73.
  10. Foden, J.; Brazier, D. Angiosperms (seagrass) within the EU water framework directive: A UK perspective. Mar. Pollut. Bull. 2007, 55, 181–195. [Google Scholar] [CrossRef] [PubMed]
  11. EU. Directive 2008/56/EC of the European Parliament and of the Council of 17 June 2008, establishing a framework for community action in the field of marine environmental policy (Marine Strategy Framework Directive). OJEU 2008, L 164/19, 19–40. [Google Scholar]
  12. Ruiz, J.; Romero, J. Effects of disturbances caused by coastal constructions on spatial structure, growth dynamics and photosynthesis of the seagrass Posidonia oceanica. Mar. Pollut. Bull. 2003, 46, 1523–1533. [Google Scholar] [CrossRef]
  13. Orth, R.J.; Carruthers, T.J.; Dennison, W.C.; Duarte, C.M.; Fourqurean, J.W.; Heck, K.L.; Hughes, A.R.; Kendrick, G.A.; Kenworthy, W.J.; Olyarnik, S. A Global Crisis for Seagrass Ecosystems. Bioscience 2006, 56, 987–996. [Google Scholar] [CrossRef] [Green Version]
  14. Ardizzone, G.; Belluscio, A.; Maiorano, L. Long-term change in the structure of a Posidonia oceanica landscape and its reference for a monitoring plan. Mar. Ecol. 2006, 27, 299–309. [Google Scholar] [CrossRef]
  15. Boudouresque, C.F.; Mayot, N.; Pergent, G. The outstanding traits of the functioning of the Posidonia oceanica seagrass eco-system. Biol. Mar. Medit. 2006, 13, 109–113. [Google Scholar]
  16. Montefalcone, M.; Morri, C.; Peirano, A.; Albertelli, G.; Bianchi, C. Substitution and phase shift within the Posidonia oceanica seagrass meadows of NW Mediterranean Sea. Estuar. Coast. Shelf Sci. 2007, 75, 63–71. [Google Scholar] [CrossRef]
  17. Walker, D.; McComb, A. Seagrass degradation in Australian coastal waters. Mar. Pollut. Bull. 1992, 25, 191–195. [Google Scholar] [CrossRef]
  18. Infantes, E.; Orfila, A.; Simarro, G.; Terrados, J.; Luhar, M.; Nepf, H. Effect of a seagrass (Posidonia oceanica) meadow on wave propagation. Mar. Ecol. Prog. Ser. 2012, 456, 63–72. [Google Scholar] [CrossRef] [Green Version]
  19. La Loggia, G.; Calvo, S.; Ciraolo, G.; Mazzola, A.; Pirrotta, M.; Sara, G.; Tomasello, A.; Vizzini, S. Influence of hydrodynamic conditions on the production and fate ofPosidonia oceanicain a semi-enclosed shallow basin (Stagnone di Marsala, Western Sicily). Chem. Ecol. 2004, 20, 183–201. [Google Scholar] [CrossRef]
  20. Balzano, A.; Calvo, S.; Ciraolo, G.; La Loggia, G. Remote sensing as a tool to calibrate hydrodynamic model-transport numerical models. In Proceedings of the International Conference New Trends in Water and Environmental Engineering for Safety and Life. Eco-compatible Solutions for Aquatic Environments, Capri, Italy, 3–7 July 2000; pp. 1–10. [Google Scholar]
  21. Vacchi, M.; De Falco, G.; Simeone, S.; Montefalcone, M.; Morri, C.; Ferrari, M.; Bianchi, C.N. Biogeomorphology of the MediterraneanPosidonia oceanicaseagrass meadows. Earth Surf. Process. Landf. 2017, 42, 42–54. [Google Scholar] [CrossRef] [Green Version]
  22. Cabaço, S.; Santos, R.; Duarte, C.M. The impact of sediment burial and erosion on seagrasses: A review. Estuar. Coast. Shelf Sci. 2008, 79, 354–366. [Google Scholar] [CrossRef]
  23. Larkum, A.W.D.; West, R.J. Stability, depletion and restoration of seagrass beds. In Proceedings of the Linnean Society of NSW 1983, New South Wales, Sydney, Australia, 27 October 1982; Volume 106, pp. 201–212. [Google Scholar]
  24. Pulich, W.M.; White, W.A. Decline of submerged vegetation in the Galveston Bay ecosystem: Chronology and relationships to physical processes. J. Coast. Res. 1991, 7, 1125–1138. [Google Scholar]
  25. Dunton, K.H. Seasonal growth and biomass of the subtropical seagrassHalodule wrightii in relation to continuous measurements of underwater irradiance. Mar. Biol. 1994, 120, 479–489. [Google Scholar] [CrossRef]
  26. Zimmerman, R.C.; Reguzzoni, J.L.; Alberte, R.S. Eelgrass (Zostera marina L.) transplants in San Francisco Bay: Role of light availability on metabolism, growth and survival. Aquat. Bot. 1995, 51, 67–86. [Google Scholar] [CrossRef]
  27. Waycott, M.; Duarte, C.M.; Carruthers, T.J.; Orth, R.J.; Dennison, W.C.; Olyarnik, S.; Calladine, A.; Fourqurean, J.W.; Heck, K.L.; Hughes, A.R.; et al. Accelerating loss of seagrasses across the globe threatens coastal ecosystems. Proc. Natl. Acad. Sci. USA 2009, 106, 12377–12381. [Google Scholar] [CrossRef] [Green Version]
  28. Alcoverro, T.; Duarte, C.; Romero, J. Annual growth dynamics of Posidonia oceanica:contribution of large-scale versus local factors to seasonality. Mar. Ecol. Prog. Ser. 1995, 120, 203–210. [Google Scholar] [CrossRef] [Green Version]
  29. Ralph, P.J. Photosynthetic response of Halophila ovalis (R. Br.) Hook. f. to combined environmental stress. Aquat. Bot. 1999, 65, 83–96. [Google Scholar] [CrossRef]
  30. Björkman, O. Comparative Studies on Photosynthesis in Higher Plants. Photophysiology 1973, 8, 1–63. [Google Scholar] [CrossRef] [PubMed]
  31. Sand-Jensen, K. Environmental variables and their effect on photosynthesis of aquatic plant communities. Aquat. Bot. 1989, 34, 5–25. [Google Scholar] [CrossRef]
  32. Belshe, E.; Durako, M.; Blum, J. Photosynthetic rapid light curves (RLC) of Thalassia testudinum exhibit diurnal variation. J. Exp. Mar. Biol. Ecol. 2007, 342, 253–268. [Google Scholar] [CrossRef]
  33. Brain, R.A.; Cedergreen, N. Biomarkers in aquatic plants: Selection and utility. In Reviews of Environmental Contamination and Toxicology; Whitacre, D.M., Ed.; Springer: New York, NY, USA, 2009; pp. 49–109. [Google Scholar]
  34. Ralph, P.; Burchett, M. Photosynthetic response of Halophila ovalis to heavy metal stress. Environ. Pollut. 1998, 103, 91–101. [Google Scholar] [CrossRef]
  35. Prange, J.; Dennison, W. Physiological Responses of Five Seagrass Species to Trace Metals. Mar. Pollut. Bull. 2000, 41, 327–336. [Google Scholar] [CrossRef]
  36. Haynes, D.; Ralph, P.; Prange, J.; Dennison, B. The Impact of the Herbicide Diuron on Photosynthesis in Three Species of Tropical Seagrass. Mar. Pollut. Bull. 2000, 41, 288–293. [Google Scholar] [CrossRef]
  37. Macinnis-Ng, C.M.; Ralph, P.J. Towards a more ecologically relevant assessment of the impact of heavy metals on the photosynthesis of the seagrass, Zostera capricorni. Mar. Pollut. Bull. 2002, 45, 100–106. [Google Scholar] [CrossRef]
  38. Macinnis-Ng, C.M.; Ralph, P.J. Short-term response and recovery of Zostera capricorni photosynthesis after herbicide exposure. Aquat. Bot. 2003, 76, 1–15. [Google Scholar] [CrossRef]
  39. Macinnis-Ng, C.M. In situ impact of multiple pulses of metal and herbicide on the seagrass, Zostera capricorni. Aquat. Toxicol. 2004, 67, 227–237. [Google Scholar] [CrossRef] [PubMed]
  40. Wilkinson, A.D.; Collier, C.J.; Flores, F.; Negri, A.P. Acute and additive toxicity of ten photosystem-II herbicides to seagrass. Sci. Rep. 2015, 5, 17443. [Google Scholar] [CrossRef] [PubMed] [Green Version]
  41. Diepens, N.J.; Buffan-Dubau, E.; Budzinski, H.; Kallerhoff, J.; Merlina, G.; Silvestre, J.; Auby, I.; Tapie, N.; Elger, A. Toxicity effects of an environmental realistic herbicide mixture on the seagrass Zostera noltei. Environ. Pollut. 2017, 222, 393–403. [Google Scholar] [CrossRef] [PubMed]
  42. Mohammadi, N.S.; Buapet, P.; Pernice, M.; Signal, B.; Kahlke, T.; Hardke, L.; Ralph, P.J. Transcriptome profiling analysis of the seagrass, Zostera muelleri under copper stress. Mar. Pollut. Bull. 2019, 149, 110556. [Google Scholar] [CrossRef] [PubMed]
  43. Beer, S.; Björk, M.; Gademann, R.; Ralph, P. Measurements of photosynthetic rates in seagrasses. In Global Seagrass Research Methods; Elsevier: Amsterdam, The Netherlands, 2001; pp. 183–198. [Google Scholar]
  44. Campbell, S.; Miller, C.; Steven, A.; Stephens, A. Photosynthetic responses of two temperate seagrasses across a water quality gradient using chlorophyll fluorescence. J. Exp. Mar. Biol. Ecol. 2003, 291, 57–78. [Google Scholar] [CrossRef]
  45. Bité, J.S.; Campbell, S.J.; McKenzie, L.J.; Coles, R.G. Chlorophyll fluorescence measures of seagrasses Halophila ovalis and Zostera capricorni reveal differences in response to experimental shading. Mar. Biol. 2007, 152, 405–414. [Google Scholar] [CrossRef]
  46. Mvungi, E.F.; Lyimo, T.J.; Björk, M. When Zostera marina is intermixed with Ulva, its photosynthesis is reduced by increased pH and lower light, but not by changes in light quality. Aquat. Bot. 2012, 102, 44–49. [Google Scholar] [CrossRef]
  47. Dattolo, E.; Ruocco, M.; Brunet, C.; Lorenti, M.; Lauritano, C.; D’Esposito, D.; De Luca, P.; Sanges, R.; Mazzuca, S.; Procaccini, G. Response of the seagrass Posidonia oceanica to different light environments: Insights from a combined molecular and photo-physiological study. Mar. Environ. Res. 2014, 101, 225–236. [Google Scholar] [CrossRef]
  48. Davey, P.A.; Pernice, M.; Ashworth, J.; Kuzhiumparambil, U.; Szabó, M.; Dolferus, R.; Ralph, P.J. A new mechanistic understanding of light-limitation in the seagrass Zostera muelleri. Mar. Environ. Res. 2018, 134, 55–67. [Google Scholar] [CrossRef]
  49. Pagès, J.F.; Pérez, M.M.; Romero, J. Sensitivity of the seagrass Cymodocea nodosa to hypersaline conditions: A microcosm approach. J. Exp. Mar. Biol. Ecol. 2010, 386, 34–38. [Google Scholar] [CrossRef]
  50. Guerrero-Meseguer, L.; Marín, A.; Sanz-Lázaro, C. Future heat waves due to climate change threaten the survival of Posidonia oceanica seedlings. Environ. Pollut. 2017, 230, 40–45. [Google Scholar] [CrossRef] [PubMed]
  51. Beer, S.; Vilenkin, B.; Weil, A.; Veste, M.; Susel, L.; Eshel, A. Measuring photosynthetic rates in seagrasses by pulse amplitude modulated (PAM) fluorometry. Mar. Ecol. Prog. Ser. 1998, 174, 293–300. [Google Scholar] [CrossRef]
  52. Kitajima, M.B.W.L.; Butler, W.L. Quenching of chlorophyll fluorescence and primary photochemistry in chloroplasts by di-bromothymoquinone. Bioenergetics 1975, 376, 105–115. [Google Scholar] [CrossRef]
  53. Larkum, A.W.; Drew, E.A.; Ralph, P.J. Photosynthesis and metabolism in Seagrasses at the cellular level. In Seagrasses: Biology, Ecologyand Conservation; Metzler, J.B., Ed.; Springer: Berlin/Heidelberg, Germany, 2007; pp. 323–345. [Google Scholar]
  54. Meravi, N.; Prajapati, S.K. Biomonitoring the genotoxicity of heavy metals/metalloids present n soil contaminated by fly ash from coal-fired thermal power plant using Tradescantia pallida. In Phytoremediation; Springer: Berlin/Heidelberg, Germany, 2015; pp. 169–176. [Google Scholar]
  55. Gao, L.N. Comparison of chlorophyll fluorescence characteristics between two submerged macrophytes in Jiuzhaigou National Nature Reserve. Acta Agric. Zhejiangensis 2017, 29, 951–958. [Google Scholar]
  56. Gao, L.-N. Photosynthetic characteristics of Marestail using PAM fluorometry. In Proceedings of the 2nd International Conference on Biomedical and Biological Engineering 2017 (BBE 2017), Guilin, China, 26–28 May 2017; pp. 134–139. [Google Scholar]
  57. Ranawakage, V.P.; Asaeda, T. Evaluation of the physiological alterations in Ceratophyllum demersum L. along a diurnally changing solar irradiance gradient. J. Plant Interact. 2020, 15, 8–16. [Google Scholar] [CrossRef]
  58. Figueroa, F.L.; Jerez, C.G.; Korbee, N. Use of in vivo chlorophyll fluorescence to estimate photosynthetic activity and biomass productivity in microalgae grown in different culture systems. Lat. Am. J. Aquat. Res. 2013, 41, 801–819. [Google Scholar] [CrossRef]
  59. Machado, M.D.; Lopes, A.R.; Soares, E.V. Responses of the alga Pseudokirchneriella subcapitata to long-term exposure to metal stress. J. Hazard. Mater. 2015, 296, 82–92. [Google Scholar] [CrossRef] [Green Version]
  60. Jerez, C.G.; Malapascua, J.R.; Sergejevová, M.; Masojídek, J.; Figueroa, F.L. Chlorella fusca (Chlorophyta) grown in thin-layer cascades: Estimation of biomass productivity by in-vivo chlorophyll a fluorescence monitoring. Algal Res. 2016, 17, 21–30. [Google Scholar] [CrossRef]
  61. Elso, M.Z.; Garcia-Jimenez, P.; Robaina, R.; Robaina, R. Endogenous polyamine content and photosynthetic performance under hypo-osmotic conditions reveal Cymodocea nodosa as an obligate halophyte. Aquat. Biol. 2012, 17, 7–17. [Google Scholar] [CrossRef]
  62. Govers, L. The Effects of Biogeochemical Stressors on Seagrass Ecosystems. Ph.D. Thesis, Radboud University, Nijmegen, The Netherlands, 2014. [Google Scholar]
  63. Repolho, T.; Duarte, B.; Dionísio, G.; Paula, J.R.; Lopes, A.R.; Rosa, I.C.; Grilo, T.F.; Caçador, I.; Calado, R.; Rosa, R. Seagrass ecophysiological performance under ocean warming and acidification. Sci. Rep. 2017, 7, 41443. [Google Scholar] [CrossRef] [PubMed]
  64. Mota, C.F.; Engelen, A.H.; Serrao, E.A.; Coelho, M.A.G.; Marbà, N.; Krause-Jensen, D.; Pearson, G.A. Differentiation in fitness-related traits in response to elevated temperatures between leading and trailing edge populations of marine macrophytes. PLoS ONE 2018, 13, e0203666. [Google Scholar] [CrossRef] [PubMed] [Green Version]
  65. Bonamano, S.; Piermattei, V.; Madonia, A.; De Mendoza, F.P.; Pierattini, A.; Martellucci, R.; Stefanì, C.; Zappalà, G.; Caruso, G.; Marcelli, M. The Civitavecchia Coastal Environment Monitoring System (C-CEMS): A new tool to analyze the conflicts between coastal pressures and sensitivity areas. Ocean Sci. 2016, 12, 87–100. [Google Scholar] [CrossRef] [Green Version]
  66. Bonamano, S.; Madonia, A.; Borsellino, C.; Stefanì, C.; Caruso, G.; De Pasquale, F.; Piermattei, V.; Zappalà, G.; Marcelli, M. Modeling the dispersion of viable and total Escherichia coli cells in the artificial semi-enclosed bathing area of Santa Marinella (Latium, Italy). Mar. Pollut. Bull. 2015, 95, 141–154. [Google Scholar] [CrossRef] [PubMed]
  67. de Mendoza, F.P.; Fontolan, G.; Mancini, E.; Scanu, E.; Scanu, S.; Bonamano, S.; Marcelli, M. Sediment dynamics and resuspension processes in a shallow-water Posidonia oceanica meadow. Mar. Geol. 2018, 404, 174–186. [Google Scholar] [CrossRef]
  68. Marcelli, M.; Scanu, S.; Frattarelli, F.M.; Mancini, E.; Carli, F.M. A Benthic Zonation System as a Fundamental Tool for Natural Capital Assessment in a Marine Environment: A Case Study in the Northern Tyrrhenian Sea, Italy. Sustainability 2018, 10, 3786. [Google Scholar] [CrossRef] [Green Version]
  69. Gnisci, V.; De Martiis, S.C.; Belmonte, A.; Micheli, C.; Piermattei, V.; Bonamano, S.; Marcelli, M. Assessment of the ecological structure of Posidonia oceanica (L.) Delile on the northern coast of Lazio, Italy (central Tyrrhenian, Mediterranean). Ital. Bot. 2020, 9, 1–19. [Google Scholar] [CrossRef] [Green Version]
  70. Booij, N.R.R.C.; Ris, R.C.; Holthuijsen, L.H. A third-generation wave model for coastal regions: 1. Model description and val-idation. J. Geophys. Res. Ocean. 1999, 104, 7649–7666. [Google Scholar] [CrossRef] [Green Version]
  71. Infantes, E.; Cañellas, B.; Álvarez-Ellacuria, A.; Terrados, J.; Orfila, A. Wave energy and the upper depth limit distribution of Posidonia oceanica. Bot. Mar. 2009, 52, 419–427. [Google Scholar] [CrossRef] [Green Version]
  72. Manzanera, M.; Alcoverro, T.; Tomás, F.; Romero, J. Response of Posidonia oceanica to burial dynamics. Mar. Ecol. Prog. Ser. 2011, 423, 47–56. [Google Scholar] [CrossRef] [Green Version]
  73. Gera, A.; Alcoverro, T.; Mascaró, O.; Pérez, M.; Romero, J. Exploring the utility of Posidonia oceanica chlorophyll fluorescence as an indicator of water quality within the European Water Framework Directive. Environ. Monit. Assess. 2011, 184, 3675–3686. [Google Scholar] [CrossRef]
  74. Genty, B.; Briantais, J.-M.; Baker, N.R. The relationship between the quantum yield of photosynthetic electron transport and quenching of chlorophyll fluorescence. Biochim. Biophys. Acta (BBA) Gen. Subj. 1989, 990, 87–92. [Google Scholar] [CrossRef]
  75. Platt, T.; Gallegos, C.L.; Harrison, W.G. Photoinhibition of photosynthesis in natural assemblages of marine phytoplankton. J. Mar. Res. 1980, 38, 687–701. [Google Scholar]
  76. Buia, M.C.; Gambi, M.C.; Dappiano, M. Seagrass systems. Biol. Mar. Mediterr. 2004, 11 (Suppl. 1), 133–183. [Google Scholar]
  77. Giraud, G.; Boudouresque, C.-F.; Cinelli, F.; Fresi, E.; Mazzella, L. Observations sur l’herbier de Posidonia oceanica (L.) Delile autour de l’Ile d’Ischia (Italie). G. Bot. Ital. 1979, 113, 261–274. [Google Scholar] [CrossRef]
  78. Dennison, W.C. Chlorophyll content. In Seagrass Research Methods; Phillips, R.C., McRoy, C.P., Eds.; UNESCO: Paris, France, 1990; pp. 83–85. [Google Scholar]
  79. Porra, R.; Thompson, W.; Kriedemann, P. Determination of accurate extinction coefficients and simultaneous equations for assaying chlorophylls a and b extracted with four different solvents: Verification of the concentration of chlorophyll standards by atomic absorption spectroscopy. Biochim. Biophys. Acta (BBA) Bioenerg. 1989, 975, 384–394. [Google Scholar] [CrossRef]
  80. Lichtenthaler, H.K.; Wellburn, A.R. Determinations of total carotenoids and chlorophylls a and b of leaf extracts in different solvents. Biochem. Soc. Trans. 1983, 11, 591–592. [Google Scholar] [CrossRef] [Green Version]
  81. Bonamano, S.; Piazzolla, D.; Scanu, S.; Mancini, E.; Madonia, A.; Piermattei, V.; Marcelli, M. Modelling approach for the evaluation of burial and erosion processes on Posidonia oceanica meadows. Estuar. Coast. Shelf Sci. 2021, 254, 107321. [Google Scholar] [CrossRef]
  82. Short, F.T.; Neckles, H.A. The effects of global climate change on seagrasses. Aquat. Bot. 1999, 63, 169–196. [Google Scholar] [CrossRef]
  83. Fonseca, M.; Bell, S. Influence of physical setting on seagrass landscapes near Beaufort, North Carolina, USA. Mar. Ecol. Prog. Ser. 1998, 171, 109–121. [Google Scholar] [CrossRef] [Green Version]
  84. Frederiksen, M.; Krause-Jensen, D.; Holmer, M.; Laursen, J.S. Spatial and temporal variation in eelgrass (Zostera marina) landscapes: Influence of physical setting. Aquat. Bot. 2004, 78, 147–165. [Google Scholar] [CrossRef]
  85. Alcoverro, T.; Manzanera, M.; Romero, J. Annual metabolic carbon balance of the seagrass Posidonia oceanica: The importance of carbohydrate reserves. Mar. Ecol. Prog. Ser. 2001, 211, 105–116. [Google Scholar] [CrossRef]
  86. Ruban, A.V.; Johnson, M.P. Dynamics of higher plant photosystem cross-section associated with state transitions. Photosynth. Res. 2008, 99, 173–183. [Google Scholar] [CrossRef] [PubMed]
  87. Marbà, N.; Santiago, R.; Díaz-Almela, E.; Álvarez, E.; Duarte, C.M. Seagrass (Posidonia oceanica) vertical growth as an early indicator of fish farm-derived stress. Estuar. Coast. Shelf Sci. 2006, 67, 475–483. [Google Scholar] [CrossRef]
  88. Major, K.M.; Dunton, K.H. Variations in light-harvesting characteristics of the seagrass, Thalassia testudinum: Evidence for photoacclimation. J. Exp. Mar. Biol. Ecol. 2002, 275, 173–189. [Google Scholar] [CrossRef]
  89. Olesen, B.; Enríquez, S.; Duarte, C.; Sand-Jensen, K. Depth-acclimation of photosynthesis, morphology and demography of Posidonia oceanica and Cymodocea nodosa in the Spanish Mediterranean Sea. Mar. Ecol. Prog. Ser. 2002, 236, 89–97. [Google Scholar] [CrossRef] [Green Version]
  90. Collier, C.; Lavery, P.; Masini, R.; Ralph, P. Morphological, growth and meadow characteristics of the seagrass Posidonia sinuosa along a depth-related gradient of light availability. Mar. Ecol. Prog. Ser. 2007, 337, 103–115. [Google Scholar] [CrossRef] [Green Version]
  91. Collier, C.J.; Lavery, P.S.; Ralph, P.J.; Masini, R.J. Shade-induced response and recovery of the seagrass Posidonia sinuosa. J. Exp. Mar. Biol. Ecol. 2009, 370, 89–103. [Google Scholar] [CrossRef]
  92. Olivé, I.; Vergara, J.J.; Pérez-Lloréns, J.L. Photosynthetic and morphological photoacclimation of the seagrass Cymodocea nodosa to season, depth and leaf position. Mar. Biol. 2013, 160, 285–297. [Google Scholar] [CrossRef]
  93. Abal, E.; Loneragan, N.; Bowen, P.; Perry, C.; Udy, J.; Dennison, W. Physiological and morphological responses of the seagrass Zostera capricorni Aschers, to light intensity. J. Exp. Mar. Biol. Ecol. 1994, 178, 113–129. [Google Scholar] [CrossRef]
  94. Peralta, G.; Pérez-Lloréns, J.L.; Hernández, I.; Vergara, J.J. Effects of light availability on growth, architecture and nutrient content of the seagrass Zostera noltii Hornem. J. Exp. Mar. Biol. Ecol. 2002, 269, 926. [Google Scholar] [CrossRef]
  95. Ralph, P.J.; Gademann, R. Rapid light curves: A powerful tool to assess photosynthetic activity. Aquat. Bot. 2005, 82, 222–237. [Google Scholar] [CrossRef]
  96. Sandoval-Gil, J.M.; Ruiz, J.M.; Marín-Guirao, L.; Bernardeau-Esteller, J.; Sánchez-Lizaso, J.L. Ecophysiological plasticity of shallow and deep populations of the Mediterranean seagrasses Posidonia oceanica and Cymodocea nodosa in response to hypersaline stress. Mar. Environ. Res. 2014, 95, 39–61. [Google Scholar] [CrossRef] [PubMed]
  97. Schubert, N.; Freitas, C.; Silva, A.; Costa, M.M.; Barrote, I.; Horta, P.A.; Silva, J. Photoacclimation strategies in northeastern Atlantic seagrasses: Integrating responses across plant organizational levels. Sci. Rep. 2018, 8, 1–14. [Google Scholar] [CrossRef]
  98. Lorenti, M.; Lassauque, J.; Mattera, F.; Buia, M.C. Photosynthetic activity of Posidonia oceanica during a diurnal cycle of irra-diance. Biol. Mar. Mediterr. 2006, 13, 597–600. [Google Scholar]
  99. Procaccini, G.; Ruocco, M.; Marín-Guirao, L.; Dattolo, E.; Brunet, C.; D’Esposito, D.; Lauritano, C.; Mazzuca, S.; Serra, I.A.; Bernardo, L.; et al. Depth-specific fluctuations of gene expression and protein abundance modulate the photophysiology in the seagrass Posidonia oceanica. Sci. Rep. 2017, 7, srep42890. [Google Scholar] [CrossRef]
  100. Ruocco, M.; De Luca, P.; Marín-Guirao, L.; Procaccini, G. Differential Leaf Age-Dependent Thermal Plasticity in the Keystone Seagrass Posidonia oceanica. Front. Plant Sci. 2019, 10, 1556. [Google Scholar] [CrossRef]
  101. Ralph, P.J.; Wilhelm, C.; Lavaud, J.; Jakob, T.; Petrou, K.; Krans, S.A. Fluorescence as a tool to understand changes in photo-synthetic electron flow regulation. In Chlorophyll a Fluorescence in Aquatic Sciences: Methods and Applications; Suggett, D.J., Borowitzka, M.A., Prášil, O., Eds.; Springer: Berlin/Heidelberg, Germany, 2010; pp. 75–89. [Google Scholar]
  102. Pergent, G.; Romero, J.; Pergent-Martini, C.; Mateo, M.-A.; Boudouresque, C.-F. Primary production, stocks and fluxes in the Mediterranean seagrass Posidonia oceanica. Mar. Ecol. Prog. Ser. 1994, 106, 139–146. [Google Scholar] [CrossRef]
  103. Lobban, C.S.; Harrison, P.J. Seaweed Ecology and Physiology; Cambridge University Press: Cambridge, UK, 1994; p. 384. [Google Scholar]
  104. Falkowski, P.G.; Raven, J.A. Aquatic Photosynthesis, 2nd ed.; Princeton University Press: Princeton, NJ, USA, 2007. [Google Scholar]
  105. Kirk, J.T.O. Light and Photosynthesis in Aquatic Ecosystems, 3rd ed.; Cambridge University: Cambridge, UK, 2011; p. 662. [Google Scholar]
  106. Alcoverro, T.; Manzanera, M.; Romero, J. Seasonal and age-dependent variability of Posidonia oceanica (L.) Delile photosynthetic parameters. J. Exp. Mar. Biol. Ecol. 1998, 230, 1–13. [Google Scholar] [CrossRef]
  107. Via, J.D.; Sturmbauer, C.; Schönweger, G.; Sötz, E.; Mathekowitsch, S.; Stifter, M.; Rieger, R. Light gradients and meadow structure in Posidonia oceanica: Ecomorphological and functional correlates. Mar. Ecol. Prog. Ser. 1998, 163, 267–278. [Google Scholar] [CrossRef]
  108. Marín-Guirao, L.; Bernardeau-Esteller, J.; Ruiz, J.M.; Sandoval-Gil, J.M. Resistance of Posidonia oceanica seagrass meadows to the spread of the introduced green alga Caulerpa cylindracea: Assessment of the role of light. Biol. Invasions 2015, 17, 1989–2009. [Google Scholar] [CrossRef]
Figure 1. The study area with a zoom on the sampling stations: POS-1m (black cross), POS-5m (red cross) and POS-10m (blue cross), at 1, 5 and 10 m depth, respectively.
Geosciences 11 00202 g001
Figure 2. Results and relative deviation standards (black histograms) of C-CEMS numerical models for the annual analysis of wave action on the bottom (WA), burial rate of the fine sediment (BR) and light attenuation (LA) in the three stations. The Percentages of Exceeding Thresholds (dottedhistograms) are reported in correspondence of each station.
Geosciences 11 00202 g002
Figure 3. PAR (Photosynthetic Active Radiation, µmol photons m−2 s−1) registered at POS-1m (black), POS-5m (red) and POS-10m (blue) during (A) POSI-Jun conducted on 7 June 2018 and (B) POSI-Aug on 9, 10 and 13 August 2018. Continuous lines represent the incident PAR time series, while histograms represent the percentage of incident PAR measured at canopy height.
Geosciences 11 00202 g003
Figure 4. RLCs curves of P.oceanica sampled during POSI-Jun. (A) Y(II) and (B) ETR as a function of PAR. Squared dots represent all the measures, while the continuous curvesare given by the median values and the fits calculated according to [75].
Geosciences 11 00202 g004
Figure 5. RLCs curves of P.oceanica sampled during POSI-Aug at POS-1m (black),POS-5m (red) stations. (A–C) Y(II) and (D–F) ETR as a function of PAR. Squared dots represent all the measures, while the continuous curve is given by the median values and the fit calculated according to [75].
Geosciences 11 00202 g005aGeosciences 11 00202 g005b
Table 1. Morphometric parameters of P. oceanica sampled during POSI-Jun at two sites, POS-1m and POS-5m, respectively. Parameters are classified as [77] and shown as representative for each site.
POSI-Jun
SiteANOVA
Type of LeafParametersUnitsPOS-1mPOS-5mp
Mean(±) SDMean(±) SD
Intermediatewidthcm0.7260.0250.9060.056<0.001
leaf blade lengthcm23.56.935.815.4ns
green tissue lengthcm23.36.735.315.1ns
brown tissue lengthcm0.2000.4470.5000.769ns
n. of leavesshoot−11.670.582.670.58ns
total leaf areacm2 shoot−128.4-88.3-
green leaf areacm2 shoot−128.1-87.1-
photosynthetic tissue%99.1-98.6-
Adultwidthcm0.7210.0390.9630.048<0.001
leaf blade lengthcm19.510.220.111.6ns
leaf base lengthcm2.240.322.740.76ns
total leaf length cm21.710.122.911.2ns
green tissue lengthcm16.88.720.111.6ns
brown tissue lengthcm2.734.60.0580.151ns
n. of leavesshoot−12.330.584.000.00
total leaf areacm2 shoot−132.5-77.6-
green leaf areacm2 shoot−128.0-77.3-
photosynthetic tissue%86.2-99.7-
Siten. of leavesshoot−14.670.588.000.00ns
total leaf areacm2 shoot−160.9-166-ns
green leaf areacm2 shoot−156.2-164-
photosynthetic tissue%92.2-99.0-
Table 2. Morphometric parameters of P. oceanica sampled during POSI-Aug at three stations, POS-1m, POS-5m andPOS-10m, at 1,5, and 10 m depth, respectively. Parameters are classified as [77] and shown as representative for each site. * Density is referred to August 2017.
POSI-Aug
SiteANOVA
Type of LeafParametersUnitsPOS-1mPOS-5mPOS-10mp
Mean(±) SDMean(±) SDMean(±) SD
Intermediatewidthcm0.7710.0710.9170.0900.9390.058<0.001
leaf blade lengthcm11.58.130.822.320.412.3<0.01
green tissue lengthcm11.07.330.822.320.412.3<0.01
brown tissue lengthcm0.4942.040.0000.0000.000.00ns
n. of leavesshoot−11.890.602.561.012.561.24
total leaf areacm2 shoot−116.9-73.7-49.1-
green leaf areacm2 shoot−116.2-73.7-49.1-
photosynthetic tissue%95.9-100-100-
Adultwidthcm0.7630.0870.9310.0790.9100.048<0.001
leaf blade lengthcm19.36.257.222.248.620.0<0.001
leaf base lengthcm2.080.553.720.663.840.81<0.001
total leaf lengthcm21.36.560.922.252.420.3<0.001
green tissue lengthcm16.45.252.720.246.021.4<0.001
brown tissue lengthcm2.862.884.498.432.548.24ns
n. of leavesshoot−11.890.603.562.074.891.45
total leaf areacm2 shoot−116.9-551-216-
green leaf areacm2 shoot−116.2-535-205-
photosynthetic tissue%95.9-97.1-94.8-
Siten. of leavesshoot−16.891.176.782.738.223.60<0.001
total leaf areacm2 shoot−189.5-625-268-ns
green leaf areacm2 shoot−159.0-609-254-
photosynthetic tissue%65.9-97.4-94.9-
* Densityshoot m−282.637.3−350.792.6−206.368.8
Table 3. Concentration of chlorophyll a (Chl a), chlorophyll b (Chl b), chlorophyll a+b (Chla+b) and total carotenoids (Cx+c) (µg cm−2) of P. oceanica, sampled during the campaigns POSI-Jun and POSI-Aug at three sites, POS-1m, POS-5m, andPOS-10m, during three different times (8:00,11:00 and 14:00 UTC).
CampaignSiteSampling Time(UTC)Parameters
Chl aChl bChl a + bCx+c
Mean(±) SDMean(±) SDMean(±) SDMean(±) SD
POSI-Jun POS-1m 1.540.470.570.162.160.640.440.10
POS-5m 1.800.510.680.212.530.740.570.11
POSI-AugPOS-1mEntire dataset1.070.480.400.211.680.800.400.19
8:001.160.370.480.181.700.540.370.15
11:000.830.190.290.181.370.350.380.14
14:001.420.980.510.302.291.750.500.40
POS-5mEntire dataset1.170.520.420.231.780.720.360.13
8:000.860.350.310.161.380.670.270.10
11:000.960.210.270.251.740.240.370.01
14:001.440.600.540.232.020.860.410.16
POS-10mEntire dataset1.020.170.420.081.530.240.270.09
8:001.140.220.450.141.720.300.350.08
11:000.870.120.410.41.340.190.170.05
14:001.030.010.410.051.530.040.290.03
Table 4. Photosynthetic parameters of P. oceanica sampled at POS-1m, POS-5m, and POS-10m during POSI-Jun and POSI-Aug campaigns. * ANOVA p < 0.05; ** ANOVA p < 0.01; *** ANOVA p < 0.001. a: ANOVA post hoc POS-1m-POS10m; POS-5m-POS-10m; b: ANOVA post hoc POS-1m-POS-5m; c: ANOVA post hoc POS-1m-POS-10m; POS0-5m-POS-10m; POS-1m-POS-5m; d: ANOVA post hoc POS-1m-POS-5m; POS-5m-POS-10m.
CampaignSiteSampling TimeFv/FmETRETRmaxαEkN
UTCMean(±) SDMean(±) SD
POSI-JunPOS-1m9:000.6330.06710.8 ***2.212.80.21758.865
POS-5m11:000.6730.03414.1 ***2.015.60.25960.259
POSI-AugPOS-1mEntire dataset0.715 *0.0257.49 ***1.4----
8:000.7060.0267.39 **b1.6310.3 **0.16263.564
11:000.726 ***a0.0247.31 ***c1.059.290.23439.759
14:000.7130.0217.84 ***d1.5311.30.18760.462
POS-5mEntire dataset0.722 *0.02711.2 ***1.9----
8:000.7200.03111.0 **b2.512.80.23454.665
11:000.728 ***a0.02612.0 ***c1.516.30.26062.762
14:000.7190.02510.6 ***d1.413.20.28246.965
POS-10mEntire dataset0.698 *0.0766.97 ***2.93----
8:000.7250.0209.42 **0.911.20.23747.065
11:000.640 ***a0.1083.84 ***c2.245.310.12642.165
14:000.7290.0197.66 ***d1.9610.00.19351.965
Publisher’s Note: MDPI stays neutral with regard to jurisdictional claims in published maps and institutional affiliations.

