
Comparison of Petrophysical Properties of Porous Rocks Using NMR, Micro-CT, and Fluid Flow Simulations


Peter Cook Centre for CCS Research, School of Geography, Earth and Atmospheric Sciences, The University of Melbourne, Parkville, VIC 3010, Australia
*
Author to whom correspondence should be addressed.
Geosciences 2021, 11(12), 500; https://doi.org/10.3390/geosciences11120500
Submission received: 8 October 2021
/
Revised: 1 December 2021
/
Accepted: 6 December 2021
/
Published: 8 December 2021
(This article belongs to the Section Hydrogeology)
Abstract
:Micro-computed tomography (micro-CT) is increasingly utilized to image the pore network and to derive petrophysical properties in combination with modelling software. The effect of micro-CT image resolution and size on the accuracy of the derived petrophysical properties is addressed in this study using a relatively homogenous sandstone and a heterogenous, highly porous bioclastic limestone. Standard laboratory procedures including NMR (nuclear magnetic resonance) analysis, micro-CT analysis at different image resolutions and sizes and pore-scale flow simulations were used to determine and compare petrophysical properties. NMR-derived pore-size distribution (PSD) was comparable to the micro-CT-derived PSD at a resolution of 7 µm for both the rock types. Porosity was higher using the water saturation method as compared to the NMR method in both rocks. The resolution did not show a significant effect on the porosity of the homogeneous sandstone, but porosity in the heterogeneous limestone varies depending on the location of the sub-sample. The transport regime in the sandstone was derived by simulations and changed with the resolution of the micro-CT image. The transport regime in the sandstone was advection-dominated at higher image resolution and diffusion-dominated when using a lower image resolution. In contrast, advection was the dominant transport regime for the limestone based on simulations using higher and lower image resolutions. Simulation-derived permeability for a 400 Voxel3 image at 7 µm resolution in the Berea sandstone matched laboratory results, although local heterogeneity within the rock plays an integral role in the permeability estimation within the sub-sampled images. The simulation-derived permeability was highly variable in the Mount Gambier limestone depending on the image size and resolution with the closest value to a laboratory result simulated with an image resolution of 2.5 µm and a size of 300 Voxel3. Overall, the study demonstrates the need to decide on micro-CT parameters depending on the type of petrophysical property of interest and the degree of heterogeneity within the rock types.
1. Introduction
Fluid flow and multiphase flow in porous media play an important role in many natural and engineered subsurface processes including contaminant transport, hydrocarbon production and CO2 injection and migration. A thorough characterization of rock properties and their variability is required to predict fluid flow in geological formations. Core plugs are commonly used to determine petrophysical properties of representative rock types and the respective results support the development of geological and fluid flow simulation models.
A range of methods have been developed to determine rock properties. One such laboratory method is nuclear magnetic resonance (NMR) which is a non-destructive method and uses an external magnetic field to create a dipole moment within the sample. The amplitude of the dipole moment is directly proportional to the number of hydrogen atoms present within the sample and thus can be used to measure the volume of the pores filled with the fluid [1]. This is effectively the water-saturated pore network equivalent to the connected porosity in case of water saturation. In addition, the NMR spin-lattice relaxation decay can also be used as a tool for the quantification of pore geometry [2,3]. This non-destructive analysis is increasingly seen as superior compared to traditional methods such as mercury intrusion capillary pressure (MICP), mainly for two reasons: firstly, MICP only estimates the size of the pore throats in the pore network and, secondly, MICP is destructive for the sample; therefore, it cannot be used for further analysis. Several studies have compared the results from an NMR experiment to MICP and show good agreement [4,5,6]. NMR-derived porosity also included microporosity with pores with a diameter less than 3.6 nm, which was beyond what could be achieved from MICP [6].
Numerical simulations complement laboratory analysis as they predict the fluid flow behavior over much larger temporal and spatial scales than observed in the laboratory. Pore-scale modelling is based on a realistic representation of the pore network derived from high-resolution 3D imaging. It avoids assumptions required in continuum scale models including properties such as the effective mineral surface area and a homogenous fluid flow field. Rock types of any geometry and size in the range of mm3 to cm3 are placed in a micro-CT scanner to extract high-resolution images to determine the structural properties of the sample [7,8]. Micro-CT is the one technology which is non-destructive and can produce reliable information of porous media in 3D. This information is of importance for subsurface flow and transport phenomenon. Processes taking place at the pore scale where individual grains and pores and their interfaces can be resolved is critical to understanding several physical and chemical processes. High-resolution image analysis in combination with MICP has been effectively used to quantitatively estimate the porosity and variations in the grain size [9]. The 3D images can be further used for flow, transport and reactive transport simulations either using direct pore-scale simulations [10,11,12,13,14,15,16,17,18,19,20,21,22,23,24,25,26,27,28] or using pore-network modelling which is efficient for very large models and approximates the pore structure [29,30,31,32,33,34].
Numerical simulations at the pore scale pose several challenges that must be addressed to correctly quantify the complex processes taking place at the micrometer scale. One of the first challenges is the correct representation of a porous media. Due to the nature of acquiring high-resolution images from a rock type, the images measure only a few millimeters in size because of two reasons: Firstly, the pores and grains need to be imaged at an optimum resolution and, secondly, it becomes impractical to work on very large datasets. Therefore, this analysis is conducted on sub-samples much smaller than a common core plug, which is an important and possibly limiting pre-requisite for pore-scale simulations. Another challenge is the limited field of view of benchtop micro-CT systems.
The concept of the representative elementary volume (REV) was developed to account for small-scale heterogeneity in petrophysical properties. The REV is defined as the sample size beyond which variations in the property of interest are insignificant [35]. REV has been the focus of many studies in the past [15,36,37,38,39,40,41,42,43,44]. Due to technical limitations, there is a trade-off between the image resolution and the size of the sample that can be scanned. There have been several studies which demonstrated how differences in the image resolution affects their estimated porosity and permeability of the sample [7,39,45,46,47].
A direct comparison of properties determined from digital images to properties determined using laboratory techniques would be an ideal approach to better understand the limitations of the digitally obtained data from smaller sub-samples. Research has also shown results of pore characterization consistent to MIP measurement on sandstone samples by calibrating the NMR data with micro-CT obtained equivalent diameter data [48].
The focus of this paper is to determine and compare petrophysical properties using different techniques including micro-CT imaging for a homogeneous and a heterogeneous natural rock type. This is achieved by using a combination of laboratory analysis, digital image analysis and numerical modelling. The porosity, permeability, and the pore size distribution (PSD) of the samples were determined using laboratory techniques. The respective results were then compared to the results derived from the sub-samples of digital images acquired at different resolutions and image size using the micro-CT scanner and using the images for numerical modelling. This led to a better understanding of the variation in results for the same rock type but using different methods.
In this paper, firstly, the methods used for determining the porosity, permeability and pore-size distribution using standard laboratory techniques, NMR and micro-CT imaging are described. The results obtained from these analyses are compared and discussed in the following sections.
2. Materials and Methods
2.1. Rock Types
The following two rock types were analyzed: 1. Berea sandstone (Figure 1a) from Ohio, USA, which is a quartz sandstone with a permeability of 133 ± 39.2 mDarcy [49] and a porosity of 20.0%. Permeability for the Berea sandstone was measured using our in-house multiphase core flood system by DCI test system corporation by recording ΔP values at different flow rates injection Milli Q water through the core. A core measuring 30 cm in length and 3.81 cm in diameter cut from the same batch of the sandstone was used for the measurement. Berea sandstone is a well characterized [50] siliciclastic rock and it is widely used in experiments supporting the petroleum industry. The bulk mineral composition includes quartz, alkali feldspar, plagioclase, and some clay minerals such as kaolinite and smectite/illite and a subvertical bedding is seen on the rock. 2. Mt. Gambier limestone (Figure 1c) from South Australia, Australia, a bioclastic limestone with a permeability of approximately 6.67 Darcy [51] and a porosity of 48.6%. A ΔP of zero was recorded in our multiphase core flooding machine for the Mt Gambier limestone therefore permeability could not be determined. Instead, a laboratory measured value calculated by Andrew and colleagues [51] was used for the comparison in this paper. The Mt. Gambier limestone is of Oligocene age and has a very irregular pore space with very high porosity and permeability (Figure 1d). It consists of 100% calcite [51]. Porosity (Appendix A) and permeability were analyzed according to standard procedures.
2.2. NMR Porosity and Pore-Size Distribution
NMR is used to detect fluids within a rock core. An NMR experiment is conducted with the sample placed in a magnetic field and excited with short pulses of radio frequency (RF). The response signal or echo is recorded which is generated by the nuclei present within the fluid after each RF pulse. The response signal is logged and recorded as a train of echoes which determines the type of fluid and the environment it is set in. This fluid decay relaxation time is called . For a single pore, the magnetization decay can be written as a function of the relaxation time [52]:
The total relaxation is defined as [53]
Here, is the surface relaxivity, is the surface area and is the volume of the pore. Surface relaxivity is dependent on the lithology of the sample. The surface relaxivity is the constant of proportionality between the surface to volume ratio of the pore and the surface relaxation time measured from NMR. Equation (2) relates the total relaxation time to the interaction of the fluid with the pore walls and their distance from the pore wall.
Berea sandstone and the Mt. Gambier limestone cores with a diameter of 38.7 mm and a length of 50 mm were saturated for 24 h in a 0.1 M brine solution. NMR relaxation measurements were performed using a benchtop spectrometer MARAN from Resonance Instruments at the National Geosequestration Laboratory (CSIRO) located in Perth, Western Australia. The experiments were conducted at a temperature of 25 °C. The instrument was set to operate at a frequency of 1.8MHz. The Carr-Purcell-Meiboom-Gill [54,55] was used to calculate the relaxation time . Both the cores were wrapped in paraffin plastic to minimize the loss of water content during the measurement.
Before the samples were run, the NMR instrument was calibrated with 15 mL of the 0.1 M brine. Separate calibrations had to be performed for the two rock types as both have different mineralogy and petrophysical properties. The raw signal obtained by the bulk fluid is analyzed and the magnitude of the initial signal is related to the volume of the fluid with the knowledge that it corresponds to the total amount of fluid in the rock type (Appendix B). The bulk fluid was scanned 8 times at a frequency of 1.8 MHz and 8000 data points were acquired measuring the relaxation time distribution from the fluid. The relaxation amplitude from the bulk fluid was multiplied by a factor of 8, as the number of scans for the Berea sandstone was 64 and the number of scans for the bulk fluid sample was 8. A similar approach was used for the Mt Gambier limestone. The bulk fluid was scanned 8 times at 1.8 MHz measuring the relaxation. Due to larger pore sizes and a higher porosity, the Mt. Gambier limestone also holds a lot more saturation fluid within its pores, thus the need for recalibration. The signal from the bulk fluid was multiplied by a factor of 2 as the number of scans for the Mt. Gambier limestone was 16.
Pore-Size Distribution from NMR Data
For converting the relaxation time data to pore size distribution, several models have been proposed [56]. Either the pore space is assumed to be an interconnected cylinder (surface to volume ratio is equivalent to ), or the pores are assumed to be spherical (surface to volume ratio is ); here, is the radius of the pore.
Equation (2) defines the relationship between the relaxation times measured by NMR and the volume and surface area of the pores, which can be re-written as
Here, is the radius of the pore, the relaxation time measured from the NMR experiment and when an interconnected cylindrical model and for a spherical model. The value used for surface relaxivity for Berea sandstone was = 21 µm/s [57], for Mt. Gambier limestone, = 11 µm/s. This value is not specific to the Mt. Gambier limestone but derived from a carbonate rock type [57].
2.3. Porosity and Pore-Size Distribution from Micro-CT Imaging
Micro-CT imaging is also used to interpret the PSD and porosity of the two rock types. Two smaller subsamples in the shape of cubes measuring approximately 0.5 cm3 and 1 cm3 in all sides was cut out from Berea sandstone and the Mt. Gambier limestone cores for scanning in the micro-CT with different settings and resolutions. The resolution of a scan defines the smallest feature that can be resolved in the digital image and is dependent on several factors including the size of the samples, distance from the detector, power of the X-ray source and the material type of the samples. Our inhouse micro-CT at the University of Melbourne, a GE Nanotom M, was used for scanning of the rocks. A summary of the sample sizes and the parameters used for obtaining the images is presented in Table 1.
The X-ray beam energy was optimized for obtaining a high contrast between the different phases found in the porous media, in this case, minerals and air. A diamond target was used for all the scans. Images are acquired as a series of 2D radiographs obtained from the scan which are maps of X-ray attenuation of materials in the sample and are reconstructed to form 3D volumes (Figure 2a). After the reconstruction, the data is imported into the image processing software Avizo for further processing. Several artefacts can result from the whole process of acquisition to reconstruction such as beam hardening effect and ring artefacts. Numerical algorithms are used to correct for such artefacts. No filters were used for the reconstruction of the 3D volume.
The first step after image acquisition is the binary segmentation of the greyscale image (Figure 2b) where 0 represents the pore space and 1 represents the minerals. After segmentation, porosity (Equation (4)) is the ratio of the pore voxels to the total numbers of voxels, and it can be estimated as:
where, is the porosity, is the number of voxels assigned to the pore space, and is the number of voxels assigned to the mineral phases. Four sub-sections in the shape of cubes were extracted from different volumes from both the rock type at the resolutions of 2.5 µm measuring 200 Voxel3 (0.125 mm3), 300 voxel3 (0.42 mm3), 400 voxel3 (1 mm3) and 500 voxel3 (1.95 mm3) and at 7 µm measuring 200 Voxel3 (2.74 mm3), 300 voxel3 (9.261 mm3), 400 voxel3 (21.9 mm3) and 500 voxel3 (42.8 mm3), their PSDs and porosity were computed.
For determining the PSD of the sub sections, pore network models (PNM) are used for the topological equivalent representation of a porous media. A PNM was generated for all the subsections, which allows a complex porous rock to be represented using simpler shapes in the form of balls and sticks representing pores and pore connections without losing out on the original topological properties of the rock. This is carried out by computing watershed lines on the binarized image. This method is a high-level combination of the watershed, distance transform, and numerical reconstruction algorithm [58,59,60,61]. The first step is constructing a chamfer distance map, which represents the minimal distance of a voxel from the pore boundary. The higher intensity represents bigger pores, and the low intensity represents smaller pore. This distance map is used as a priority map input for the watershed process. The most inner areas of the pores, which are the maxima areas in the distance maps are used as markers in the watershed process. Avizo’s separation module is used for this analysis. The output from this module is a separated pore image with a unique label assigned to each pore (Figure 2c). This separated image is taken as an input for constructing the PNM. Two main parameters that are input are: (1) the type of connectivity for processing adjacent voxels, which defines the minimum number of voxels with at least one common edge that are considered connected (); (2) the marker extent, which defines a contrast factor to reduce the number of seeds for the watershed algorithm (). Both these parameters are chosen based on visual feedback from the division of pores into separate entities to be used for the construction of the PNM.
Avizo’s pore network module is used for the construction of the PNM (Figure 2d), which used the separated image obtained from the previous step. When using the watershed method for constructing pore-network models, the watershed fills the pores starting from the higher intensity regions and enlarges it towards the boundary of the pores. The throats of the network are defined by the locations where the fluid from two different pores converge. Subsequently, the volume of the pores and the surface area of the throats are calculated. The ideal pore is a sphere with an equivalent volume of the irregular shaped real pore, and the ideal throat is a cylinder with an equivalent surface area as the irregular shaped real throat. The output from this analysis was categorized into known bin ranges and frequency of the pore and throat size distributions were quantified [61]. Pores can be irregular in shape, so the total volume of all the voxels in a pore cluster results in estimating the total volume of the irregular shaped pore clusters. The model considers the volume of the pore clusters of voxels being a perfect sphere, and the equivalent radius is calculated as
where is the equivalent pore volume size of the sphere. The idealized pores are centered according to the actual position of the real pores. The output from the pore-network model consists of the number of pore and throats in the rock and their equivalent radius [61].
2.4. Pore-Scale Flow Simulations
At low Reynold’s number (, the steady state Stokes lubrication equation defines a laminar flow for an incompressible single-phase fluid in a porous media [62].
Here, is the viscosity , is the fluid velocity () and is the pressure gradient () and is a characteristic length scale of the flow. For determination of the viscosity, a U-tube capillary viscometer is used, and the time required for the level of liquid to drop from one mark to the other is measured using a stopwatch. An average of three readings is used. Viscosity is calculated as , where the density of water ; constant of the viscometer ; and the flow time . The law of mass conservation for an incompressible fluid is defined as:
The model domain consists of the water saturated pore space , occupied entirely by a single liquid phase, and faces of the model where boundary conditions are assigned , the permeability is calculated in the left-right direction (Appendix C). Equations (6) and (7) are discretized in the pore space of the domain using a finite element method which gives the velocity vector on each elemental node of the finite element mesh which is derived from the pore space.
The domain boundary consists of an inlet, an outlet, and no flow boundaries. An inlet boundary condition is set on the left boundary and an outlet boundary is set on the right boundary (Equations (8) and (9)). A pressure difference Δ = 100 Pa is applied between the left and the right boundary with atmospheric pressure on the right boundary. The remaining faces of the model are assigned as no slip boundaries.
The pore-scale flow simulations were used to further characterize the two rock types by analyzing their velocity distribution, Pé number (advection/diffusion rate) distribution and permeability with changing image size and resolutions. A total of 16 flow simulations were run on the two rocks with scanning resolutions of 2.5 µm and 7 µm and varying image sizes of 200, 300, 400 and 500 voxel3. Each imaging 3D dataset was converted into a finite element mesh comprising of tetrahedral elements for defining the pore space. The mesh properties are listed in Table 2.
For all the simulations, a static solver was used which solved for the dependent variable’s velocity () and pressure (). The direct linear system solver uses MUMPS (multifrontal massively parallel sparse direct solver). The accuracy of the solution is checked using the automatic check error estimate, in which the main solver is responsible for error management. The solver continues iterating until the step size is smaller than about 2.2 × 10⁻¹⁴.
3. Results
The results are divided into three sections, firstly the NMR results are presented, then the results from the micro-CT are presented and lastly the pore-scale flow simulation results are given.
3.1. Porosity Measurement from NMR
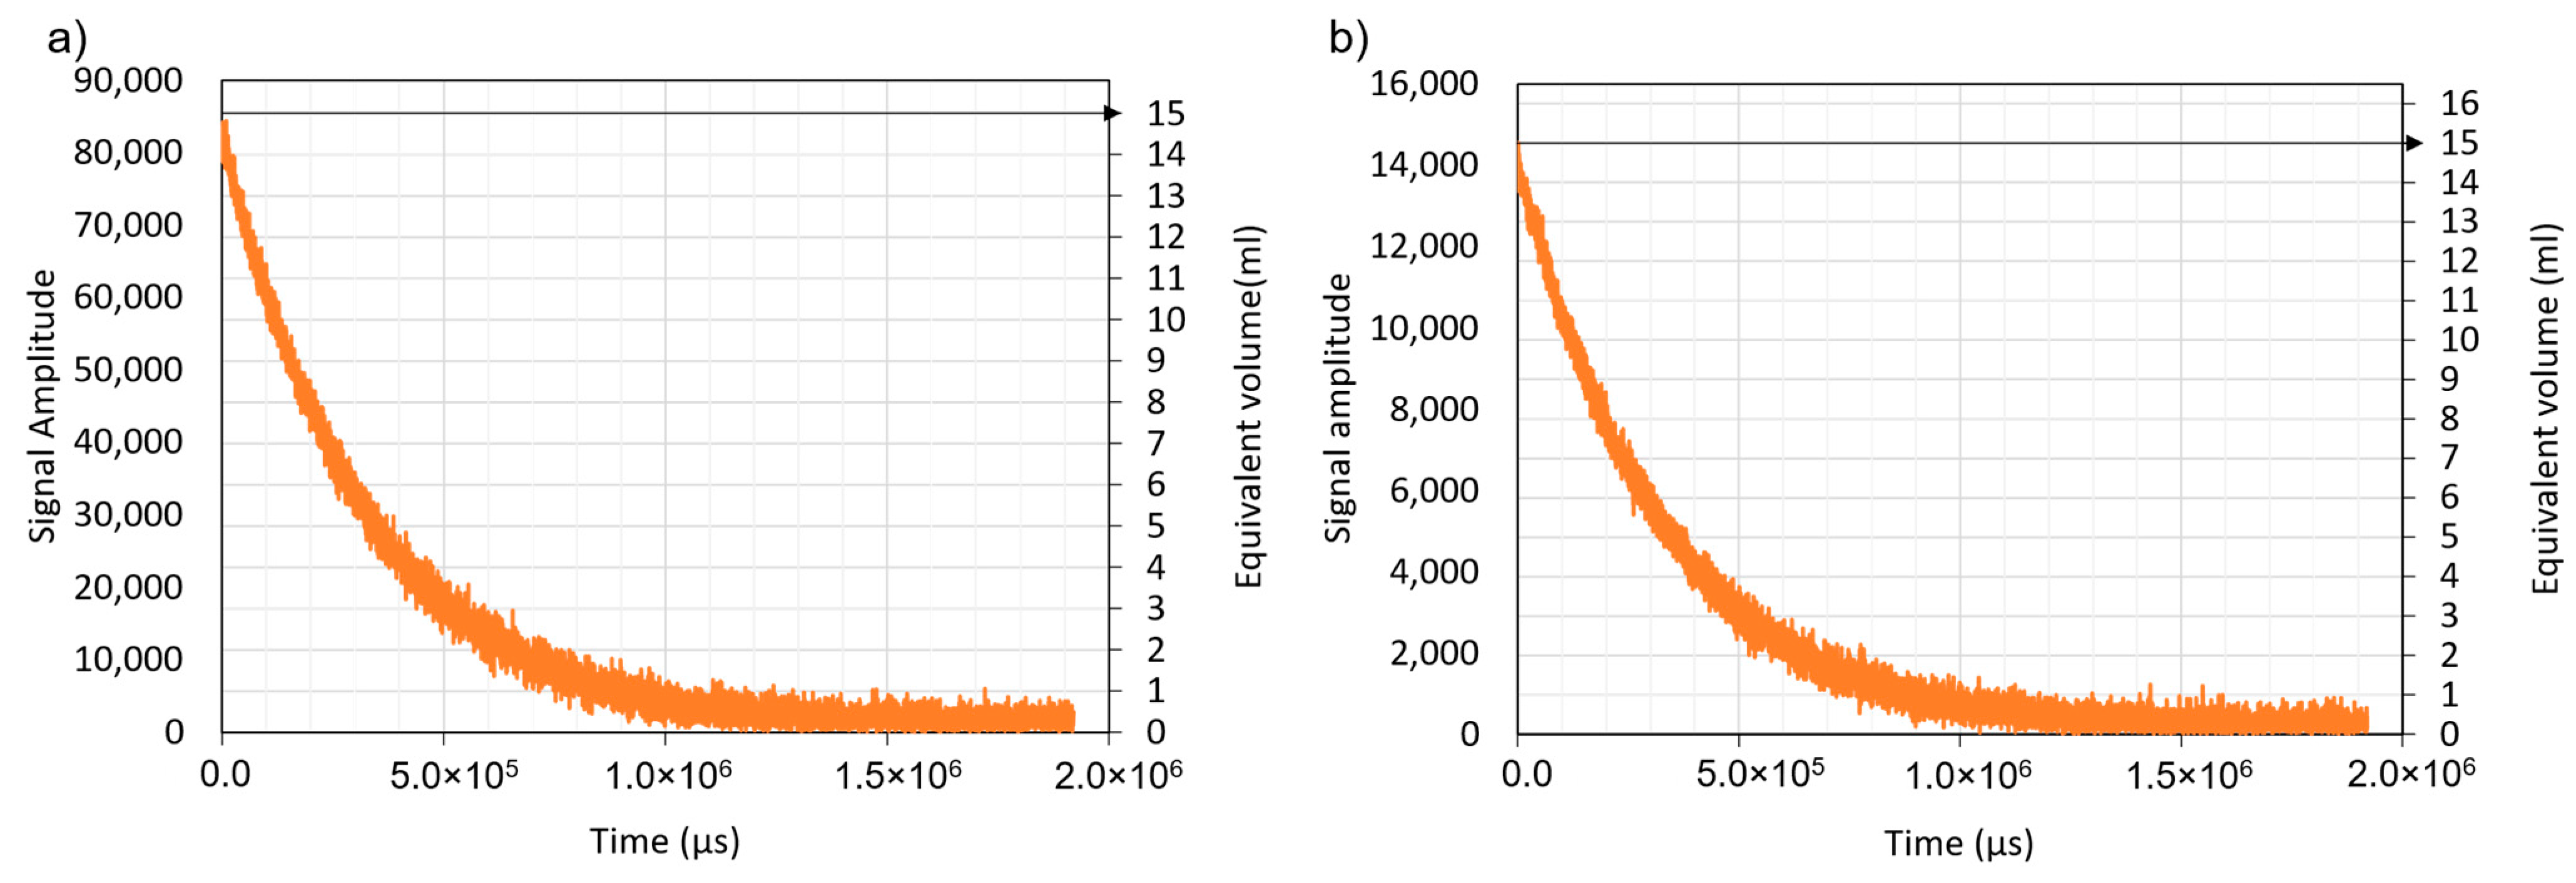
The calibration signal from 15 mL brine (Appendix B) is associated with the frequency obtained from the Berea sandstone and the equivalent volume was interpolated. Figure 3a shows the raw NMR signal from the Berea sandstone as a series of spin-echo amplitudes. The highest signal in Figure 3a corresponds to the total amount of fluid in the sample equal to 9.5 mL. The core has a bulk volume of 57.004 mL, so the total porosity of the Berea sandstone sample based on the NMR analysis is calculated as 16.6%. Figure 3b plots the mathematical inversion using a best curve to convert the spin-echo decay to a distribution of . The right axis of Figure 3b plots the porosity distribution from each measurement point within the sample.
Similar to the sandstone, the calibration signal from 15 mL brine is associated with the war signal from the limestone and the total water content in the sample was calculated as 25.8 mL. Figure 4a plots the raw signal from the limestone and the equivalent volume. Given the bulk volume of the sample was equivalent to 57.004 mL, the porosity of the Mt. Gambier limestone sample was 45.2%. Figure 4b plots the inverted data using a best curve from the spin-echo decay to a distribution of . The right axis of Figure 4b plots the porosity distribution from each measurement point within the limestone sample.
3.2. Interpretation of Pore-Size Distribution from NMR Data
To calculate the pore-size distribution for the two rock types from the experimental NMR data, the pores were assumed to be a network of interconnected cylinders and a surface to volume ratio of is used in the model where is the radius of the pore. Equation (3) is used to interpret the resulting bins into pore sizes of the rock types. Figure 5 plots the distribution of the pores in the rock type as inferred from the amplitude distribution.
For the Berea sandstone (Figure 5a), two major peaks were observed in the PSD. The first peak corresponds to a low number of pores in the micro-to meso-porosity range between 0.01 and 0.5 µm and the second, much larger peak shows pores with a radius between 5 and 21 µm. The resulting distribution shows an average pore size of 7 µm and a maximum pore size of 21 µm.
For the Mt. Gambier limestone (Figure 5b), three peaks in the PSD were observed: The largest peak corresponds to most pores in the sample with a pore radius in the range of 10–75 µm. The sample also contains small amounts of pores with a radius range of 0.5–5 µm and 0.01–0.05 µm. An average pore size of 19 µm and a maximum pore size of 75 µm were derived.
Figure 6 shows a comparison between the spectrum of the PSD using the interconnected tube and the spherical models for the two rock types. For both the rock types, the spherical model assumption shifts the spectrum to the right-hand side of the graphs, thus increasing the calculated average pore radius and the maximum pore radius in the distribution when compared to the interconnected cylindrical model assumption.
The surface relaxivity of a rock type depends on its lithology and plays an integral role in the determination of the pore-structure geometry as interpreted from an NMR experiment. The surface relaxivity represents the strength of the relaxation on the surfaces of the pores and depends on the properties specific to the surface of the solid and the fluid in the pores. As Berea sandstone has long been the sample of choice for various experiments, the surface relaxivity value is reported as = 9.8 µm/s [63], = 11 µm/s [64], = 21 µm/s and = 26 µm/s [57]. The method used, to obtain the adsorption–desorption isotherm was nitrogen adsorption and the method used to calculate the specific surface area therefrom is the BET-method. Figure 7 presents the PSD using different values of surface relaxivity found in the literature for the Berea sandstone. A similar comparison could not be achieved for the Mt Gambier Limestone, as it is not studied as well as the Berea sandstone in the literature. It is observed that the pore-size distribution shifts towards larger pore sizes with an increasing value of , thus increasing the average and the maximum pore-size derived from the analysis.
3.3. Pore-Size Distribution and Porosity from Micro-CT Images
The porosity values as measured from the micro-CT at the two resolutions and compared to the measured values form other techniques is presented in Table 3. For both the rock types, porosity values measured with water saturation method were higher as compared to NMR. For the Berea sandstone, the resolution did not have a great effect on the porosity measured from the digital images at both the lower and higher resolutions with values within 10% of the water saturation porosity. However, for the heterogeneous limestone rock type, even though the porosity remains relatively unchanged with resolution and within 10% of the water saturation porosity, there is potential for outliers and misrepresentation of the rock type porosity depending on the place from where the subsection is selected.
The pore-size distribution (PSD) from the micro-CT scans of the Berea sandstone at two different resolutions is compared to the results of the NMR experiment in Figure 8. The micro-CT can only resolve the pore sizes greater than the resolution of the scan; therefore, the image-based PSD does not capture the pores below the image resolution. At 2.5 µm, the average pore radius of 4 µm and a maximum pore radius of 9 µm is measured and at 7 µm, an average pore radius of 6 µm and a maximum pore radius of 18 µm is calculated.
Figure 9 presents the PSD from the NMR experiment compared to the image-based PSD for the Mt. Gambier limestone. Again, micro-pores are not accounted for in the PSD plot extracted from the image-based analysis from both the resolutions. At 2.5 µm, the average pore radius of 3.7 µm and a maximum pore radius of 45 µm were measured. At 7 µm, the average pore radius of 19 µm and the maximum pore size was 69 µm was measured.
3.4. Characterisation Using Flow Simulations
For all the 16 pore-scale domains (see Section 2.3), flow is simulated in the X-direction (Appendix C). A pressure difference of 100 Pa is imposed across the domains with atmospheric pressure at the outlet boundary, the velocity and pressure fields are computed. The pressure and velocity maps for the Berea sandstone and the Mt. Gambier limestone showing the distribution of the pressure between the inlet (left) and the outlet (right) boundaries can be seen in Appendix C.
It should be noted that the velocity flow field plot here is simulated on the connected pore space of the porous media. The velocity field distribution, Péclet number distribution, and the permeability variations are analysed for changing resolution and image sizes.
3.4.1. Velocity Field Distribution
In order to determine the effects of variable imaging resolution and images sizes on the fluid velocity field, the fluid velocity is mapped for areal proportions of a range of bin sizes representing the velocity on 10 slices along the flow direction (X-direction). To achieve this, 10 equally distanced slices are extracted from the 3D domain with elemental information containing fluid velocity, area, and cell ID. Next, for each slice, the distribution of the fluid velocity is calculated on the entire slice by using a set bin range and calculating the histograms. A function is used which only sums the area of the cells ( where the velocity ( satisfies the bin range (
Once is calculated, a porosity for each bin range is calculated as the ratio of the calculated area to the total area of the slice. This step is repeated for all the slices and an average across all the 10 slices is calculated for each simulation for each bin range.
This analysis was repeated for all the image resolutions and image sizes for both the Berea sandstone and the Mt. Gambier limestone. The distribution of the fluid velocity is presented in Figure 10a for the Berea sandstone and in Figure 10b for the Mt. Gambier limestone. The dotted lines representing distribution at the higher resolution of 2.5 µm and the solid line representing distribution at the lower image resolution 7 µm. It is observed that for all the image sizes, the higher resolution has a higher velocity range and areal proportion as compared to their corresponding image sizes at the lower resolution. There is also a bimodal distribution with some proportion of the area with zero velocity. At 7 µm, 19.29% of the area has zero velocity for the 500 voxel3 image which reduces to 0.02% for the 200 Voxel3 image. The zero-velocity areal proportion remains relatively small (1% to 5%) for all image sizes with a higher image resolution.
For the Mt. Gambier Limestone, the velocity range and the areal proportion is lower for all the image sizes at the higher image resolution as compared to the lower resolution in Figure 12b. This is the opposite to what was observed for the sandstone rock type. The highest velocity range is also an order of magnitude higher (10−3–10−2 m/s for most of the images) compared to the sandstone. At 7 µm, the area of the pore network with zero velocity decreases from 15% in the 500 voxel3 image to 2% in the 200 voxel3. The zero velocity areas in the higher resolution images remain insignificant for all the image sizes.
3.4.2. Péclet Number (Pé) Distribution
The Pé number calculates the ratio of the advective and the diffusive transport in a system . In this study, the average pore size is the characteristic length . For the Berea sandstone, = 7 µm and for the Mt. Gambier limestone = 19 µm. The value of the diffusion coefficient is taken as .
The Pé number for the Berea sandstone at 2.5 µm and 7 µm is given in Figure 11a. At 7 µm, a much larger area (67–80%) is dominated by diffusion at the different image sizes. In contrast, a comparatively small area (19–35%) is diffusion dominated at 2.5 µm images.
Figure 11b presents the areal proportion of the Pé number for the Mt. Gambier limestone and at both the resolution of 7 µm and 2.5 µm. More than 80% of the area is advection dominated regardless of the image size.
3.4.3. Permeability Analysis
The single-phase permeability can be calculated using Darcy’s Law [65]:
Here, is the absolute permeability (m2), is the flow rate (m3 s−1), is the fluid viscosity (Pa s), is the pressure difference (Pa) between the inlet and the outlet of the domain, is the cross-sectional area (m2) of the domain and is the length of the domain.
The porosity and the permeability for all the 16 digital images is calculated and reported in Figure 12a,b. For the Berea sandstone, the lowest permeability is 167 millidarcy for the 400 voxel3 image at 7 µm with a porosity of 19.13%. The highest calculated permeability is 1.45 Darcy for the 200 voxel3 image at 2.5 µm with a porosity of 20.83%. Permeability values calculated from images with the 2.5 µm resolution are higher than the values derived from the 7 µm resolution.
For the Mt. Gambier limestone, the lowest calculated permeability is 10.12 Darcy at an image size of 300 voxel3 and a resolution of 2.5 µm. The highest calculated permeability is 157.3 Darcy at an image size of 300 voxel3 and an image resolution of 7 µm. The calculated permeability of the limestone is higher for all the images at the lower image resolution (7 µm) which is opposite to what was observed for the Berea sandstone rock type.
4. Discussion
The combination of non-destructive NMR, micro-CT imaging, pore network and fluid flow modelling allows us in principle to derive important petrophysical properties of porous rocks. The volume of investigation in micro-CT studies is typically very small, here we used cubic samples with an edge length of 1 cm and 0.5 cm, such small samples might be below the size of the representative elementary volume (REV). In addition, the micro-CT image can be acquired at different sizes and resolutions, which affect the petrophysical values derived from the digital image data.
Since both, the Berea sandstone and the Mt. Gambier limestone have microporosity below the micro-CT resolutions used in this paper, that part of the pore-size distribution is entirely missing from the digital images at both the resolutions. The micro-porosity missing from the digital images might not be isolated and could potentially impact the permeability estimation. In some cases, a significant portion of the sub-resolution microporosity would not contribute to the permeability calculation if the flow is governed by the larger pores. In other cases, the sub-resolution pores even though do not significantly affect the porosity, might provide key connectivity, and hence change the permeability of the rock. It is also relevant for different processes such as diffusion and surface reactions. There have been several studies which compared the digital image data to laboratory techniques. A comparative study found that for sandstone rock type at lower resolutions (~5.38 µm), image-based throat radii was comparable to the throat radii distribution obtained from MICP experiments but even at higher resolution (2.56 µm) the microporosity part of the distribution was completely missing from the limestone rock type [45]. Research has also shown that for a well-connected porous rock such as the Berea sandstone, a resolution of 5.96 µm is enough to study the fluid flow through the sample [66]. Another study concluded that a resolution of 5–10 µm was enough to determine the flow properties in high permeability sandstones [46]. These findings are consistent to the results presented in this paper with a comparable distribution at a resolution of 7 µm for the rock types.
Pore-scale modelling involves construction of the finite element mesh derived from the micro-CT images. This conversion for natural rocks requires using a large number of elements for proper representation of the pore space. This limits the size of the pore scale domain as a very high number of elements makes the simulations too computationally expensive. An increased computation power would potentially increase the scale of 3D simulations by use of bigger datasets for simulating flow and transport, as the image sizes that can be achieved with the current hardware resources outstrip the computational capacity of normal workstations. The velocity field distribution from the pore scale modelling for the two rocks at different resolutions and image sizes provides quantitative insight into the heterogeneity of the flow field. The image resolution was a major influence on the flow field of the Berea sandstone. The areal proportion of higher flow velocity increased as more features of the sandstone were resolved at the higher resolution, this improved the connectivity within the pore space. For the Mt. Gambier limestone, the velocity distribution was similar at both image resolutions for the larger (500 and 400 voxel3) image sizes. At smaller image sizes, however, large differences in the velocity field were observed, which is attributed to an insufficient REV.
The calculation of the Péclet number for the homogeneous Berea sandstone shows a switch from a predominantly diffusion-controlled regime at lower resolution to a predominantly advection-controlled regime at higher resolution at a given pressure difference. Smaller pores are more clearly imaged and might show a higher degree of connectivity at the higher image resolution. Consequently, a larger volume is advection-dominated. For the Mt. Gambier limestone, advection remains the dominating transport process at both the lower and the higher resolutions at the given pressure gradient. This is due to the larger pore sizes and much higher connectivity of the rock which do not restrict the flow to any part of the pore geometry. This is significant for reactive transport models where heterogeneous dissolution/precipitation would change the evolving pore structure dependent on the local flow regime within a pore space.
Porosity is derived based on the micro-CT images and compared to the NMR and the water saturation method data. There was a difference in the estimated porosity from NMR and triple weighting water saturation methods. A potential reason for this could be that the rock types were weighted three times immediately after they were taken out of the vacuum. In contrast, some time was required between the rock types being taken out of the vacuum and put in the NMR instrument for analysis; though they were completely saturated with fluid and wrapped in paraffin paper to minimise loss of fluid during that time. Nevertheless, some loss of fluid from the pores of the samples could have occurred before samples were run on the NMR instrument. For the Berea sandstone, the micro-CT porosity is within 10% of the porosity measured from the water saturation method. The porosity remains relatively un-changed at the two resolutions with a slight increase in the higher resolution images as more features are resolved and the pore geometry is further revealed. For the highly heterogeneous bioclastic Mt. Gambier limestone as well, the porosity remains within 10% of the laboratory measured values but there are outliers within the sampled images (300 Voxel3 at 2.5 µm and 300 Voxel3 at 7 µm). The micro-CT porosity fluctuations illustrate the high dependence on the local heterogeneity of the limestone as only small sample volumes were investigated.
The permeability measurement for the two rock types is also compared at the two resolutions and at different image sizes. For the Berea sandstone, the simulated permeability increases with the increased resolution as more features are detected in the higher resolution image leading to more connected flow pathways. For the sandstone rock type, the simulation-derived permeability at 7 µm resolution are much closer to the laboratory measured value with an image size of 400 voxel3 simulating the closest permeability value. The higher resolution makes the detection of pores and their connectivity much more accurate but reduces the field of view. In this study, the higher resolution led to an increased permeability for the sandstone but as the field of view is decreased, the results are overestimated when compared to the core derived results. At the core scale, the pores and pore connectivity resolved by the high-resolution images might be forming a small part of the major flow pathway but are not representative of the fluid flow within the core. The flow path is more accurately represented with a lower resolution and a larger field of view. The other image sizes at 7 µm resolution result in much higher permeability, for example, a 500 Voxel3 image resulted in a permeability four times higher than the laboratory measured value. This can be attributed to the local heterogeneity within the rock type which can change the simulated permeability depending on the simulation area selected from the digital image. For the Mt. Gambier limestone, the permeability simulations showed very large variations at different image sizes at 7 µm image resolution. There is also a great deal of inconsistent variation in the permeability between the higher resolution images. The simulation-derived permeability results for the limestone at 2.5 µm resolution are better than for the sandstone and much closer to the laboratory measured values. This can be explained by the large number of isolated elements which might not be clearly imaged at lower resolutions, leading to misinterpretation of connected pore space. At the higher resolution, however, the isolated pores are clearly distinguishable as isolated and do not form part of the major flow paths, thus decreasing the permeability. For both porosity and permeability, the results do not seem to have a clear relation to the size of the images. This can be due to the local heterogeneity within the rock types.
5. Conclusions
We investigated two rock types with very different mineralogy and pore space properties. For an accurate representation of the rock types, our approach combines results from different methods to characterize the samples. For porosity determination, two laboratory techniques were used, and the NMR-derived porosity was lower than the water saturation-derived porosity by approximately 3% for both the rock types. When working with a homogeneous rock type, the image resolution only has very minor effect on the estimated porosity. However, if the rock type is heterogeneous, even though the overall resolution effect is minimum, there might be outliers or exceptions to the measured porosity depending on where the sub section is taken from. A resolution of 7 µm is recommended for both the homogeneous and the heterogeneous rock types to obtain representative distribution of the pores. In contrast, a higher resolution might lead to false results for the pore size distribution. Higher resolution images can capture pore sizes more accurately and the thresholding can be performed with more certainty. However, the trade off is having a smaller field of view and a narrower range of the pore sizes. Consequently, higher resolution images are not representative of the pore size distribution of a larger sample. The image resolution affects the dominant transport regime derived from flow simulations in low permeability rocks. However, in rocks with a very high porosity and permeability the resolution did not affect the dominating transport regime. Simulation-derived permeability based on an image resolution of 7 µm in Berea sandstone for an image size of 400 Voxel3 matched the laboratory-derived value while the simulation-derived permeability for the Mount Gambier limestone was closest to the laboratory-derived value at a higher resolution of 2.5 µm for a 300 Voxel3 image size.
For a reliable characterization of the pore space, advantages and disadvantages of the different methods used in this paper are highlighted. NMR is a useful tool for investigating the pore size distribution and provides the pore volume information. However, assumptions of the surface relaxivity and surface to volume ratios must be made in order obtain pore size distributions. In this study, a surface to volume ratio is of , which increases the calculated average pore radius and the maximum pore radius in the distribution as compared to a surface to volume ratio of (Figure 6). The surface relaxivity () also had a large impact on the estimated distribution. Increasing the value of increases the average and the maximum pore-size derived from the NMR analysis (Figure 7). Obtaining digital images using micro-CT imaging is a powerful tool for characterizing different rock types. However, several parameters need to be considered including the sample size, image resolution and micro-CT operating parameters, all of which affect the estimation of the properties of the rock types. For the images studied, the algorithms used to construct the pore network do not produce a unique network, with more pores and throats revealed as the resolution is increased. For the rather homogeneous sandstone rock type, the increased resolution led to an increase in the permeability calculated using numerical simulation, while for the heterogeneous limestone rock type, the increased resolution led to a decrease in the permeability calculated using simulations. Numerical simulations using the pore-scale approach avoids the assumptions required in continuum scale models with dynamic flow field calculations. The number of cells required to define a pore domain and the computation resources required for the simulations are some of the limiting factors of this method. In this study, an image resolution of 2.5 µm and more than 2 million elements were used to fully resolve the pore space for the image size of 500 Voxel3 for both rock types. This meant a much higher computation time was required for the respective simulations.
Image-based static properties such as porosity are often comparable to results derived from laboratory experiments whereas flow properties such as permeability vary greatly between sub-sections of the same digital image. Overall, the inherent physical heterogeneity of a rock type determines the representativeness and the accuracy of properties derived from the digital image analysis. Solely relying on the data acquired from a digital image and assuming it to be representative of the bulk sample at plug size might not be accurate. Only by using multiple characterization techniques can a complex pore space be fully described.
Author Contributions
Conceptualization, R.R.H.; methodology, A.J. and R.R.H.; software, A.J.; formal analysis, A.J.; writing—original draft preparation, A.J.; writing—review and editing, A.J. and R.R.H.; supervision, R.R.H. All authors have read and agreed to the published version of the manuscript.
Funding
This research received no external funding.
Acknowledgments
The authors acknowledge technical support by Jay Black from the University of Melbourne and the Melbourne Trace Analysis for Chemical, Earth, and Environmental Sciences (TrACEES) Platform for access to the GE Phoenix Nanotom M Micro-CT instrument. The authors also acknowledge Lionel Esteban and Stefan Iglauer from CSIRO for running the NMR samples at the facility in Perth and helping with the interpretation of the data. The authors would also like to thank the reviewers and the editor for their recommendations and valuable feedback which has helped improve this manuscript immensely.
Conflicts of Interest
The authors declare no conflict of interest.
Appendix A. Experimental Porosity Calculation by Water Saturation Technique of the Berea Sandstone and the Mt. Gambier Limestone
Experimental porosity was measured in the bulk cores (L = 10.0 cm: D = 3.81 cm) of the two rock types. The cores were oven-dried at 50 °C (Contherm Digital Series) for 48 h to ensure they had dried completely and then the dry mass () in grams was measured. Thereafter, the rock types were immersed in DI water in a closed vacuum chamber and connected to a high vacuum pump (Edwards RV8). The core was submerged for 24 h at −70 kPa and then wet mass () in grams was measured.

Table A1.
Dry and wet weights of the two rock types.
| Dry Weight (g) | Wet Weight (g) | Net Pore Weight (g) | |
|---|---|---|---|
| Mt. Gambier limestone | 124.64 | 181.04 | 56.4 |
| Berea sandstone | 228.06 | 251.33 | 23.27 |
The connected pore volume, Vp, of the cores was calculated using the following equations:
is the density of the saturating fluid. Here, 0.5 M NaCl solution is used for the saturation with a density of g/cm3. Therefore, the connected pore volume of Mt. Gambier limestone is calculated as 55.45 cm3 and Berea sandstone as 22.8 cm3.
Bulk volume of the cylindrical core is calculated as shown in Equation (A2).
where and h are the radius and the height of the core in cm, respectively. The bulk volume of the cores is calculated as 114.01 cm3.
The porosity ( of the core is calculated as percentage using Equation (A3).
The calculated porosity of Berea sandstone is 20% and for the Mt Gambier Limestone is 48.6%
Appendix B. NMR Calibration for the Two Rock Types Using 15 mL Brine Solution
Figure A1 shows the raw signal of the NMR distribution and the corresponding equivalent volume of the fluid, i.e., 15 mL. The left axis shows the raw output from the measurement, while the right axis shows how the output has been used to obtain a calibration from the 15 mL fluid. This frequency was then associated with the frequency obtained from the rock types and the equivalent volume was interpolated.
Figure A1.
NMR signal for 0.1 M brine for calibration for (a) Berea sandstone, (b) Mt. Gambier limestone.
Figure A1.
NMR signal for 0.1 M brine for calibration for (a) Berea sandstone, (b) Mt. Gambier limestone.
Appendix C. Pressure and Velocity Distribution
The velocity (Figure A3) and pressure distribution (Figure A2) from the pore scale flow simulations for the Berea sandstone and the Mt. Gambier limestone.
Figure A2.
The distribution with a pressure difference of 100 Pa applied across the domains for (a) Berea sandstone and (b) Mt. Gambier limestone.
Figure A2.
The distribution with a pressure difference of 100 Pa applied across the domains for (a) Berea sandstone and (b) Mt. Gambier limestone.
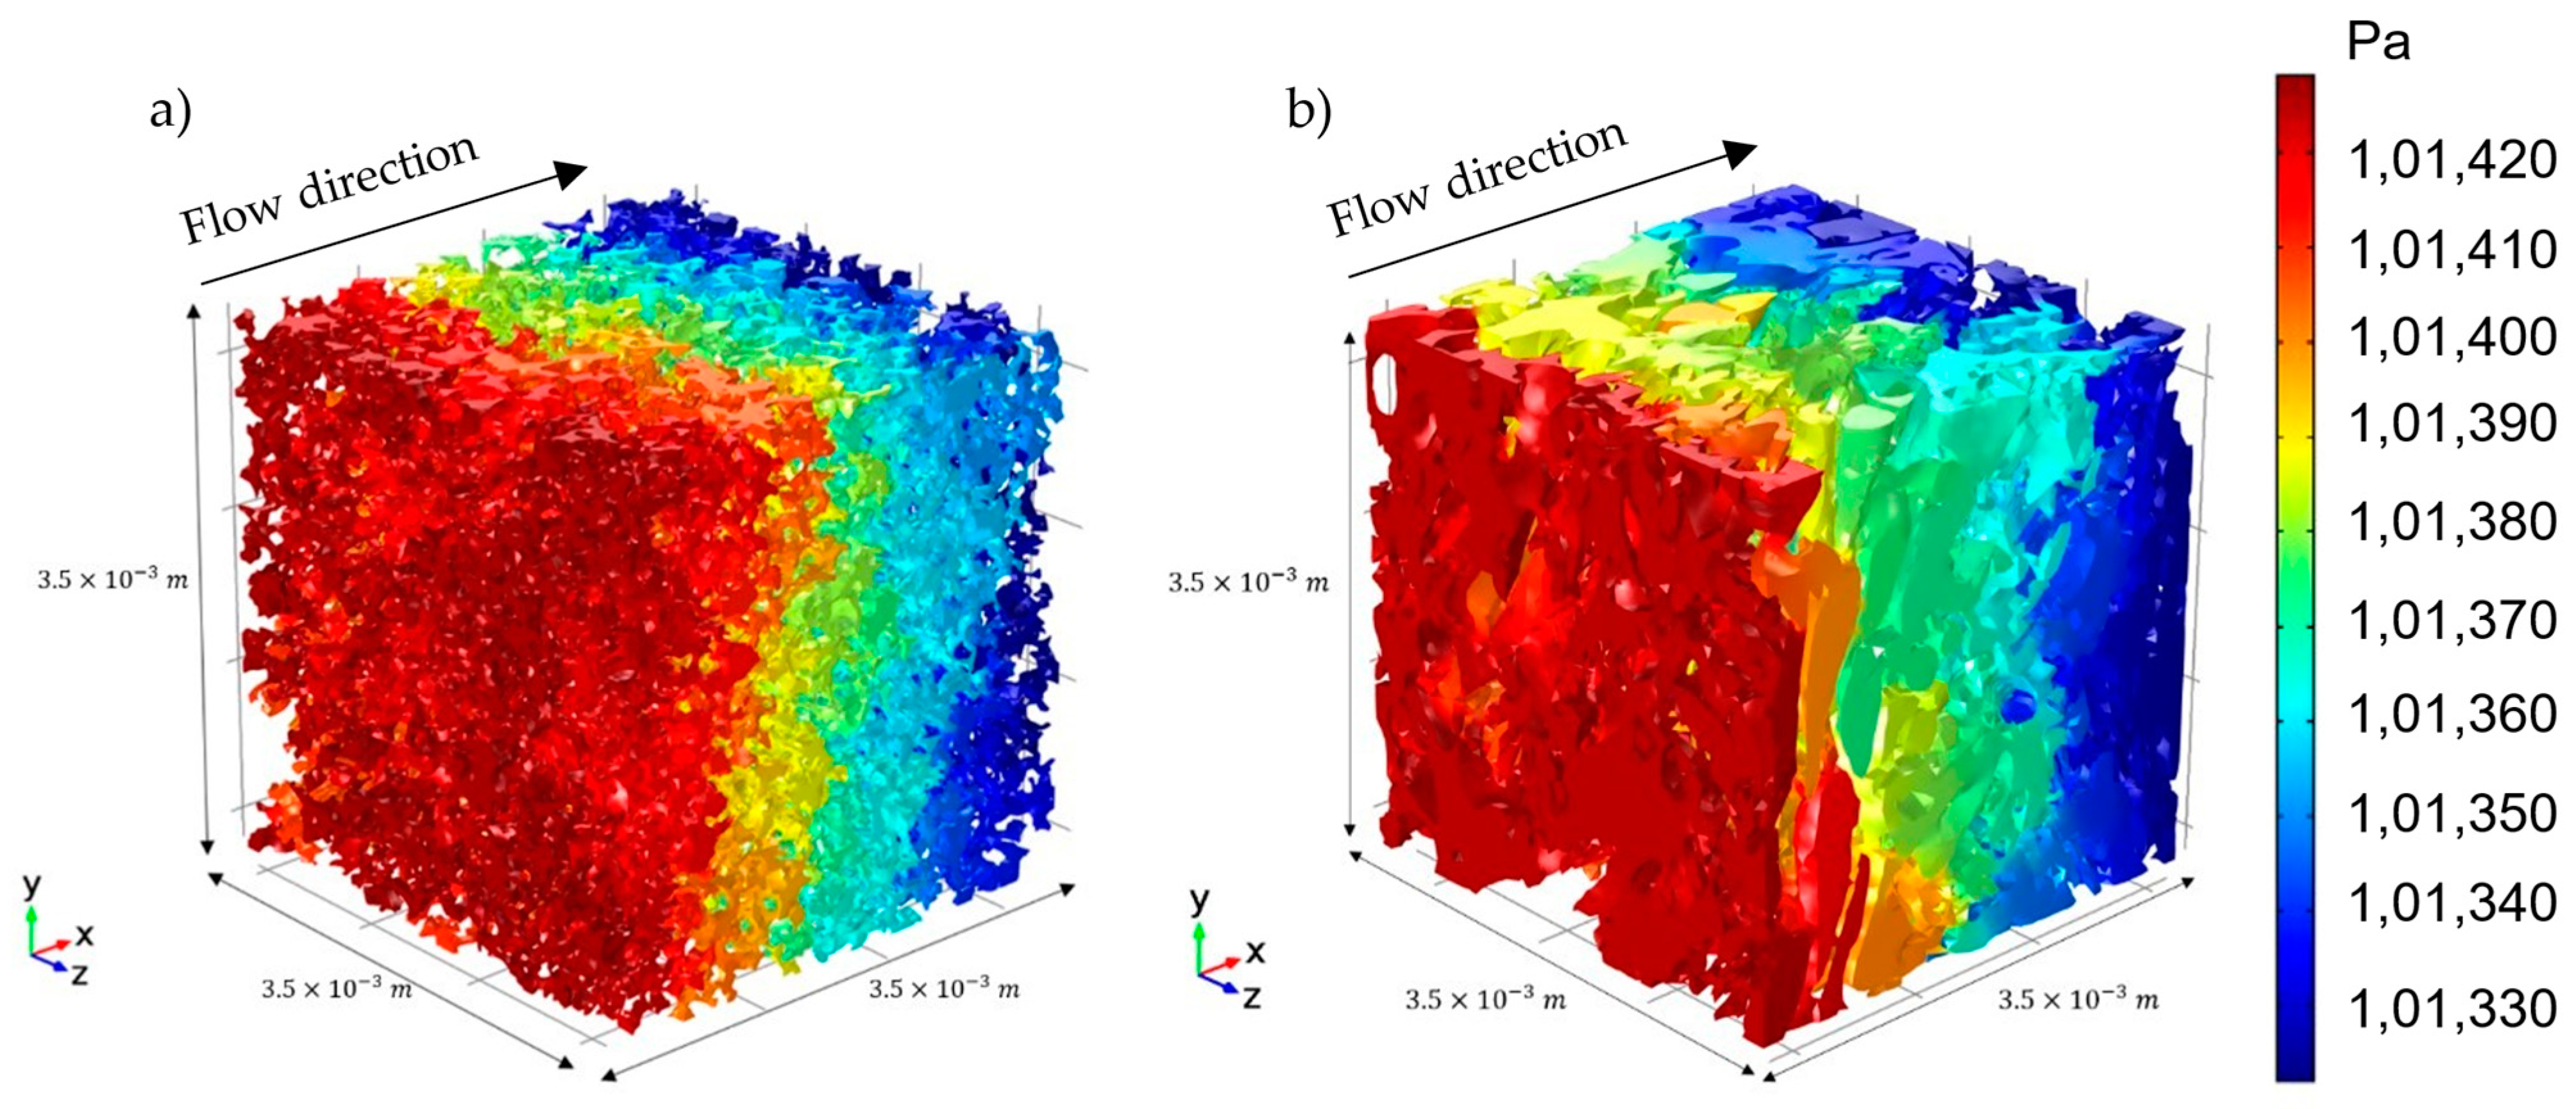
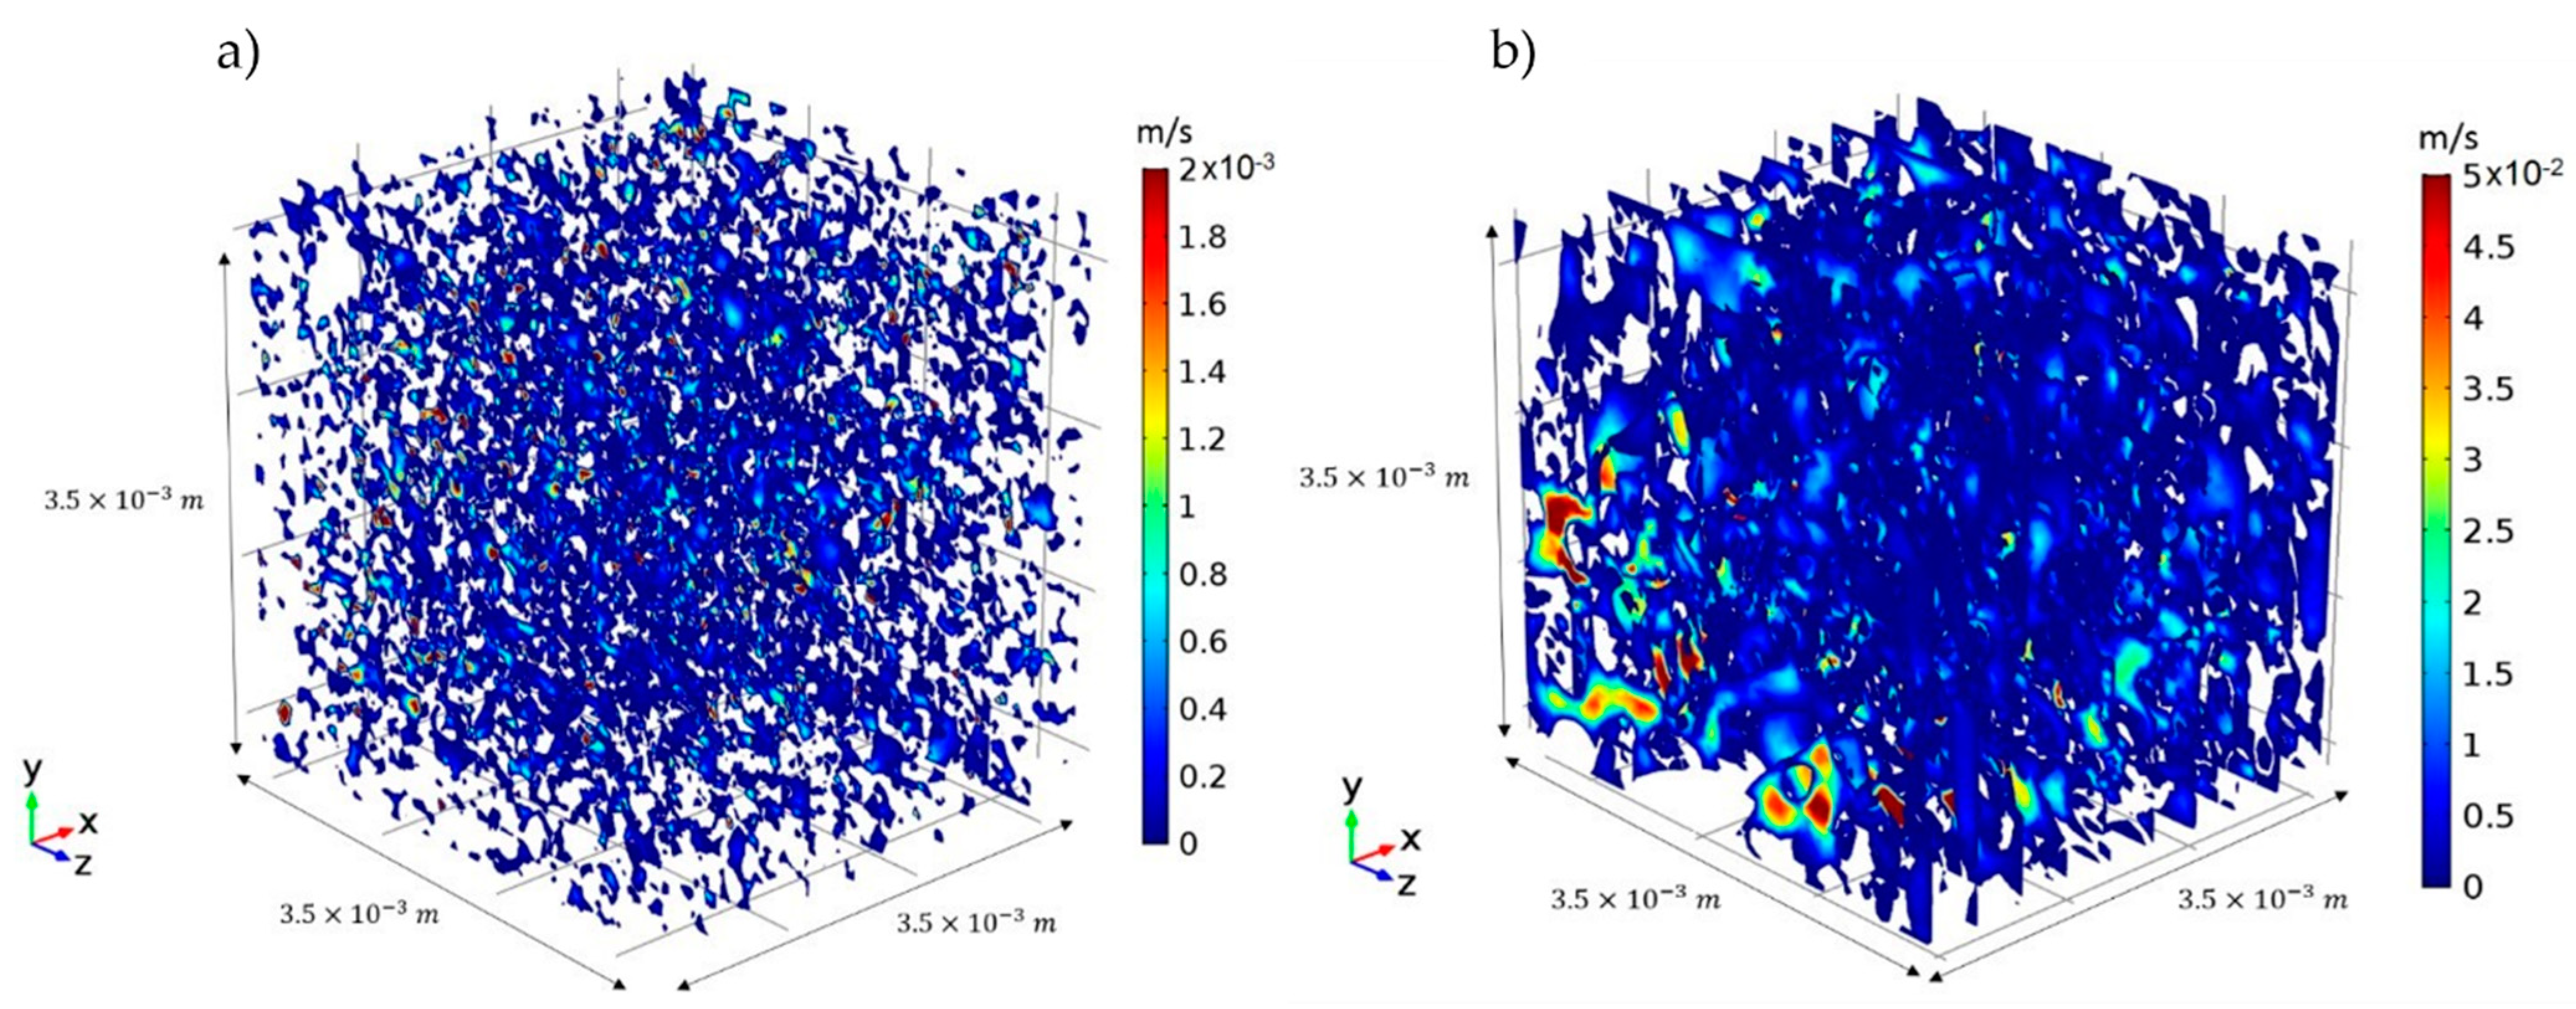
Figure A3 shows the velocity distribution of the Berea sandstone and the Mt. Gambier limestone on 2D slices within the volume of the rocks along the X-direction.
Figure A3.
The velocity field is plotted on 10 slices in the x-direction across (a) the Berea sandstone and (b) the Mt. Gambier limestone.
Figure A3.
The velocity field is plotted on 10 slices in the x-direction across (a) the Berea sandstone and (b) the Mt. Gambier limestone.
References
- Kleinberg, R.; Kenyon, W.; Mitra, P. Mechanism of NMR relaxation of fluids in rock. J. Magn. Reson. Ser. A 1994, 108, 206–214. [Google Scholar] [CrossRef]
- Munn, K.; Smith, D.M. A NMR technique for the analysis of pore structure: Numerical inversion of relaxation measurements. J. Colloid Interface Sci. 1987, 119, 117–126. [Google Scholar] [CrossRef]
- Gallegos, D.P.; Smith, D.M. A NMR technique for the analysis of pore structure: Determination of continuous pore size distributions. J. Colloid Interface Sci. 1988, 122, 143–153. [Google Scholar] [CrossRef]
- Minagawa, H.; Nishikawa, Y.; Ikeda, I.; Miyazaki, K.; Takahara, N.; Sakamoto, Y.; Komai, T.; Narita, H. Characterization of sand sediment by pore size distribution and permeability using proton nuclear magnetic resonance measurement. J. Geophys. Res. Solid Earth 2008, 113, 1–9. [Google Scholar] [CrossRef]
- Zhao, H.; Ning, Z.; Zhao, T.; Che, F.; Zhang, R.; Hou, T. Applicability Comparison of Nuclear Magnetic Resonance and Mercury Injection Capillary Pressure in Characterisation Pore Structure of Tight Oil Reservoirs. In Proceedings of the SPE Asia Pacific Unconventional Resources Conference and Exhibition, Brisbane, Australia, 9–11 November 2015. [Google Scholar]
- Xie, Q.; Di, B.; Wei, J.; Zhang, R.; Li, D. Comparison of Nuclear Magnetic Resonance and Mercury Injection Capillary Pressure in Characterization of Shale Pore Size. In Proceedings of the 78th EAGE Conference and Exhibition 2016, Online, 30 May 2016. [Google Scholar]
- Arns, C.H.; Bauget, F.; Limaye, A.; Sakellariou, A.; Senden, T.; Sheppard, A.; Sok, R.M.; Pinczewski, V.; Bakke, S.; Berge, L.I.; et al. Pore Scale Characterization of Carbonates Using X-Ray Microtomography. Soc. Pet. Eng. 2005, 10, 475–484. [Google Scholar] [CrossRef]
- Wildenschild, D.; Sheppard, A.P. X-ray imaging and analysis techniques for quantifying pore-scale structure and processes in subsurface porous medium systems. Adv. Water Resour. 2013, 51, 217–246. [Google Scholar] [CrossRef]
- Gambino, S.; Fazio, E.; Maniscalco, R.; Punturo, R.; Lanzafame, G.; Barreca, G.; Butler, R. Fold-related deformation bands in a weakly buried sandstone reservoir analogue: A multi-disciplinary case study from the Numidian (Miocene) of Sicily (Italy). J. Struct. Geol. 2019, 118, 150–164. [Google Scholar] [CrossRef] [Green Version]
- Bijeljic, B.; Mostaghimi, P.; Blunt, M.J. Insights into non-Fickian solute transport in carbonates. Water Resour. Res. 2013, 49, 2714–2728. [Google Scholar] [CrossRef] [Green Version]
- Nunes, J.P.P.; Bijeljic, B.; Blunt, M.J. Time-of-Flight Distributions and Breakthrough Curves in Heterogeneous Porous Media Using a Pore-Scale Streamline Tracing Algorithm. Transp. Porous Media 2015, 109, 317–336. [Google Scholar] [CrossRef] [Green Version]
- Zaretskiy, Y.; Geiger, S.; Sorbie, K.; Forster, M. Efficient flow and transport simulations in reconstructed 3D pore geometries. Adv. Water Resour. 2010, 33, 1508–1516. [Google Scholar] [CrossRef]
- Bijeljic, B.; Raeini, A.; Mostaghimi, P.; Blunt, M.J. Predictions of non-Fickian solute transport in different classes of porous media using direct simulation on pore-scale images. Phys. Rev. E 2013, 87, 13011. [Google Scholar] [CrossRef] [Green Version]
- Kang, P.K.; Anna, P.; Nunes, J.P.; Bijeljic, B.; Blunt, M.J.; Juanes, R. Pore-scale intermittent velocity structure underpinning anomalous transport through 3-D porous media. Geophys. Res. Lett. 2014, 41, 6184–6190. [Google Scholar] [CrossRef]
- Mostaghimi, P.; Blunt, M.J.; Bijeljic, B. Computations of absolute permeability on micro-CT images. Math. Geosci. 2013, 45, 103–125. [Google Scholar] [CrossRef]
- Soulaine, C.; Gjetvaj, F.; Garing, C.; Roman, S.; Russian, A.; Gouze, P.; Tchelepi, H.A. The impact of sub-resolution porosity of X-ray microtomography images on the permeability. Transp. Porous Media 2016, 113, 227–243. [Google Scholar] [CrossRef] [Green Version]
- Yoon, H.; Kang, Q.; Valocchi, A. Lattice Boltzmann-based approaches for pore-scale reactive transport. Rev. Mineral. Geochem. 2015, 80, 393–431. [Google Scholar] [CrossRef]
- Patel, R.A.; Perko, J.; Jacques, D.; De Schutter, G.; Van Breugel, K.; Ye, G. A versatile pore-scale multicomponent reactive transport approach based on lattice Boltzmann method: Application to portlandite dissolution. Phys. Chem. Earth 2014, 70, 127–137. [Google Scholar] [CrossRef]
- Huber, C.; Shafei, B.; Parmigiani, A. A new pore-scale model for linear and non-linear heterogeneous dissolution and precipitation. Geochim. Cosmochim. Acta 2014, 124, 109–130. [Google Scholar] [CrossRef]
- Iliev, O.; Lakdawala, Z.; Leonard, K.; Vutov, Y. On pore-scale modeling and simulation of reactive transport in 3D geometries. Math. Model. Anal. 2015, 22, 671–694. [Google Scholar] [CrossRef] [Green Version]
- Alhashmi, Z.; Blunt, M.J.; Bijeljic, B. Predictions of dynamic changes in reaction rates as a consequence of incomplete mixing using pore scale reactive transport modeling on images of porous media. J. Contam. Hydrol. 2015, 179, 171–181. [Google Scholar] [CrossRef] [Green Version]
- Geiger, S.; Schmid, K.S.; Zaretskiy, Y. Mathematical analysis and numerical simulation of multi-phase multi-component flow in heterogeneous porous media. Curr. Opin. Colloid Interface Sci. 2012, 17, 147–155. [Google Scholar] [CrossRef]
- Molins, S.; Silin, D.; Trebotich, D.; Steefel, C. Direct pore-scale numerical simulation of precipitation and dissolution. Miner. Mag. 2011, 75, 1487. [Google Scholar]
- Molins, S.; Trebotich, D.; Steefel, C.I.; Shen, C.P. An investigation of the effect of pore scale flow on average geochemical reaction rates using direct numerical simulation. Water Resour. Res. 2012, 48, 1–47. [Google Scholar] [CrossRef]
- Trebotich, D.; Adams, M.F.; Molins, S.; Steefel, C.I.; Shen, C. High-resolution simulation of pore-scale reactive transport processes associated with carbon sequestration. Comput. Sci. Eng. 2014, 16, 22–31. [Google Scholar] [CrossRef]
- Molins, S.; Trebotich, D.; Yang, L.; Ajo-Franklin, J.B.; Ligocki, T.J.; Shen, C.; Steefel, C.I. Pore-scale controls on calcite dissolution rates from flow-through laboratory and numerical experiments. Environ. Sci. Technol. 2014, 48, 7453–7460. [Google Scholar] [CrossRef] [PubMed]
- Molins, S. Reactive Interfaces in Direct Numerical Simulation of Pore-Scale Processes. Pore-Scale Geochem. Process. 2015, 80, 461–481. [Google Scholar] [CrossRef] [Green Version]
- Jyoti, A.; Haese, R.R. Validation of a multicomponent reactive-transport model at pore scale based on the coupling of COMSOL and PhreeqC. Comput. Geosci. 2021, 156, 104870. [Google Scholar] [CrossRef]
- Algive, L.; Bekri, S.; Vizika-kavvadias, O. Reactive Pore Network Modeling Dedicated to the Determination of the Petrophysical Property Changes While Injecting CO2. In Proceedings of the SPE Annual Technical Conference and Exhibition, New Orleans, LA, USA, 4–7 October 2009. [Google Scholar] [CrossRef]
- Algive, L.; Bekri, S.; Nader, F.H.; Lerat, O.; Vizika, O. Impact of Diagenetic Alterations on the Petrophysical and Multiphase Flow Properties of Carbonate Rocks Using a Reactive Pore Network Modeling Approach. Oil Gas Sci. Technol. 2012, 67, 147–160. [Google Scholar] [CrossRef] [Green Version]
- Li, L.; Peters, C.A.; Celia, M.A. Upscaling geochemical reaction rates using pore-scale network modeling. Adv. Water Resour. 2006, 29, 1351–1370. [Google Scholar] [CrossRef]
- Varloteaux, C.; Bekri, S.; Adler, P.M. Pore network modelling to determine the transport properties in presence of a reactive fluid: From pore to reservoir scale. Adv. Water Resour. 2013, 53, 87–100. [Google Scholar] [CrossRef]
- Kim, D.; Peters, C.A.; Lindquist, W.B. Upscaling geochemical reaction rates accompanying acidic CO2-saturated brine flow in sandstone aquifers. Water Resour. Res. 2011, 47. [Google Scholar] [CrossRef]
- Raoof, A.; Nick, H.M.; Hassanizadeh, S.M.; Spiers, C.J. PoreFlow: A complex pore-network model for simulation of reactive transport in variably saturated porous media. Comput. Geosci. 2013, 61, 160–174. [Google Scholar] [CrossRef]
- Bear, J. Dynamics of Fluids in Porous Materials; Dover Publication Inc.: New York, NY, USA, 1972. [Google Scholar]
- Norris, R.; Lewis, J. The geological modeling of effective permeability in complex heterolithic facies. In Proceedings of the SPE Annual Technical Conference and Exhibition, Dallas, TX, USA, 6–9 October 1991. [Google Scholar]
- Brown, G.; Hsieh, H.; Lucero, D.A. Evaluation of laboratory dolomite core sample size using representative elementary volume concepts. Water Resour. Res. 2000, 36, 1199–1207. [Google Scholar] [CrossRef]
- Zhang, D.; Zhang, R.; Chen, S.; Soll, W.E. Pore scale study of flow in porous media: Scale dependency, REV, and statistical REV. Geophys. Res. Lett. 2000, 27, 1195–1198. [Google Scholar] [CrossRef]
- Keehm, Y.; Mukerji, T. Permeability and relative permeability from digital rocks: Issues on grid resolution and representative elementary volume. In SEG Technical Program Expanded Abstracts 2004; Society of Exploration Geophysicists: Tulsa, OK, USA, 2004; pp. 1654–1657. [Google Scholar] [CrossRef]
- Nordahl, K.; Ringrose, P.S. Identifying the representative elementary volume for permeability in heterolithic deposits using numerical rock models. Math. Geosci. 2008, 40, 753–771. [Google Scholar] [CrossRef]
- Al-Raoush, R.; Papadopoulos, A. Representative elementary volume analysis of porous media using X-ray computed tomography. Powder Technol. 2010, 200, 69–77. [Google Scholar] [CrossRef]
- Fernandes, J.S.; Appoloni, C.R.; Fernandes, C.P. Determination of the representative elementary volume for the study of sandstones and siltstones by X-Ray microtomography. Mater. Res. 2012, 15, 662–670. [Google Scholar] [CrossRef] [Green Version]
- Ovaysi, S.; Wheeler, M.F.; Balhoff, M. Quantifying the representative size in porous media. Transp. Porous Media 2014, 104, 349–362. [Google Scholar] [CrossRef]
- Rozenbaum, O.; du Roscoat, S.R. Representative elementary volume assessment of three-dimensional x-ray microtomography images of heterogeneous materials: Application to limestones. Phys. Rev. E 2014, 89, 053304. [Google Scholar] [CrossRef] [PubMed] [Green Version]
- Alyafei, N.; Raeini, A.Q.; Paluszny, A.; Blunt, M.J. A Sensitivity Study of the Effect of Image Resolution on Predicted Petrophysical Properties. Transp. Porous Media 2015, 110, 157–169. [Google Scholar] [CrossRef]
- Alyafei, N.; Gharbi, O.; Qaseminejad Raeini, A.; Yang, J.; Iglauer, S.; Blunt, M.J. Influence of Micro-Computed Tomography Image Resolution on Petrophysical Properties. In Proceedings of the International Petroleum Technology Conference, Beijing, China, 26–28 March 2013. [Google Scholar]
- Peng, S.; Hu, Q.; Dultz, S.; Zhang, M. Using X-ray computed tomography in pore structure characterization for a Berea sandstone: Resolution effect. J. Hydrol. 2012, 472, 254–261. [Google Scholar] [CrossRef]
- Kruschwitz, S.; Halisch, M.; Dlugosch, R.; Prinz, C. Toward a better understanding of low-frequency electrical relaxation—An enhanced pore space characterization. Geophysics 2020, 85, MR257–MR270. [Google Scholar] [CrossRef]
- Castañeda-Herrera, C.; Black, J.; Llanos, E.; Stevens, G.; Haese, R. Formation of an amorphous silica gel barrier under CO2 storage conditions. Int. J. Greenh. Gas Control 2018, 78, 27–36. [Google Scholar] [CrossRef]
- Churcher, P.; French, P.; Shaw, J.; Schramm, L. Rock properties of Berea sandstone, Baker dolomite, and Indiana limestone. In Proceedings of the SPE International Symposium on Oilfield Chemistry, Anaheim, CA, USA, 20–22 February 1991. [Google Scholar]
- Andrew, M.; Bijeljic, B.; Blunt, M.J. Pore-scale imaging of trapped supercritical carbon dioxide in sandstones and carbonates. Int. J. Greenh. Gas Control 2014, 22, 1–14. [Google Scholar] [CrossRef] [Green Version]
- Talabi, O.; AlSayari, S.; Iglauer, S.; Blunt, M.J. Pore-scale simulation of NMR response. J. Pet. Sci. Eng. 2009, 67, 168–178. [Google Scholar] [CrossRef]
- Loren, J.D.; Robinson, J. Relations between pore size fluid and matrix properties, and NML measurements. Soc. Pet. Eng. J. 1970, 10, 268–278. [Google Scholar] [CrossRef]
- Carr, H.Y.; Purcell, E.M. Effects of diffusion on free precession in nuclear magnetic resonance experiments. Phys. Rev. 1954, 94, 630. [Google Scholar] [CrossRef]
- Meiboom, S.; Gill, D. Modified spin-echo method for measuring nuclear relaxation times. Rev. Sci. Instrum. 1958, 29, 688–691. [Google Scholar] [CrossRef] [Green Version]
- Kleinberg, R.; Flaum, C.; Griffin, D.; Brewer, P.; Malby, G.; Peltzer, E.; Yesinowski, J. Deep sea NMR: Methane hydrate growth habit in porous media and its relationship to hydraulic permeability, deposit accumulation, and submarine slope stability. J. Geophys. Res. Solid Earth 2003, 108. [Google Scholar] [CrossRef]
- Hurlimann, M.; Helmer, K.G.; Latour, L.; Sotak, C.H. Restricted diffusion in sedimentary rocks. Determination of surface-area-to-volume ratio and surface relaxivity. J. Magn. Reson. Ser. A 1994, 111, 169–178. [Google Scholar] [CrossRef]
- Doroszko, M.; Seweryn, A. A new numerical modelling method for deformation behaviour of metallic porous materials using X-ray computed microtomography. Mater. Sci. Eng. 2017, 689, 142–156. [Google Scholar] [CrossRef]
- Ramos, K.; Matouš, K. Micro-computed tomography based experimental investigation of micro-and macro-mechanical response of particulate composites with void growth. Philos. Mag. 2018, 98, 3049–3071. [Google Scholar] [CrossRef]
- Ahmed, Z.; Lebedev, M.J.G.P. Elastic properties of sands, Part 1: Micro computed tomography image analysis of grain shapes and their relationship with microstructure. Geophys. Prospect. 2019, 67, 723–744. [Google Scholar] [CrossRef]
- Phukan, M.; Jyoti, A.; Black, J.R.; Haese, R.R. Changes in pore geometry and connectivity in the basalt pore network adjacent to fractures in response to CO2-saturated fluid. Water Resour. Res. 2021, 57, e2021WR030275. [Google Scholar] [CrossRef]
- Steefel, C.I.; Molins, S.; Trebotich, D. Pore scale processes associated with subsurface CO2 injection and sequestration. Rev. Mineral. Geochem. 2013, 77, 259–303. [Google Scholar] [CrossRef]
- Liaw, H.K.; Kulkarni, R.; Chen, S.; Watson, A.T. Characterization of fluid distributions in porous media by NMR techniques. AIChE J. 1996, 42, 538–546. [Google Scholar] [CrossRef]
- Kleinberg, R.; Flaum, C.; Straley, C.; Brewer, P.; Malby, G.; Peltzer, E.; Friederich, G.; Yesinowski, J. Seafloor nuclear magnetic resonance assay of methane hydrate in sediment and rock. J. Geophys. Res. Solid Earth 2003, 108. [Google Scholar] [CrossRef]
- Darcy, H. Les Fontaines Publiques de la ville de Dijon: Exposition et Application; Victor Dalmont: Paris, France, 1856. [Google Scholar]
- Peng, S.; Marone, F.; Dultz, S. Resolution effect in X-ray microcomputed tomography imaging and small pore’s contribution to permeability for a Berea sandstone. J. Hydrol. 2014, 510, 403–411. [Google Scholar] [CrossRef]
Figure 1.
(a) Berea sandstone sample image, (b) Berea sandstone micro-CT image, (c) Mt. Gambier limestone sample image and (d) Mt. Gambier limestone micro-CT image.
Figure 1.
(a) Berea sandstone sample image, (b) Berea sandstone micro-CT image, (c) Mt. Gambier limestone sample image and (d) Mt. Gambier limestone micro-CT image.

Figure 2.
(a) The greyscale raw image of the Berea sandstone measuring 500 voxel3 at a resolution of 7 µm, (b) The labelled image of the segmented porosity in sample, (c) Separate objects corresponding to different pores in the labelled image according to the intensity of the greyscale image, (d) The pore-network of the Berea sandstone superimposed on the separate object image of the scan.
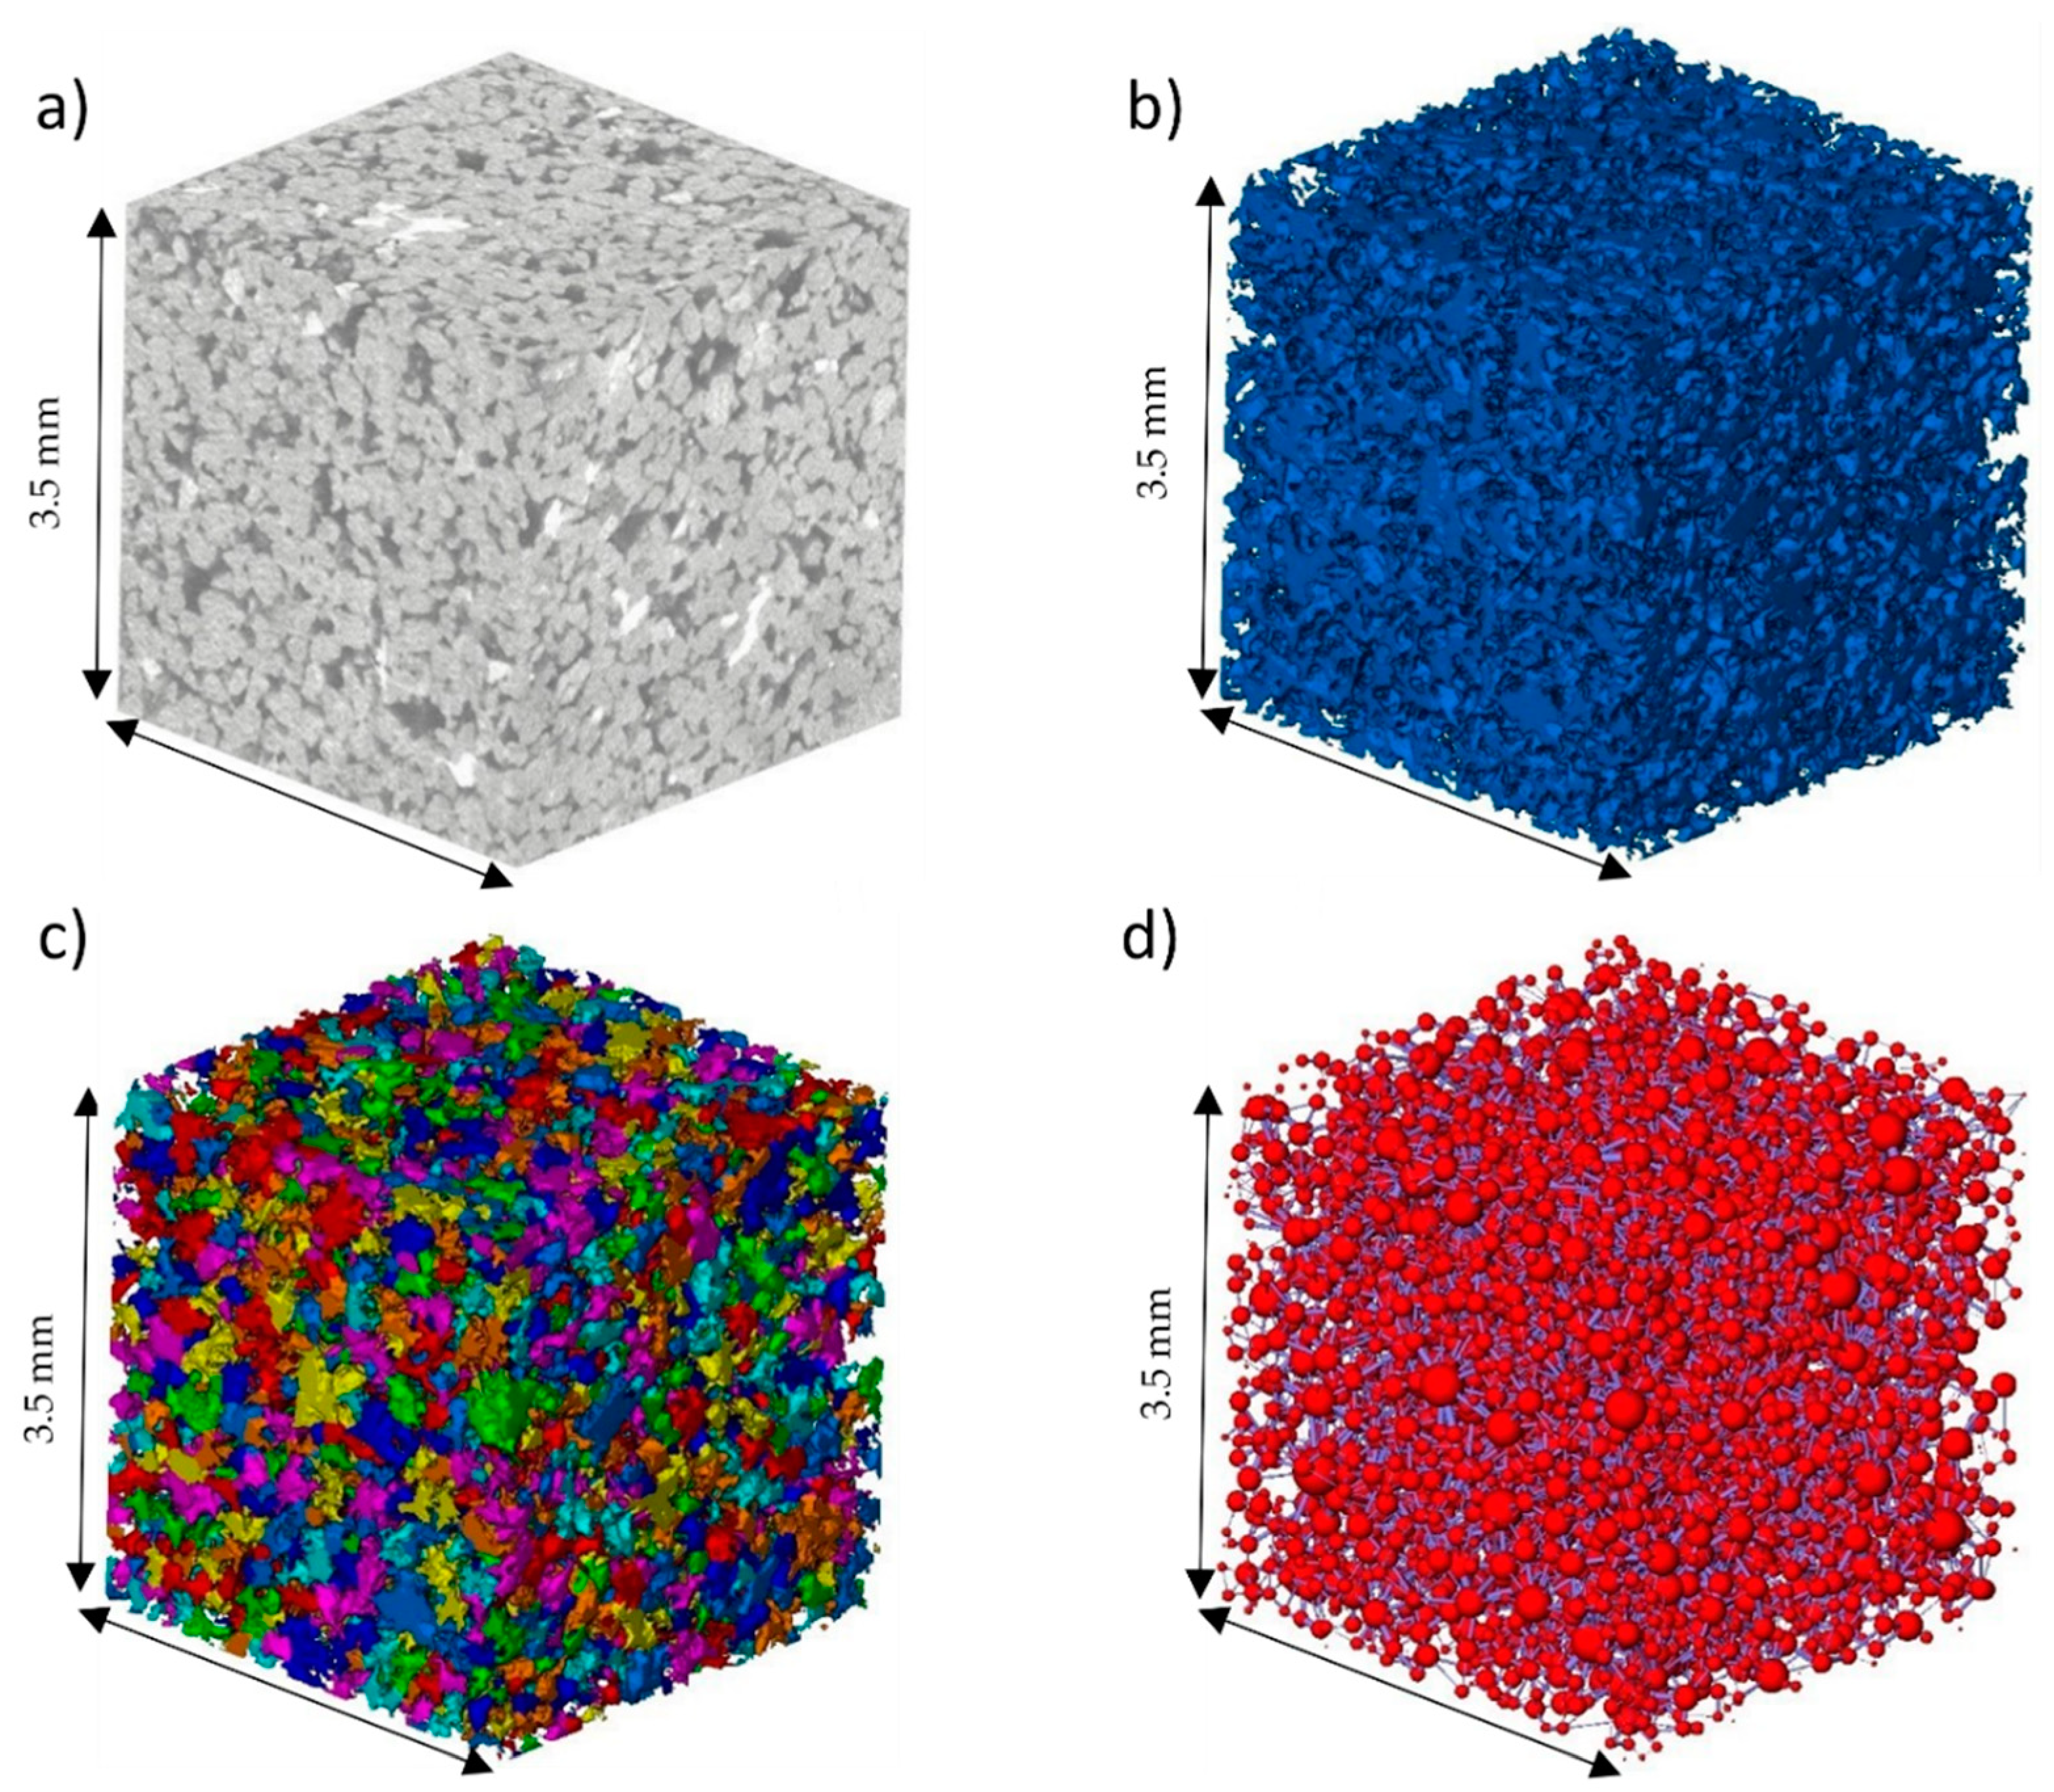
Figure 3.
(a) Raw NMR signal and equivalent total volume and (b) Mathematically inverted data showing the and porosity distribution for the Berea sandstone.
Figure 3.
(a) Raw NMR signal and equivalent total volume and (b) Mathematically inverted data showing the and porosity distribution for the Berea sandstone.

Figure 4.
(a) Raw NMR signal and equivalent total volume and (b) Mathematically inverted data showing the and porosity distribution for the Mt. Gambier limestone.
Figure 4.
(a) Raw NMR signal and equivalent total volume and (b) Mathematically inverted data showing the and porosity distribution for the Mt. Gambier limestone.
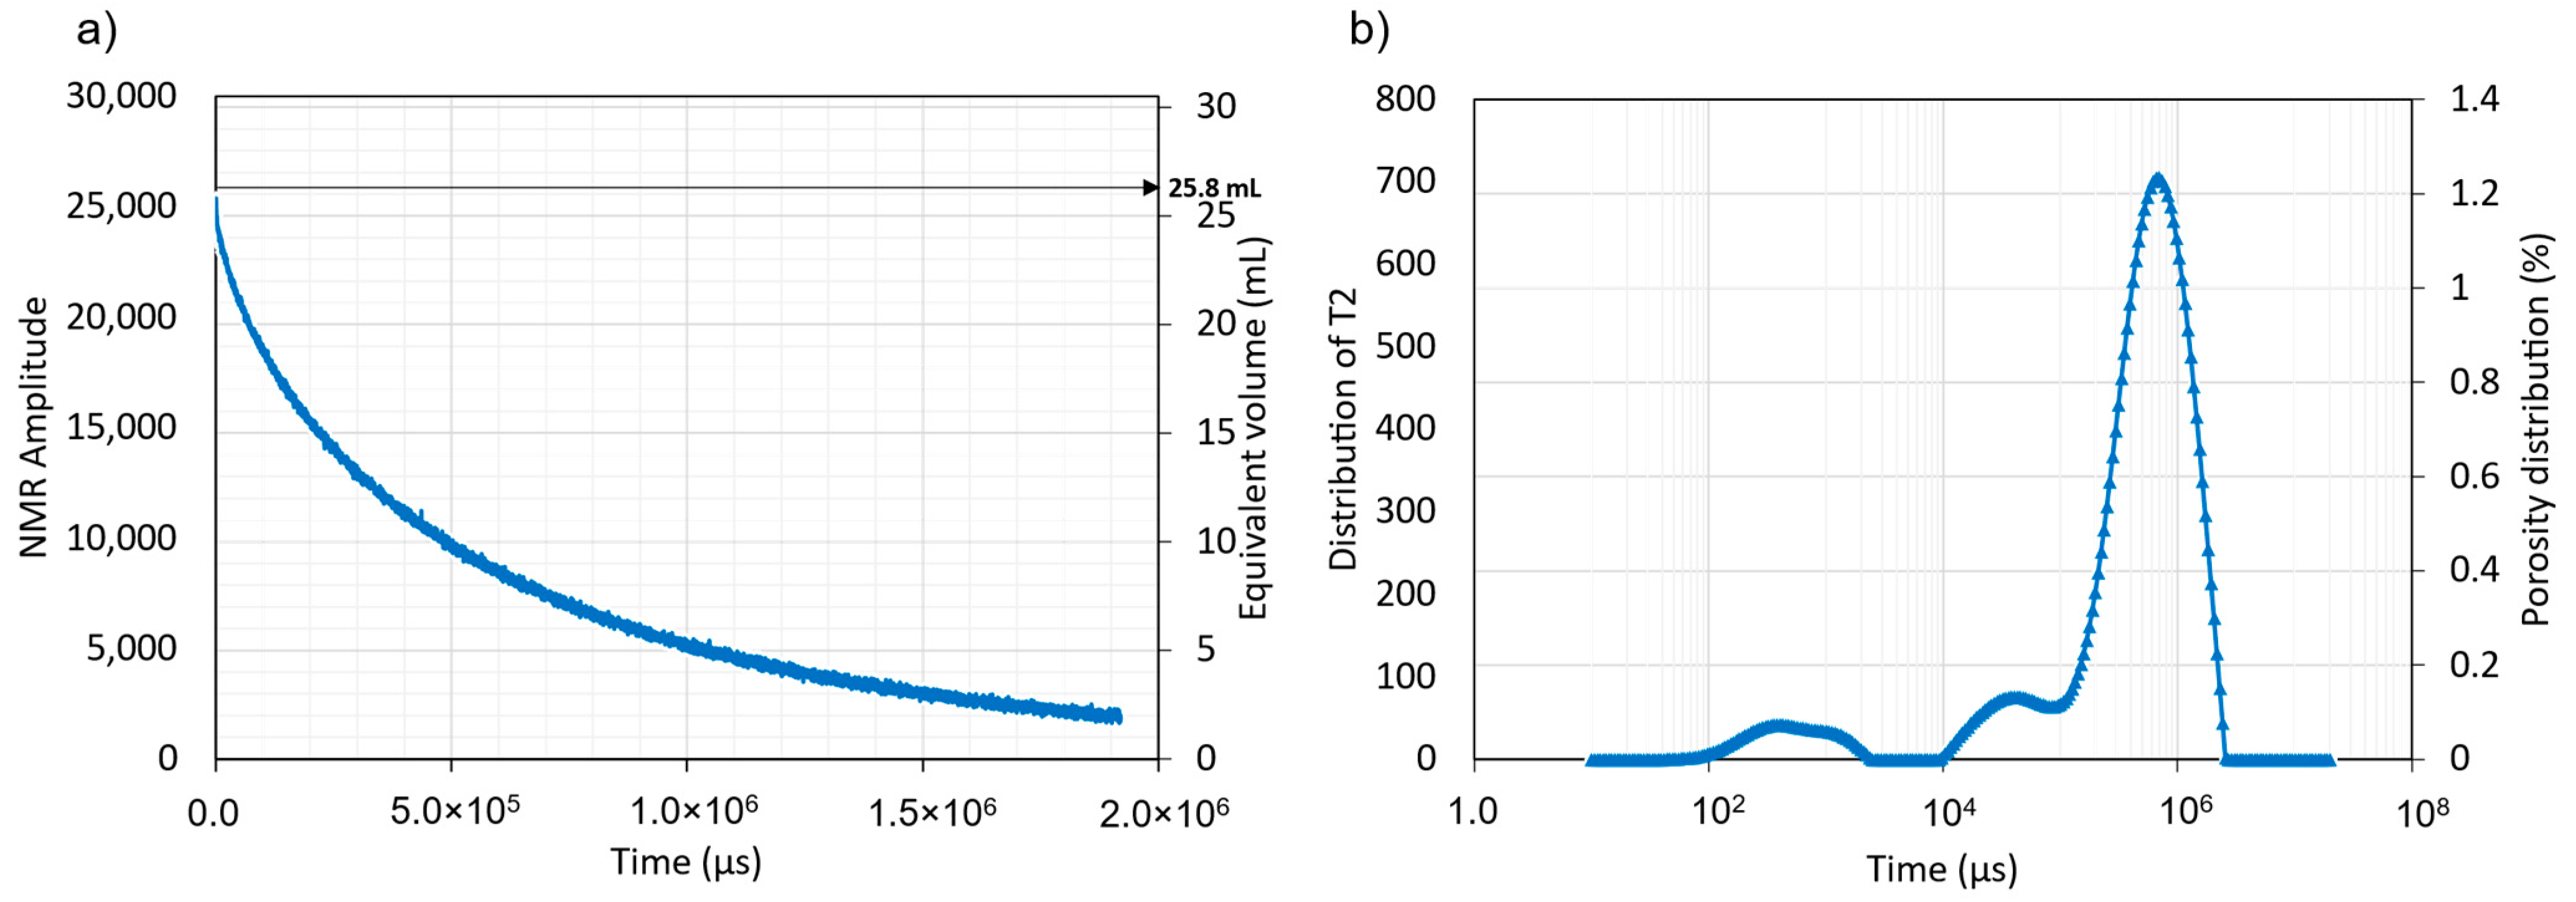
Figure 5.
Pore-size distribution based on the NMR signal of (a) Berea sandstone and (b) Mt. Gambier limestone.
Figure 5.
Pore-size distribution based on the NMR signal of (a) Berea sandstone and (b) Mt. Gambier limestone.
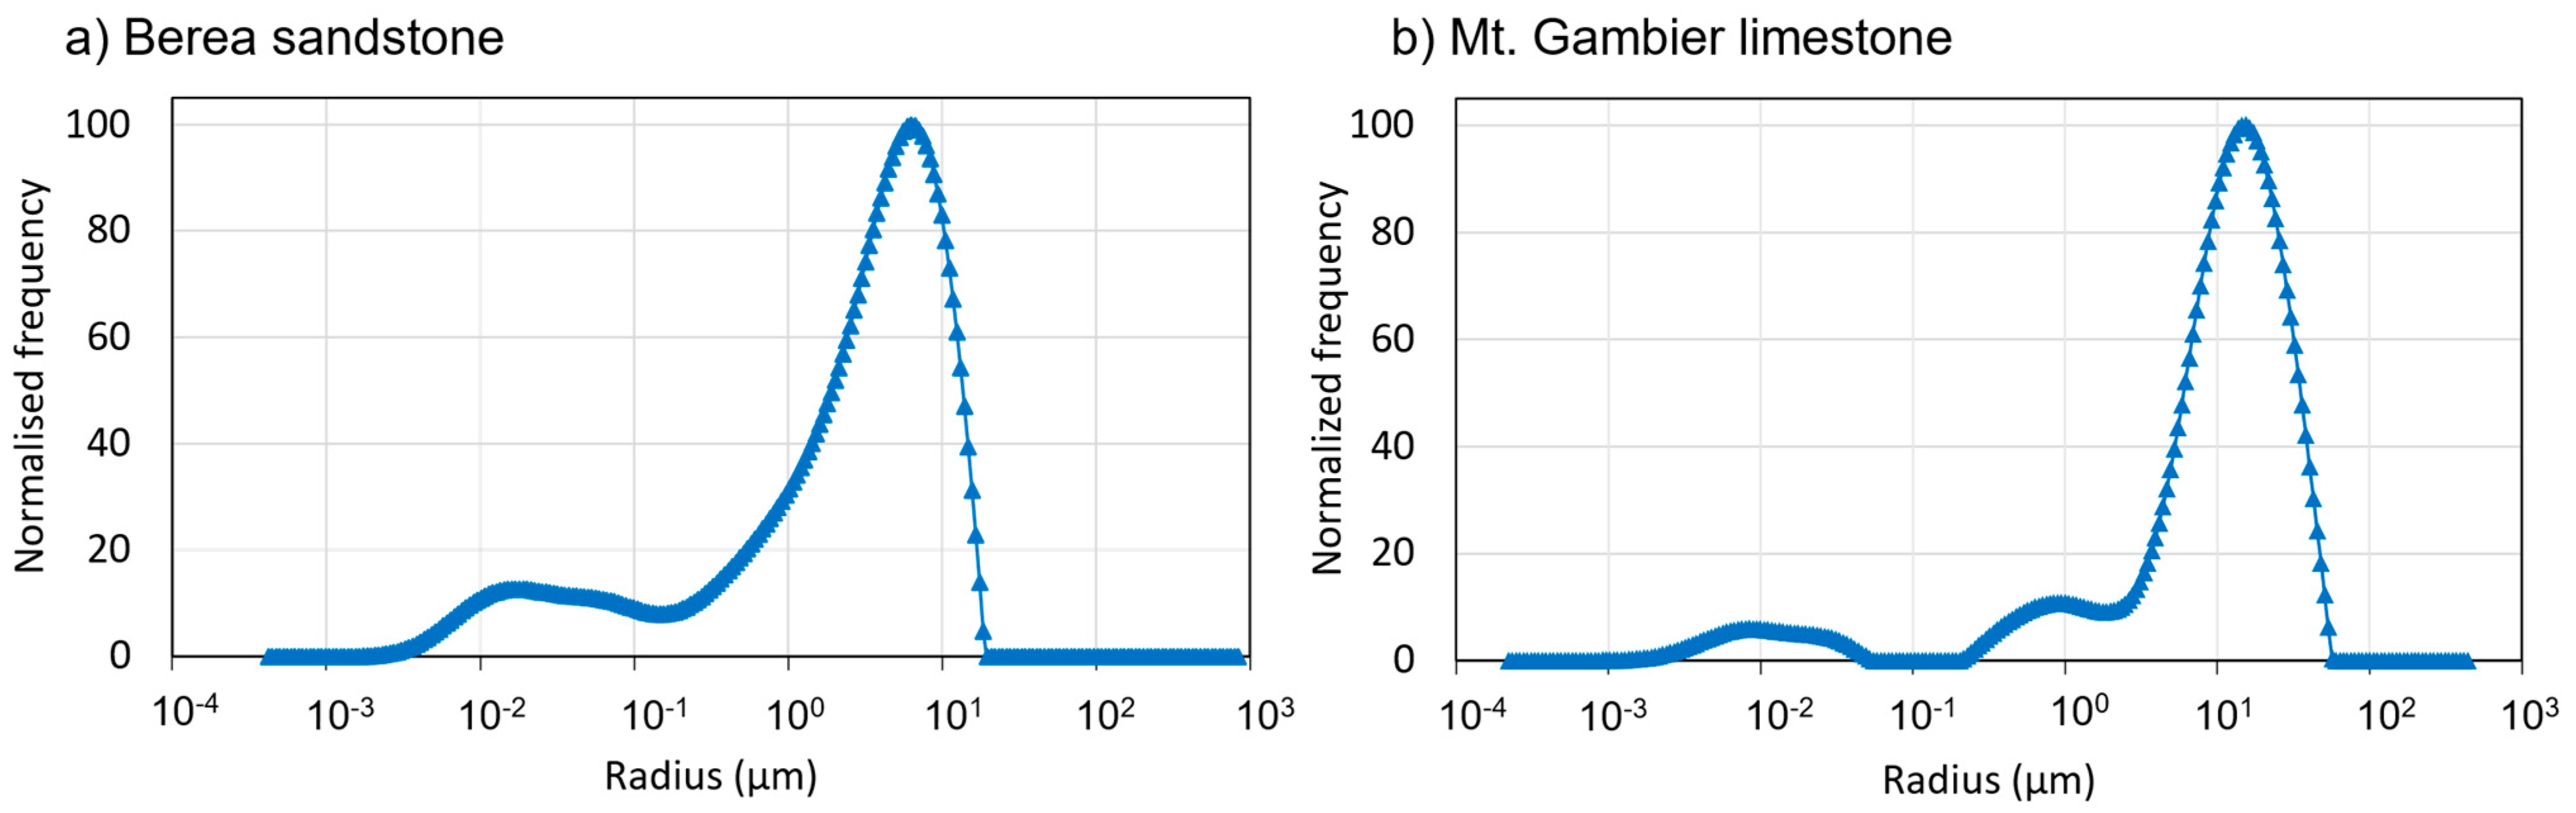
Figure 6.
The PSD with the assumption of two different models (cylindrical and spherical) for (a) Berea sandstone and (b) Mt. Gambier limestone.
Figure 6.
The PSD with the assumption of two different models (cylindrical and spherical) for (a) Berea sandstone and (b) Mt. Gambier limestone.
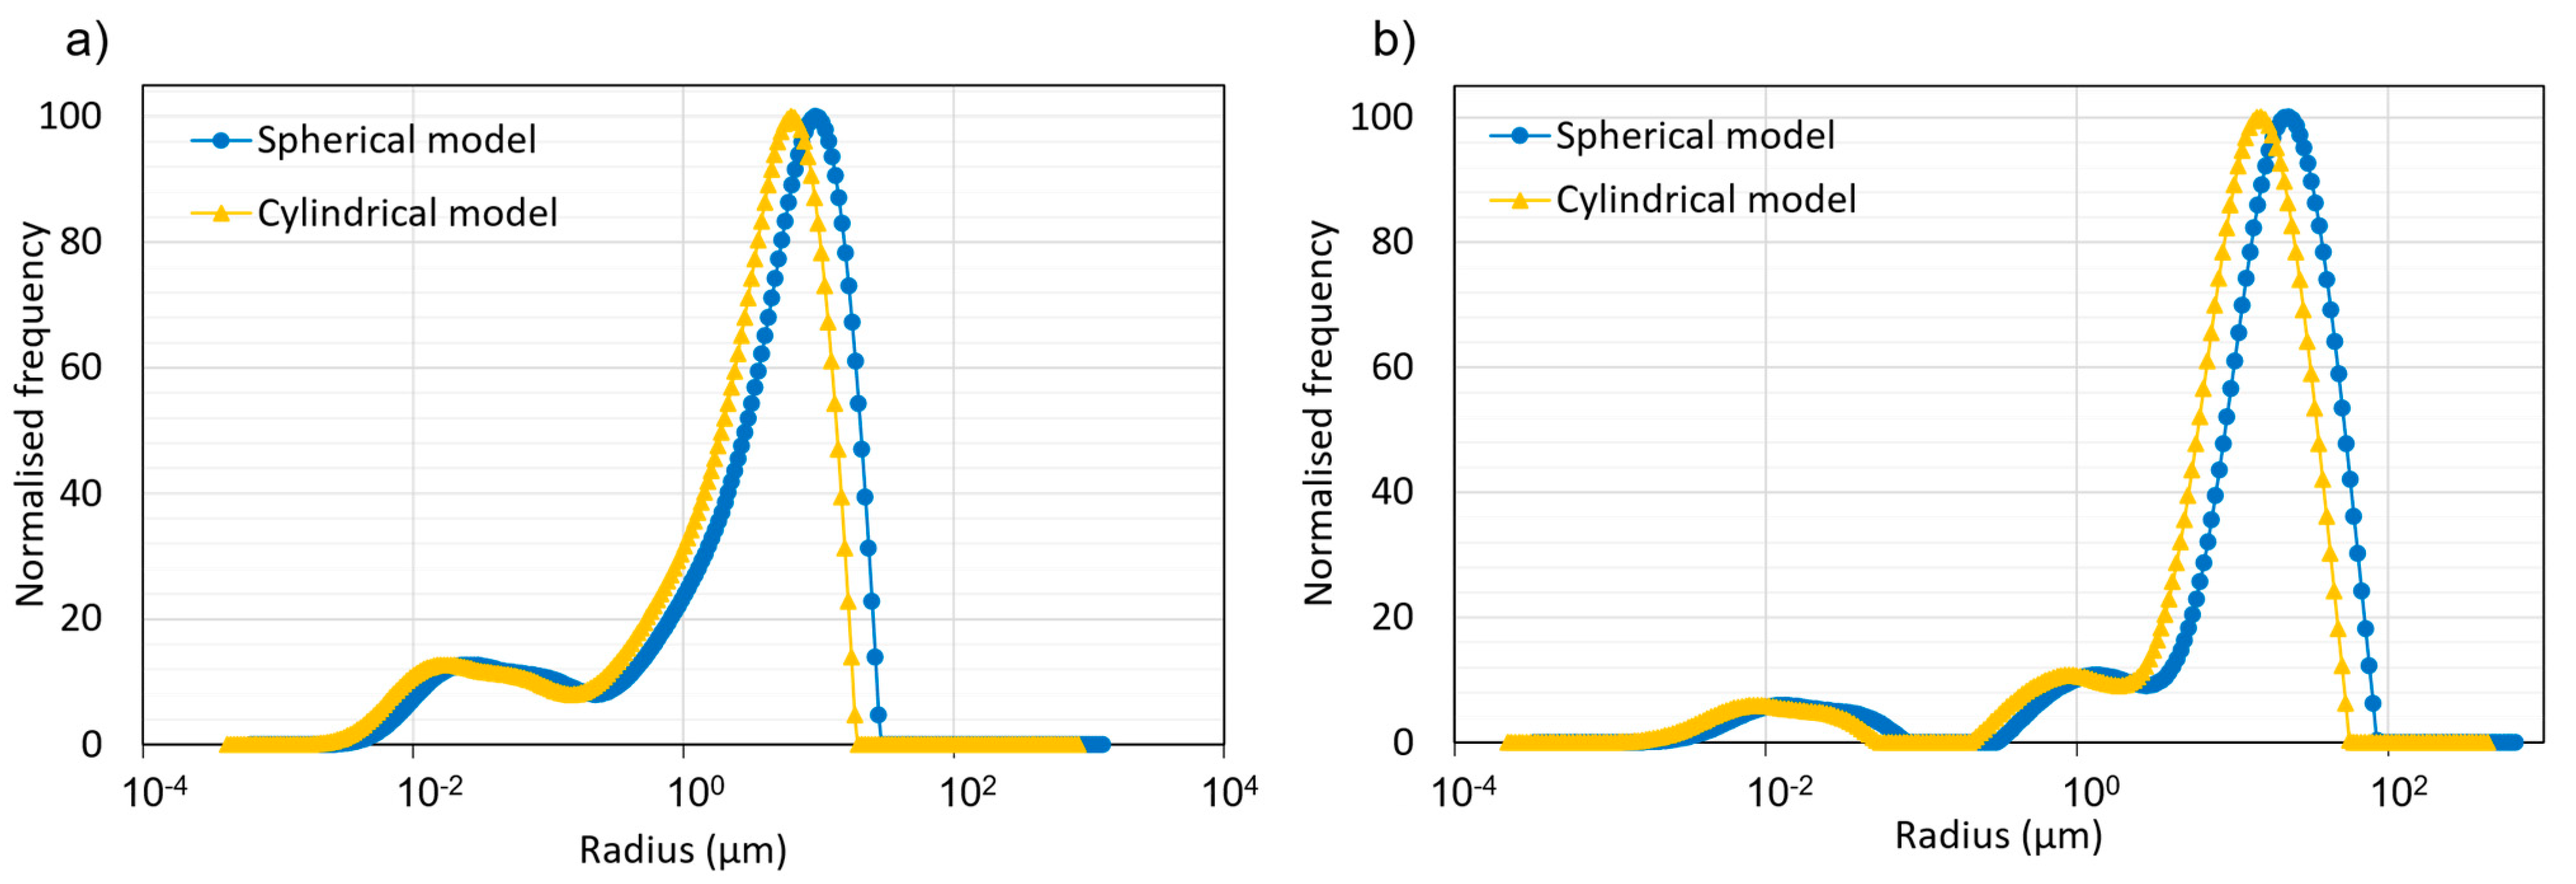
Figure 7.
The PSD for the Berea sandstone with the values of surface relaxivity taken from different literature sources.
Figure 7.
The PSD for the Berea sandstone with the values of surface relaxivity taken from different literature sources.

Figure 8.
Comparison between the pore-size distribution extracted from the micro-CT analysis and the NMR experiment of the Berea sandstone at a resolution of (a) 2.5 µm and (b) 7 µm.
Figure 8.
Comparison between the pore-size distribution extracted from the micro-CT analysis and the NMR experiment of the Berea sandstone at a resolution of (a) 2.5 µm and (b) 7 µm.
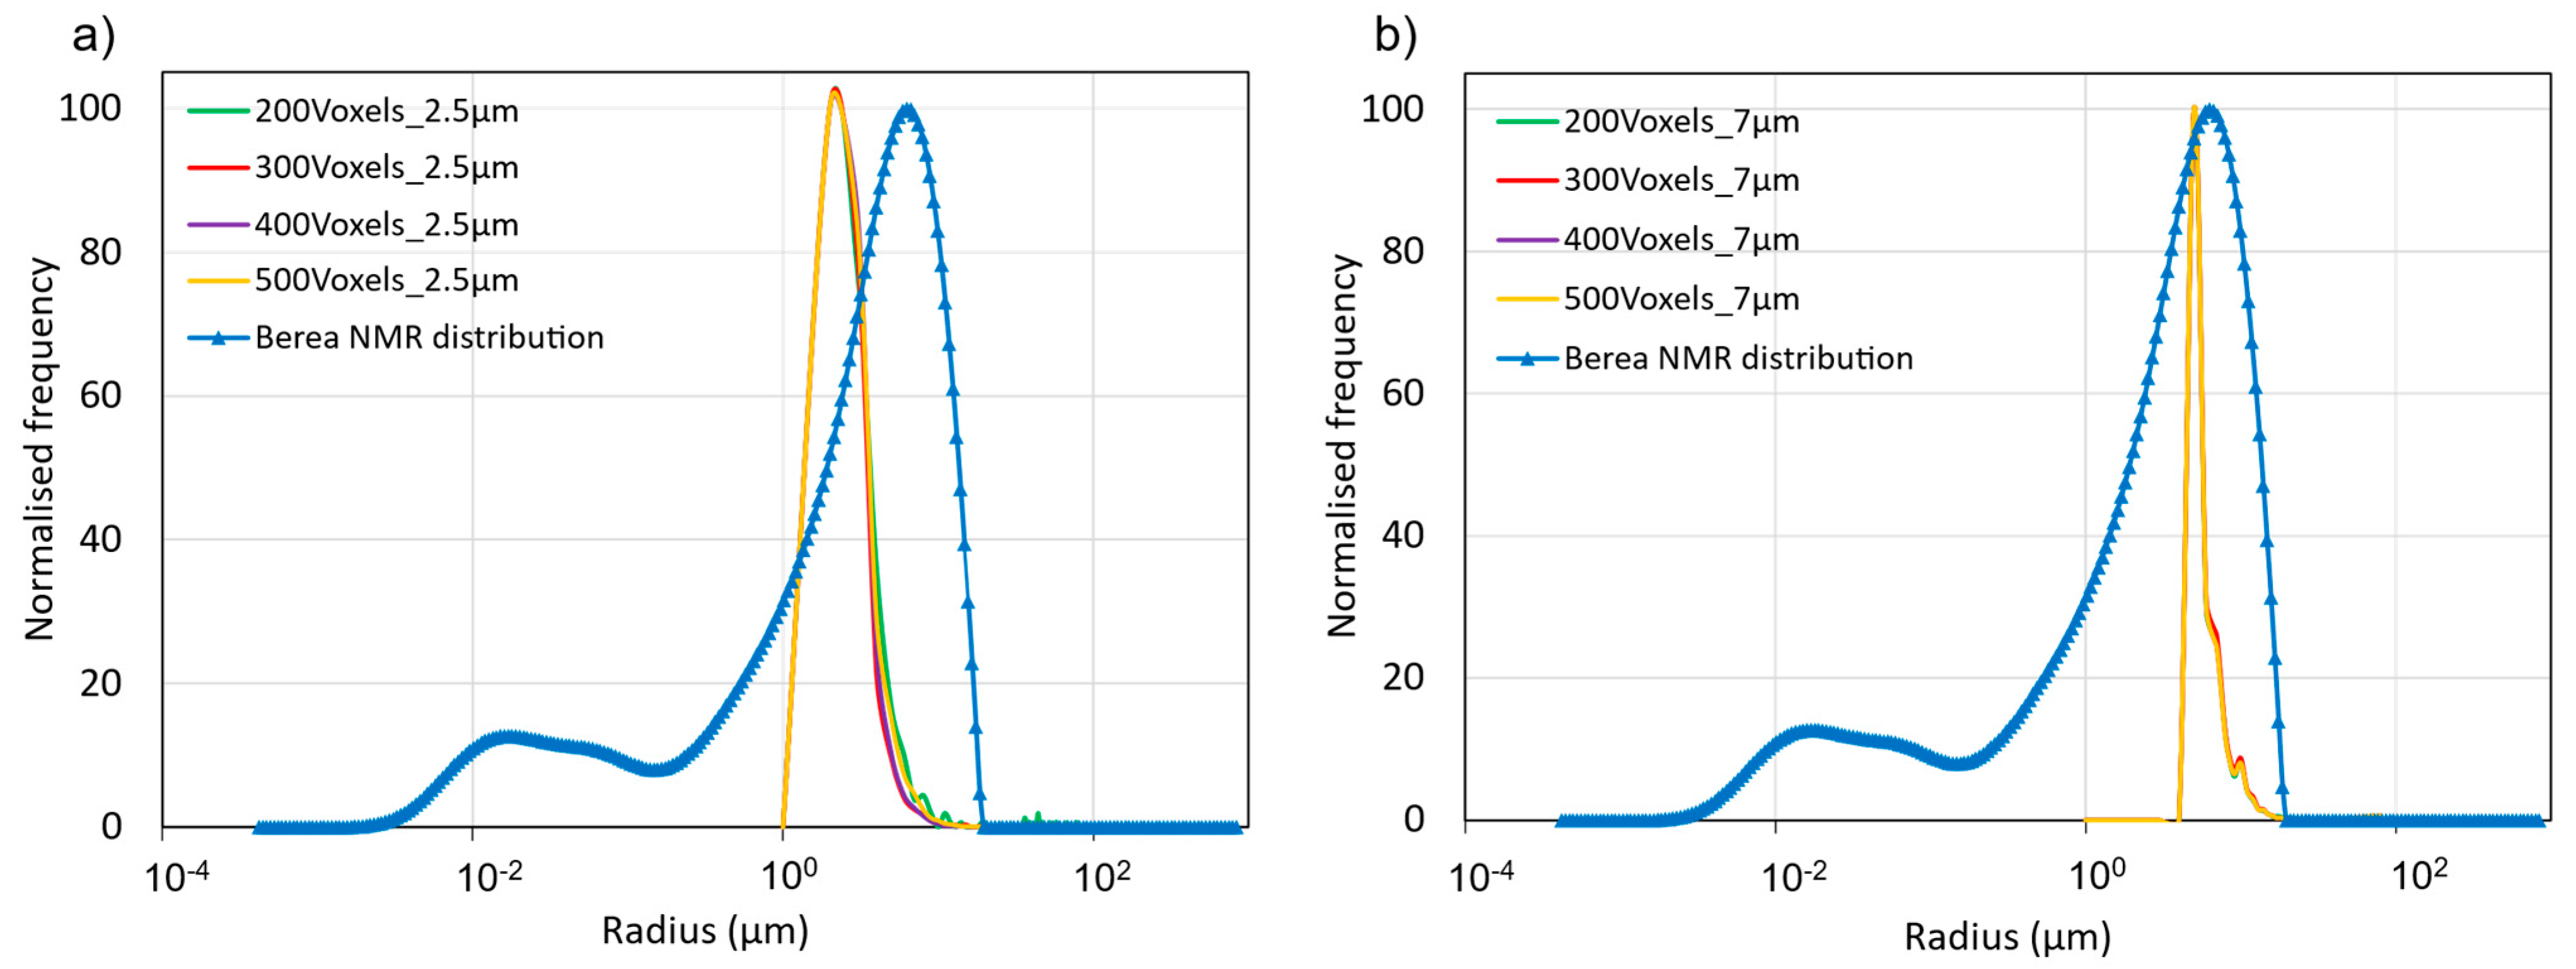
Figure 9.
Comparison of the pore-size distribution calculated from the NMR experiment and from micro-CT imaging of the Mt. Gambier limestone at a resolution of (a) 2.5 µm and (b) 7 µm.
Figure 9.
Comparison of the pore-size distribution calculated from the NMR experiment and from micro-CT imaging of the Mt. Gambier limestone at a resolution of (a) 2.5 µm and (b) 7 µm.
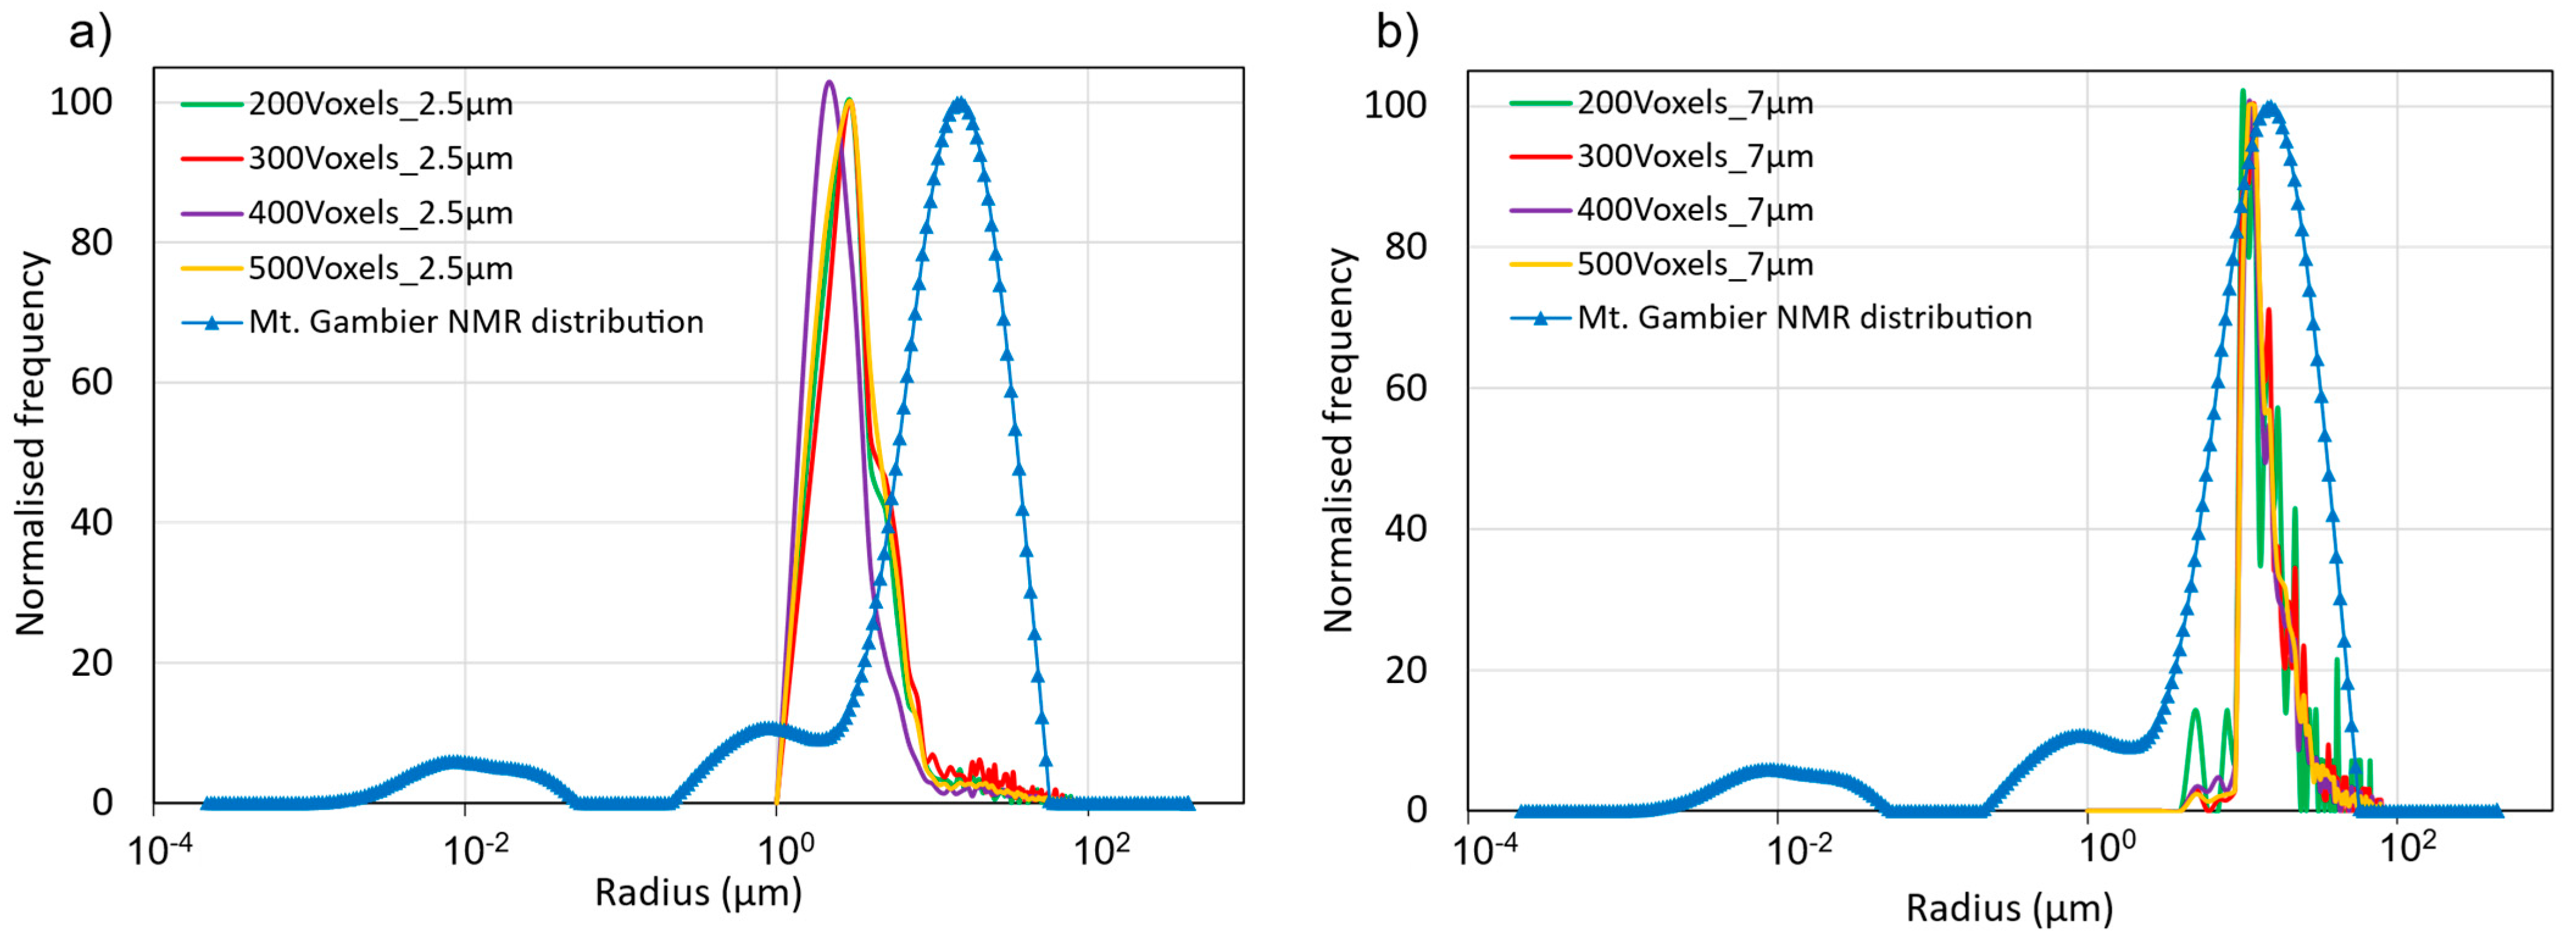
Figure 10.
The velocity distribution at a range of image resolutions and image sizes for the (a) Berea sandstone and (b) Mt. Gambier limestone.
Figure 10.
The velocity distribution at a range of image resolutions and image sizes for the (a) Berea sandstone and (b) Mt. Gambier limestone.
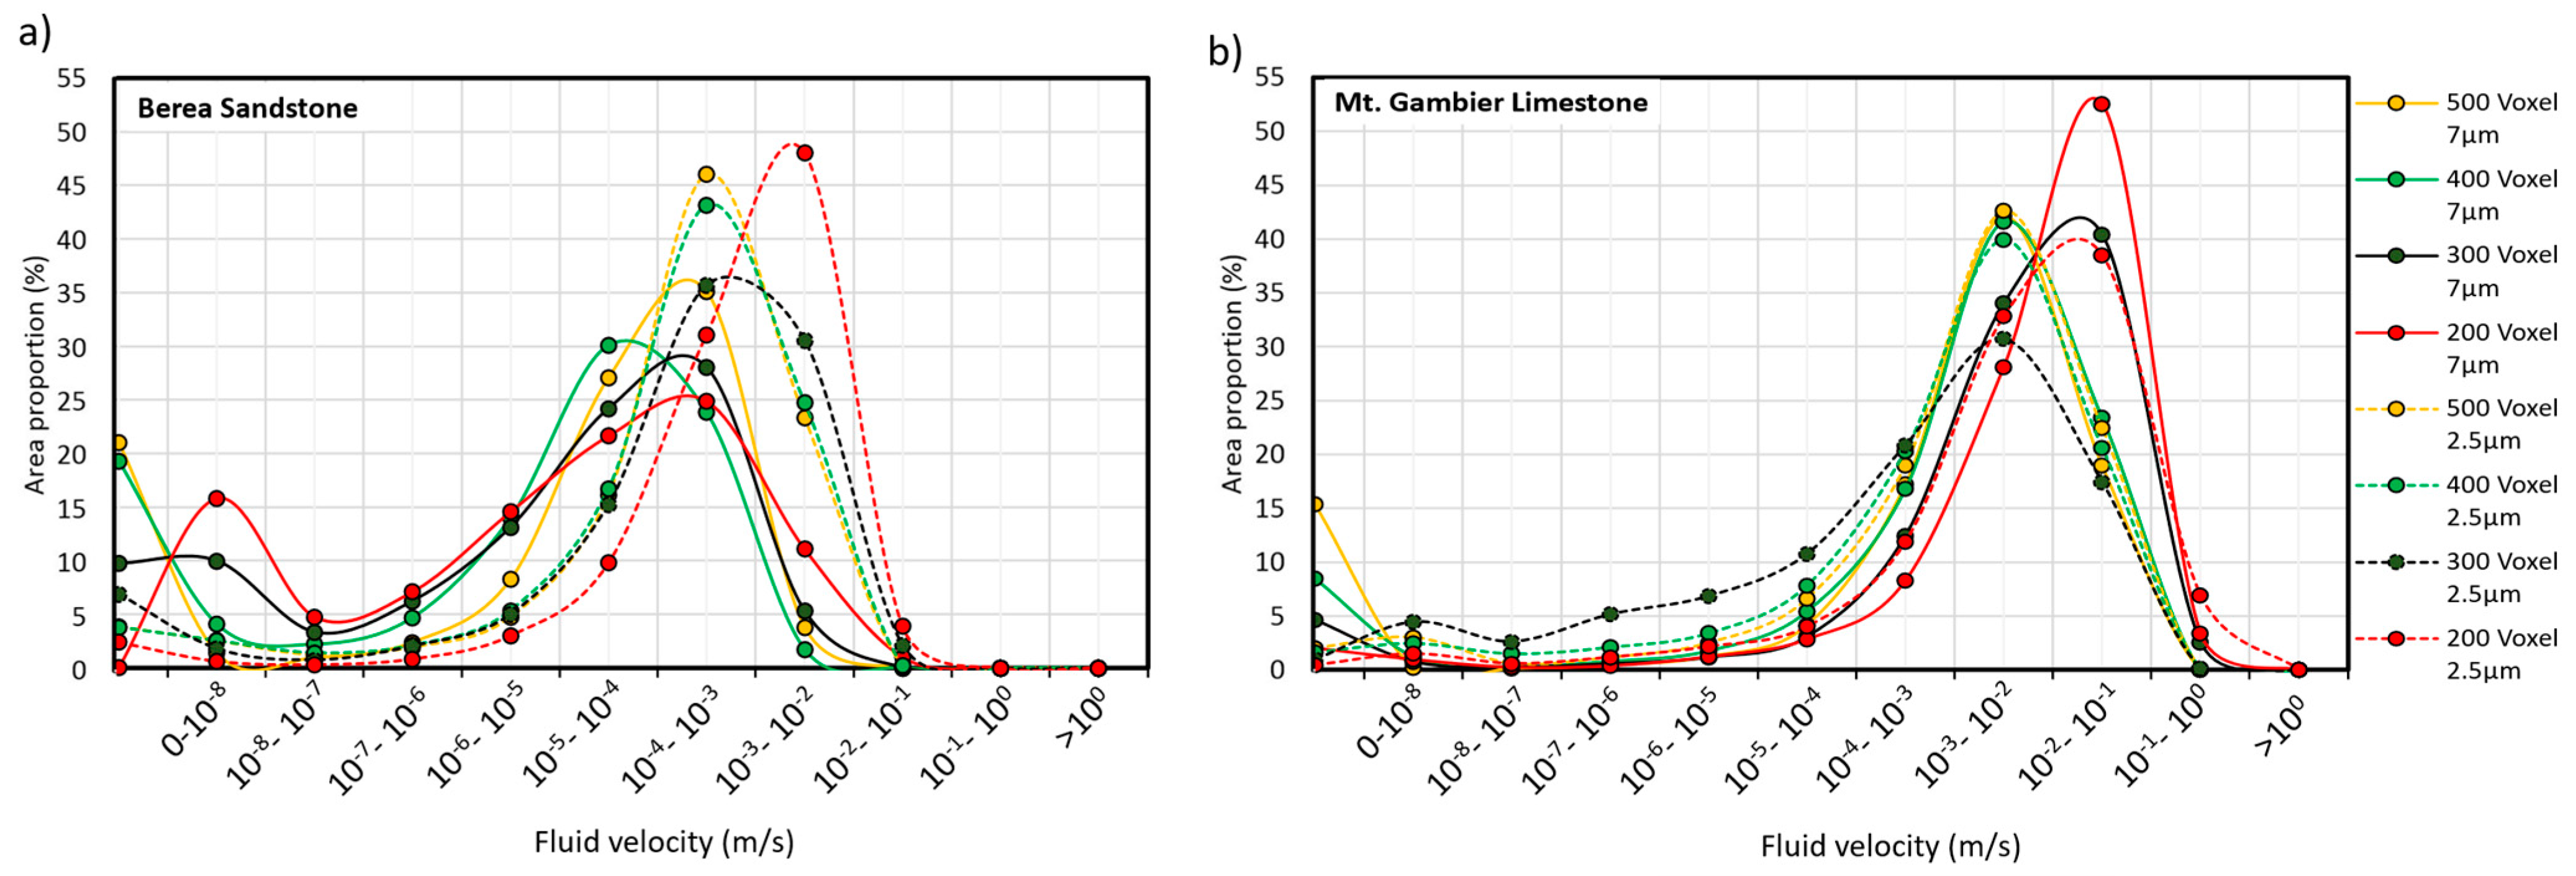
Figure 11.
The Péclet number distribution at a range of resolutions and image sizes for (a) Berea sandstone and (b) Mt. Gambier limestone.
Figure 11.
The Péclet number distribution at a range of resolutions and image sizes for (a) Berea sandstone and (b) Mt. Gambier limestone.
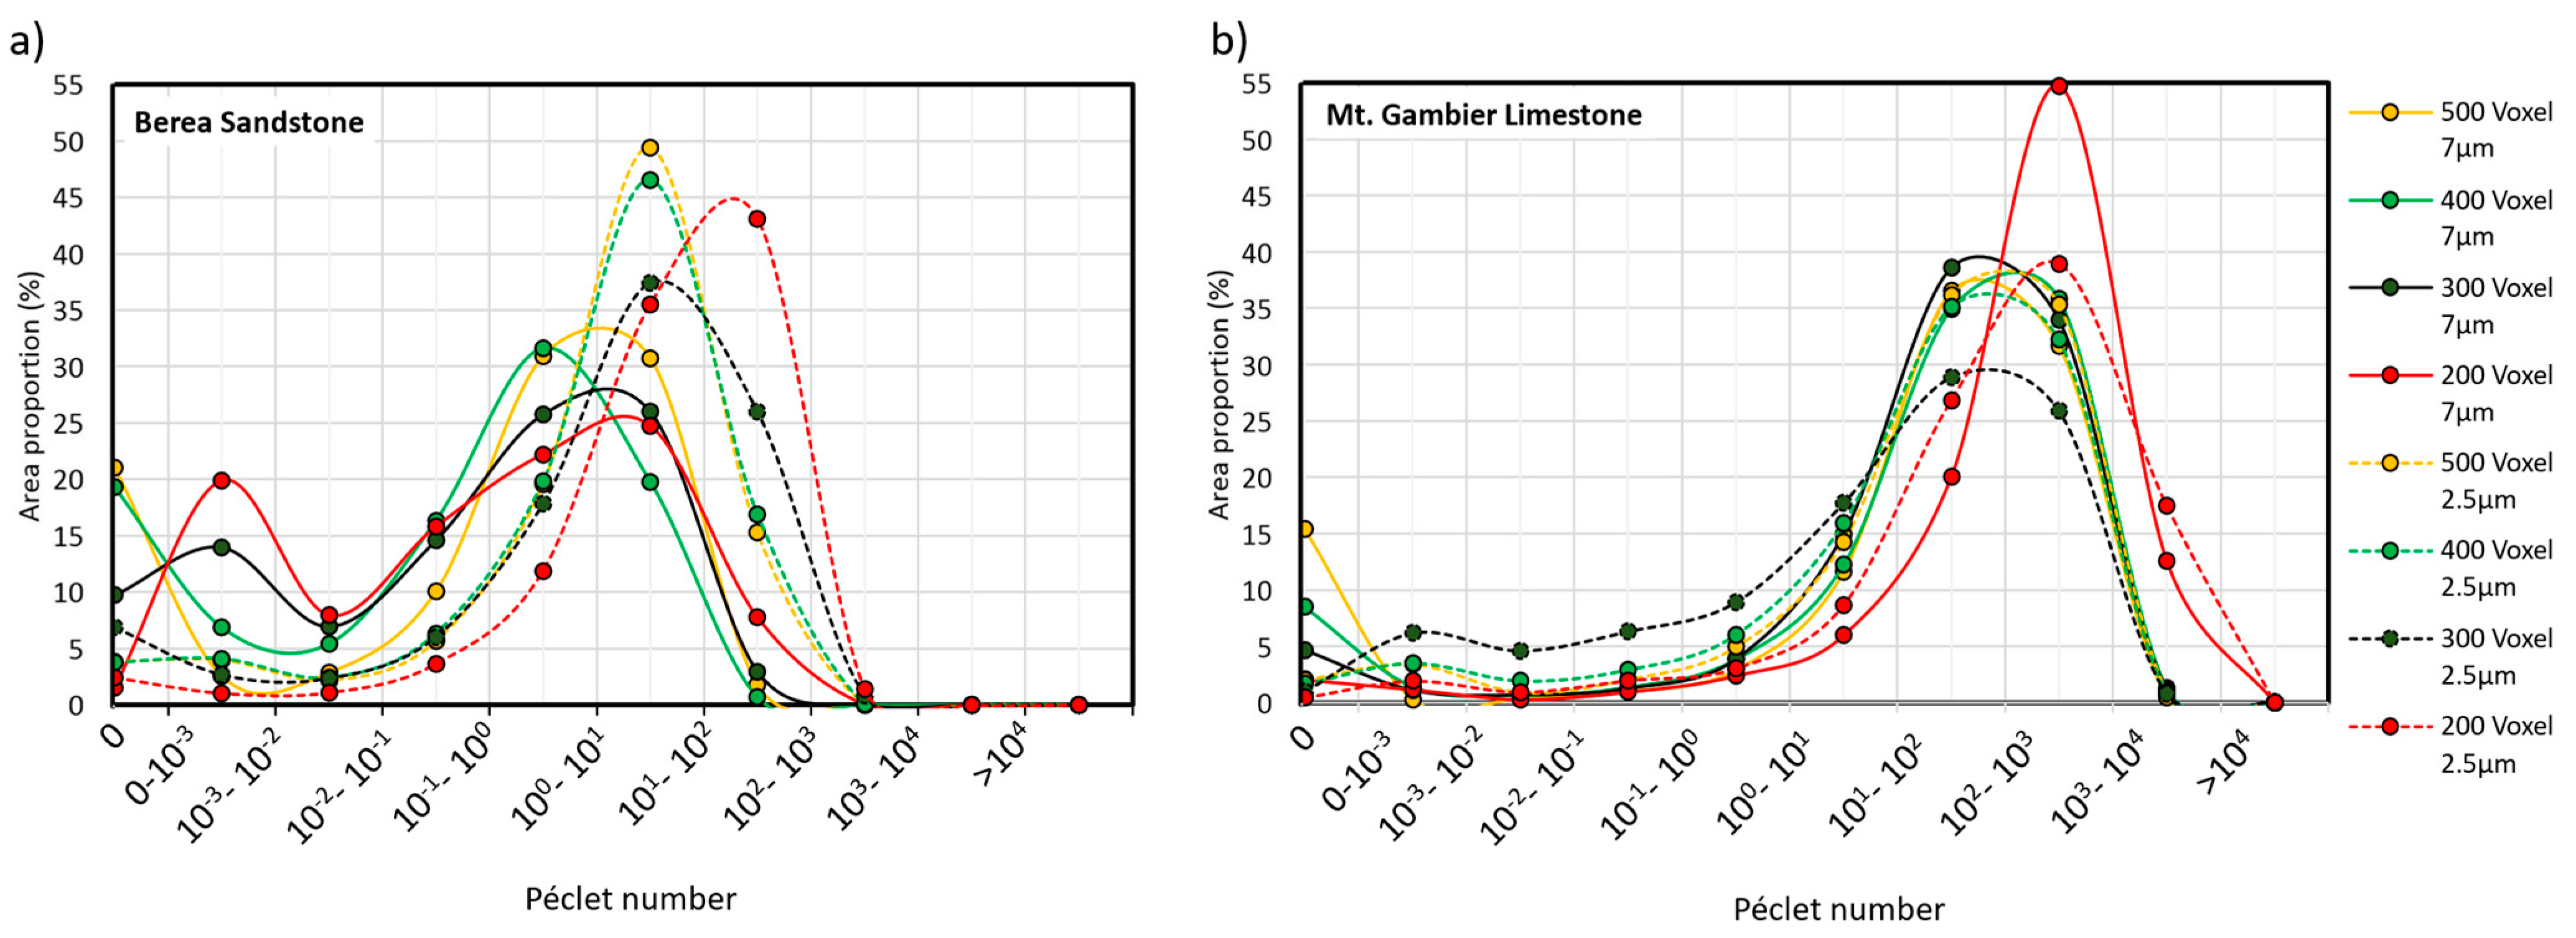
Figure 12.
The Porosity vs. Permeability graphs for (a) Berea sandstone and (b) Mt. Gambier limestone. The variations in the x and y ranges for both the rocks should be noted.
Figure 12.
The Porosity vs. Permeability graphs for (a) Berea sandstone and (b) Mt. Gambier limestone. The variations in the x and y ranges for both the rocks should be noted.
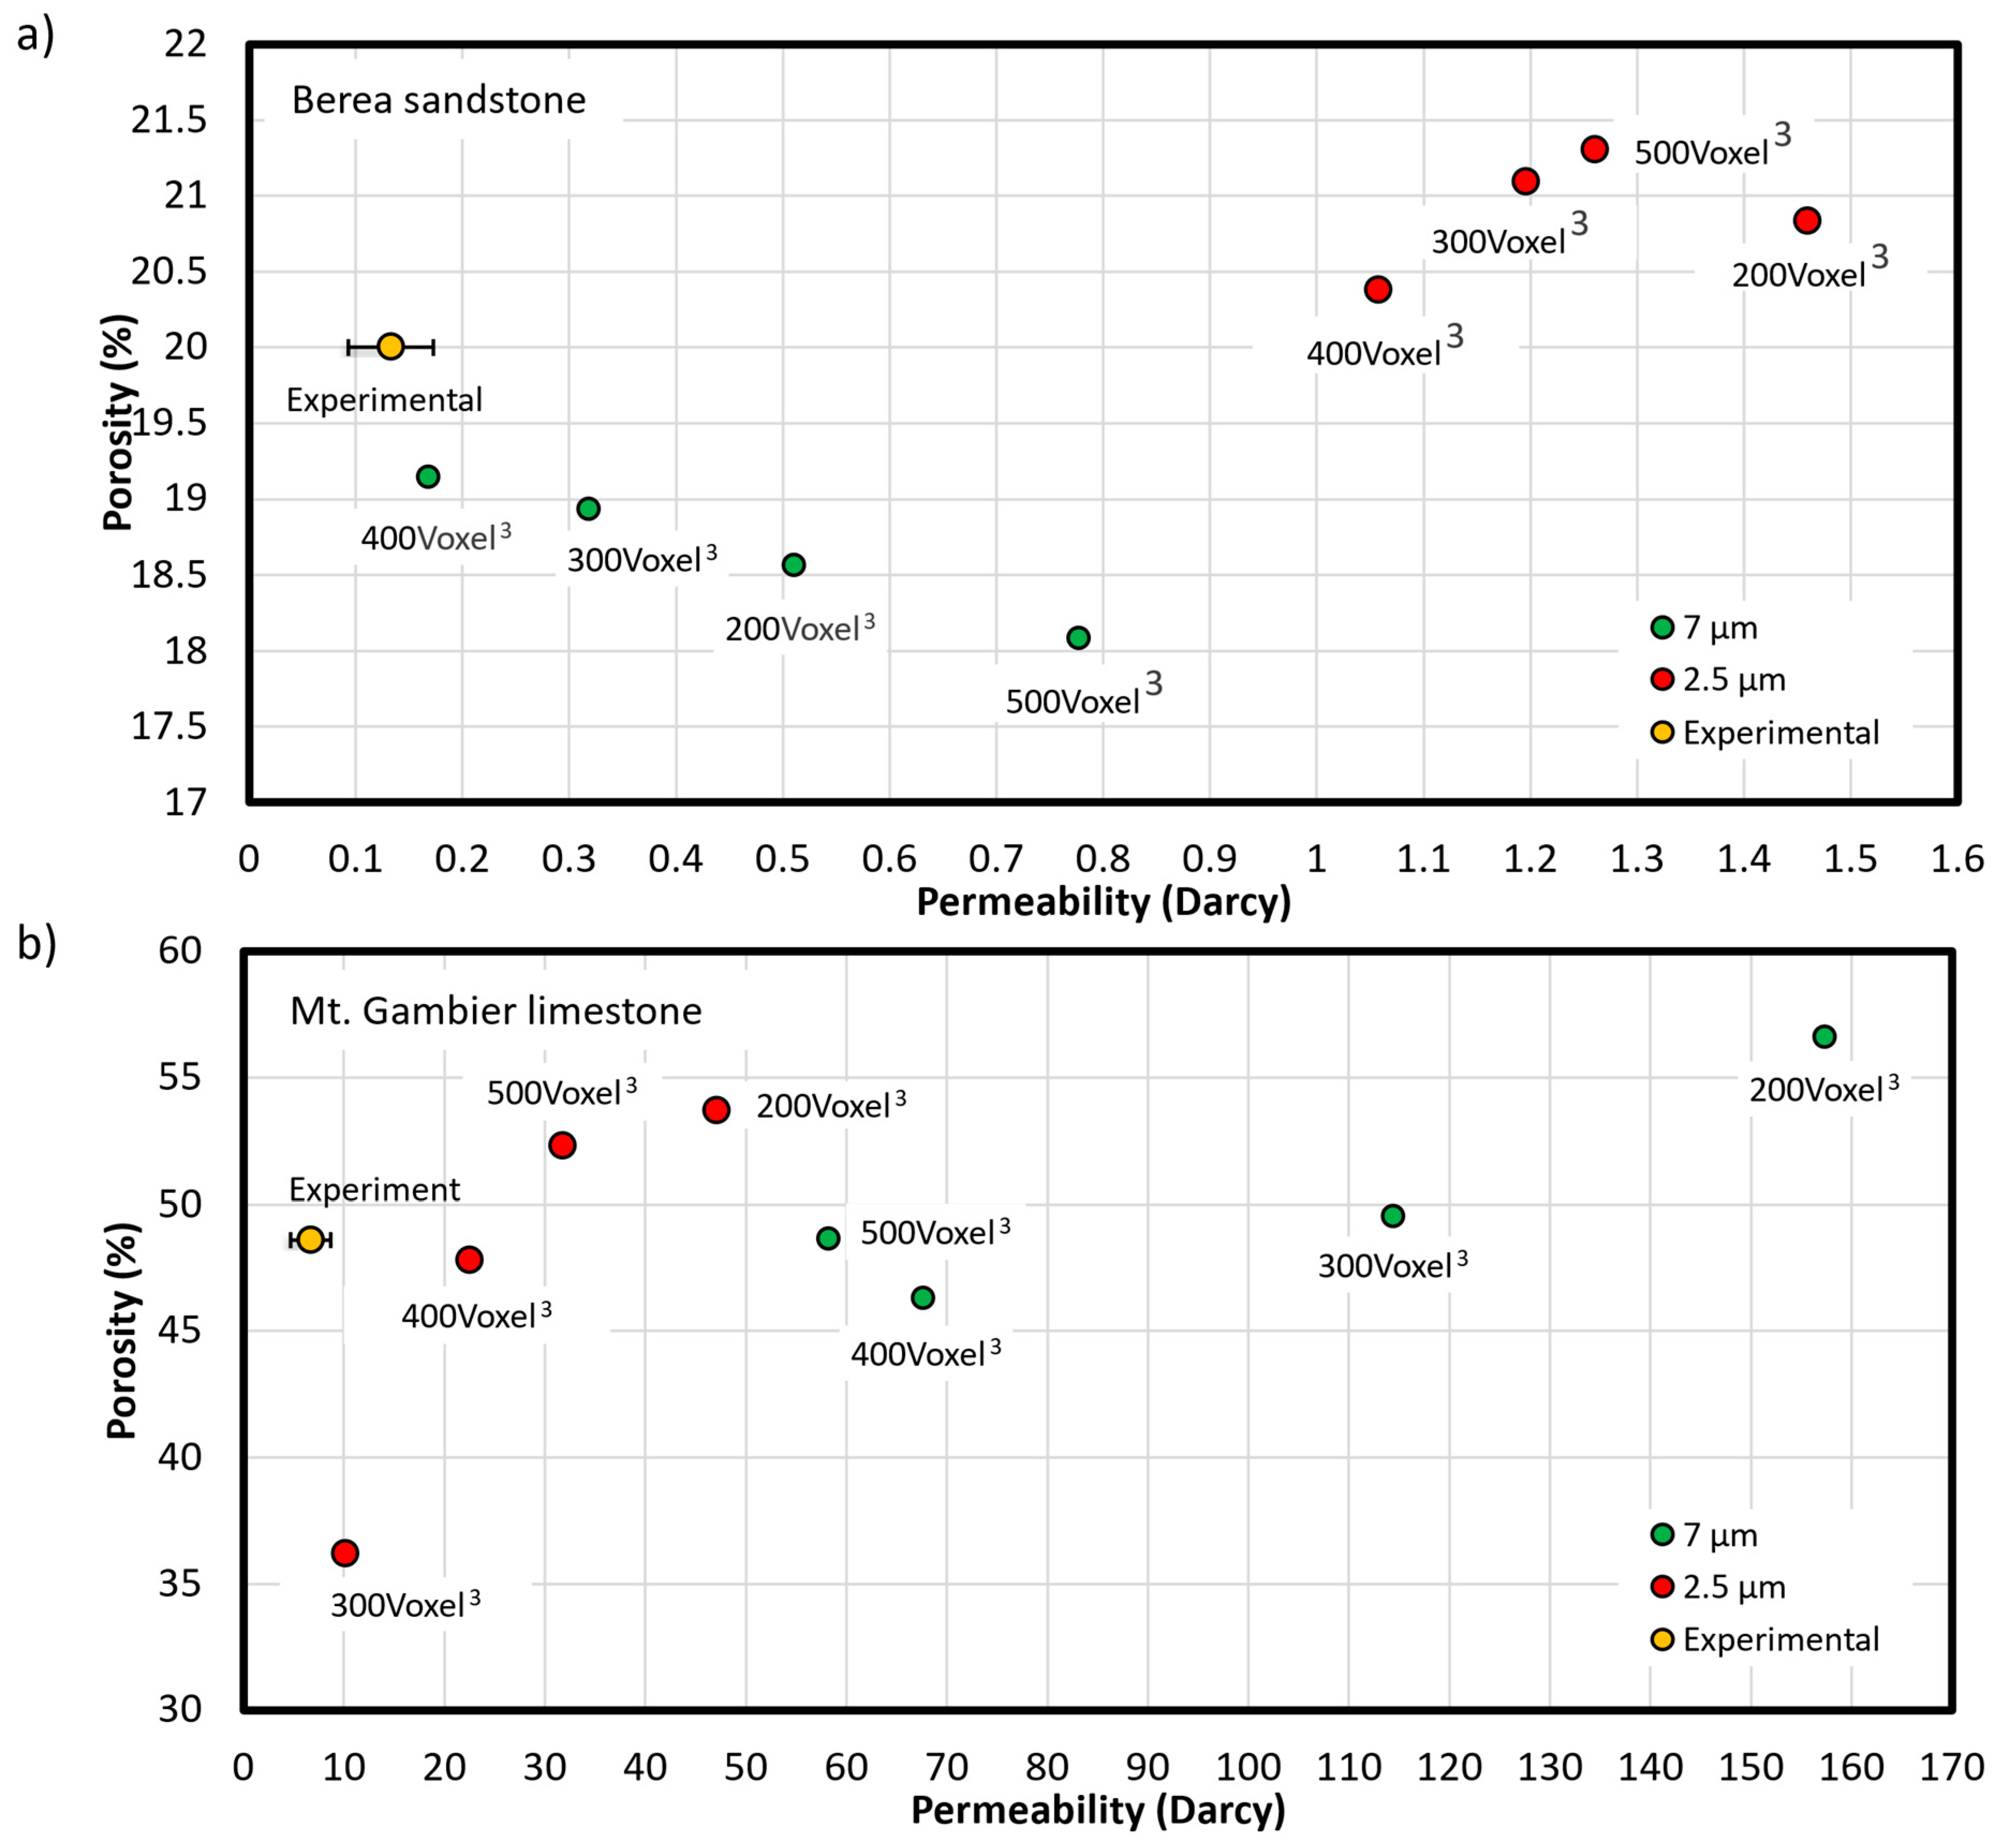
Table 1.
Micro-CT sample sizes and parameters used.
| Sample | Edge Length (cm) | Resolution (µm) | Voltage (kV) | Current (µA) |
|---|---|---|---|---|
| Berea sandstone | 0.5 | 2.5 | 50 | 200 |
| Mt. Gambier limestone | 0.5 | 2.5 | 60 | 180 |
| Berea sandstone | 1.0 | 7.0 | 60 | 440 |
| Mt. Gambier limestone | 1.0 | 7.0 | 90 | 200 |
Table 2.
Mesh parameters used for the pore scale flow simulations (V stands for Voxel).
| Rock Type | Resolution | Image Size | No of Elements | Volume (m3) | Surface Area (m2) |
|---|---|---|---|---|---|
| Berea sandstone | 2.5 | 200 V | 738,454 | 2.7235 × 10⁻¹¹ | 2.6271 × 10⁻⁶ |
| 300 V | 239,062 | 8.8521 × 10⁻¹¹ | 7.4899 × 10⁻⁶ | ||
| 400 V | 1,041,072 | 2.0212 × 10⁻¹⁰ | 1.779 × 10⁻⁵ | ||
| 500 V | 2,120,288 | 4.1872 × 10⁻¹⁰ | 3.4973 × 10⁻⁵ | ||
| 7.0 | 200 V | 749,039 | 3.6573 × 10⁻¹⁰ | 2.2838 × 10⁻⁵ | |
| 300 V | 463,106 | 1.2512 × 10⁻⁹ | 7.7618 × 10⁻⁵ | ||
| 400 V | 500,679 | 2.983 × 10⁻⁹ | 1.84 × 10⁻⁴ | ||
| 500 V | 1,871,878 | 8.0291 × 10⁻⁹ | 5.1268 × 10⁻⁴ | ||
| Mt Gambier limestone | 2.5 | 200 V | 975,063 | 6.8361 × 10⁻¹¹ | 3.4569 × 10⁻⁶ |
| 300 V | 1,829,047 | 1.5159 × 10⁻¹⁰ | 8.1782 × 10⁻⁶ | ||
| 400 V | 1,977,289 | 4.9799 × 10⁻¹⁰ | 2.6572 × 10⁻⁵ | ||
| 500 V | 2,214,421 | 1.0578 × 10⁻⁹ | 4.7336 × 10⁻⁵ | ||
| 7.0 | 200 V | 300,569 | 1.2478 × 10⁻⁹ | 3.055 × 10⁻⁵ | |
| 300 V | 433,198 | 4.9999 × 10⁻⁹ | 1.2159 × 10⁻⁴ | ||
| 400 V | 586,727 | 9.3742 × 10⁻⁹ | 2.5005 × 10⁻⁴ | ||
| 500 V | 637,333 | 1.9761 × 10⁻⁸ | 5.0654 × 10⁻⁴ |
Table 3.
Porosity values measured from various techniques.
| Analysis | Berea Sandstone | Mt. Gambier Limestone | |||||||
|---|---|---|---|---|---|---|---|---|---|
| NMR | 16.6% | 45.20% | |||||||
| Water Saturation Experiment | 20.0% | 48.6% | |||||||
| 200 Voxel3 | 300 Voxel3 | 400 Voxel3 | 500 Voxel3 | 200 Voxel3 | 300 Voxel3 | 400 Voxel3 | 500 Voxel3 | ||
| Micro-CT | 2.5 µm | 20.83% | 21.09% | 20.38% | 21.3% | 53.7% | 36.2% | 47.8% | 52.3% |
| 7.0 µm | 18.56% | 18.92% | 19.13% | 18.08% | 49.5% | 56.5% | 46.29% | 48.62% | |
Publisher’s Note: MDPI stays neutral with regard to jurisdictional claims in published maps and institutional affiliations. |
© 2021 by the authors. Licensee MDPI, Basel, Switzerland. This article is an open access article distributed under the terms and conditions of the Creative Commons Attribution (CC BY) license (https://creativecommons.org/licenses/by/4.0/).
Share and Cite
MDPI and ACS Style
Jyoti, A.; Haese, R.R. Comparison of Petrophysical Properties of Porous Rocks Using NMR, Micro-CT, and Fluid Flow Simulations. Geosciences 2021, 11, 500. https://doi.org/10.3390/geosciences11120500
AMA Style
Jyoti A, Haese RR. Comparison of Petrophysical Properties of Porous Rocks Using NMR, Micro-CT, and Fluid Flow Simulations. Geosciences. 2021; 11(12):500. https://doi.org/10.3390/geosciences11120500
Chicago/Turabian StyleJyoti, Apoorv, and Ralf R. Haese. 2021. "Comparison of Petrophysical Properties of Porous Rocks Using NMR, Micro-CT, and Fluid Flow Simulations" Geosciences 11, no. 12: 500. https://doi.org/10.3390/geosciences11120500
Note that from the first issue of 2016, this journal uses article numbers instead of page numbers. See further details here.