A Possible Tsunami Deposit Associated to the CE 1755 Lisbon Earthquake on the Western Coast of Portugal


1
Centro de Estudos Geográficos, Instituto de Geografia e Ordenamento do Território, Universidade de Lisboa, Rua Branca Edmée Marques, 1600-276 Lisboa, Portugal
2
Departamento de Ciências da Terra, Universidade de Coimbra- Pólo II, Rua Sílvio Lima, 3030-790 Coimbra, Portugal
3
Instituto Dom Luiz, Faculdade de Ciências, Universidade de Lisboa, Campo Grande, 1749-016 Lisboa, Portugal
*
Author to whom correspondence should be addressed.
Geosciences 2020, 10(7), 257; https://doi.org/10.3390/geosciences10070257
Submission received: 12 May 2020
/
Revised: 21 June 2020
/
Accepted: 1 July 2020
/
Published: 3 July 2020
(This article belongs to the Special Issue Geomorphological and Sedimentological Imprints of Storm Events)
Abstract
:The CE 1755 Lisbon tsunami was the largest historical tsunami to affect the Atlantic coasts of Europe and North Africa. This study presents the results obtained from the application of different sedimentological techniques (e.g., grain size, morphoscopy, microtextural analysis, geochemistry, radiocarbon dating) on sediments retrieved from the Alcabrichel River alluvial plain (of about 500 m far away from its mouth and approximatively 50 km northwest of Lisbon, Portugal). The results allowed the identification of a sandy layer that was associated with the CE 1755 tsunami. Furthermore, a new microtextural semi-quantitative classification was applied to enhance the identification of extreme marine inundation deposits. Based on sedimentological data, three different tsunami inundation phases were identified, including two inundations and a likely backwash. This innovative work offers physical evidence of the spatial presence of the CE 1755 tsunami event on the western coast of Europe. It also enables a reconstruction of tsunami inundation dynamics, with two flooding waves and an interspersed backwash.
1. Introduction
Over the last three decades, the number of paleotsunami studies has increased significantly, providing new perspectives on tsunami inundation dynamics. These new perceptions were achieved through the application of diverse multiproxy analysis that allowed robust reconstruction of tsunami inundation and backwash phases [1,2,3,4,5,6,7,8,9,10,11,12,13,14,15].
The most important and studied tsunami in Portugal was generated by the CE 1755 Lisbon earthquake, with an estimated magnitude of 8.5 (8.5–9 according to [16] and an estimated wave height of 4.28 m in Lisbon [17]). However, the numerical model applied for the validation of the historical evidence in the study area [18] estimated an inundation depth greater than 4 m in height, reaching more than 10 m at the Porto Novo beach and its vicinity. These results, based on the variation in the water levels with the time, showed that in Porto Novo there was indeed a local amplification by the cliffs. Deposits of the CE 1755 tsunami are very well-preserved in the southwestern Iberian Peninsula, namely along the Algarve coast (Boca do Rio, Martinhal, Ria Formosa, and Salgados) and were identified mainly using lithostratigraphic criteria [19,20,21]. Possible records of the CE 1755 tsunami were also found in the western Portuguese coast, on the Óbidos Lagoon [22] and on the Tagus river estuary [23,24], as well as in the form of chaotic and heterometric pebbles and disturbed heavy mineral sandy layers in the urban area of Belém, in the Lisbon county [25,26]. Tsunami deposits can have a specific textural composition [5,11,24,27,28,29,30], with a bimodal grain size distribution [25,26,31,32], providing information about the provenance of this material. Many authors [30,33] reported differences between textural characteristics of the tsunami sands from Martinhal and Boca do Rio (Algarve coast) when compared to the actual beach and dune sands, suggesting an added source for the coarser sediments, which essentially consisted of shell fragments and gravel. Geochemistry and paleontology are also used as proxies in the recognition and characterization of paleotsunami deposits and inland inundation [8,9,10,34]. In addition, microtextural and morphoscopic analyses are often applied to further understand the hydrodynamic processes occurring during tsunamis and to establish provenance relationships [35,36,37,38,39], although the results remain controversial [40,41].
This study aims to present an innovative tool to identify tsunami origin of deposits in a vertical sequence of sediments (in cores or ditches), using a multiproxy approach, with lithostratigraphic, textural, geochemical, morphoscopic and exoscopy techniques, and a new classification of microtextural features identified on quartz grains. The relevance of this multiproxy approach, complemented with radiocarbon dating, enables differentiation of tsunami deposits from storm deposits.
2. Regional Setting
The study area is located in the Alcabrichel River estuary (Figure 1). The Alcabrichel River appears on the western slope of Serra de Montejunto and flows to the Porto Novo beach (Figure 1). According to historical archives, Porto de Novo is known to have been strongly affected by the CE 1755 tsunami [42].
The area of the Alcabrichel Basin is approximately 180 km2. The basin is tectonically complex with the presence of two diapiric structures (Diapirs of Maceira and Santa Cruz), associated with Cenozoic (global and regional) compressive regimes. The dominating source of material is the Jurassic formations (57.2%) relative to the Cretaceous and Cenozoic (29.9% and 12.9%, respectively) formations. This area has low lithological diversity, mainly represented by sandstones, clays, and limestone, responsible for the confinement of the diapiric depressions and the vigorous limestones ridges that border it. The great geomorphological diversity has resulted from tectonic constraints and differences in rock erosion. In each Diapirs, the plain widens forming an inner alluvial plain about 1 km wide and a coastal alluvial plain connected to Porto Novo Beach. The two sections of the alluvial plain are divided by a limestone ridge (Cabeços de África and Pereira in Figure 1). The Porto Novo Beach, at the mouth of the Alcabrichel River, is confined between the two rocky promontories to the N and S and it is a beach-dune system with greater extension to the south, near Sta. Rita site (Figure 1).
Tides along the western Portuguese coast range between 2 and 4 m, corresponding to a mesotidal regime, with the influence of semidiurnal and regular tides felt in a large part of the estuary [43]. The region is dominated by a high energy wave regime in winter with a predominant direction from NW, in 80% of occurrences throughout the year [44]. Some winter storm episodes on the western Portuguese coast have been described [44,45,46,47,48] with the significant wave height (HS) reaching 8.5 m and the maximum height (Hmax) about 15 m. On the other hand, storm surges that reached about +1.17 m in December 1991 [49,50] were reported in Aveiro (central western coast).
3. Materials and Methods
Within the alluvial plain of the Alcabrichel River (with two sections divided by a limestone ridge, Figure 1) several cores were drilled in the inner section, while one was obtained in the seaward section. The latter, located on the extreme northeast of the Santa Rita-Porto Novo embayment, displayed distinctive stratigraphic units and was selected for further analysis.
The sediment core (CF2: +3.58 to −1.43 m above mean sea level (msl)) was retrieved using a vibracore. Sediments were subsampled at 1 cm intervals, except for the last 125 cm at the base of the core, where insufficient sediment retrieved forced a 2 cm resolution sampling interval. The 325 samples were treated for grain size analysis, using a combination of sieving for sediments >63 μm (<4 ϕ) at 0.5 ϕ interval, and X-ray sizing through a Sedigraph for sediments <63 μm. Commonly used statistical parameters were obtained with SEDPC software [51,52,53] and the Folk and Ward method [54] enabled the evaluation of grain size statistical distribution. Organic matter content (O.M.) was determined using 2 g of sediment through Loss of Ignition (LOI) following [55]. Carbonate content was determined by the gasometrical method using an Eijkelkamp calcimeter. Ten sediment samples, each corresponding to a sediment thickness of 1 or 2 cm, were radiocarbon dated using Accelerator Mass Spectrometry (Beta Analytic Lab.) to establish a chronological framework. The absolute calendar date was obtained using statistical models based on Bayesian statistics to build up the deposition models [56]. The calibration dates were derived using OxCal software (Version 4.1) with IntCal09 radiocarbon calibration curves [57], which allows the incorporation of the stratigraphic sequence on the data set analysis. In this modeling, chronological data are associated with the stratigraphic sequence and, consequently, with the depth [58]. The Bayesian model used in this study allowed the chronological data and the sedimentation rates to be obtained, and possible outliers to be identified [59]. The time intervals were accurately determined for the boundaries of the different units and subunits recognized in the sedimentary column [56]. Outliers were excluded from the model—namely, Beta-349150 (7340 ± 40 BP) and Beta-346151 (6730 ± 40 BP)—as they present a large random error, generated by the linear model under consideration [56,60].
Ten bulk samples from the sedimentary section between 13 and 139 cm below the surface were used for geochemical analysis through inductively coupled plasma (i) mass spectrometry (ICP-MS) and (ii) optical emission spectrometry (ICP-OES) at the Actlabs (Activation Laboratories Ltd., Kamloops, BC, Canada). The lowermost unit was excluded from the geochemical analysis due to temporal disagreement with the possible CE 1755 tsunami. The samples were previously lyophilized and grinded with a mortar and pestle and submitted to sodium peroxide fusion methods following the Actlabs protocol. Semi-quantitative data for a total of 55 elements (5 major elements, 3 minor elements and 47 trace elements) were obtained, but only 17 elements (Al, Ca, Fe, Mn, K, Ti, Rb, Mg, Cs, Cu, Zn, Pb, Ce, Co, Sr, Ba, and S) are present in this study.
Thirty-one samples from distinct lithostratigraphic units were also analyzed under a binocular magnifying lens (Nikon, X90). A total of 3202 sedimentary particles, belonging to the 125–500 µm (1ϕ and 3ϕ) grain-size fraction were observed and classified as either quartz, lithic, or bioclastic material. Lithic material includes all terrigenous particles, heavy minerals, and micas. Furthermore, based on the visual observation, quartz grains were further classified in terms of roundness, sphericity, and superficial appearance. Six classes were used for roundness—from 0 to 5 (adapted from [61]; from well-rounded (0) to very angular (5), while sphericity was classified according to four classes suggested by [62] from 0 to 3 (where 0 is low sphericity and 3 high). Regarding superficial aspects, the quartz grains were distinguished as shiny, frosted, “clean”, coated with iron oxide, and perforated (with “cavity”). Measures of central tendency (average and median) were calculated to facilitate the graphical representation of attributes for each lithostratigraphic unit.
Additionally, microtextural analysis was performed on 12 samples collected between 100–40 cm below the surface. Photomicrographs were taken on 259 quartz grains, randomly collected from 125 to 500 µm (1ϕ to 3ϕ) grain-size fraction interval, using an SEM instrument (JEOL JSM 5200 LV; FCUL, Lisbon, Portugal). As discussed by [21], the minimum number of grains necessary for sedimentological interpretations must be above 15 per sample for the data to be statistically viable.
Microtextural imprints were identified on quartz grains and classified based on previous studies [21,37,39,41,63]. A set of microtextures produced by mechanical and chemical processes were identified on the surface of quartz grains and grouped into 4 main families (fresh surfaces, percussion marks, dissolution, and adhering particles) according to [41] and [21,63]. In addition, quartz grain microtopography (i.e., relief) was defined as a complementary attribute. For this attribute, a quantitative scale from 1 to 3 was used as suggested by [37], where 1 is low, 2 is medium, and 3 is high relief. In contrast with former studies which often used the percentage of each microtexture from the grain’s surface [21,36,63], here we applied a new semi-quantitative classification for the microtextural features. Hence, each grain was classified according to the most recent microtextural feature imprinted on the grain’s surface, i.e., the last mark that was acquired by the grains before their deposition.
Finally, to facilitate interpretation of the results, statistical analyses (principal component analysis—PCA) were conducted using Statistica 10 software. This was performed on 12 samples previously classified based on the microtextural features identified on quartz grains.
In order to provide the location of core CF2 and other cited sites, a map was drawn up, using a digital elevation model for Portugal, generated from ASTER image (30 m spatial resolution), using ArcGIS Pro 10.6 software. The map used the projected Coordinate Reference System WGS 84 and elevations referenced to mean sea-level (MSL): Cascais vertical datum.
4. Results
4.1. Core Description and Chronological Framework
Three main depositional environments that correspond to the Late Holocene sedimentary infilling of the Alcabrichel River alluvial plain were identified based on macroscopic observation and textural analysis of core CF2 [56]. Further analysis of core CF2 allowed the definition of five lithostratigraphic units. From the base of the core until 170 cm below the surface, the sedimentary unit (UL1) is mainly composed of dark mud, followed by a slightly coarser unit (UL2), also dark in color, interrupted by very fine light sands. The next unit is predominantly composed of whiteish fine sand (UL3). This is overlaid by unit UL4 that shares the same characteristics with the two lowermost units (UL1 and UL2). The upper 20 cm (UL5) consists of sand material and represents the present-day coastal dune system. Besides these units, three sandy layers were observed and associated with extreme events (Figure 2) (see also [56,64].
Unit UL1 (167–501 cm below the surface) consists of medium to coarser clay with very fine silt intercalations. However, a strong variation in the mean grain size and a sudden increase of sandy material was detected in a 19 cm thick layer located at 423–442 cm below the surface (UL1a in Figure 2). The samples of this sandy layer share the same textural composition, displaying similar distribution of all textural parameters. They are very poorly sorted (Std. 3.27) and show strong positive skewness (Ski: 0.63).
Unit UL2 (117–167 cm below the surface) differs from the underlying unit due to the increase in the mean grain size. This unit is composed of medium and fine silt with some clay intercalations. The occurrence of a very thin layer (subunit-UL2a in Figure 2), about 3 cm thick, between 133 and 136 cm below the surface, was also noted.
Unit UL3 (107–117 cm below the surface) was identified in the upper part of the core, based on its peculiar textural characteristics when compared with the framing units. This unit exhibits an erosive basal contact with the underlying sediments and displays distinct vertical distribution in all textural parameters: an abrupt increase of the coarser fraction (up to 90% of the sample), a significant increase of the mean grain size, poor sorting (Std. 2.02–2.65), strong positive skewness (Ski. 1.85–2.62), and an extremely leptokurtic distribution (ranging from 6.00 to 10.36).
Above 107 cm below the surface, the sediments are substantially distinct from the underlying unit and correspond to unit UL4. The unit UL4 shares many textural similarities with unit UL2 and consists of medium to coarse silt with some intercalations of very fine, very poorly sorted sand (Std. 2.90–3.49). Finally, at the top of the core, unit UL5 exclusively consists of sand-sized grain sediments. This sandy unit is moderately sorted (Std. 0.83–0.88), with strong positive to approximately symmetric skewness (Ski: 0.28 to 0.58) and corresponds to the present-day dune sediments.
A low vertical variation of calcium carbonate was observed throughout the sedimentary core, with predominantly low carbonate content (ranging from 5 to 15%). Minimum values (2.5%) of %CaCO3 occur at 115 cm below the surface (in the unit UL3), while maximum values reach 33% CaCO3 in the unit UL1 at 442 cm below the surface.
Ten bulk sediment samples were radiocarbon dated (Table 1). The base of the core (UL1) shows low sedimentation rates between 0.05 and 0.09 cm/year, followed by changes in sedimentation rates towards the top from 0.03 to 0.48 cm/year (Table 1). The whole unit was dated from 7320–6023 to 1827–682 Cal years BP (2δ). From 170 cm depth to the top of the core, UL2 to UL4 units correspond to the coastal plain system of the Alcabrichel River, deposited after 1827–682 Cal years BP (2δ), with sedimentation rates between 0.21 and 0.57 cm/year). Radiocarbon results of the sample at 132 cm depth (situated in the upper part of unit UL2), recorded an age earlier than 250 ± 30 years BP, for the time interval between 434 and 156 Cal years BP (2δ). Interposed between UL2 and UL4 units, the sedimentary core reveals a massive sandy layer deposited after this date, corresponding to unit UL3 and related to a high energy event. Careful consideration has been given to the modeled calendar dates, as they may present uncertainties in the calibration curve [59]. Therefore, the depth of 132 cm was considered closer to the date of the UL3 unit, placing this high energy event in the chronological proximity of the 18th century.
4.2. Sediment Chemistry
The vertical distribution of chemical elements is represented in Figure 3 and demonstrates clear similarities between units UL2 and UL4 and their textural homogeneity (predominance of the silty sediments). These units also share a high concentration of metal and metalloid elements. Aluminum (Al), iron (Fe), potassium (K), titanium (Ti), and magnesium (Mg) exhibit similar distributions and higher proportions in the alluvial sands (>5.5% Al, >2.5% Fe and K, <0.25% Ti) and much lower content in the unit UL3. These elements appeared directly correlated with sediment grain-size, with higher concentrations often detected in finer sediments (silt and clay) [7,9,65].
Calcium (Ca) concentrations, commonly associated with the bioclastic component, are almost absent in the sandy layer, with proportions lower than 1%. Barium (Ba), an important element of the marine biogeochemical cycle [43], is generally adsorbed by clay minerals, and is in lower proportion in the UL3 unit (minimum value is 197 ppm). This behavior is mimicked in the surface sediments (UL5).
On the other hand, in the unit UL3, copper (Cu) and zinc (Zn) concentrations exhibited a similar distribution, with the highest values of Cu (>500 ppm) and Zn (>200 ppm.) at 115 cm deep. Sulphur (S), many times used as a reliable marine indicator [19], behaves very differently from other elements. The vertical distribution of S varies from <0.01% in the alluvial sediments below of the UL3 unit to 0.09% in the top of this sandy layer.
4.3. Morphoscopic Analysis
Observation of sediments under binocular microscope showed distinct morphoscopic characteristics of sand grains from the different units (Figure 4). In the two lowermost units (UL1 and UL2), quartz percentages exhibit their lowest median values (70%) but the widest ranges (23% to 82%) in unit UL1 and 54% to 83% in unit UL2. In the overlying units (UL3, UL4, and UL5) median values of quartz are higher than 80%.
The lithics represent 26% (median values) in unit UL1 (with maximum values about 76% between 323 and 321 cm below the surface), while in unit UL2 they appeared in lower percentages (median values of 16% and maximum values of about 31% at 120 −122 cm deep). The lowest content of lithics (<5%) was detected in UL3, UL4 and UL5.
Bioclasts displayed the lowest median values (2%) in UL1, slightly increasing at the base of unit UL3. Higher content of bioclasts was registered in the topmost unit (UL5), corresponding to present-day aeolian sediments.
Vertical variation of the morphometric parameters of quartz grains indicates gradual changes in their characteristics, with angular grains with low to medium sphericity at the base of the core, and more rounded to well-rounded quartz grains and higher sphericity towards to the top. Iron oxide-coated quartz grains are observed in higher proportions in UL2 and UL5, while the matted (frosted) grains show a slight increase towards the top of the core.
The morphoscopic characteristics of unit UL3 allowed the definition of three distinct subunits (Figure 4):
- Subunit UL3a (115–117 cm below surface) is characterized by an increase in bioclasts compared to the underlying unit. Moreover, it also displays higher percentages of rounded, well-rounded, and spherical grains, decreasing lithic material, and very high percentages of matted quartz (48%) at the base. Towards the top, an increasing value of angular to subangular and bright quartz grains was observed.
- Subunit UL3b (111–114 cm below surface) is characterized by a mixture of sediments with a high variation of lithics, decreasing percentage of bioclasts, and a higher percentage of angular to very angular “clean” quartz grains.
- Subunit UL3c (107–110 cm below surface) presents an increase in bioclasts to the detriment of the lithic content. It also presents higher percentages of subrounded, spherical, and shiny quartz grains.
4.4. Microtextural Analysis
Within this sedimentary sequence all samples exhibited high percentages of grains with dissolution marks, but differed on other microtextural families (e.g., the percentage of grains with fresh surfaces and percussion marks). Overall, below unit UL3, the distribution of all microtextural features was very similar, with a predominance of chemical features (dissolution and adhering particles) over mechanical marks (percussion marks and fresh surfaces). More than 40% of the grains exhibited dissolution marks as the most recent microtextural features on the grain’s surface, while adhering particles were present in more than 16% of the grains.
However, there are slight variations in these microtextural families. For example, in the sample retrieved at 125 cm deep, grains with chemical marks appeared less frequently (29% dissolution marks and 7% adhering particles). An increase in mechanical marks (especially fresh surfaces) was also observed in this sample.
The mechanical features are more frequent between 107 and 117 cm below the surface (corresponding to the peculiar sandy layer of unit UL3). However, within UL3 there are some significant differences between each subunit (Figure 5). Overall, within unit UL3, fresh surfaces present the highest variation with a significant increase towards to the top (from 25% to 54%), while percussion marks display very consistent values of around 30%.
Higher percentages of grains with dissolution marks (40%) were also detected at the base of the deposit (subunit UL3a). By contrast, adhering particles were lower within this sandy layer—about 6% (median values)—except for the sample collected at a depth of 114 cm below the surface (14%) in UL3b subunit.
The microtopography (relief) of the quartz grains showed the predominance of grains with low and medium relief. High percentages of grains with low relief (about 70%) appeared at the base and at the top of unit UL3, while grains with medium relief present their highest value (79%) at 112 cm depth below the surface. The lowermost samples presented the most grains with high relief (21%).
Finally, the uppermost sample analyzed, at 101 cm below the surface, above the sandy layer (UL3), displayed similar distribution of microtextural characteristics as the one observed at the base of the subunit UL3a, with a high percentage of dissolution marks (41%), and some grains with percussion marks and fresh surfaces (27% and 23%, respectively).
5. Discussion
5.1. Depositional Interpretation and Evidence for Possible Tsunami Incursion
The lithostratigraphy and textural characteristics of the core CF2 show distinct depositional environments. According to [56,64] the palaeoenvironmental reconstruction suggests the following shallowing-upward sequence: an ephemeral lagoon at the base, followed by a seasonal or oxbow lake between 170–440 cm below the surface, an alluvial plain/wetland from 20–170 cm, and a coastal dune system represented by the upper 20 cm sediments, corresponding to the current conditions.
Different sandy layers interbedded between the finer muddy sediments were identified in the local succession, suggesting possible association with high-energy events. Overall, three types of events can potentially be responsible for the sudden input of the sandy sediments on the alluvial plain (e.g., extreme floods, coastal storms, and tsunamis). Based on data previously gathered [56], the lowermost sandy layer (UL1a), between 423 and 424 cm below the surface, was associated with a river flooding episode. This was justified by its textural peculiarity and by the absence of marine indicators [64].
Next, the very thin sandy layer (UL2a) from 133 to 135 cm below the surface was detected. It was also hypothesized that UL2a could be associated with a possible tsunamigenic event, probably before the CE 1755 Lisbon tsunami (Ramos-Pereira, personal communication, 2016). Recently, reference [66,67] speculated on a possible storm origin or a fluvial flood, due to the peculiar geochemical composition, and morphoscopic and microtextural features. Using the hierarchical classification based on Ward’s method [3], they found a clear similarity between the geochemical signature of subunit UL2a and the alluvial underlying sediments, both exhibiting greater dominance of terrigenous over marine-related elements. Material as terrestrial sediments are richer in elements such as Al, Mn, Fe, Rb, K, and Ti, and are also related to the abundance of clay minerals [9]. They are gradually transported downstream by heavy rainfalls responsible for the occurrence of floods and consequently by the input of the terrigenous material in the lowermost areas of the stream channel [8]. Nevertheless, subunit UL2a presents high percentages of rounded and subrounded grains on the base. These features could result from the reworking of sediments by strong onshore winds during storms, capable of transporting dune sands inland [68]. This suggests that a possible storm event led to both landward and seaward sediment transport. Moreover, in the UL2a subunit, quartz grains exhibit microtextural attributes commonly associated with aeolian environments, with low relief grains and high percentages of percussion marks, suggesting dune sands as a possible source of this subunit. The explanation of its storm origin cannot be fully invoked, although a possible tsunamigenic origin for this sandy layer not should be rejected. Differentiating tsunami and storm deposits is a difficult task, since both have similar textural, structural, and sedimentary characteristics [27,33,37,69,70].
Between 107 and 117 cm below the surface, the massive sandy layer about 10 cm thick (unit UL3) appeared intercalated between the alluvial plain sediments. It displays a basal erosional unconformity, suggesting a possible association with a high energy event. The percentage of sand (>90%), its textural attributes—poorly sorted, very positive skewness, and very leptokurtic distribution—shows distinctive characteristics when compared to the framing units. The detailed analysis of this unit seems to suggest more similarities with analogue CE 1755 tsunami deposits detected along the Portuguese coast. Many authors reported similar textural characteristics on the CE 1755 tsunami deposits recorded in Salgados Lagoon [20,21], Boca do Rio [70], in Martinhal [33] (South Portugal), and in the Gulf of Cadiz [69]. Therefore, given the above discussion of age estimation (after 250 ± 30 BP), we hypothesized that the deposition of unit UL3 could be related to the CE 1755 Lisbon tsunami. Nevertheless, due to the poor spatial analysis (only one core was analyzed) at the moment, we do not exclude a possible storm origin, capable of producing transfer of coastal sands inland [71]. The validity of a tsunami-related interpretation depends on the combination of multiple proxies including sediment characteristics, geochemistry, and the morphoscopic and microtextural peculiarities. For instance, sediment geochemistry is an important proxy that can provide evidence of saltwater inundation [9,10,65,72]. The geochemical signature of the unit UL3 revealed a distinct character when compared to the framing units. Increases in concentrations of paleosalinity indicators such as sulphur often occur in tsunami deposits when compared to under- and overlying sediments [72]. In terms of vertical variation, the high sulphate content at the top of unit UL3 could be related to the sediment concentration in the water column and may indicates two possible inundation phases. The lower concentration of S at the base of the unit UL3 could be potentially attributed to the lower interstitial water volume in the first inundation wave, due to the presence of a large volume of sands eroded from the coastal system (dune and beach). Large volumes of sands were probably transported inland during the initial tsunami inundation phase. By contrast, a sudden upward increase of S concentration might be associated with an increase in the flow energy resulting from erosive processes at the coastal barrier, thus easing the intrusion of a larger volume of seawater by subsequent tsunami waves. As suggested by [21,63], a higher volume of sedimentary particles is common in the first inflow, due to erosion of a nearby dune field and more seawater intrusion after. This is accordance with [8], who pointed to a greater availability of sulphate in seawater than in freshwater. Alternatively, the increase of S in the top of the deposit could be related to post-sedimentary processes. The top sediment layer could also concentrate sulphate minerals due to its fine-grained texture. On the other hand, elements such as calcium are frequently reported in tsunami deposits and indicate the abundance of biogenic material, which suggests salt water intrusion, while titanium and zirconium are associated with heavy mineral laminae, if present, and may indicate a high energy environment [8,9]. However, the higher content of Ti detected in alluvial sediments than in unit UL3 was attributed to the presence of clay minerals, while the lower proportion of Ca may be explained by the dilution of this marine indicator, probably produced by erosion and reworking of the underlying clayey sediments. This agrees with [30], who reported a similar behavior in tsunami sands from Boca do Rio (south Portugal). In that location, the authors pointed to the depletion of a set of marine indicators (e.g., Ba and Br)), resulting from the reworking of the estuarine underlying clays and their subsequent dissolution caused by the input of a large volume of sands from the nearby beach-dune systems. In addition, the morphoscopic study revealed more rounded grains, both frosted and shiny, in subunits UL3a and UL3c, which have been related to marine and aeolian environments, while higher content of fine and more angular grains were observed in the middle of the deposit (UL3b), suggesting an input of terrigenous material and multiple sedimentary sources for this subunit.
Overall, the stratigraphy and sediment characteristics of the unit UL3, including textural, morphoscopic, and microtextural peculiarities, and distinct geochemical signature with marine-related elements, suggest changes in hydrodynamic conditions [21,70] and, thus, positive evidence of a tsunami-related deposit. On the other hand, according to the chronology established, unit UL3 is dated from the 18th century. Therefore, to discard a possible storm association, historical records of climate extremes were analyzed. In order to provide evidence of past weather and possibly storm tracks, we also analyzed monthly North Atlantic Oscillation (NAO) reconstruction from 1659 to 2001 based on [73]. Typically, a strong NAO+ index is associated with higher-than-normal temperatures and precipitation over northern and western Europe and below-normal temperatures and precipitation over Iberia and southern Europe. Conversely, during the negative phase (NAO-), the opposite patterns are observed. This means that over the Iberia Peninsula, the occurrence of greater storminess usually coincides with the NAO- mode [74], while the NAO+ phase reflects negative precipitation anomalies (particularly in Portugal) and dry conditions prevail [75]. Thus, the NAO reconstruction data based on [73] showed anticyclone conditions and no storm activity for the period that corresponds to the deposition of the UL3 unit. Hence, the combination of the radiocarbon dating with the sedimentary characteristics and the past climate reconstruction may suggest that the unit UL3 can be tentatively interpreted as a tsunami deposit associated with the CE 1755 tsunami event.
5.2. Tsunami Inundation Phases Based on Sediment Provenance Relationships
Morphoscopic analysis allowed discrimination of different sedimentary subunits based on the interplay between multiple sedimentary sources (e.g., beach, dune, and alluvial sands) from the underlying pre-tsunami sediments. Therefore, the vertical variation of quartz grain characteristics indicates strong fluctuations in sediment transport conditions during the event. Based on this data (see also [66]), three different phases of tsunami inundation are proposed (Figure 6).
Visual observation of quartz grains showed high content (48%) of well-rounded, high sphericity, and matted grains at the base of UL3. These morphoscopic features are commonly associated with dune sediments [41]. This observation may suggest that the lowermost subunit of the deposit is essentially derived from dune erosion, most probably the first geomorphological unit to be eroded and washed inland by the tsunami. This sedimentation was followed by the predominance of shiny quartz grains (>90%), which were cleaner and more angular. These are typically related to beach environments [37] and could have resulted from a stronger traction effect induced by travelling waves. As discussed in [21,36], the main sources of tsunami deposits are derived from the beach and dunes, and from the underlying unit that may have contributed to the finer fractions. Subunit UL3-b shows a mixed sedimentary signature combining nearby sources with significant changes of mean grain size, with finer and more angular quartz grains, suggesting provenance from alluvial sands (Figure 6). The presence of a mixed assemblage, coupled with the low content in bioclasts and increase of lithic material, is probably caused by erosion and seaward remobilization of alluvial sediments. This phase was tentatively attributed to a backwash pulse [66,67].
Changes in textural and morphoscopic characteristics of quartz grains were also detected at the top of the deposit, with an increase in the coarser fraction, and in rounded and well-rounded shiny quartz grains. The erosion of the dune system by the initial tsunami inundation wave may have facilitated the subsequent inland penetration of the water, causing further beach erosion. These speculative processes were synthesized in a conceptual model of tsunami inundation and sedimentation, showing distinct source sediments and different hydrodynamic conditions during a tsunami event (Figure 7).
The three waves proposed here are indeed in agreement with the numerical model results in the study area [18] and also to historical evidence of tsunami inundation analyzed in [76]. These authors compiled many historical accounts described by eyewitnesses, reporting the huge inundation of the 1755 Lisbon tsunami in distinct places of the Portuguese coast. However, according to the authors, the tsunami heights are often described in Portuguese historical units which have been later converted to SI (e.g., 1 palmo = 0.2 m; 1 braça = 1.8 m; 1 covado = 0.7 m; 1 vara = 1 m). At the Porto Novo beach, the historical sources also described three tsunami waves “[The palmos that grew more than ordinary can be judged of nine or ten braças (≈16.2–18 m), where it hits the cliffs. The extraordinary flux and reflux was for three times] … [it was rising and filling first, and falling after]” [77].
Complementary information was provided by microtextural analysis of quartz grains and showed that the tsunami deposit can be distinguished from other sedimentary environments. Microtextural features have been previously used as an indicator of marine invasions [21,35]. These authors demonstrated that a tsunami deposit exhibits a predominance of mechanical marks (fresh surfaces and percussion marks) over chemical feature marks, when compared with possible sedimentary sources (beach, dune, alluvial, and offshore sediments). Chemical action marks are very sparse in high energy environments and are related to dissolution and/or diagenetic processes.
Relief describes the surface roughness of grains, giving more detailed information about the past sedimentary environments experienced by the grains, and allowing the identification of possible sedimentary sources. Generally, low relief grains are associated with aeolian and marine environments, due to wind abrasion in terrestrial environments or wave-induced action in the marine-continental domain [41]. By contrast, high relief grains are associated with alluvial environments because they tend to be less transported, suffering less collision between the grains. However, they are strongly affected by the chemical action of water, causing a higher number of dissolution marks. In all samples for this study, an unexpected proportion of grains with dissolution features were observed. A possible explanation may be related to the post-depositional diagenetic processes which produced alteration on the grains surfaces, resulting in a change in their microtextural signature. In this case, the proximity of the Alcabrichel River, with water subsaturated in silica, would be the most probable explanation for the high percentages of grains with dissolution features. It has also been noted that in an estuarine environment [40] the transition from freshwater to seawater conditions provides changes both in pH and salinity, which could be responsible for the increase of dissolution mark features.
Despite the dominance of chemical microtextural imprints, mechanical features occur in higher proportions in samples from unit UL3, with more percussion marks at the base and fresh surfaces increasing towards to the top. According to environmental discrimination proposed by [78], mechanical marks such as v-shaped percussion cracks are common in subaqueous environments and result from grain collision, while aeolian quartz grains are mostly marked by abrasion fatigue, bulbous edges, upturned plates, and crescentic percussion marks. The high percentage of grains with small percussion marks at the base of the deposit suggests an appreciable grain-to-grain contact and was attributed to the high-sediment concentration in the water column, promoted by erosion and incorporation of the dune system sediments during the initial phase of tsunami inundation.
Bulbous edges and well-rounded and frosted grains with low to medium relief were observed in the base of the deposit and were correlated with a likely dune sediment source. Hence, here we hypothesized that the abundance of fresh surfaces on the upmost sample of unit UL3 might be attributed to the second inundation phase characterized by lower sediment concentration in the water column, providing severe resurfacing of the quartz grains. As suggested by [21], a large volume of sedimentary particles in the water column may cause the slowing of the flow velocity. In such conditions, the result is the increase of percussion marks on the grains, while fresh surfaces are more common where sediment concentration is lower, because fewer sedimentary particles in the water column means more flow energy and, consequently, more violent collision between grains.
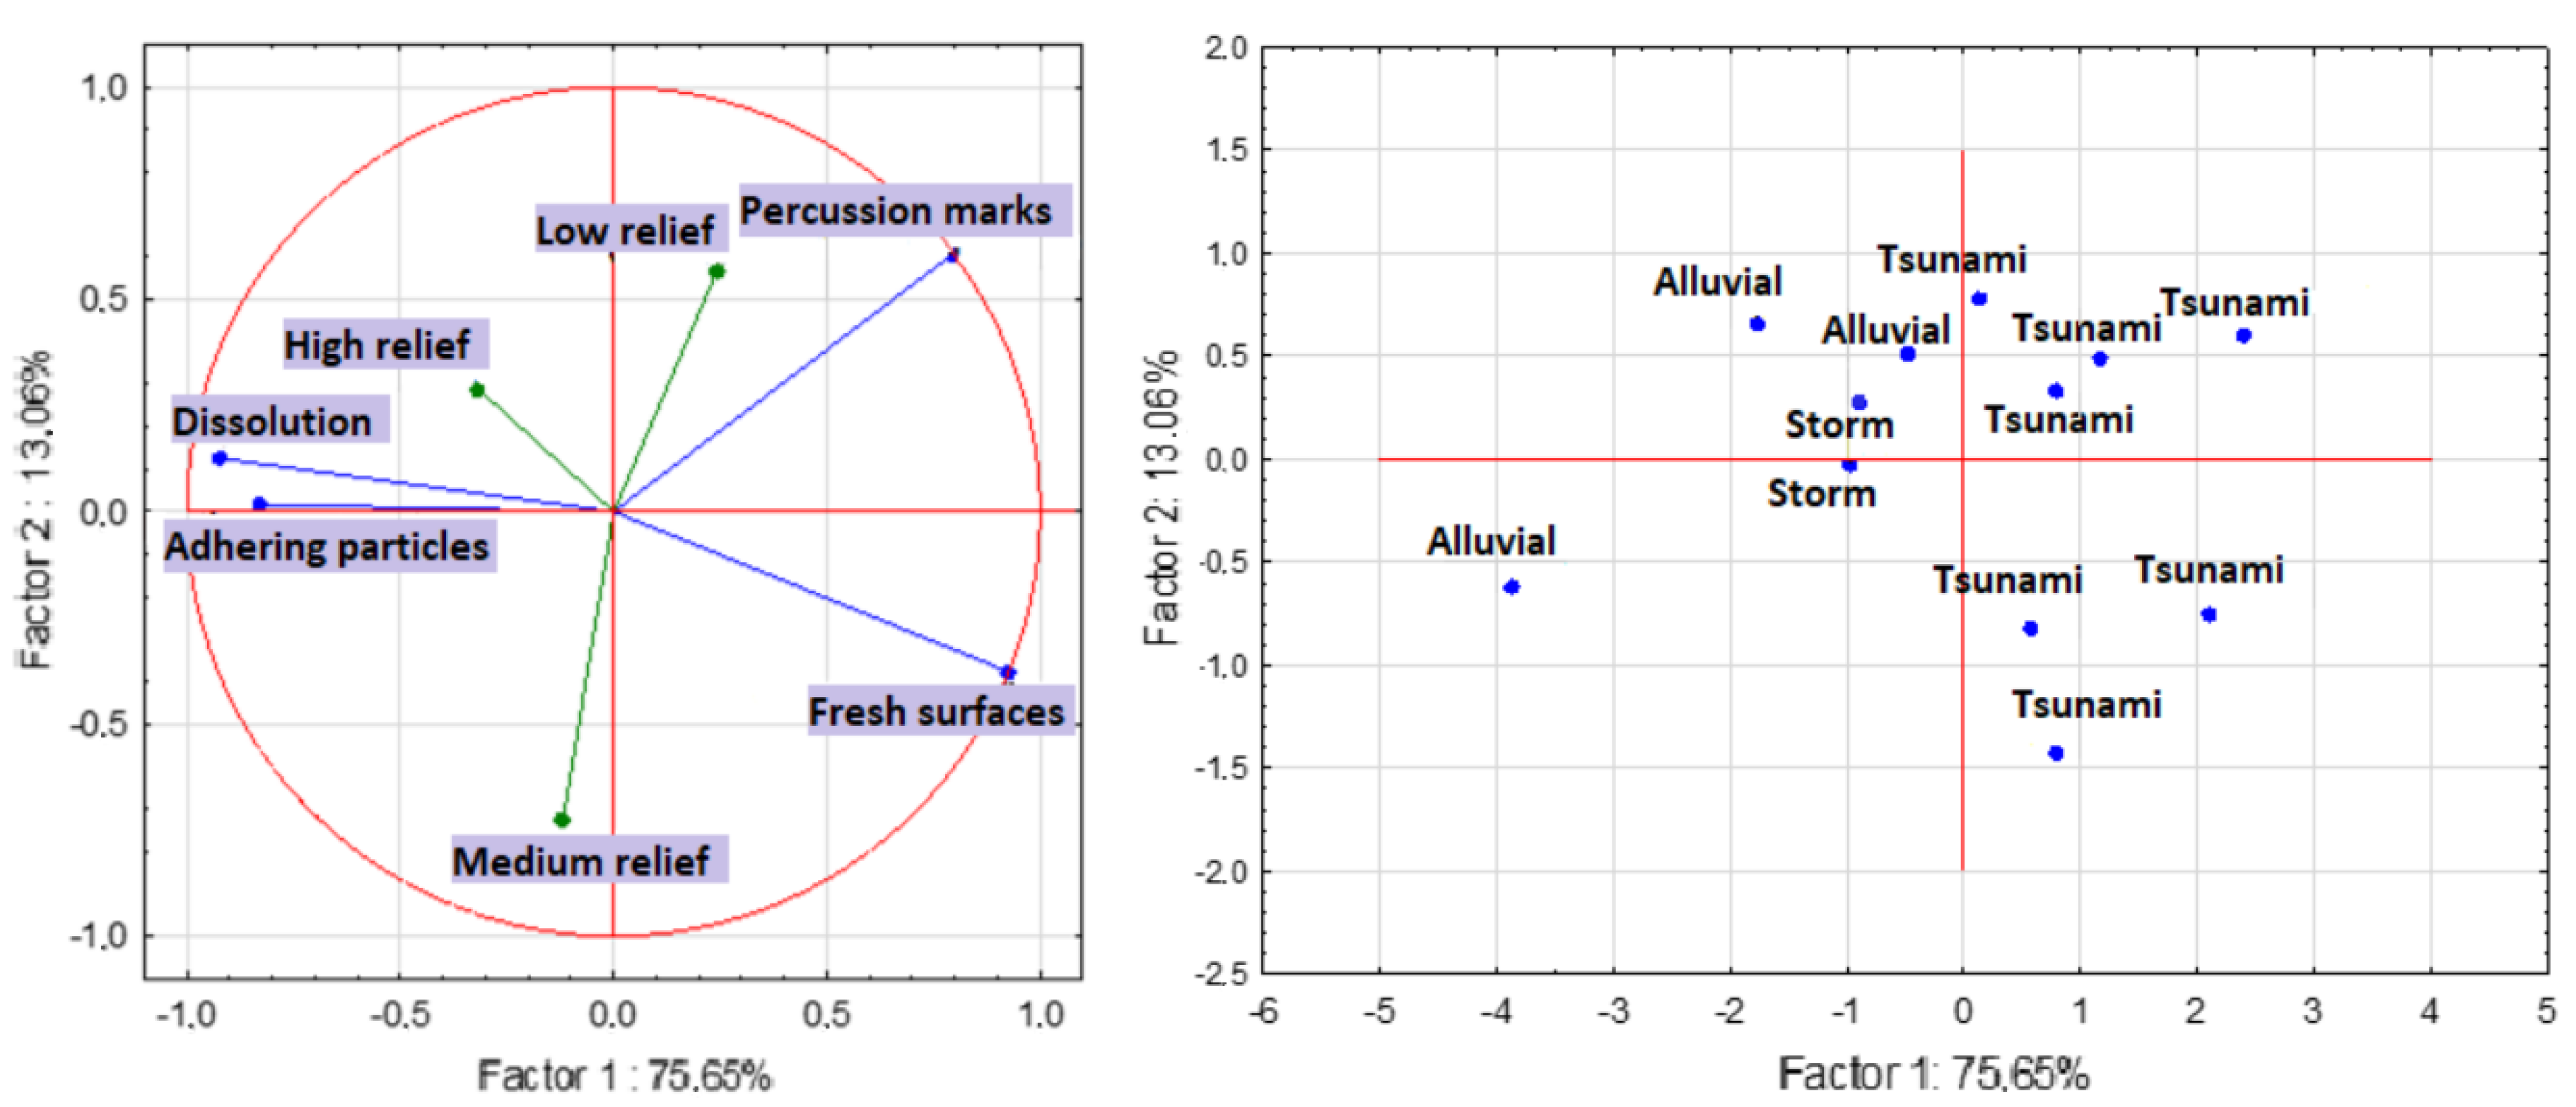
Grains with adhering particles occur in higher percentages in the alluvial samples and are almost absent in the tsunami deposit. On the other hand, relief tends to be higher on the alluvial sediments than on paleotsunami sands and could be related with the different sediment sources. Differences in microtextural characteristics of quartz grains were observed in the middle section of UL3 (subunit UL3-b associated here with the backwash) implying mixed sedimentary sources, with the input of terrigenous material (alluvial sands), probably resulting from the reworking of the underlying sediments, but also with dune and beach sands. Many authors [2,35,36,63] have investigated microtextural features on tsunami deposits found along the Algarve coast and reported a great variation of their microtextural characteristics, implying a dependence on local geological settings and sediment availability. Microtextural analysis is often considered a controversial method because it presents some uncertainties related to the interpretation of the inherited signatures on quartz grains [40]. In order to demonstrate the potential of this technique to discriminate tsunami grains from other depositional environments and sedimentary processes, statistical analysis—principal component analysis (PCA)—was performed over the new microtextural classification based on the most recent microtexture present on the grain surface (Figure 8). According to the obtained PCA results, there is a strong correlation between the microtextural features (making a total of seven microtextural variables) and distinct depositional environments and sedimentary processes. Low energy environments represented by the alluvial sediments are correlated with the chemical action marks and medium to high relief, while mechanical features and low relief presents a very good correlation with tsunami sands. The pattern is highlighted in the plot of the principal component analysis (Figure 8), showing that the first factor explained 75.65% of the total of variation, grouping all of the microtextural features in: (i) the 1st group, displaying mechanical action marks (fresh surfaces and percussion marks) and low relief, and (ii) the 2nd group, showing chemical action marks and medium and high relief.
Regarding the second factor, this has a small capacity to distinguish the samples, explaining only 13% of the total variance. Thus, the principal component analysis results show a clear opposition between the mechanical features and the chemical action marks. According to [21,37,63], similar results were obtained in analogous deposits studied on the Portuguese coast. This allows obvious correlation with field data, thus showing a clear distinction between tsunami samples and other environments or depositional processes.
Therefore, our results further demonstrate that the microtextural signatures may be considered as reliable hydrodynamic indicators and the new classification as an important approach that should be tested elsewhere.
6. Conclusions Remarks
The Late Holocene succession (Meghalayanian) for the Alcabrichel River estuary was studied. Several proxies, such as lithostratigraphic and textural characterization, sediment chemistry and high-resolution analyses of quartz grains, coupled with radiocarbon age estimation, were applied in this study. Within the sequential evolution of a receding alluvial plain, one unit (UL3) was associated with the tsunami that followed the CE Lisbon 1755 earthquake. Within this unit, three distinct sublayers were identified and associated with different phases of the flooding recorded during the tsunami event. The first sedimentation phase corresponds to the initial flow of the tsunami (subunit UL-a) and is characterized by the highest content in originally sourced dune sands. The second phase presents a mixed sedimentary assemblage from the nearby coastal system, with an input of alluvial sands and soil, reflecting the turbulence and terrigenous signature typical of the backwash (UL3-b subunit). Finally, the third sedimentation phase on the top of the tsunami deposit (UL3-c subunit) is characterized by the increase of mean grain size and changes in quartz grain characteristics (predominantly beach sands), which corresponds to a second inundation wave.
The research presented here confirms a broad spatial presence of the CE 1755 tsunami event on the western coast of Portugal. This work makes a useful contribution to paleotsunami studies and decisively provides a more accurate perception of the CE Lisbon 1755 tsunami inundation and its impacts, providing grounds for better hazard assessments in the Atlantic region.
Author Contributions
A.R.-P. was the coordinator of FMI Project team (PTDC/CTE-GIX/104035/2008 “FMI 5000—Environmental Changes: Fluvio-marine interactions, over the last 5000 years”) and conducted drilling, sedimentological analyses and age-estimations. Mihaela Tudor carried out the morphoscopic study, microtextural analysis and geochemistry and P.J.M.C. provided highly critical input regarding the behavior of tsunami. The document was written by all the authors (M.T., A.R.-P. and P.J.M.C.), each having significant direct input, making alterations to the text and reviewing the documents to ensure scientific accuracy. All authors have read and agreed to the published version of the manuscript.
Funding
This research received no external funding.
Acknowledgments
The authors wish to thank the Centre of Geographical Studies, the Department of Geology and the Centre of Environmental Biology of the Faculty of Science, University of Lisbon for the access granted to their laboratory facilities. The authors also acknowledge FMI Project (PTDC/CTE-GIX/104035/2008 “FMI 5000—Environmental Changes: Fluvio-marine interactions over the last 5000 years”).
Conflicts of Interest
The authors declare no conflict of interest.
References
- Bondevik, S.; Svendsen, J.I.; Mangerud, J.A.N. Tsunami sedimentary facies deposited by the Storegga tsunami in shallow marine basins and coastal lakes, western Norway. Sedimentology 1997, 44, 1115–1131. [Google Scholar] [CrossRef] [Green Version]
- Costa, P.J.M.; Andrade, C.; Cascalho, J.; Dawson, A.G.; Freitas, M.C.; Paris, R.; Dawson, S. Onshore tsunami sediment transport mechanisms inferred from heavy mineral assemblages. Holocene 2015, 25, 795–809. [Google Scholar] [CrossRef]
- Jagodziński, R.; Sternal, B.; Szczuciński, W.; Chagué-Goff, C.; Sugawara, D. Heavy minerals in the 2011 Tohoku- oki tsunami deposits—insights into sediment sources and hydrodynamics. Sediment. Geol. 2012, 282, 57–64. [Google Scholar] [CrossRef]
- Jaffe, B.E.; Gelfenbaum, G. Using Tsunami Deposits to Improve Assessment of Tsunami Risk. Mar. Georesources Geotechnol. 2002, 27, 836–847. [Google Scholar] [CrossRef] [Green Version]
- Koster, B.; Reicherter, K. Sedimentological and geophysical properties of a ca. 4000 year old tsunami deposit in southern Spain. Sediment. Geol. 2014, 314, 1–16. [Google Scholar] [CrossRef]
- Morton, R.A.; Goff, J.R.; Nichol, S.L. Hydrodynamic implications of textural trends in sand deposits of the 2004 tsunami in Sri Lanka. Sediment. Geol. 2008, 207, 56–64. [Google Scholar] [CrossRef]
- Moreira, S.; Costa, P.J.M.; Andrade, C.; Ponte Lira, C.; Freitas, M.C.; Oliveira, M.A.; Reichart, G.J.; Reichart, G.J. High resolution geochemical and grain-size analysis of the AD 1755 tsunami deposit: Insights into the inland extent and inundation phases. Mar. Geol. 2017, 390, 94–105. [Google Scholar] [CrossRef]
- Chagué-Goff, C. Chemical signatures of paleotsunami: A forgotten proxy? Mar. Geol. 2010, 271, 67–71. [Google Scholar] [CrossRef]
- Chagué-Goff, C.; Andrew, A.; Szczuciński, W.; Goff, J.; Nishimura, Y. Geochemical signatures up to the maximum inundation of the 2011 Tohoku-oki tsunami—Implications for the 869 AD Jogan and other palaeotsunamis. Sediment. Geol. 2012, 282, 65–77. [Google Scholar] [CrossRef]
- Chagué-Goff, C.; Goff, J.; Wong, H.K.Y.; Cisternas, M. Insights from geochemistry and diatoms to characterise a tsunami’s deposit and maximum inundation limit. Mar. Geol. 2015, 359, 22–34. [Google Scholar] [CrossRef]
- Dawson, A.G.; Stewart, I. Tsunami deposits in the geological record. Sediment. Geol. 2007, 200, 166–183. [Google Scholar] [CrossRef]
- Dawson, A.G.; Shi, S. Tsunami Deposits. Pure Appl. Geophys. 2000, 157, 875–897. [Google Scholar] [CrossRef]
- Dawson, S.; Smith, D.E. The sedimentology of Middle Holocene tsunami facies in northern Sutherland, Scotland, UK. Mar. Geol. 2000, 170, 69–79. [Google Scholar] [CrossRef]
- Goff, J.; Chagué-Goff, C. A review of palaeo-tsunamis for the Christchurch region, New Zealand. Quat. Sci. Rev. 2012, 57, 136–156. [Google Scholar] [CrossRef]
- Goff, J.; Dominey-Howes, D. The 2009 South Pacific Tsunami. Earth-Sci. Rev. 2011, 107. [Google Scholar] [CrossRef]
- Gutscher, M.A. Subduction beneath Gibraltar? Recent studies provide answers. Eos Trans. Am. Geophys. Union 2012, 13, 133–134. [Google Scholar] [CrossRef]
- Baptista, M.A.; Miranda, J.M.; Chierici, F.; Zitellini, N. New study of the 1755 earthquake source based on multi-channel seismic survey data and tsunami modeling. Nat. Hazards Earth Syst. Sci. 2003, 3, 333–340. [Google Scholar] [CrossRef] [Green Version]
- Santos, A.; Pereira, S.; Fonseca, N.; Paixão, R.; Andrade, F. Avaliação de risco de tsunami nos Municípios de Peniche e Lourinhã. In Livro Comemorativo dos 260 anos do Tremor de Terra de 1755 (Lisboa); Universidade de Coimbra: Coimbra, Portugal, 2015; pp. 251–276. [Google Scholar] [CrossRef]
- Andrade, C.; Freitas, M.C.; Moreno, J.; Craveiro, S.C. Stratigraphical evidence of Late Holocene barrier breaching and extreme storms in lagoonal sediments of Ria Formosa, Algarve, Portugal. Mar. Geol. 2004, 210, 339–362. [Google Scholar] [CrossRef]
- Costa, P.J.M.; Andrade, C.; Freitas, M.C.; Oliveira, M.A.; Lopes, V.; Jouanneau, J.-M. Reconhecimento de um depósito de tsunami na Lagoa dos Salgados. GEOTIC—Sociedade Geológica de Portugal, VIII Congresso Nacional de Geologia. E-Terra 2010, 12, 1–4. [Google Scholar]
- Costa, P.J.M.; Andrade, C.; Dawson, A.G.; Mahaney, W.C.; Freitas, M.C.; Paris, R.; Taborda, R. Microtextural characteristics of quartz grains transported and deposited by tsunamis and storms. Sediment. Geol. 2012, 275–276, 55–69. [Google Scholar] [CrossRef]
- Costa, P.J.M. Geological Recognition of Abrupt Marine Invasions in Two Coastal Areas of Portuga. Ph.D. Thesis, Geography and Earth Sciences, MPhil, Brunel University, London, UK, 2006; 139p. [Google Scholar]
- Andrade, C.; Freitas, M.C.; Miranda, J.M.; Baptista, M.A.; Silva, P.; Munhá, J. Recognizing possible tsunami sediments in the ultradissipative environment of the Tagus estuary (PORTUGAL). In Coastal Sediments, Proceedings of the 5th International Symposium on Coastal Engineering and Science of Coastal Sediment Processes, Clearwater Beach, FL, USA, 18–23 May 2003 [CD-ROM]; Davis, R.A., Ed.; Springer: Berlin/Heidelberg, Germany, 2003; Volume 3, pp. 1–14. ISBN 978-981-238-422-5 CD. [Google Scholar]
- Abrantes, F.; Alt-Epping, U.; Lebreiro, S.; Voelker, A.; Schneider, R. Sedimentological record of tsunamis on shallow-shelf areas: The case of the 1969 AD and 1755 AD tsunamis on the Portuguese Shelf of Lisbon. Mar. Geol. 2008, 249, 283–293. [Google Scholar] [CrossRef]
- Ramos-Pereira, A.; Trindade, J.; Araújo-Gomes, J.; Gusmão, F. Evidences of the 1755 Lisbon earthquake in urban environment (Lisbon). EGUGA 2010, 12, 9665. [Google Scholar]
- Ramos-Pereira, A. Vestígios do Tsunami de 1755: Um indicador negligenciado no litoral de Portugal Continental? In Livro Comemorativo dos 260 anos do Tremor de Terra de 1755 (Lisboa); Universidade de Coimbra: Coimbra, Portugal, 2016; pp. 297–316. [Google Scholar] [CrossRef] [Green Version]
- Engel, M.; Brückner, H. The identification of palaeo-tsunami deposits—A major challenge in coastal sedimentary research. Coastline Rep. 2011, 17, 65–80. [Google Scholar]
- Bahlburg, H.; Spiske, M. Sedimentology of tsunami inflow and backflow deposits: Key differences revealed in a modern example. Int. Assoc. Sedimentol. Sedimentol. 2011. [Google Scholar] [CrossRef]
- Goff, J.; Chagué-Goff, C.; Nichol, S. Palaeotsunami deposits: A New Zealand perspective. Sediment. Geol. 2001, 143, 1–6. [Google Scholar] [CrossRef]
- Font, E.; Veiga-Pires, C.; Pozo, M.; Nave, S.; Costas, S.; Ruiz Muñoz, F.; Abad, M.; Simões, N.; Duarte, S.; Rodríguez-Vidal, J. Benchmarks and sediment source(s) of the 1755 Lisbon tsunami deposit at Boca do Rio Estuary. Mar. Geol. 2013, 343, 1–14. [Google Scholar] [CrossRef] [Green Version]
- Cascalho, J.; Costa, P.; Dawson, S.; Milne, F.; Rocha, A. Heavy mineral assemblages of the Storegga tsunami deposit. Sediment. Geol. 2016, 334, 21–33. [Google Scholar] [CrossRef]
- Nanayama, F.; Shigeno, K.; Satake, K.; Shimokawa, K.; Koitabashi, S.; Miyasaka, S.; Ishii, M. Sedimentary differences between the 1993 Hokkaido-nansei-oki tsunami and the 1959 Miyakojima typhoon at Taisei, southwestern Hokkaido, northern Japan. Sediment. Geol. 2000, 135, 255–264. [Google Scholar] [CrossRef]
- Kortekaas, S.; Dawson, A.G. Distinguishing tsunami and storm deposits: An example from Martinhal, SW Portugal. Sediment. Geol. 2007, 200, 208–221. [Google Scholar] [CrossRef]
- Kuwatani, T.; Nagata, K.; Okada, M.; Watanabe, T.; Ogawa, Y.; Komai, T.; Tsuchiya, N. Machine-learning techniques for geochemical discrimination of 2011 Tohoku tsunami deposits. Sci. Rep. 2014, 4, 7077. [Google Scholar] [CrossRef]
- Costa, P.; Andrade, C.; Freitas, M.; Oliveira, M.A.; Jouanneau, J.-M.; Costa, A.; Jouanneau, M. Preliminary results of exoscopic analysis of quartz grains deposited by a palaeotsunami in Salgados lowland (Algarve, Portugal). J. Coast. Res. SI 2009, 56, 39–43. [Google Scholar]
- Costa, P.J.M.; Andrade, C.; Freitas, M.C.; Oliveira, M.A.; Lopes, V.; Dawson, A.G.; Moreno, J.; Fatela, F.; Jouanneau, J.-M.J. A tsunami record in the sedimentary archive of the central Algarve coast, Portugal: Characterizing sediment, reconstructing sources and inundation paths. Holocene 2012, 22, 899–914. [Google Scholar] [CrossRef]
- Costa, P.J.M. da Sedimentological Signatures of Extreme Marine Inundations. PhD Thesis, University of Lisbon, Lisboa, Portugal, 2012; 245p. Available online: http://repositorio.ul.pt/handle/10451/7766 (accessed on 5 April 2020).
- Dahanayake, K.; Kulasena, N. Recognition of diagnostic criteria for recent- and paleo-tsunami sediments from Sri Lanka. Mar. Geol. 2008. [Google Scholar] [CrossRef]
- Mahaney, W.C.; Stewart, A.; Kalm, V. Quantification of SEM microtextures useful in sedimentary environmental discrimination. Boreas 2001, 30, 165–171. [Google Scholar] [CrossRef]
- Bellanova, P.; Bahlburg, H.; Nentwig, V.; Spiske, M. Microtextural analysis of quartz grains of tsunami and non-tsunami deposits—A case study from Tirua (Chile). Sediment. Geol. 2016, 343, 72–84. [Google Scholar] [CrossRef]
- Mahaney, W.C. Atlas of Sand Grain Surface Textures and Applications; Oxford University Press: New York, NY, USA, 2002; ISBN 9780195138122. [Google Scholar]
- Moreira, V.S. Historical and recent tsunamis in the European area. Sci. Tsunami Hazards 1988, 6, 37–42. [Google Scholar]
- Pessanha, L.E.V.; Pires, H.O. Elementos Sobre o Clima de Agitação Marítima na Costa Sul do Algarve; Internal Report; Instituto Nacional de Meteorologia e Geofísica: Lisboa, Portugal, 1981; 66p. (In Portuguese) [Google Scholar]
- Pires, H.O. Alguns Aspectos do Clima de Agitação Marítima de Interesse Para a Navegação na Costa de Portugal; Instituto Nacional de Meteorologia e Geofísica: Lisboa, Portugal, 1989; Volume 2, Fasc. XXXVII. [Google Scholar]
- Daveau, S.; Almeida, G.; Feio, M.; Rebelo, F.; Silva, R.F.M.; Sobrinho, A.S. Os temporais de Fevereiro/Março de 1978. Finisterra 1978, 13, 236–260. [Google Scholar] [CrossRef] [Green Version]
- Pires, H.O. Condições Meteorológicas Nacosta Ocidental Portuguesa na Região de SINES em Dezembro de 1978 e em Fevereiro de 1979; Instituto Nacional de Meteorologia e Geofísica: Lisboa, Portugal, 1978. [Google Scholar]
- Freitas, J.G.; Dias, J.A. 1941 windstorm effects on the Portuguese Coast. What lessons for the future? J. Coast. Res. 2013, 65, 714–719. [Google Scholar] [CrossRef]
- Tudor, M.; Ramos-Pereira, A. Dinâmica de uma Praia Encastrada Durante o Inverno Marítimo 2013–2014. O exemplo da Praia da Adraga. In Proceedings of the VII Congresso Nacional de Geomorfologia: Geomorfologia, Lisbon, Portugal, 8–9 October 2015; pp. 73–79. [Google Scholar]
- Dias, J.A.; Taborda, R. Tidal gauge data in deducing secular trends of relative sea level and crustal movements in Portugal. J. Coast. Res. 1992, 8, 655–659. [Google Scholar]
- Gama, C.; Taborda, R.; Dias, J.A. Sobreelevação do nível do mar de origem meteorológica (storm surge), em Portugal Continental. In Colectânea de Ideias Sobre a Zona Costeira de Portugal; Associação Eurocoast-Portugal: Porto, Portugal, 1997; pp. 131–149. [Google Scholar]
- Henriques, R. Propostas Metodológicas para a Monitorização das Zonas Costeiras—Aspectos Sedimentológicos. Master’s Thesis, Universidade do Porto, Porto, Portugal, 1998. [Google Scholar]
- Henriques, R. SEDMAC/SEDPC: Programa informático de apoio à análise dimensional de populações detríticas. In Proceedings of the VI Congresso Nacional de Geologia, Faculdade de Ciências e Tecnologia da Universidade Nova de Lisboa, Caparica, Portugal, 4–6 June 2003; Volume 40, p. 40. [Google Scholar]
- Henriques, R. SEDMAC/SEDPC: An application to support particle size analysis of unconsolidated sediments. In Proceedings of the 32nd International Geological Congress, Florence, Italy, 20–28 August 2004; International Union of Geological Sciences: Florence, Italy; pp. 154–156. [Google Scholar]
- Folk, R.L.; Ward, W. Brazos River Bar: A Study in the Significance of Grain-Size Parameters. J. Sediment. Res. 1957, 27, 3–26. [Google Scholar] [CrossRef]
- Bengtsson, L.; Enell, M. Chemical analysis. In Handbook of Holocene Palaeoecology and Palaeohydrology; Berglund, B.E., Ed.; John Wiley & Sons Ltd.: Chichester, UK, 1986; pp. 423–451. [Google Scholar]
- Ramos-Pereira, A.; Ramos, C.; Danielsen, R.; Trindade, J.; Soares, A.M.; Granja, H.; Martins, J.M.M.; Portela, P.J.C.; Torres, A.; Costa, A.L.; et al. Late Holocene natural and man induced environmental changes in the Western Iberian coast: Assessing forcing factors. In Água e Território um Tributo a Catarina Ramos; Centro de Estudos Geográficos da Universidade de Lisboa: Lisboa, Portugal, 2019; pp. 217–249. [Google Scholar]
- Bronk-Ramsey, C. Bayesian Analysis of Radiocarbon dates. Radiocarbon 2009, 51, 337–360. [Google Scholar] [CrossRef] [Green Version]
- Portela, P.J.C.; Martins, J.M.M.; Soares, A.M.M.; Ramos-Pereira, A.; Araújo-Gomes, J.; Torres, A. Modelação cronológica de sequências sedimentares do estuário da ribeira de Bensafrim com recurso à estatística bayesiana. Finisterra 2019, 54, 113–130. [Google Scholar] [CrossRef]
- Bronk-Ramsey, C. Dealing with Outliers and Offsets in Radiocarbon Dating. Radiocarbon 2009, 51, 1023–1045. [Google Scholar] [CrossRef] [Green Version]
- Portela, P.J.C. Análise Elementar e Isotópica de Sedimentos Estuarinos do rio Alcabrichel (Torres Vedras) e da ribeira de Bensafrim (Lagos). Master’s Thesis, Universidade de Lisboa, Lisboa, Portugal, 2013; 91p. [Google Scholar]
- Powers, M.C. A new roundness scale for sedimentary particles. J. Sediment. Res. 1953, 23, 117–119. [Google Scholar] [CrossRef]
- Krumbein, W.C.; Sloss, L.L. Stratigraphy and Sedimentation. Soil Sci. 1951, 71, 401. [Google Scholar] [CrossRef]
- Costa, P.J.M.; Andrade, C.; Freitas, M.C. Assinaturas microtexturais de processos, ambientes e fontes sedimentares. O depósito de tsunami de 1755 na Boca do Rio-um caso de estudo. In Proveniência de Materiais Geológicos: Abordagens Sobre o Quaternário de Portugal; Dinis, P., Gomes, A., Monteiro-Rodrigues, S., Eds.; APEQ—Associação Portuguesa para o Estudo do Quaternário: Coimbra, Portugal, 2014; pp. 37–56. [Google Scholar]
- Ramos-Pereira, A.; Trindade, J.; Costa, A.L.; Danielsen, R.; Matos, J.M. Historical embayed coastal evolution under a high energetic hydrodynamic event. In Proceedings of the 8th IAG International Conference of Geomophology, Paris, France, 27–31 August 2013. [Google Scholar]
- Chagué-Goff, C.; Szczuciński, W.; Shinozaki, T. Applications of geochemistry in tsunami research: A review. Earth-Sci. Rev. 2016, 165, 203–244. [Google Scholar] [CrossRef]
- Tudor, F.M. Critérios de reconhecimento dos depósitos de inundação tsunamigénica no contexto do Ordenamento do Território. Master Thesis, Physical Geography and Spatial Planning, Instituto de Geografia e Ordenamento do Território, Universidade de Lisboa, Lisboa, Portugal, 2017; 149p. Available online: http://hdl.handle.net/10451/30459 (accessed on 3 March 2020).
- Tudor, M.; Ramos-Pereira; Costa, P.J.M. Geomorphologic constraints to tsunami propagation: The example of AD 1755 in the Western coast (Portugal). In Proceedings of the 8th Congresso de Geomorfologia, Faculdade de Letras, Universidade de Porto, Porto, Portugal, 4–7 October 2017; pp. 141–144. [Google Scholar]
- Clemmensen, L.B.; Pye, K.; Murray, A.; Heinemeier, J. Sedimentology, stratigraphy and landscape evolution of a Holocene coastal dune system, Lodbjerg, NW Jutland, Denmark. Sedimentology 2001, 48, 3–27. [Google Scholar] [CrossRef]
- Cuven, S.; Paris, R.; Falvard, S.; Miot-noirault, E.; Benbakkar, M.; Schneider, J.L.; Billy, I. High-resolution analysis of a tsunami deposit: Case-study from the 1755 Lisbon tsunami in southwestern Spain. Mar. Geol. 2013, 337, 98–111. [Google Scholar] [CrossRef]
- Hindson, R.A.; Andrade, C. Sedimentation and hydrodynamic processes associated with the tsunami generated by the 1755 Lisbon earthquake. Quat. Int. 1999, 56, 27–38. [Google Scholar] [CrossRef]
- Aagaard, T.; Orford, J.; Murray, A.S. Environmental controls on coastal dune formation; Skallingen Spit, Denmark. Geomorphology 2007, 83, 29–47. [Google Scholar] [CrossRef]
- Chagué-Goff, C.; Schneider, J.-L.; Goff, J.R.; Dominey-Howes, D.; Strotz, L. Expanding the proxy toolkit to help identify past events—Lessons from the 2004 Indian Ocean Tsunami and the 2009 South Pacific Tsunami. Earth-Sci. Rev. 2011, 107, 107–122. [Google Scholar] [CrossRef]
- Luterbacher, J.; Xoplaki, E.; Dietrich, D.; Jones, P.D.; Davies, T.D.; Portis, D.; Gonzalez-Rouco, J.F.; Von Storch, H.; Gyalistras, D.; Casty, C.; et al. Extending North Atlantic Oscilation reconstructions back to 1500. Atmos. Sci. Lett. 2002, 2, 114–124. [Google Scholar] [CrossRef]
- Clarke, M.L.; Rendell, H.M. Effects of storminess, sand supply and the North Atlantic Oscillation on sand invasion and coastal dune accretion in western Portugal. Holocene 2006, 16, 341–355. [Google Scholar] [CrossRef]
- Fragoso, M.; Carraça, G.; Alcoforado, M.J. Droughts in Portugal in the 18th century: A study based on newly found documentary data. Int. J. Climatol. 2018, 1–20. [Google Scholar] [CrossRef]
- Santos, A.; Koshimura, S. Estimating the tsunami parameters of the 1755 Lisbon Tsunami in Portugal by the interpretation of the historical accounts. In Proceedings of the IX Congresso da Geografia Portuguesa: “Geografia: Espaço, Natureza, Sociedade e Ciência”, Universidade de Evora, Evora, Portugal, 28–30 November 2013; pp. 828–833. [Google Scholar]
- Sousa, F.P. O terremoto do 1° de Novembro de 1755 em Portugal: Um estudo demográfico: Distritos de Lisboa. Tipogr. do Comer. 1928, 3, 479–949. [Google Scholar]
- Vos, K.; Vandenberghe, N.; Elsen, J. Surface textural analysis of quartz grains by scanning electron microscopy (SEM): From sample preparation to environmental interpretation. Earth-Sci. Rev. 2014, 128, 93–104. [Google Scholar] [CrossRef]
Figure 1.
Study area and location of the core CF2 on the Portuguese western coast, near the mouth of the Alcabrichel River. Upper right image is derived from Aster Digital Elevation Model for Portugal, 30 m spatial resolution (WGS 84) and elevations referenced to mean sea-level (MSL): Cascais vertical datum.
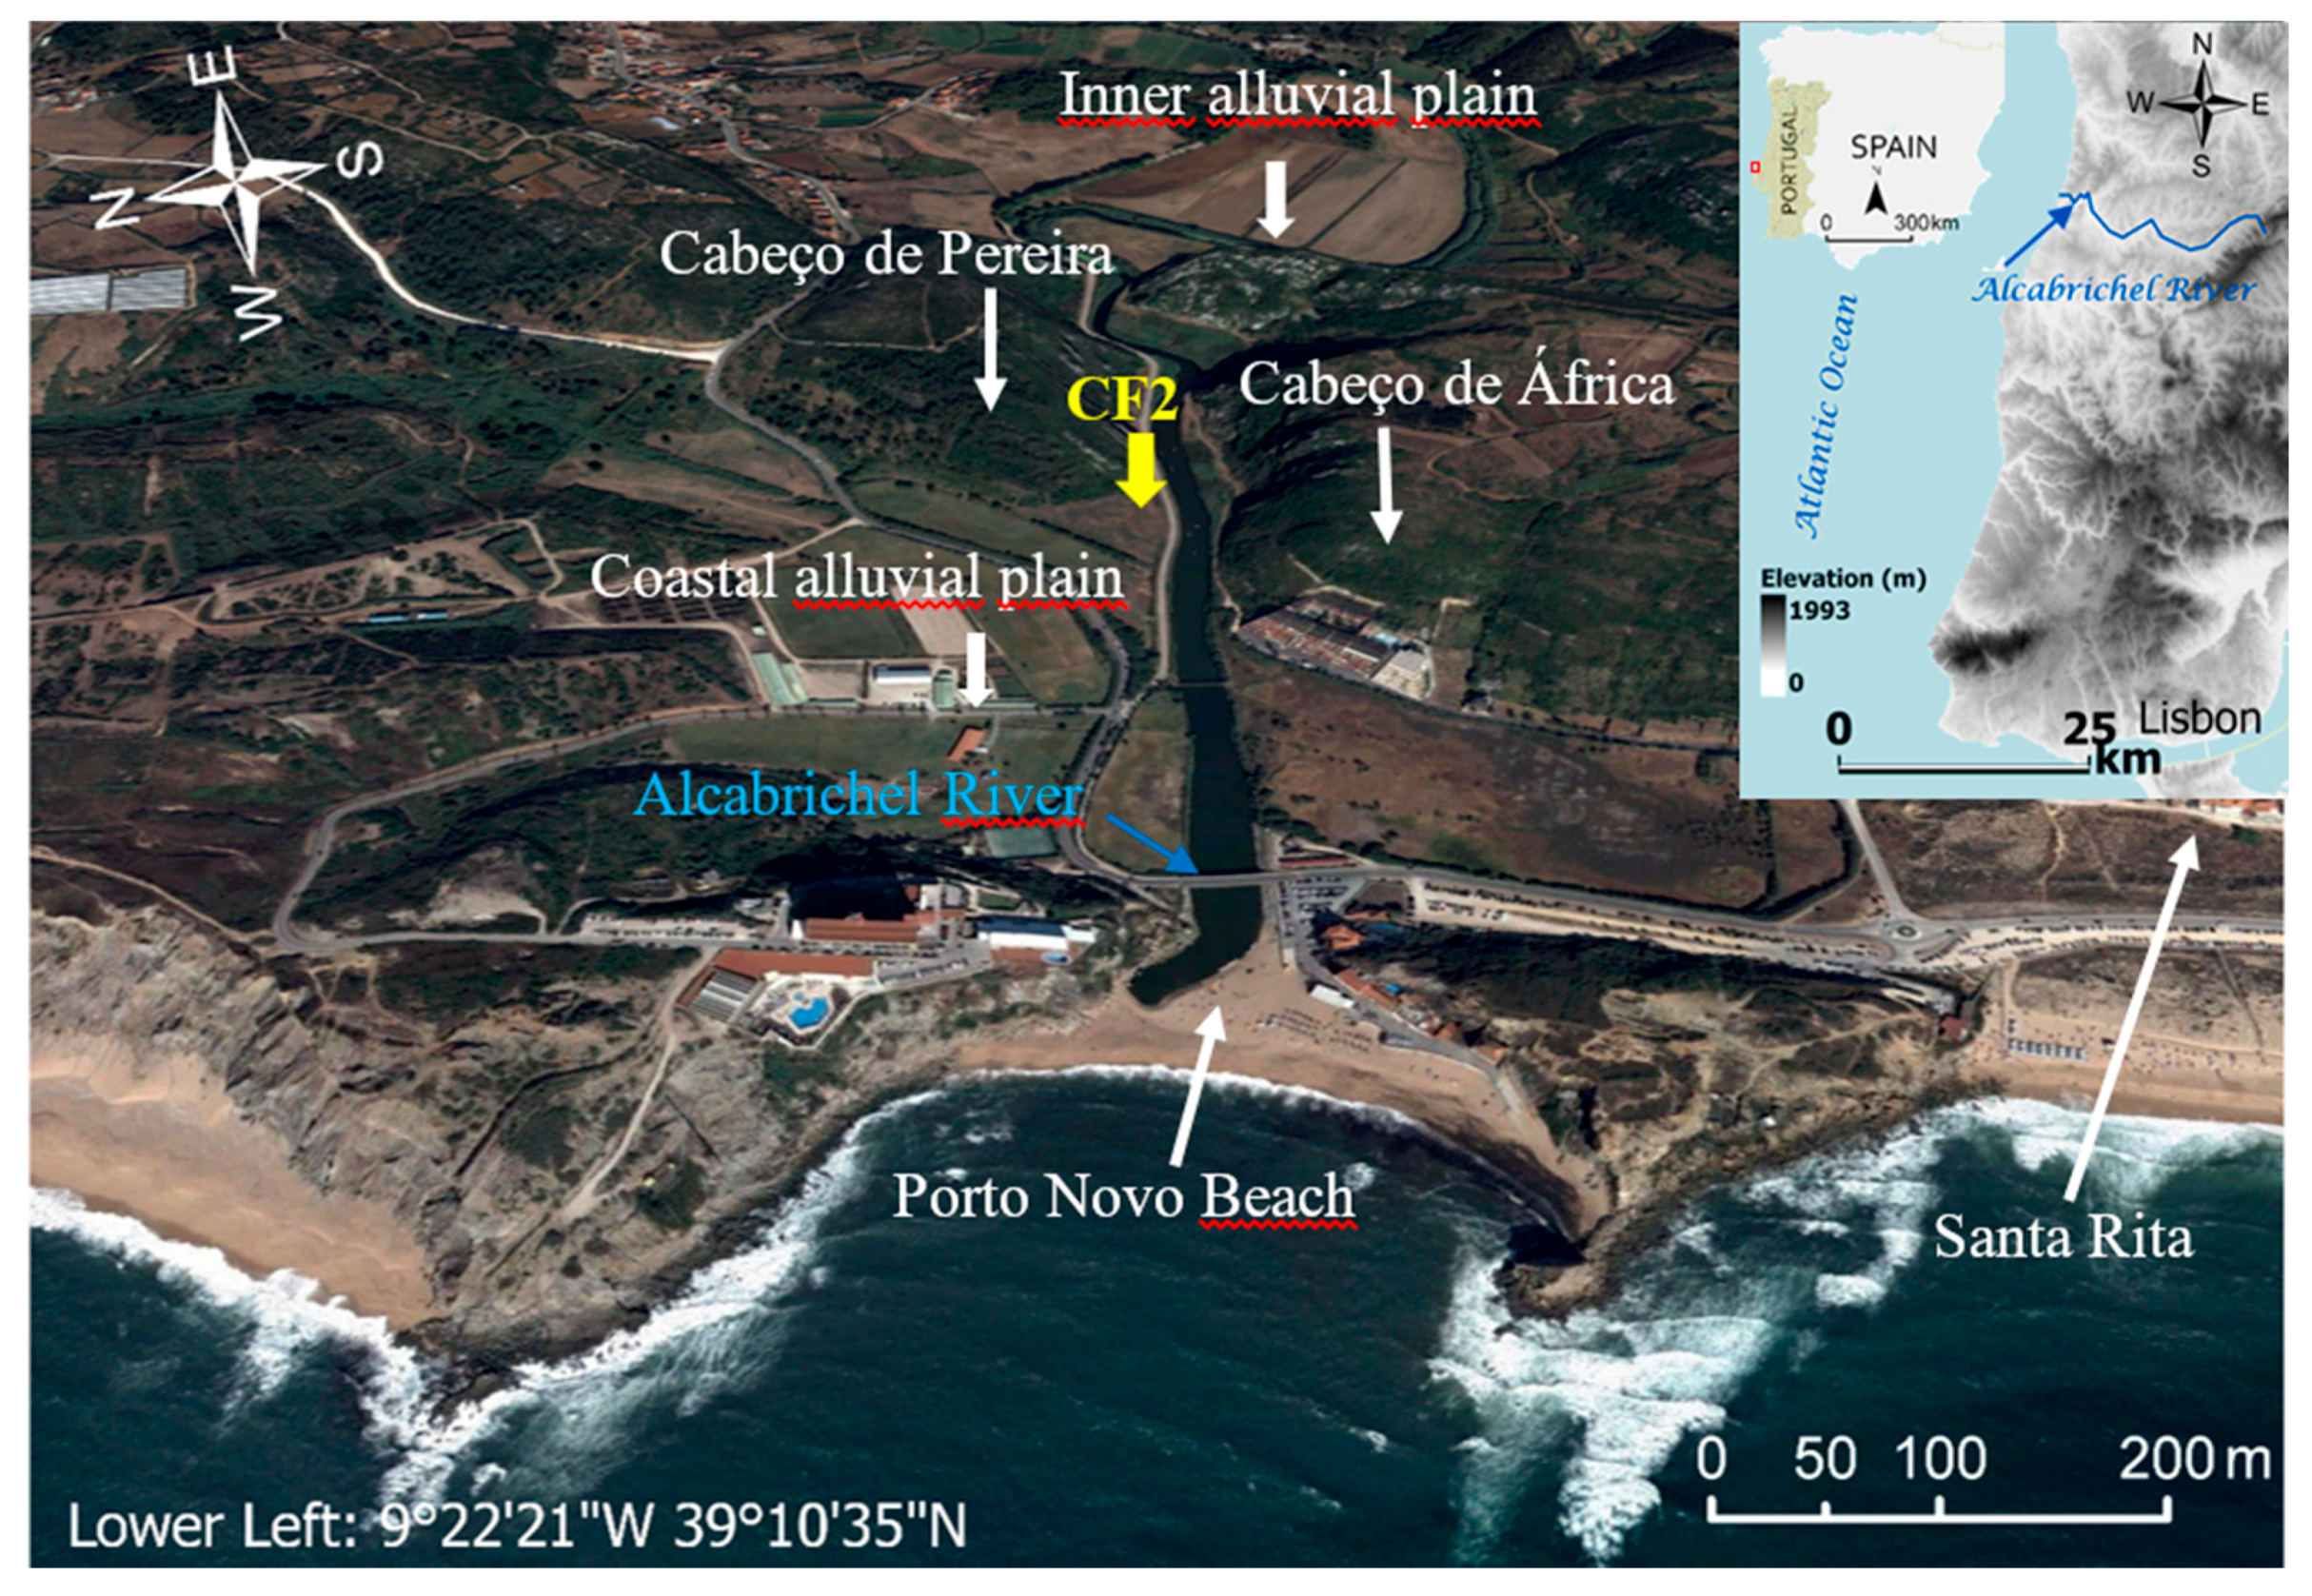
Figure 2.
Lithostratigraphy of the core CF 2, the vertical variation of the main textural parameters: Mean grain size (MZ), sorting (StdDev), skewness (Skew), and kurtosis (Kurt). The organic matter content (O.M.), calcium carbonate variation, and radiocarbon dating are also represented. The color lines represent the possibly extreme events, where the unit UL3 (the thick yellow line) was possibly deposited by the CE 1755 tsunami. The two thin lines in yellow and orange color correspond to the sandy layers (UL1a and UL2a) related to other possibly extreme events in the Alcabrichel River alluvial plain.

Figure 3.
Vertical distribution of the geochemical elements of CF2 core.
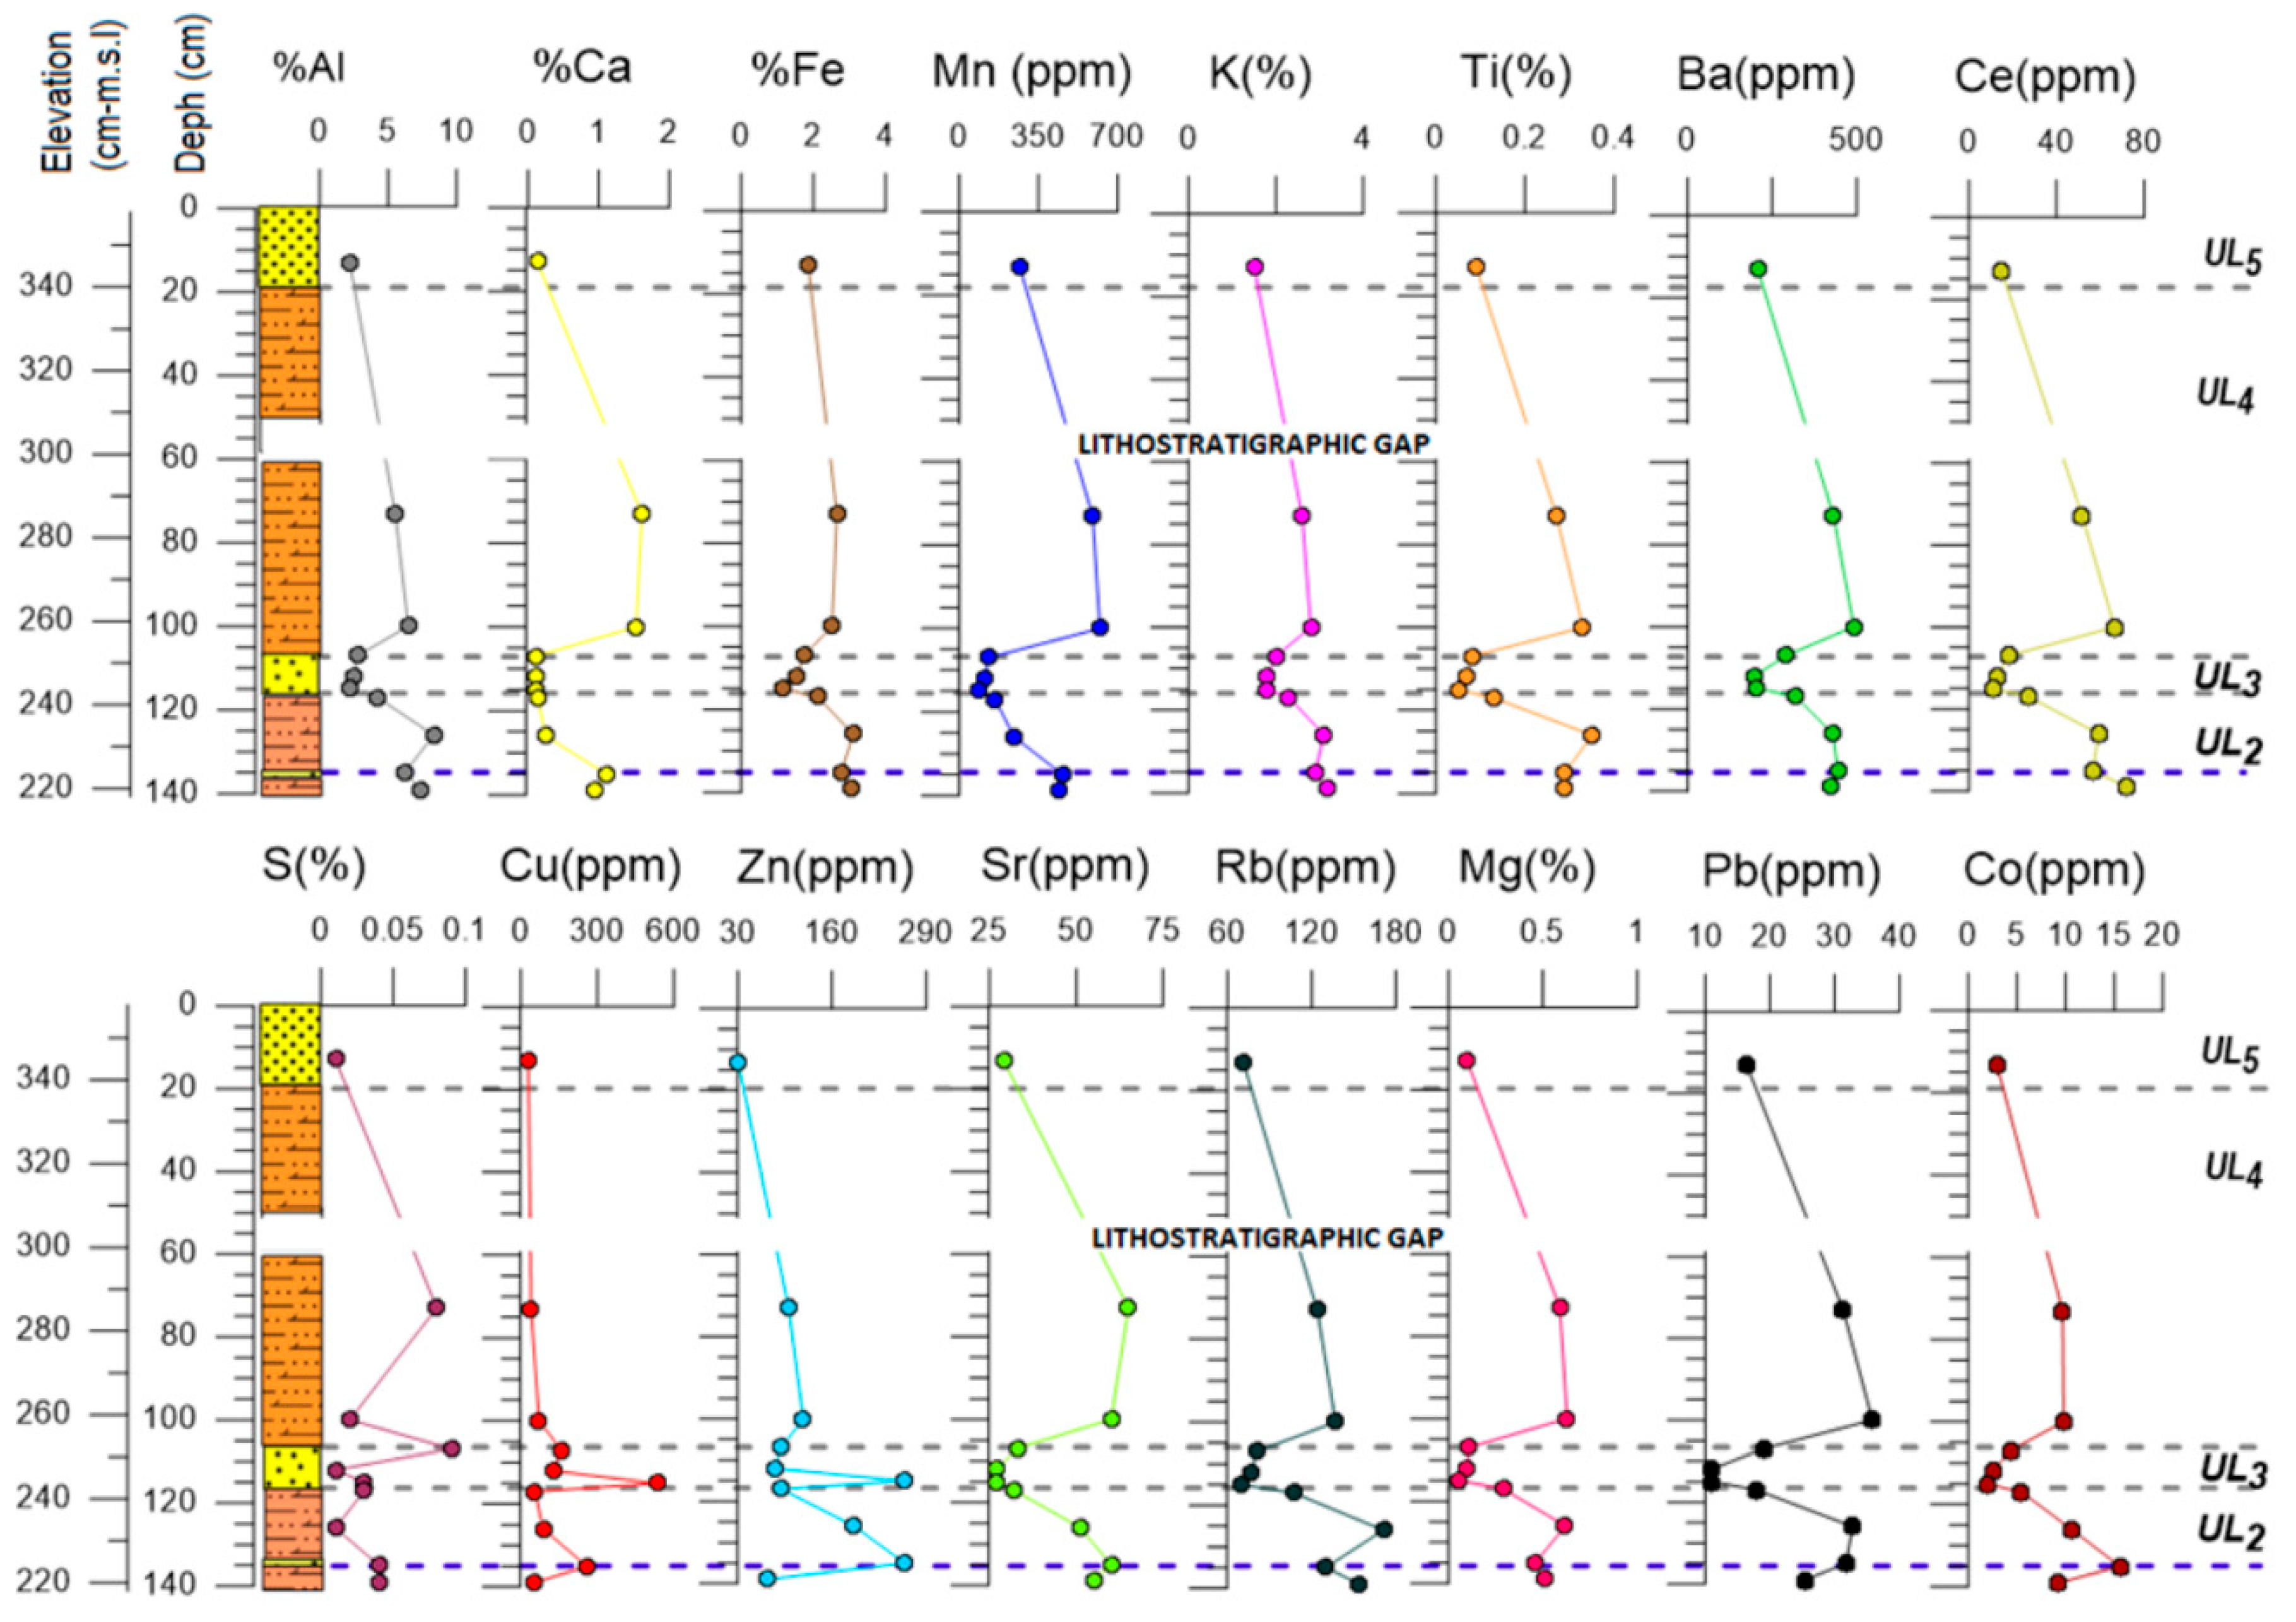
Figure 4.
Results of the morphoscopic study: (a) sediment composition; (b) morphometric parameters of quartz grains (roundness and sphericity); (c) quartz grain appearance (variety, coating, and surface aspect). Roundness is classified following the Power scale (1957): 0—well rounded, 1—rounded, 2—subrounded, 3—subangular, 4—angular, 5—very angular. Sphericity is classified following Krumbein and Sloss (1951): 0—low sphericity, 1—medium—low sphericity, 2—medium-high sphericity; 3—spherical grains.
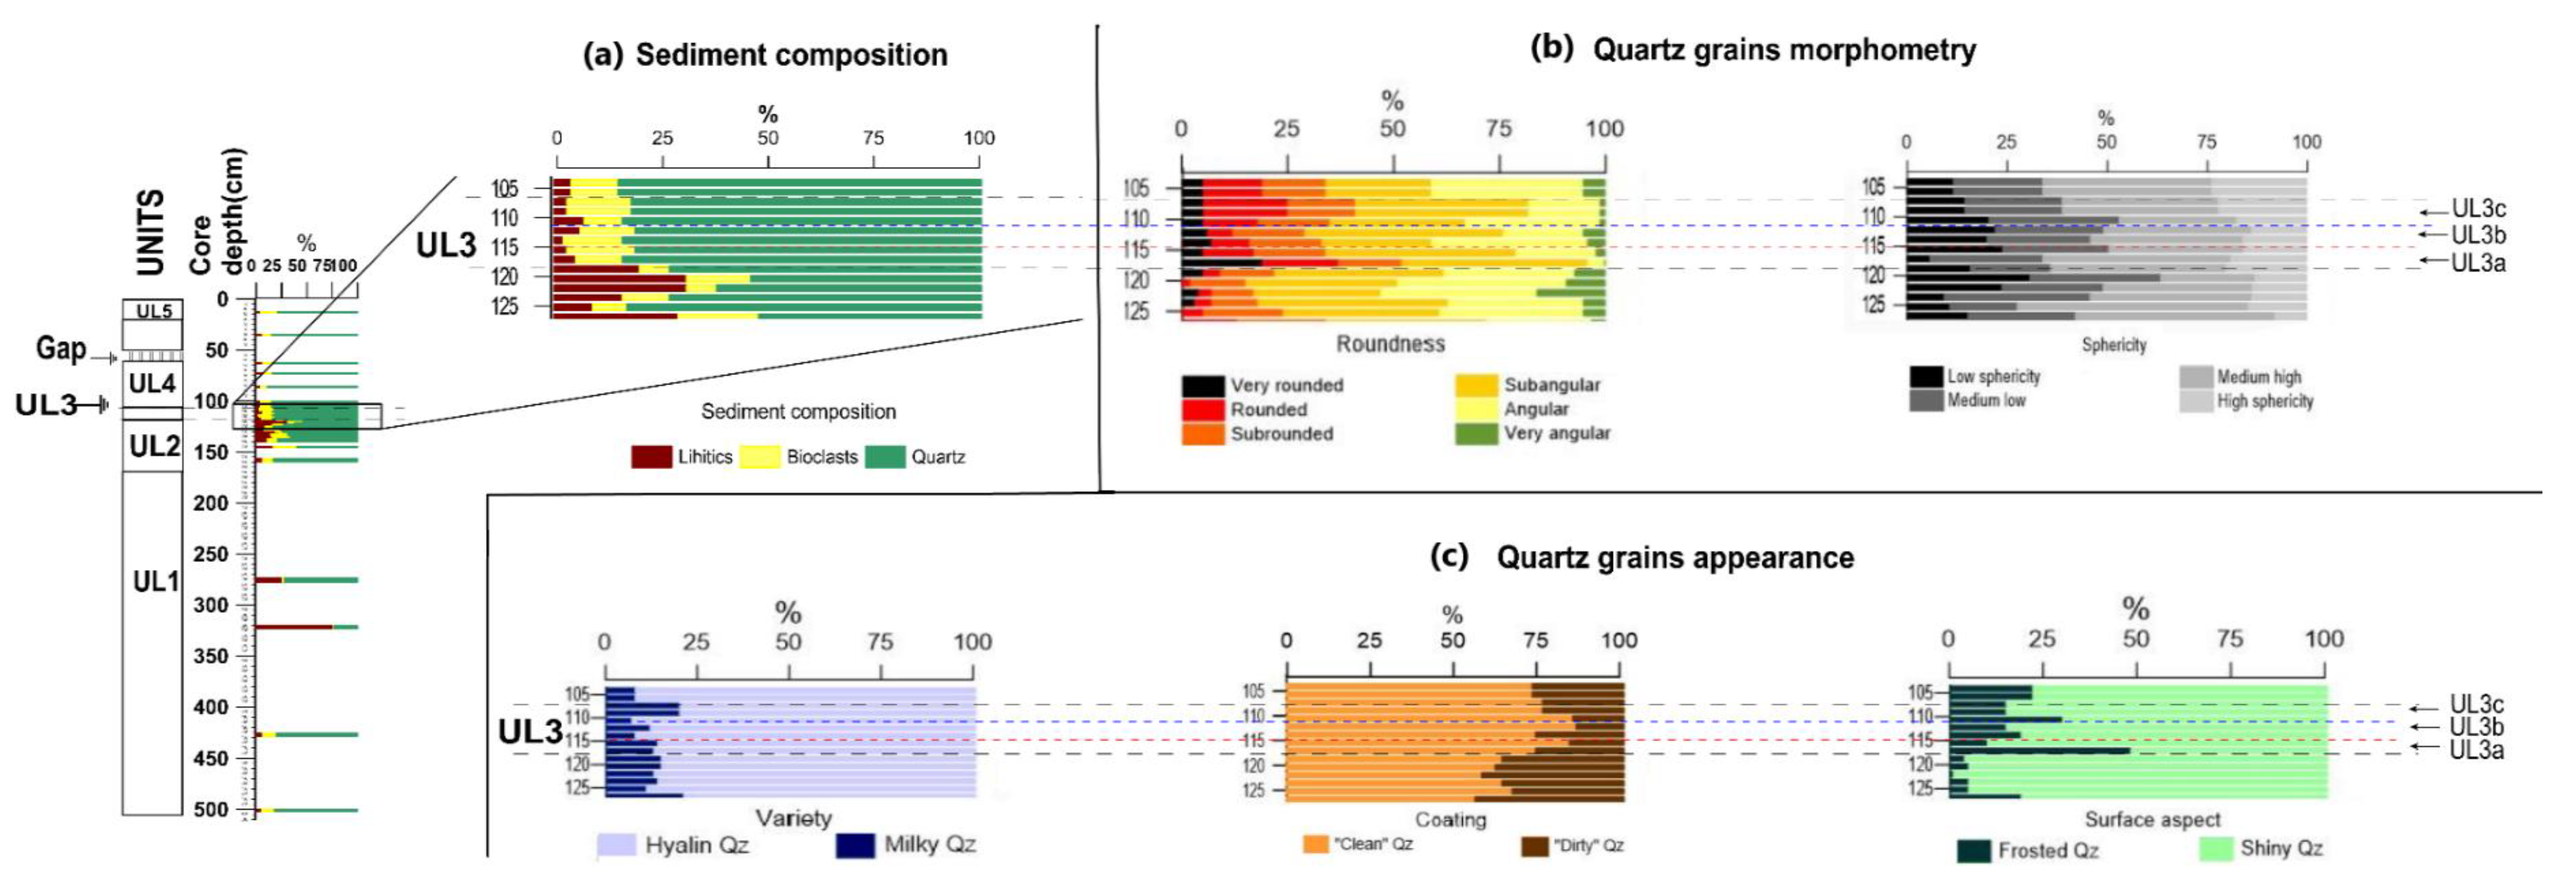
Figure 5.
Micrographs of quartz grains from UL3 unit—(A,B)—UL3a subunit: (A)—Well-rounded with low relief grain and small percussion marks features from the base of deposit; (B)—Subangular grain with rounded edges and “V” shapes and washed appearance; (C,D)—UL3b subunit: (C)—Subrounded grain with dissolution features marks and low relief; (D)—Angular grain with large “V” shape and medium relief; (E,F)—UL3c subunit: (E)—Rounded, shiny and looking washed grain, with low relief and percussion marks (a-conchoidal fractures); (F)—subrounded grain with medium relief, with several fresh surfaces. (a) indicates silica flowers.

Figure 6.
Framework of the morphoscopic and textural characteristics of the quartz grains identified in the three subunits of tsunami deposit.
Figure 6.
Framework of the morphoscopic and textural characteristics of the quartz grains identified in the three subunits of tsunami deposit.
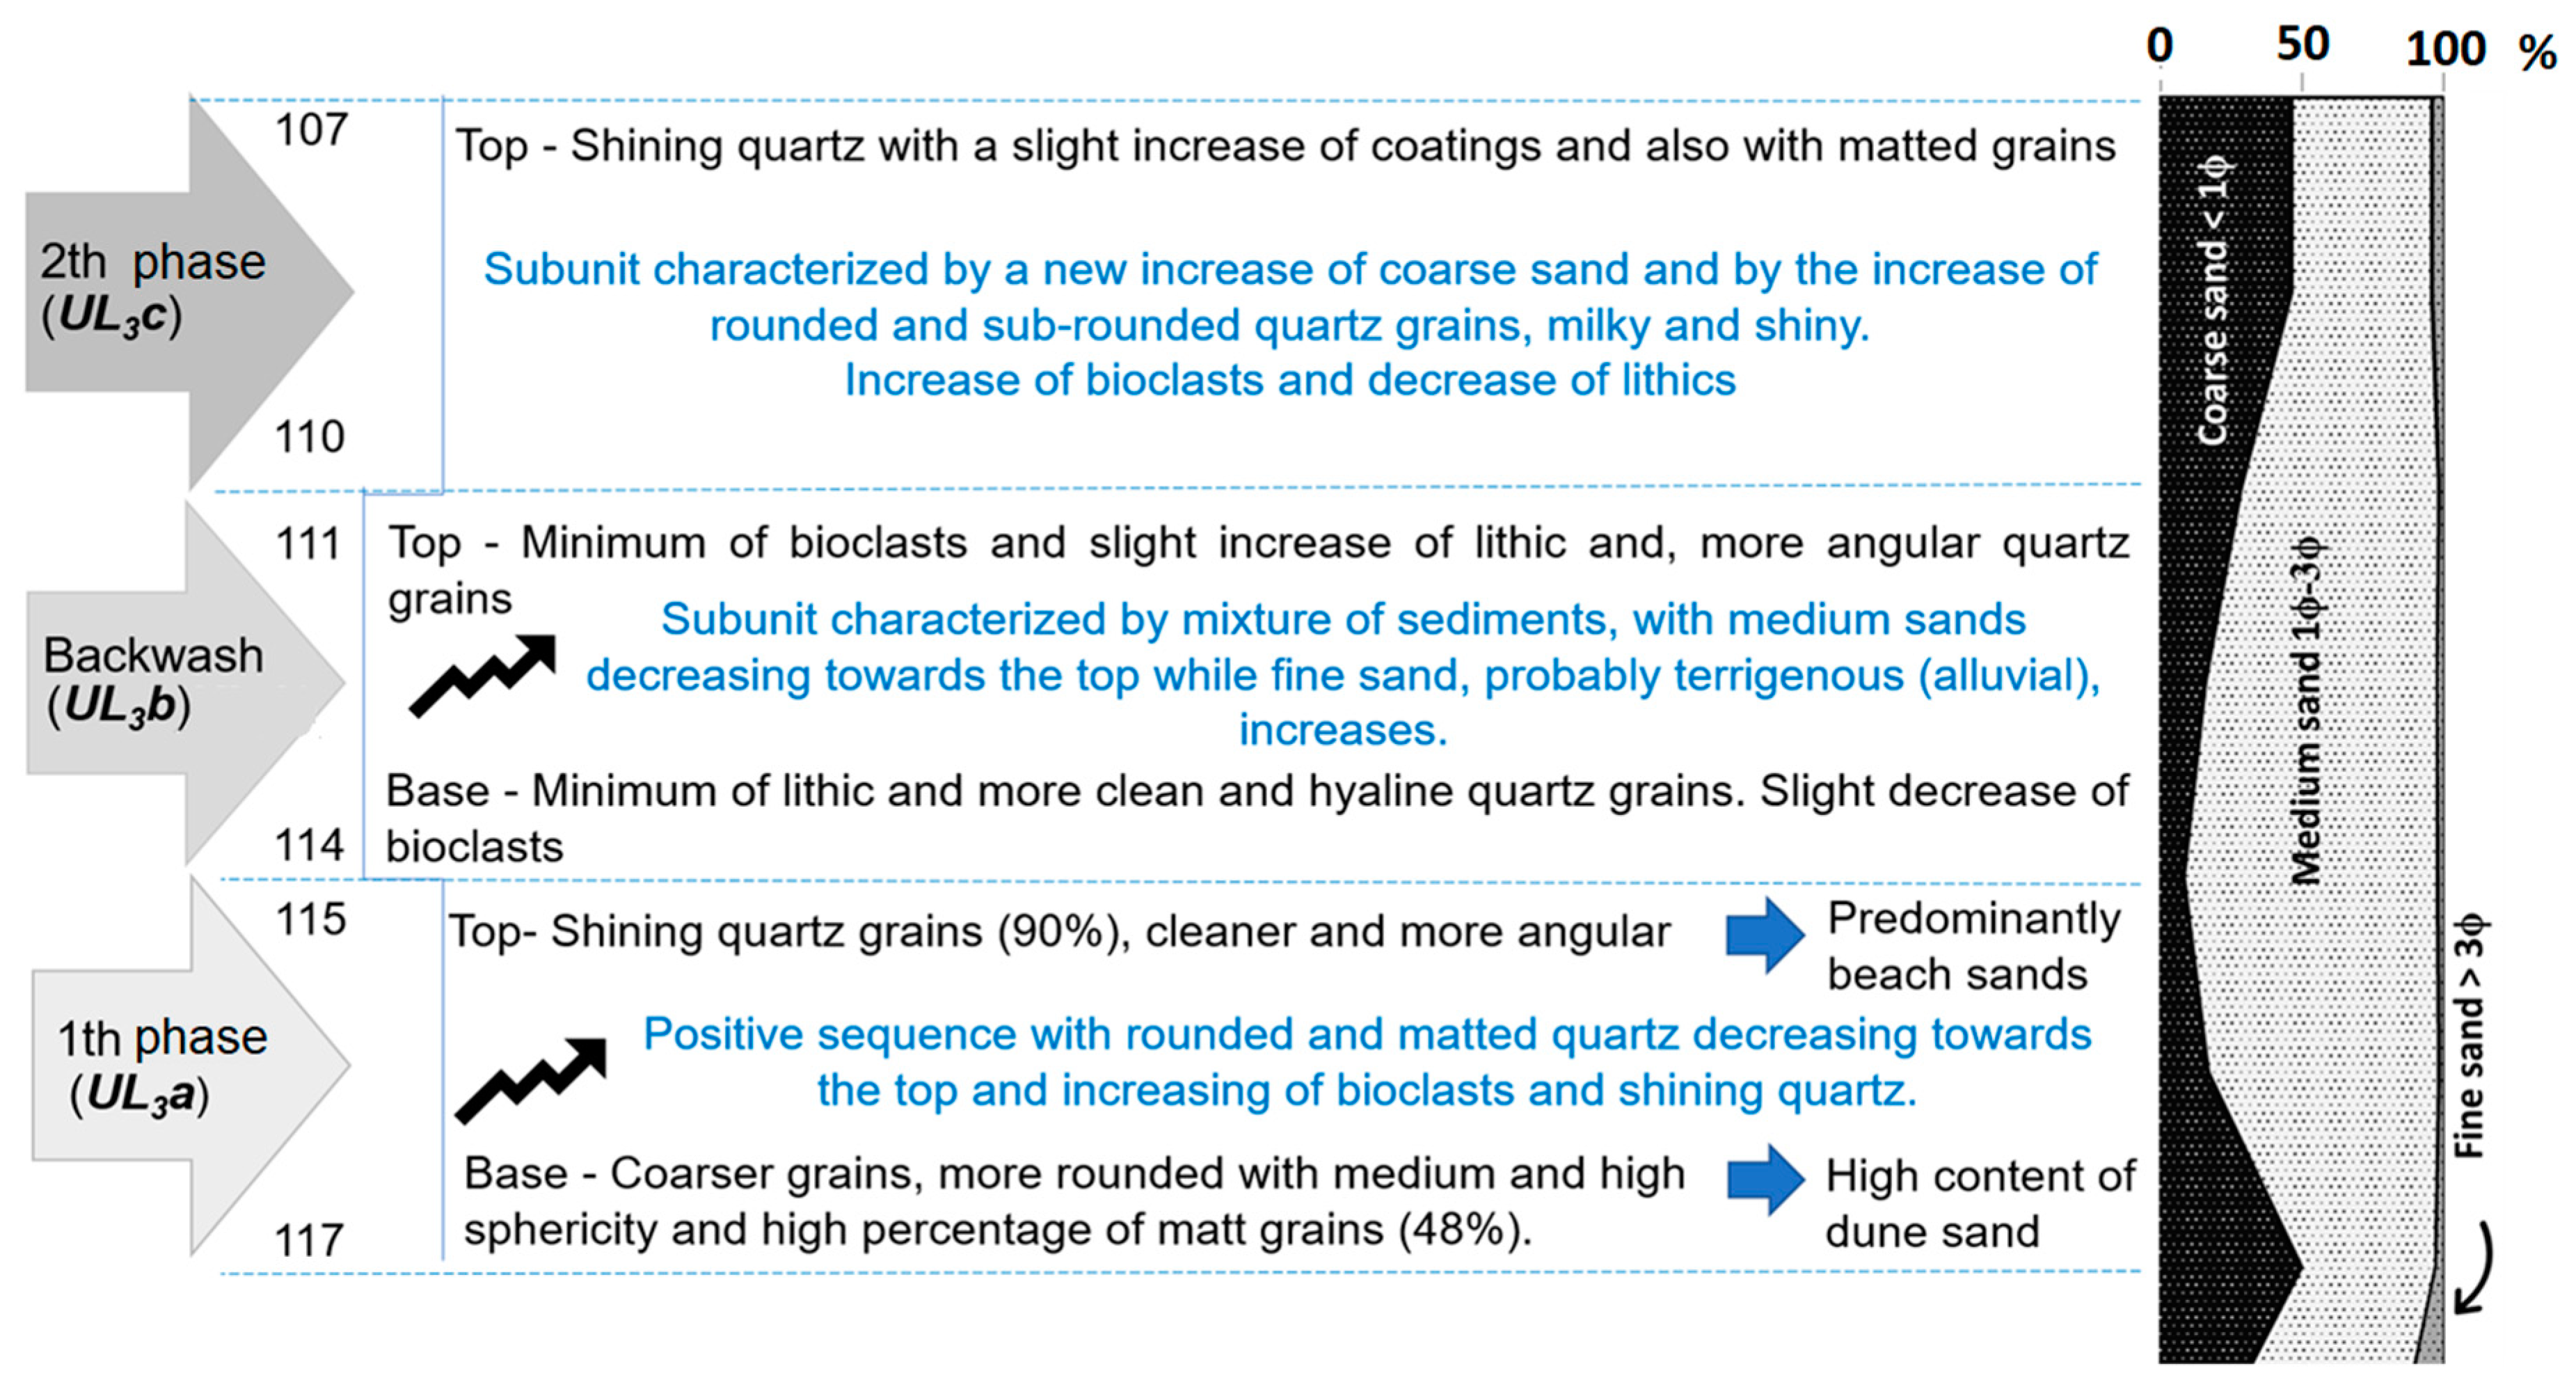
Figure 7.
Conceptual model of tsunami inundation and sediment source deposition.

Figure 8.
Principal component analysis (PCA) over the 12 samples and 5 microtextural features performed under the new qualitative and semi-quantitative classification of quartz grains (left quadrant). Right quadrant: each group of samples (extreme marine inundations and other sedimentary environments).

Table 1.
Results of radiocarbon dates, including the calculation of the deposition rates, as well as the calibrated dates for various depths. The unit UL3 corresponds to a possibly high energy event, eventually deposited by the tsunami that followed the CE 1755 Lisbon earthquake. Adapted from Ramos-Pereira et al. (2019).
| Elevation (cm-m.s.l) | Depth (cm) | Sed. Unit | Beta Ref. | δ13 C (‰) | Radiocarbon Date (BP) | Calendar Date (Cal BP) | Sedimentation Rate (cm/year) | |
|---|---|---|---|---|---|---|---|---|
| 1δ | 2δ | |||||||
| 310 | 40 | UL4 | 322976 | −26.6 | 111.2 ± 0.4 pMC | AD 1957 ± 1 | AD 1957 ± 1 | 0.21–0.57 |
| 261 | 89 | 322977 | −25.7 | 660 ± 30 b | 665–565 b | 673–558 b | ||
| 245 | 105 | 306–140 | 401–89 | |||||
| 243–233 | 107–117 | UL3 | ||||||
| 230 | 120 * | UL2 | 417–234 | 425–147 | ||||
| 218 | 132 | 322978 | −24.2 | 250 ± 30 | 423–284 | 434–156 | ||
| 180 | 170 * | UL1 | 1805–1254 | 1827–682 | 0.03–0.04 | |||
| 166 | 184 | 322979 | −24.8 | 1840 ± 30 | 1809–1726 | 1863–1706 | ||
| 154 | 196 * | 1893–1762 | 1953–1723 | 0.19–0.48 | ||||
| 132 | 218 | 322980 | −24.3 | 2020 ± 30 | 1986–1904 | 2006–1886 | ||
| 91 | 259 | 346148 | −24.6 | 2040 ± 31 | 2110–1988 | 2119–1961 | ||
| 49 | 301* | 3970–3069 | 4044–2438 | 0.03–0.04 | ||||
| 27 | 323 | 346149 | −24.9 | 3670 ± 30 | 4078–3929 | 4086–3905 | ||
| −9 | 359 | 346150 | −26.2 | 7340 ± 40 b | 8190–8050 b | 8300–8020 b | 0.05–0.09 | |
| −23 | 373 * | 4969–4269 | 5383–4088 | |||||
| −52 | 402 * | 5498–4725 | 5806–4400 | |||||
| −66 | 416 | 346151 | −26.2 | 6739 ± 40 b | 7650–7570 b | 7670–7510 b | ||
| −77 | 427 * | 5884–5185 | 6067–4770 | |||||
| −125 | 475 | 346152 | −25.0 | 5550 ± 40 | 6260–6019 | 6272–6000 | ||
| −151 | 501 * | 6652–6114 | 7320–6023 | |||||
a Calibration using the IntCal09 curve (REIMER et al., 2009) and the program OxCal 4.1 (Bronk Ramsey, 2008, 2009); b Outliers; * Calendar date modelled with the linear model.
Table 2.
Results of the microtextural classification based on the most recent microtexture identified on the surface of each grain. The values represent the frequency of each microtextural attribute in each sample.
Table 2.
Results of the microtextural classification based on the most recent microtexture identified on the surface of each grain. The values represent the frequency of each microtextural attribute in each sample.
| Depth (cm) | Units | Subunits | No. of Grains | Fresh Surfaces | Percussion Marks | Dissolution | Adhering Particles | Low Relief | Medium Relief | High Relief |
|---|---|---|---|---|---|---|---|---|---|---|
| 101 | UL4 | 22 | 23 | 27 | 41 | 9 | 64 | 27 | 9 | |
| 107 | UL3 | UL3c | 25 | 54 | 29 | 8 | 8 | 71 | 29 | 0 |
| 111 | UL3 | UL3b | 22 | 45 | 36 | 14 | 5 | 55 | 45 | 0 |
| 112 | UL3 | UL3b | 19 | 47 | 21 | 26 | 5 | 16 | 79 | 5 |
| 114 | UL3 | UL3b | 21 | 38 | 33 | 14 | 14 | 52 | 43 | 5 |
| 115 | UL3 | UL3a | 23 | 35 | 30 | 26 | 9 | 65 | 26 | 9 |
| 117 | UL3 | UL3a | 20 | 25 | 30 | 40 | 5 | 70 | 30 | 0 |
| 120 | UL2 | 15 | 7 | 13 | 53 | 27 | 40 | 60 | 0 | |
| 125 | UL2 | 17 | 41 | 24 | 29 | 6 | 35 | 59 | 6 | |
| 133 | UL2 | UL2a | 31 | 23 | 26 | 35 | 16 | 35 | 42 | 19 |
| 135 | UL2 | UL2a | 20 | 24 | 24 | 38 | 14 | 62 | 38 | 5 |
| 138 | UL2 | 24 | 13 | 25 | 46 | 17 | 46 | 33 | 21 |
© 2020 by the authors. Licensee MDPI, Basel, Switzerland. This article is an open access article distributed under the terms and conditions of the Creative Commons Attribution (CC BY) license (http://creativecommons.org/licenses/by/4.0/).
Share and Cite
MDPI and ACS Style
Tudor, M.; Ramos-Pereira, A.; Costa, P.J.M. A Possible Tsunami Deposit Associated to the CE 1755 Lisbon Earthquake on the Western Coast of Portugal. Geosciences 2020, 10, 257. https://doi.org/10.3390/geosciences10070257
AMA Style
Tudor M, Ramos-Pereira A, Costa PJM. A Possible Tsunami Deposit Associated to the CE 1755 Lisbon Earthquake on the Western Coast of Portugal. Geosciences. 2020; 10(7):257. https://doi.org/10.3390/geosciences10070257
Chicago/Turabian StyleTudor, Mihaela, Ana Ramos-Pereira, and Pedro J.M. Costa. 2020. "A Possible Tsunami Deposit Associated to the CE 1755 Lisbon Earthquake on the Western Coast of Portugal" Geosciences 10, no. 7: 257. https://doi.org/10.3390/geosciences10070257
Note that from the first issue of 2016, this journal uses article numbers instead of page numbers. See further details here.