The Role of Cover Thickness in the Rainfall-Induced Landslides of Nocera Inferiore 2005


1
Dipartimento di Ingegneria Civile, Edile ed Ambientale (DICEA), Università degli studi di Napoli “Federico II”, Via Claudio, 21, 80125 Napoli, Italy
2
REgional Model and geo-Hydrological Impacts, Centro Euro-Mediterraneo sui Cambiamenti Climatici, Via Thomas Alva Edison, 81100 Caserta, Italy
*
Author to whom correspondence should be addressed.
Geosciences 2020, 10(6), 228; https://doi.org/10.3390/geosciences10060228
Submission received: 5 March 2020
/
Revised: 15 May 2020
/
Accepted: 1 June 2020
/
Published: 11 June 2020
(This article belongs to the Special Issue Innovative Strategies for Sustainable Mitigation of Landslide Risk)
Abstract
:In the context of rainfall-induced landslides involving pyroclastic soils, the present work analyzes the influence of cover thickness on slope stability conditions. To this aim, the slope failure that occurred in Nocera Inferiore (4th March 2005) is selected as a reference test case, providing the actual weather forcing history that preceded the event, the hydraulic characterization of the soil involved, and the lowermost boundary condition (variously fractured calcareous bedrock underlying the cover). By maintaining unchanged soil hydraulic properties, the relationship between domain thickness, initial soil suction distribution, and slope instability induced by critical rainfall is investigated by numerical analyses. These refer to a rigid unsaturated domain subject to one dimensional flow conditions under the effects of incoming (precipitation) and outcoming (evaporation) fluxes applied at the uppermost boundary. The main outcomes indicate that critical event duration increases significantly with increasing the domain thickness. This relationship is strongly influenced by initial suction distribution. A linear relationship results for soil suction that is assumed to be constant at the beginning of the critical event. However, this relationship is quadratic if, by simulating the actual antecedent meteorological conditions, suction at the beginning of the critical event is the main function of the domain thickness. Additional numerical analyses were carried out to characterize the influence of a different lowermost boundary condition. Outcomes indicate that, for the same thickness, critical duration is substantially longer if the cover contact is with the same material as that of the cover.
1. Introduction
In recent decades, rainfall-induced landslides have caused increasing damage and causalities globally [1]. Practitioners and scientists have consequently attempted to characterize the main mechanisms involved and to develop mitigation strategies. As communities and decision makers have increased their interest in environmentally compliant solutions, an increasing number of investigations have been focused on improving the efficiency of nature-based approaches [2] and non-structural approaches (early warning systems) [3,4,5].
Among these phenomena, debris avalanches and debris flows occurring in silty volcanic cover [6,7,8] have been greatly considered, as they have increased in frequency and magnitude globally during the past three decades. The Campania Region (Italy) is a much-studied area, due to the extensive presence of volcanic cover that originated from Vesuvius and Campi Flegrei eruptions over tens of thousands of years [9]. A typical susceptible stratigraphy comprises cover of a few meters placed over flysch deposit, tuff, or calcareous bedrock, with a slope of 30–45 degrees, and characterized by high porosity (70% or above). Sliding rates of tens of kilometers per second have sometimes characterized the kinematics of hundreds of thousands of cubic meters of debris, resulting in several catastrophic events.
For these phenomena, several recently published works have focused on identifying the factors affecting the triggering stage and the post-failure kinematics of the sliding mass. Many studies have attempted to detect susceptible slopes in terms of geomorphological indicators, particularly stratigraphy, slope tilting, and the thickness of the volcanic cover overlying tuff, calcareous, and flysch bedrocks [10,11,12,13]. Several works illustrate the intrinsic and state properties of the involved materials [14]. Other works characterize mechanical soil behavior in unsaturated or saturated conditions, in terms of strength parameters [6,15,16,17], compressibility [14], collapsibility upon wetting [18,19], state conditions inducing liquefaction susceptibility [20,21], and soil hydraulic properties [22,23,24]. Still others illustrate and interpret results by field or physical model monitoring [25,26], with the aim to assess the impact of suction and water content evolution on pyroclastic covers under different weather scenarios and, in addition, how these evolutions affect slope stability conditions [25,27,28,29,30,31]. In the same field, some works attempt to gain insight into the complex topics of the soil–atmosphere interaction and boundary conditions generated at the uppermost surface by weather conditions in terms of rainfall infiltration and evapotranspiration [32,33,34]. Some studies have even focused on the effect of the lowermost boundary conditions on different contact types standing at the cover bottom [32,35].
Despite its importance, the role that cover thickness plays in stability conditions has received little attention by researchers in the field of the stability of volcanic covers. Some theoretical investigations have been made about covers made of coarser and more pervious soils than those in hand, in which it was found that cover thickness does not significantly affect stability conditions if compared with soil hydraulic and mechanical properties [36] or that a thicker cover worsens stability conditions [37,38]. In several geological works concerning silty pyroclastic covers, the cover thickness is adopted as a key factor to assess susceptibility to debris avalanches [39]. This susceptibility is related to the existence of a sloping mass that is sufficiently greater than a critical amount to cause damage in the case of sliding. Thus, a thicker cover in these a works seems implicitly related to a worsening of stability conditions. This assumption is certainly true if the strength contribution provided by suction, , is, for instance, assumed constant throughout the cover and not affected by the cover thickness.
Indeed, considering, for example, a cohesionless sloping cover of thickness , relatively small compared to the slope length, lying on an infinitely resistant bedrock, inclined by , the expression of safety factor (FS) under partially saturated conditions delivered by limit analysis of an infinite slope [40] can be written as:
where represents the angle of internal friction, the soil unit weight, and a parameter, ranging from 0 to 1, representing soil wetness conditions.
Under the assumption of constant suction within the cover, a virtual increase in cover thickness would determine an increase in driving forces (denominator of second term) with resistance forces held constant. On the other hand, monitoring and theoretical findings indicate that covers experience a continuous change in outcoming and incoming water fluxes that systematically lead to transient conditions and suction changes, with the latter strongly affected by the cover thickness. In this way, stability conditions may even benefit from a thicker cover, as it facilitates the spreading of the same rainfall volume within a larger soil volume, limiting the average rainfall-induced suction drops. In the second term of Equation (1), the numerator might increase by more than the denominator, resulting in an increase in FS.
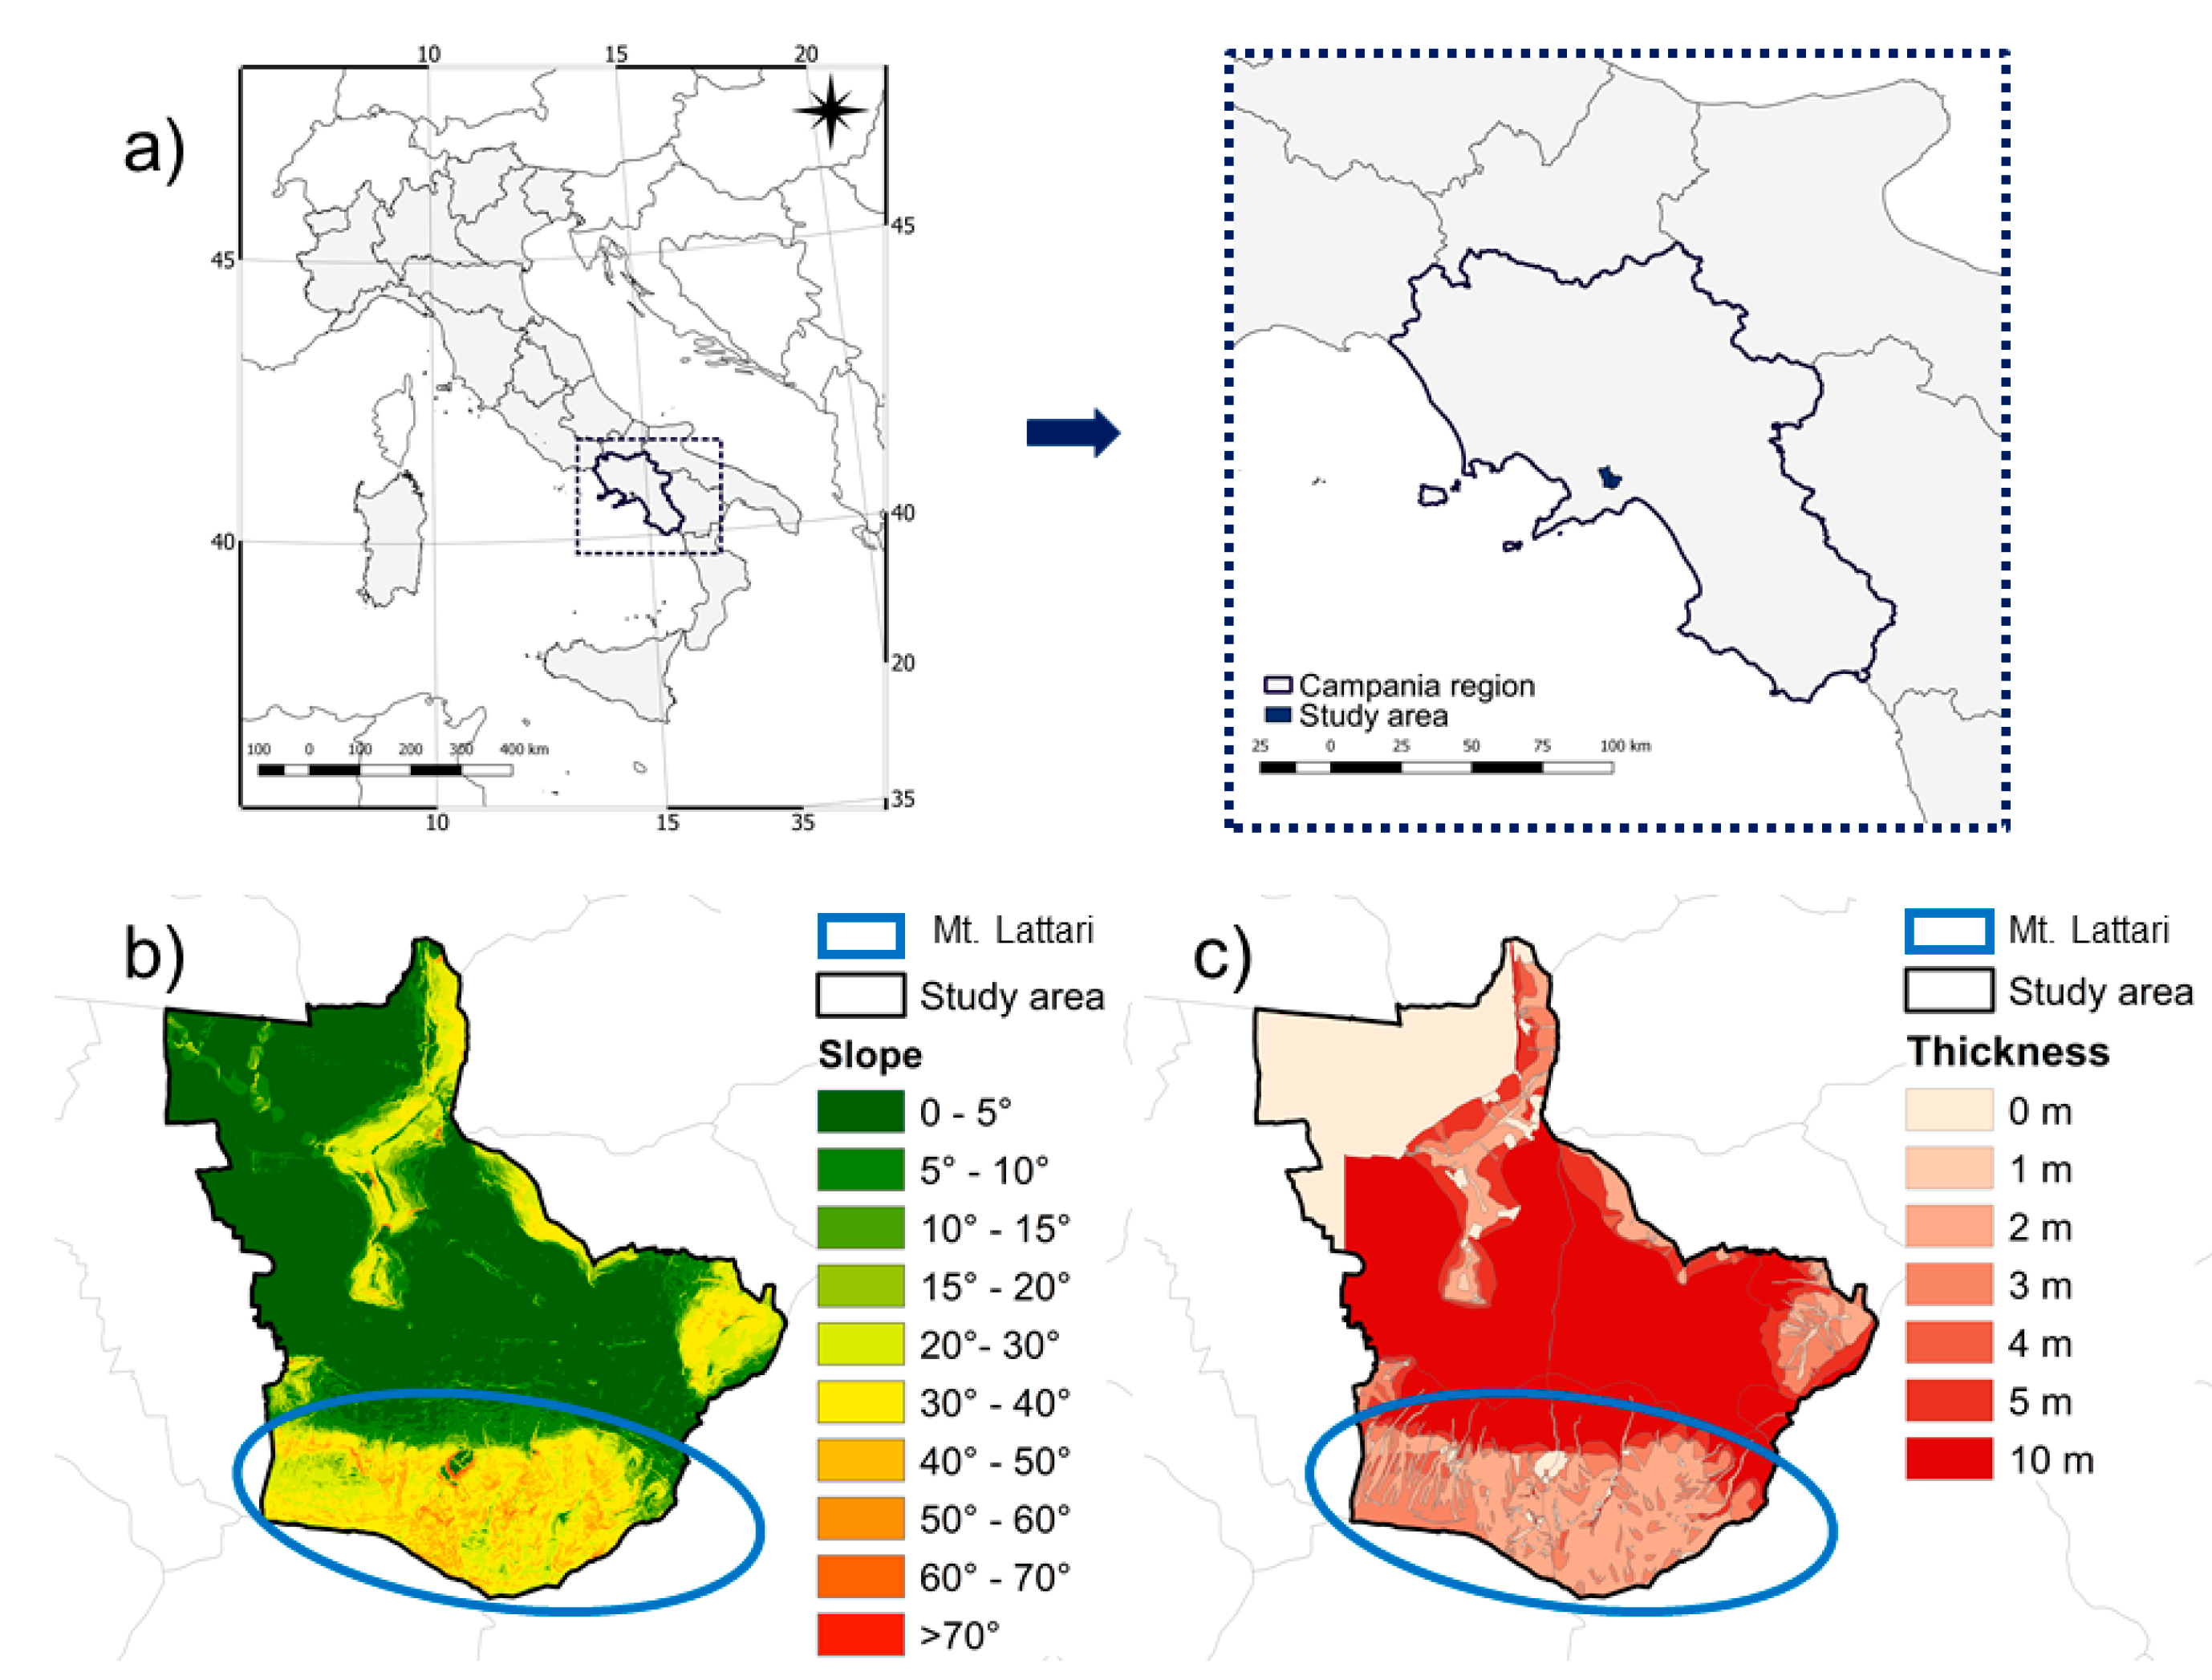
The aim of the current research is to provide quantitative insights about the effects of cover thickness on stability conditions for slopes subjected to rainfall and other meteorological conditions. The study exploits a previous theoretical investigation of the hydrological evolution that resulted in the Nocera Inferiore 2005 landslide [8], which occurred on the slopes of Mount Albino, situated in the Lattari Mountains (Figure 1).
Such a case study is used as a reference regarding material properties, evolution of antecedent meteorological conditions, and lowermost boundary conditions, to carry out the investigation within a realistic context. The effects of a hypothetical increase or decrease in cover thickness from the actual value (2 m) measured at the triggering area are investigated by analyses carried out by means of numerical simulations. These are aimed at interpreting the hydrological response of domains of different thicknesses to weather forcing histories able to potentially induce slope failure events. The numerical analyses are carried out by Finite Element Method (FEM) resolution of Richards’ equation. The aim is to characterize the relationship between cover thickness and a virtual rainfall event inducing instability (critical event). The influence of antecedent meteorological conditions on this relationship is also characterized.
The paper initially describes the relevant geomorphological and climatological contexts. It then describes soil properties of covers involved in the test case area. Subsequently, it provides details about theoretical approaches adopted to study the influence of the cover thickness. Finally, it illustrates and discusses results yielded by the analyses.
2. Geomorphological and Climatological Contexts
2.1. Geomorphological Context
The study area is the district of Nocera Inferiore, located in Southern Italy, 15 km north-west of the town of Salerno. The southern part of the town is bordered by the Lattari Mountains, where sloping pyroclastic covers have often been affected by debris avalanches.
Several works have attempted estimations of the thickness distribution of pyroclastic covers over fractured carbonaceous slopes of the Lattari Mountains. Matano et al. [10] derived pyroclastic cover thicknesses throughout the Mount Albino slopes using in situ investigations, a geostatistical interpolation technique, and a heuristic approach. In steeper and craggier slopes, cover thicknesses were found to vary greatly between 1.5 and 4.5 m, while in the foothill zones they were found to be larger. Lucà et al. [12] adopted a stochastic approach to build a map of cover thickness for the Mount Pendolo slopes (Gragnano), located around 10 km from Mount Albino slopes. Their find were in a range fully consistent with that obtained for Mount Albino slopes. In several investigations, cover thicknesses are estimated at a scale (regional) larger than that of a single slope [11,13]. Del Soldato et al. [13] compared cover thicknesses evaluated using different approaches for areas surrounding the volcanic centers of Somma-Vesuvius and Campi Flegrei, and including the slopes mentioned above. For the Lattari Mountains, the work confirms the thickness range noted earlier. On gentle slopes, the stratigraphy includes, moving from bedrock to ground surface, a basal paleosol of silty sand or sandy silt about 1 m thick, resulting from ancient eruptions; a layer of pumice (coarse sand and gravels) with a low degree of weathering up to 1 m thick; and a weathered and pedogenized volcanic ash layer, up to 1 m thick, made of silty sands or sandy silt [41,42,43]. For the same area, a similar layering was also indicated by Di Crescenzo & Santo [44] for those slopes known to be previously affected by debris avalanches.
For steeper slopes, characterized by slope angles higher than 30°–35°, the layer of pumice tends to vanish. In this way, the stratigraphy of the pyroclastic cover, still made of two layers from a geological point of view, becomes almost homogeneous in hydraulic properties. Such homogeneity is observed for the landslide area of the Nocera Inferiore landslide at the apical zone, where the phenomenon was thought to have been triggered [45]. The same homogeneity was also observed in numerous other areas of the Lattari Mountains affected by debris avalanches in the past, such as the San Pantaleone hill (phenomena occurred in 1961, 1972, and 1997) and Monte Pendolo (phenomenon occurred in 1971).
For these silty covers, the finest component of ash soils (silt with some clay) is generally non-plastic due to its volcanic origin. Soil porosity can be as high as 70% with peaks attaining 80%.
2.2. Climatological Context and Impact on Landslides
Within the reference area, the mean annual rainfall was about 1140 mm for the period 1981–2010, with mean maximum daily rainfall of 92 mm. Over the same time span, the mean temperature was 18 °C, with maximum mean value of about 22.8 °C and minimum of 13.4 °C. According to the Köppen–Geiger climate classification [46], the investigated site falls into the Csa group—that is, a humid temperate climate with dry summers and the warmest month characterized by temperatures higher than 22 °C. Two different climatological regimes can be recognized each year: the first, from October to April, features significant rainfall cumulative values (about 70% of the total annual value) and lower temperatures, and the latter, from May to September, features warmer temperatures and low cumulative rainfall values.
Landslides affect covers around two meters thick. The debris avalanches that occurred in the past 60 years were induced by rainfall amounts exceeding 500 mm over the antecedent period considered in the same hydrological year, and a critical rainfall event that was exceptional for its persistency (as long as 15 h) rather than its intensity or accumulated amount. Rianna et al. [47] attempted to provide a physical interpretation of the rainfall patterns generating slope instability in these soils.
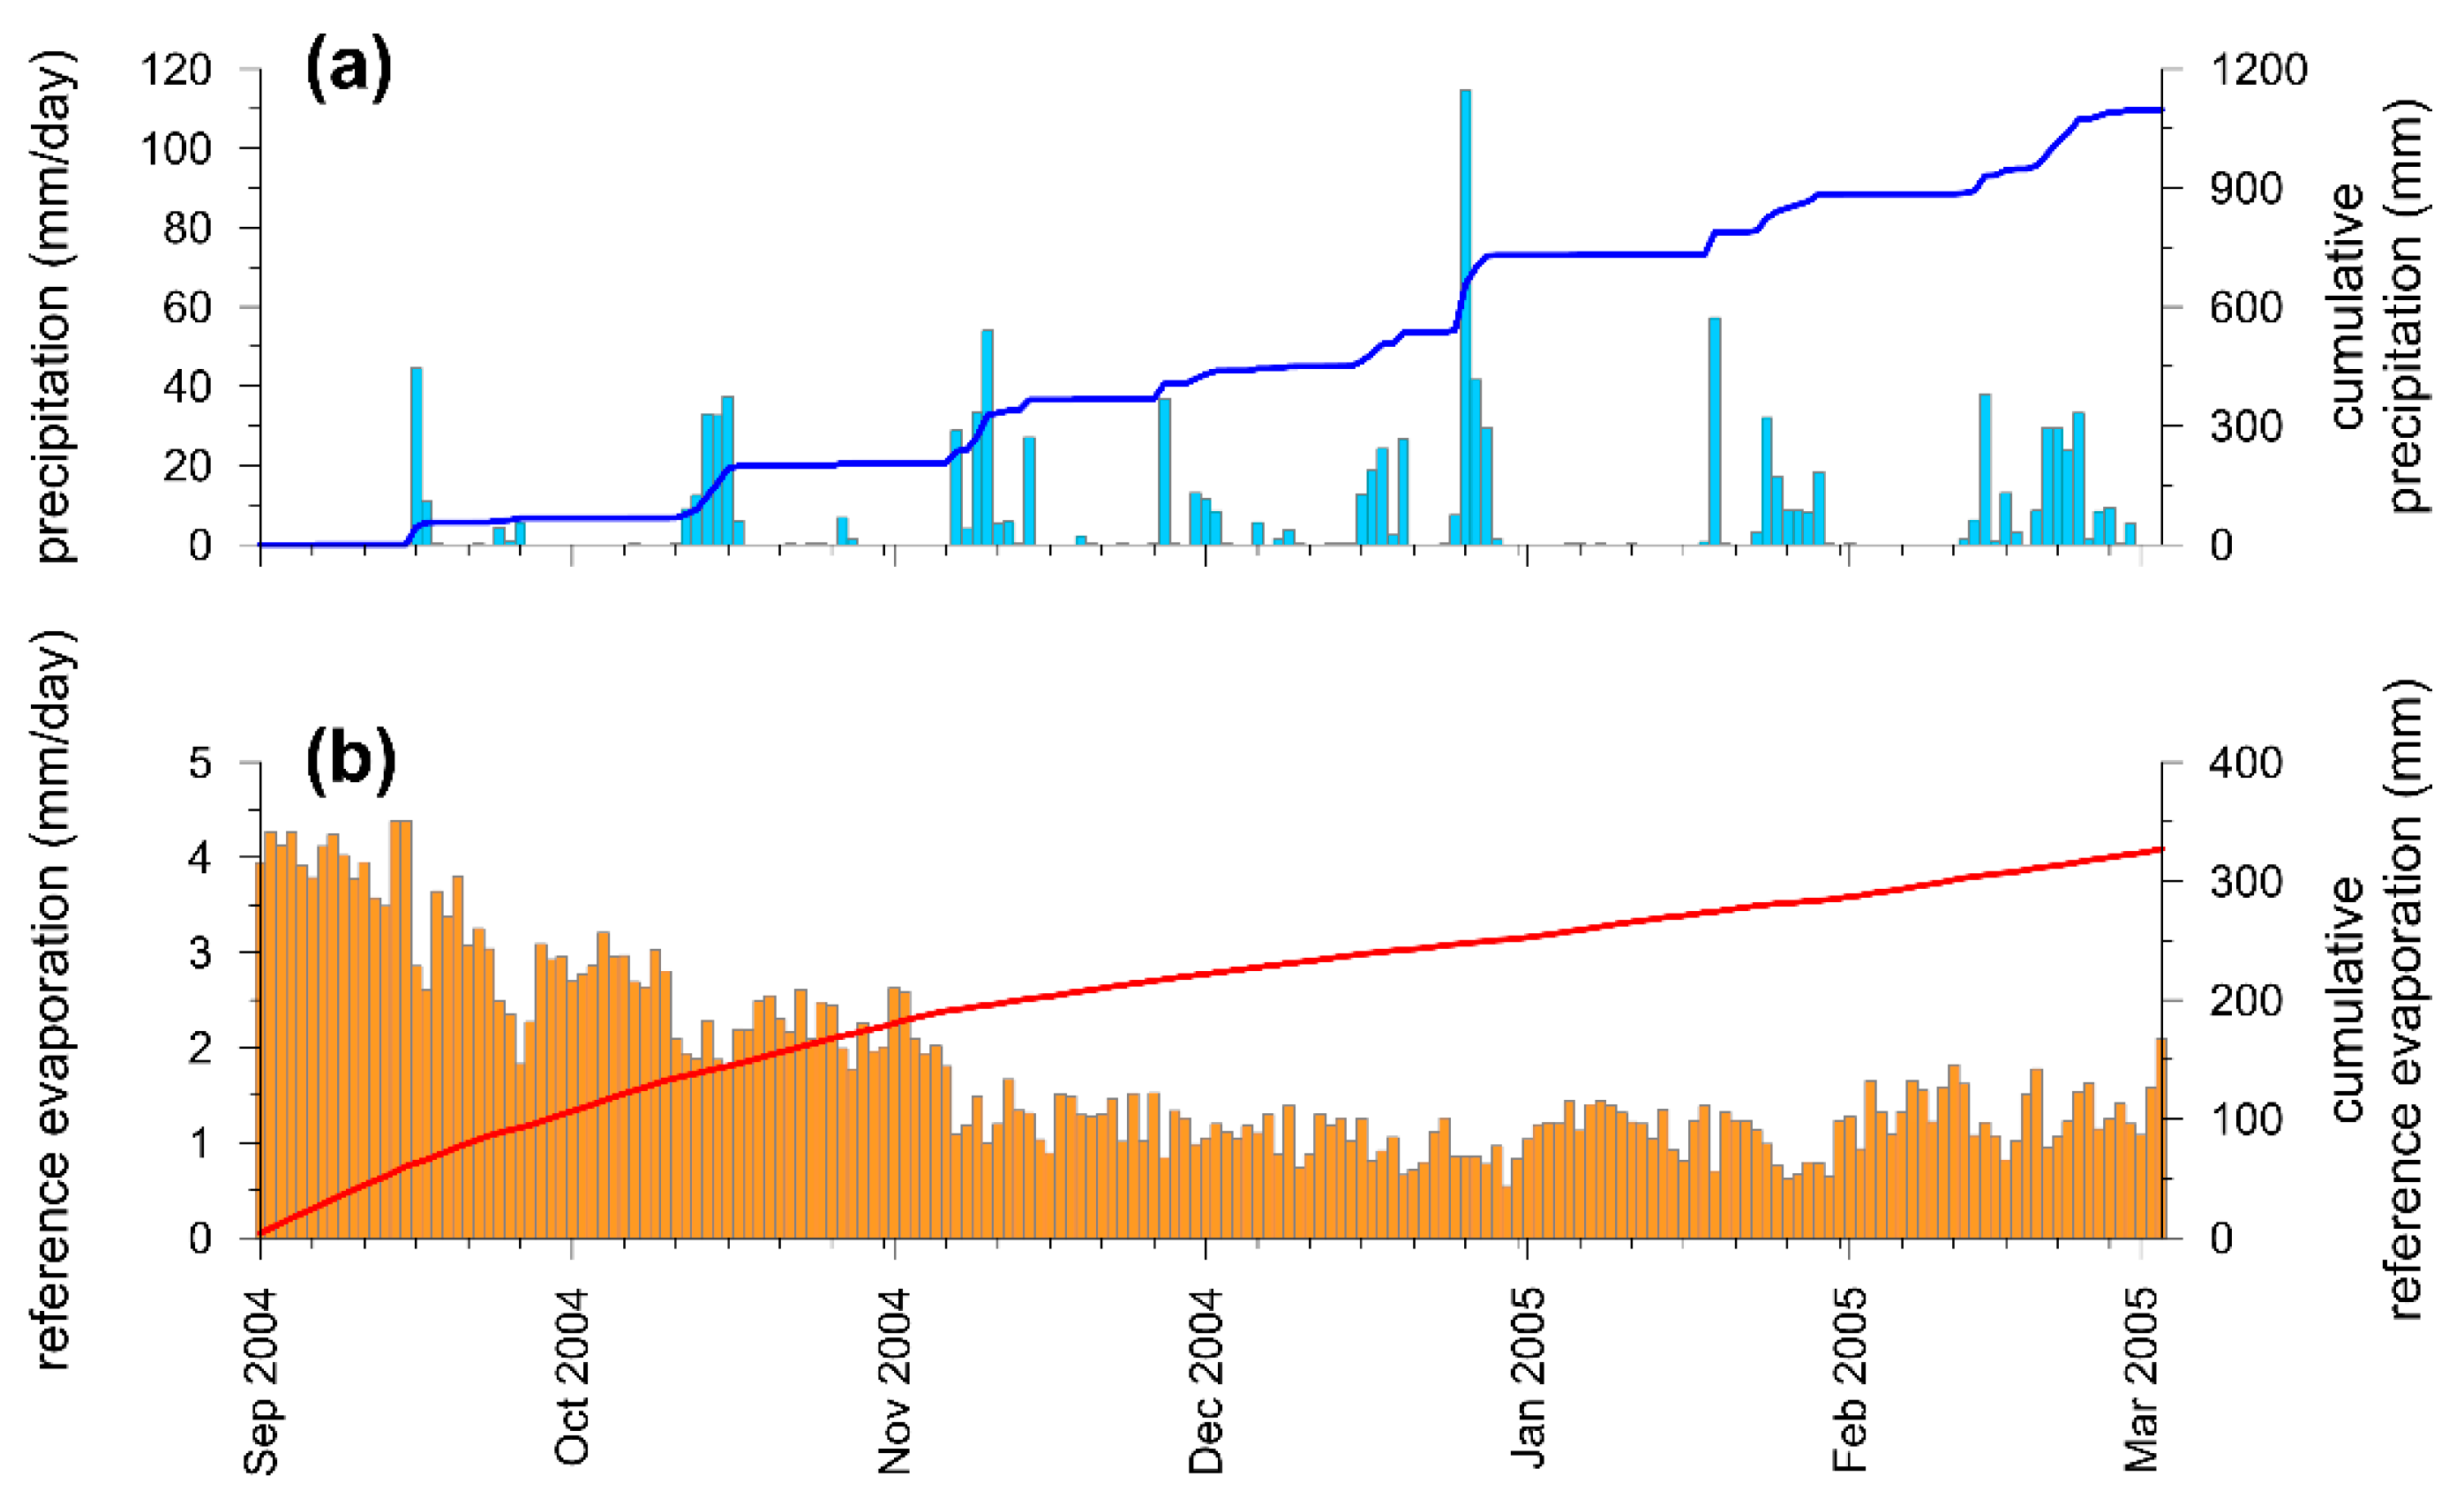
The last and most significant landslide occurred on 4th March 2005. A weather station located very close to the landslide area provided the evolution of meteorological conditions that resulted in the phenomenon. Hourly values of precipitation, air relative humidity, and air temperature are available over the timespan 1st January 1998–1st November 2008. Pagano et al. [8] provided a first numerical interpretation of the case based on an account of rainfall evolution. Reder et al. [34] and Pagano et al. [48] re-analyzed the case following different approaches that also accounted for evaporation and evapotranspiration evolutions. This case is quite representative of many other debris avalanches that have affected the Lattari Mountains in terms of involved soils, antecedent meteorological evolution (800 mm since 1st September 2004), and duration of the critical event (16 h). The rainfall amount of the critical event was 143 mm. After the landslide, a triangularly shaped area was clearly discernible. It spread over a 36° inclined open slope from the apical zone downward, mobilizing a soil mass of 33,000 m3. The kinematic was that of a debris avalanche. At the apical zone, the slope angle approached the soil friction angle of 39° [49] and the cover was 2 m thick. The bedrock consisted of highly fractured limestone located at a depth ranging from 1 to 2 m, approaching the maximum values at the apical zone. Figure 2 shows the evolution of the antecedent rainfall and reference evaporation from bare soil. The latter was obtained by interpreting observations of air temperature and relative humidity over the time span between the start of the hydrological year and the landslide time, according to the approach proposed by Allen et al. [50].
2.3. Materials
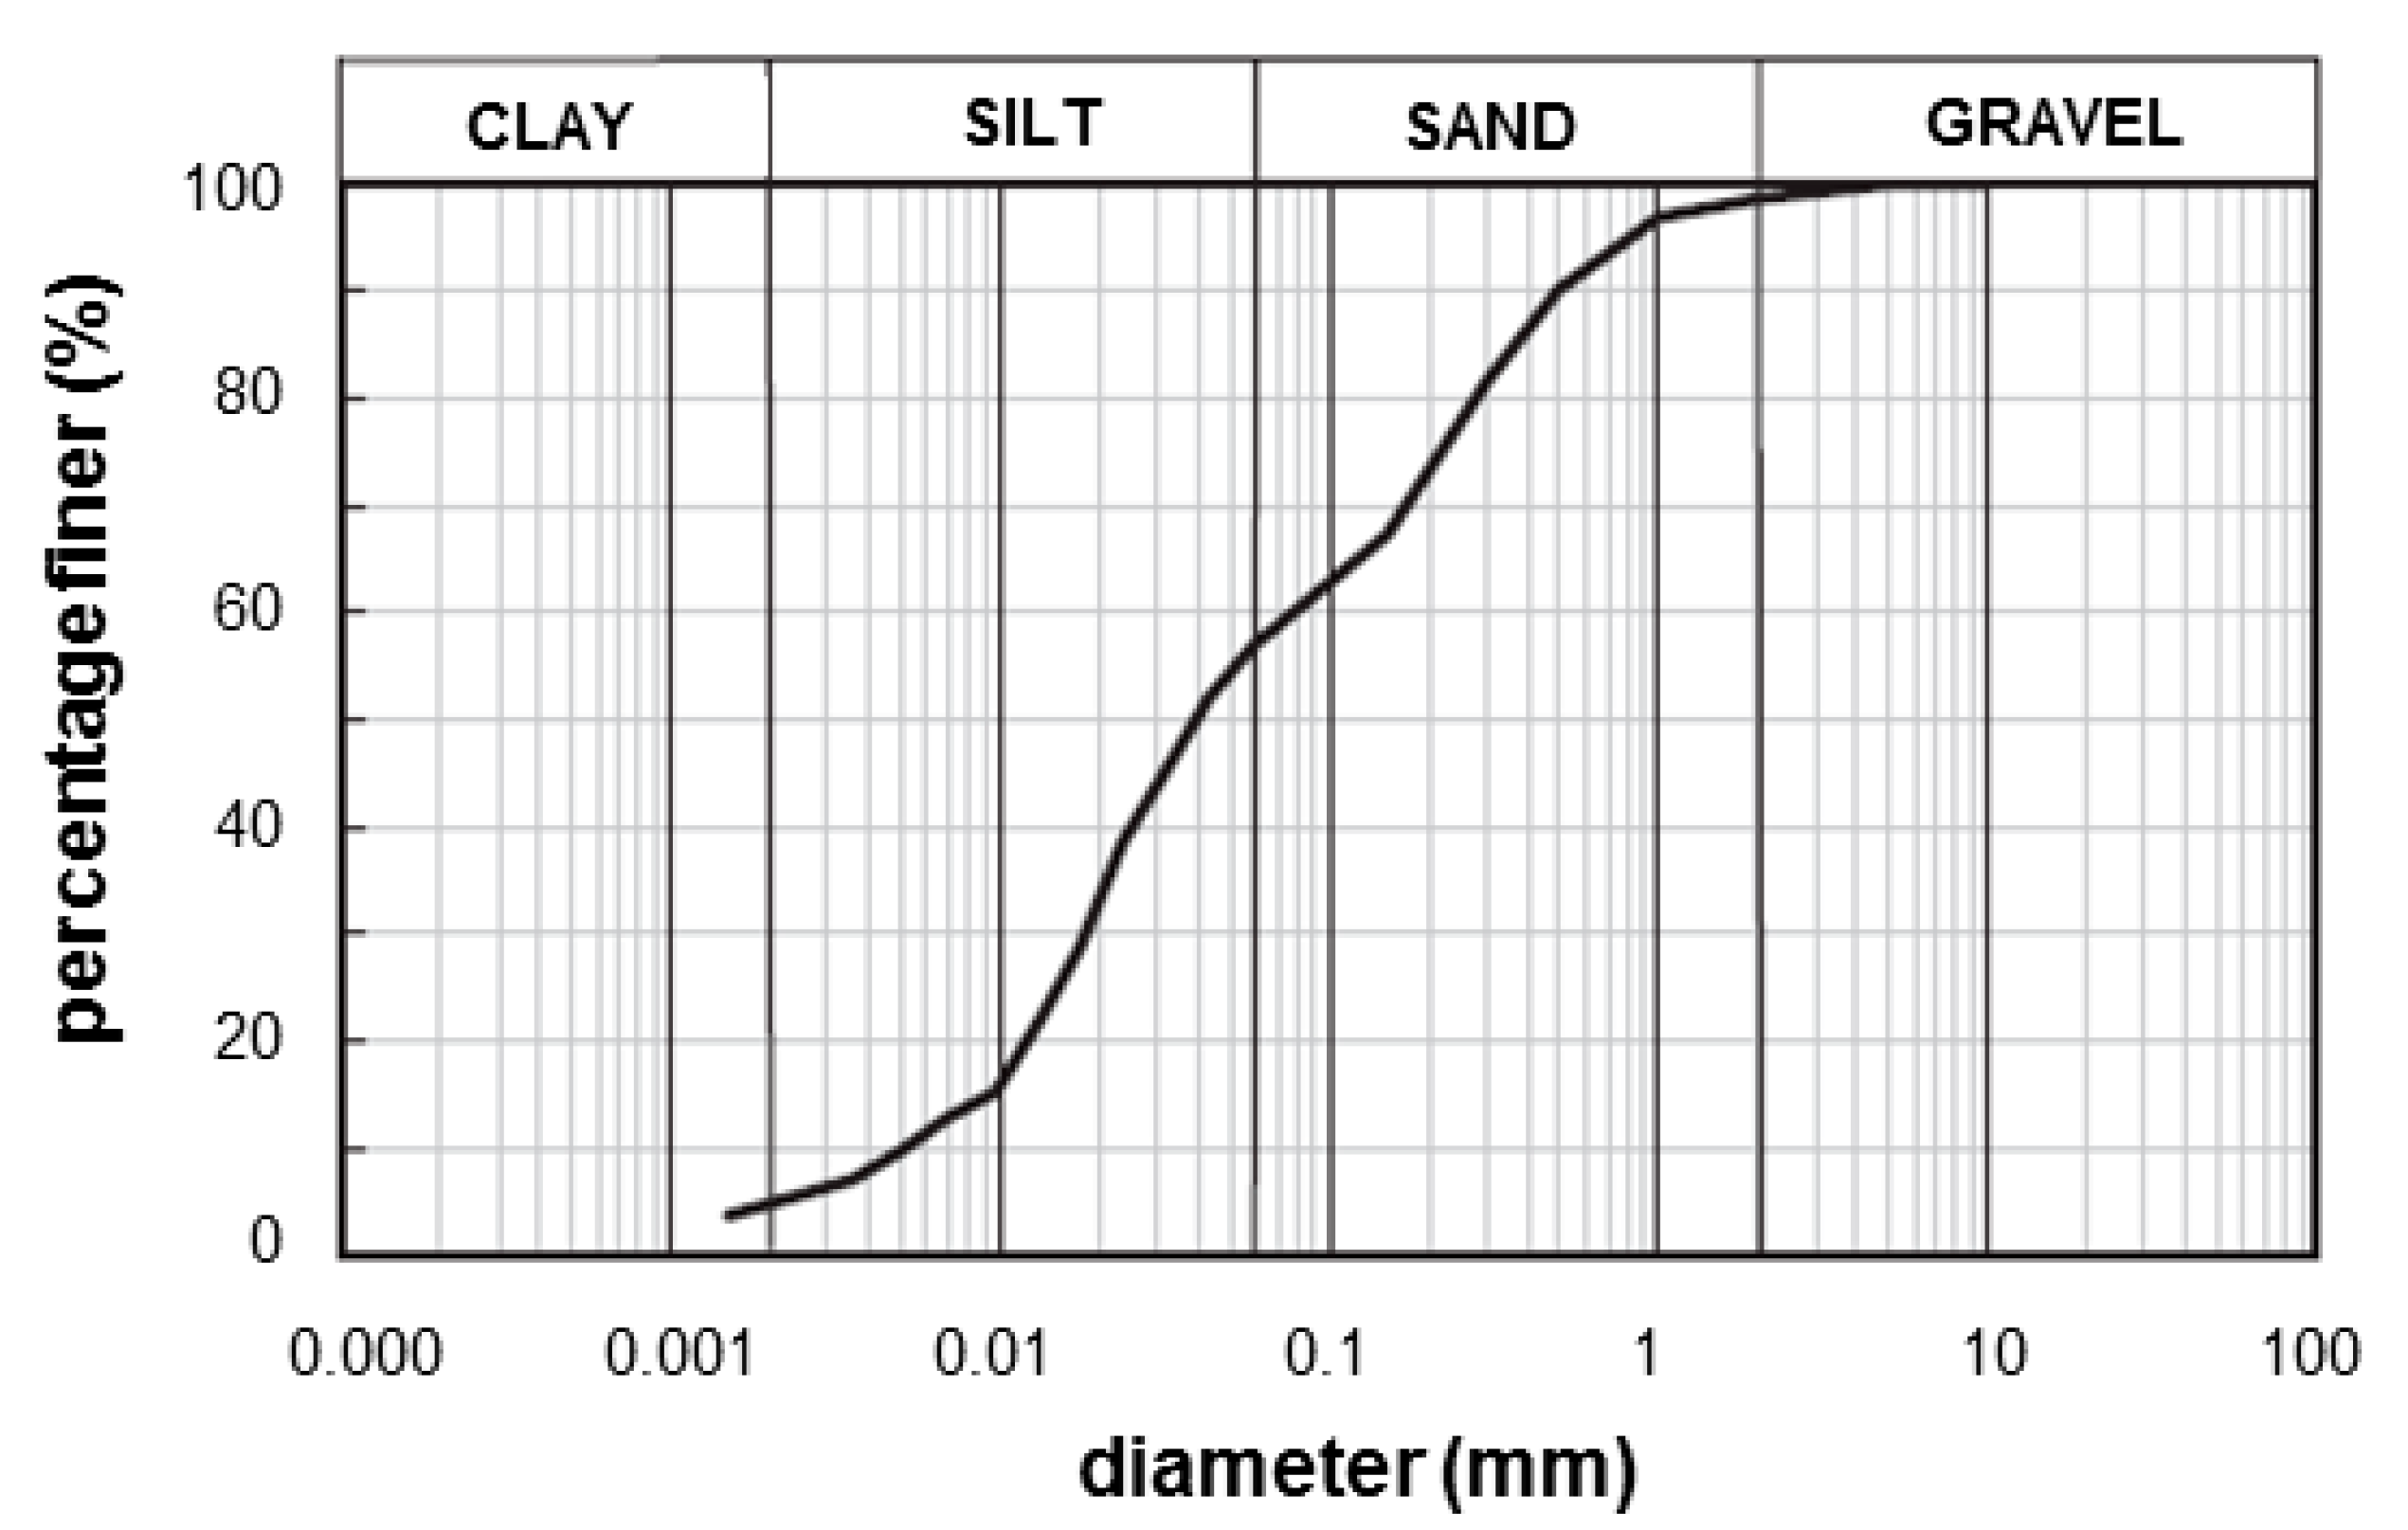
The material involved in the Nocera Inferiore landslide of 2005 was a non-plastic sandy-silt volcanic soil (Figure 3) having a porosity as high as 70%. At such a porosity, it was tested in a physical model of lysimeter to retrieve the soil hydraulic properties. An extensive description of the physical model and experimental data may be found in Rianna et al. [33].
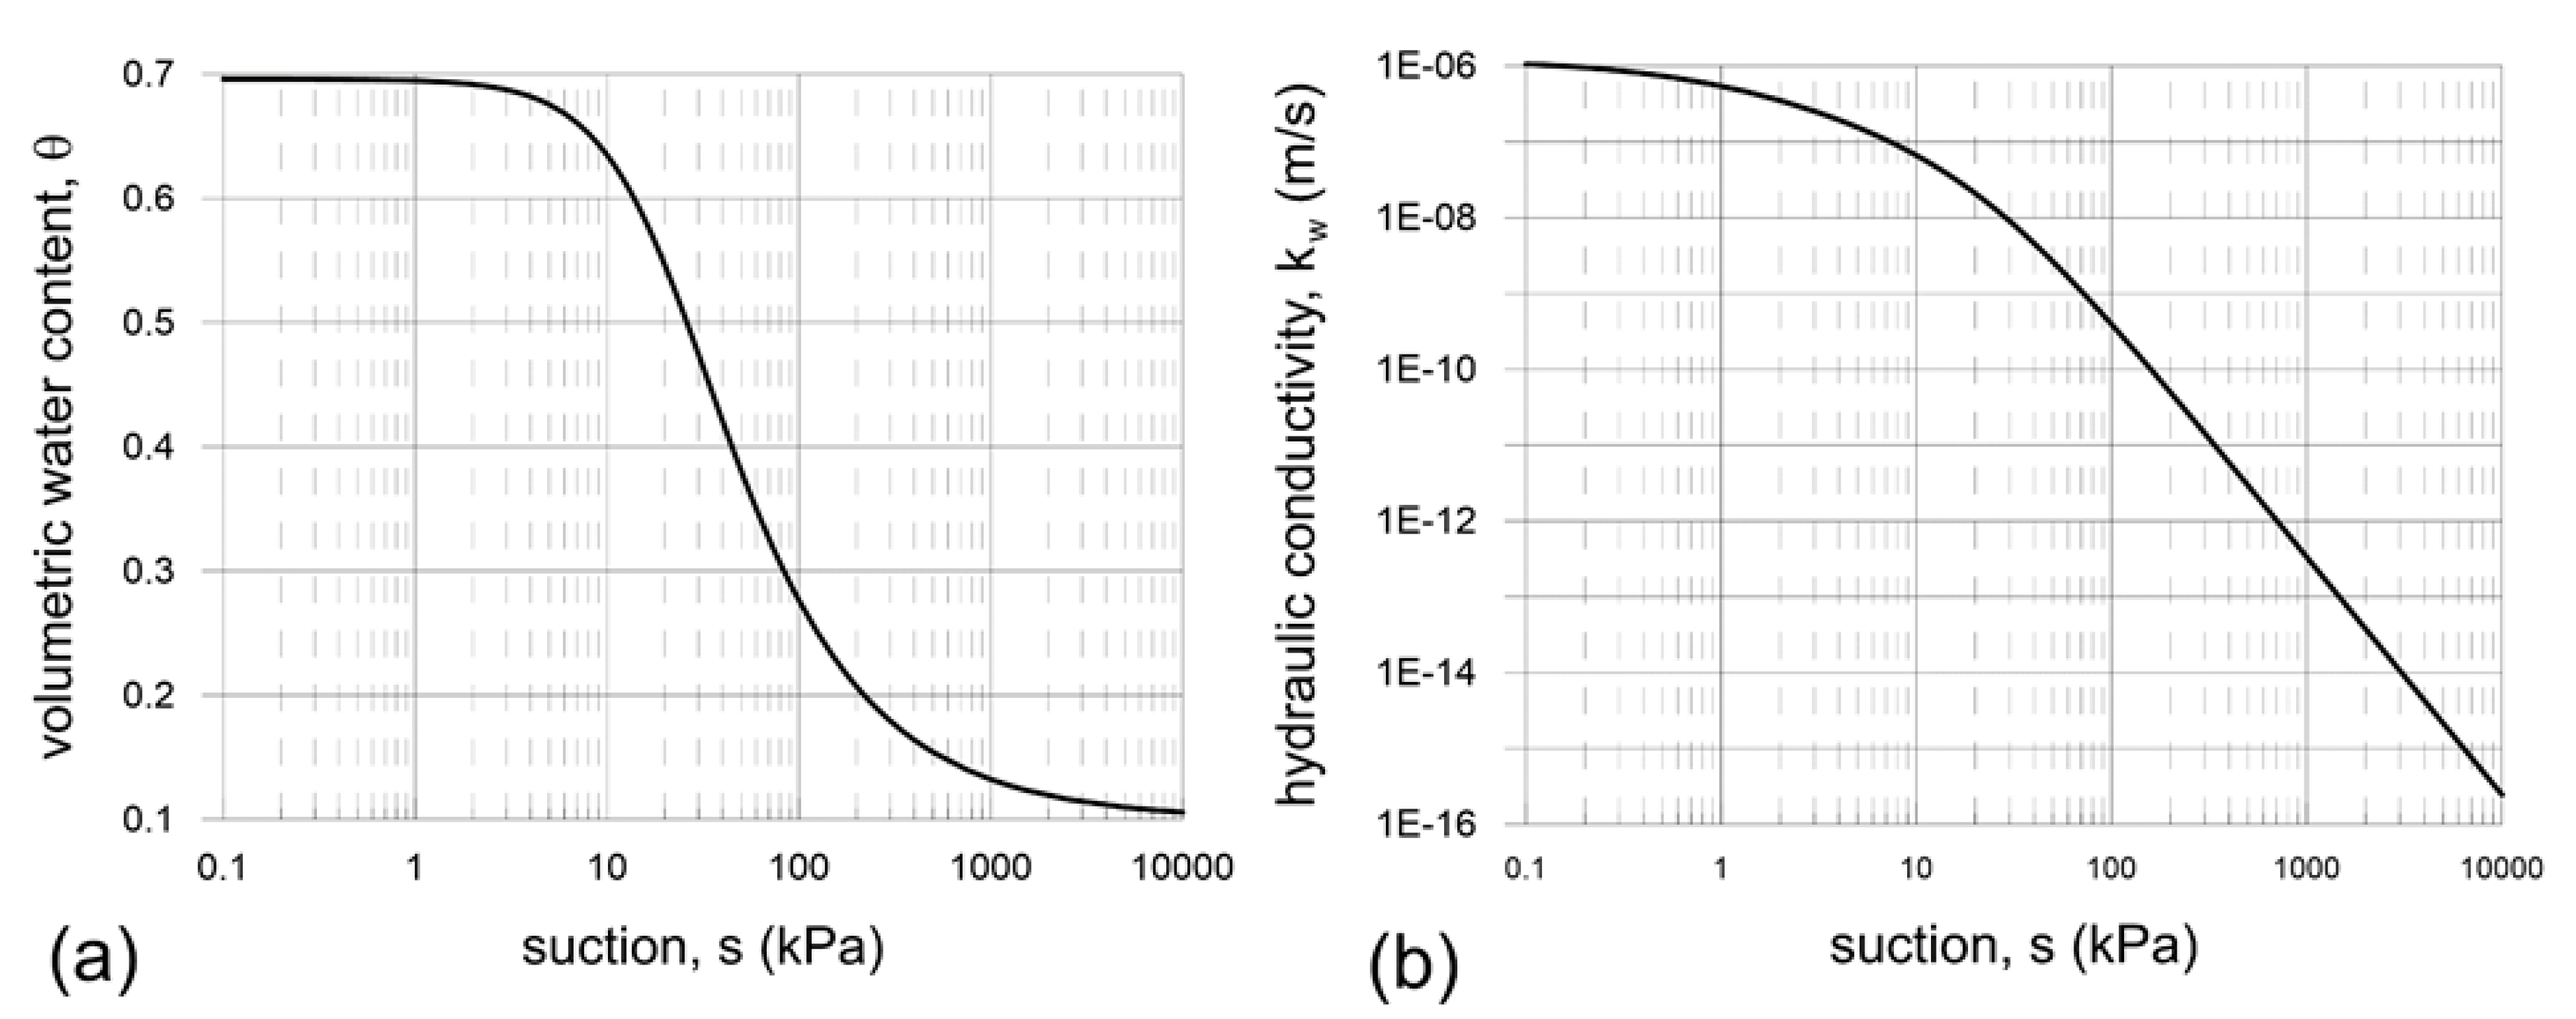
The Soil Water Characteristic Curve (SWCC) was assessed (Figure 4a) directly from measurements taken within the lysimeter as a best fit function of water content–suction points recorded at all depths by Time Domain Reflectometry probes (TDRs)and jet-fill tensiometers. The SWCC adopted interpolates available experimental data up to suction values of around 90 kPa and extrapolates them to much higher suction levels, adopting as an asymptote the lowest volumetric water content measured locally by TDRs.
The hydraulic conductivity function (Figure 4b) resulted from the back analysis of the monitored evolution of suction and volumetric water content [34]. The hydraulic conductivity of the material drops by three orders of magnitude (from 1 × 10⁻⁶ to 1 × 10⁻⁹ m/s) for suction increasing from 0 to 100 kPa.
3. Methods
3.1. Stability Conditions
Characterizing the critical event requires that state conditions determining susceptibility to debris avalanches are preliminary defined. The concomitant presence of unconventional strength mechanisms acting within a pyroclastic cover makes accomplishing this task difficult.
One such mechanism is the strength contribution provided by abundant vegetation standing on these slopes [43,45]. Dense root systems of different types could cross the cover down to penetrate the fractured bedrock, thus tying the cover to bedrock. Soil suction supplies the action normal to the root surface needed to activate soil–root friction (weight-induced stresses are instead very low), allowing roots to work as reinforcements within the cover. The root system may also act as a traverse reaction and resistance against upstream–downstream oriented movements. The strength contribution is, in this case, based on soil passive strength, which is still related to soil suction levels throughout the cover.
Another factor affecting soil strength, in this case reducing it, is the possibility for spontaneous liquefaction upon wetting. In these soils, liquefiable conditions exist when full saturation is approached, and material porosity is above 70%. These state conditions may generate triggering and propagation of liquefaction phenomena for slope angles higher than 30°, hence for values even much lower than material friction angle at the critical state (usually, about equal to 39°) [7,20].
Such strength factors are difficult to quantify and consequently complicate the task of identifying which hydrological conditions induce an instability mechanism to become a rapid post-failure kinematics.
The numerical interpretation of the Nocera Inferiore landslide allowed the identification of a simple hydrological criterion associated with the slope failure. The analyses were carried out under one-dimensional flow conditions, at first by solving Richards’ equation to simulate rainfall infiltration [8], and then solving Richards’ equation to account for evaporation as a boundary phenomenon [34]. Finally, solving the equation according to the hydrothermal coupled approach developed by Wilson et al. [51], to model evaporation as an internal phenomenon [48]. Soil hydraulic behavior is characterized by SWCC and the conductivity function displayed in Section 2.3. Numerical results yielded by the different types of analyses of the actual meteorological evolution recorded during the landslide hydrological year, all identified the same hydrological singularity at the triggering time, which was that of suction almost vanishing throughout the cover. This should represent a hydrological state consistent with a cover prone to generate a debris avalanche due to two reasons:
- An extremely rapid kinematic was observed, which indicates unequivocally the occurrence of extensive liquefaction phenomena, in turn necessarily related to a state approaching full saturation and suction vanishing at any depth.
Suction vanishing throughout the cover will be identified in the next section as the hydrological state relating to the occurrence of a debris avalanche.
3.2. Mathematical-Numerical Model
With the objective to translate a given meteorological evolution (Figure 2) into a suction evolution within a continuum domain schematizing the cover, a simple model was used. Its main features are:
- Richards’ equation (1931) [52] was adopted to reproduce transient water flux conditions throughout the unsaturated domain, induced by incoming and outcoming meteorological fluxes; under such assumptions, the effects of deformational processes are neglected.
- Hourly rainfall is translated into hydraulic boundary conditions; a water flux condition equal to rainfall intensity is maintained at the uppermost surface if surface pore water pressure is less than zero; otherwise, a null pore water pressure condition is assumed. The latter is then maintained until entering water fluxes are less than the rainfall intensity, otherwise entering flux is again switched at the rainfall intensity.
- Air temperature and air relative humidity are used to estimate actual evaporation flux, AE. For the sake of simplicity, all terms of internal evaporation are neglected, including that related to transpiration, although the presence of vegetation was implicitly taken into account in the criterion identifying cover instability. AE is then considered only acting at the boundary and is computed through several steps: evaluation of reference evaporation, ET0, quantified from weather data only (air temperature and relative humidity); computation of potential evaporation, PE, from bare soil, by applying the crop coefficient to ET0 (PE = kcrop × ET0; kcrop = 1.15, as found by Rianna et al., [33]); and characterization of a falling law for PE, consistent with available pore water at the uppermost surface and with a suction threshold, which may not exceed the value associated with thermodynamic equilibrium [51].
- Surface seepage is applied at the bottom boundary. For the case in hand, this condition corresponds to the effects induced by the intensely fractured bedrock standing at the bottom of the silty volcanic layer. This same condition simulates, in general, the presence of a capillary barrier at the bottom of a silty layer and may hence be used to simulate the lowermost boundary condition of a silty layer overlaying a pumice layer. This is the case of the gentle slopes of the Lattari Mountains (see Section 2.1) and of many other geomorphological contexts surrounding volcanic areas [35].
The numerical resolution of the equation was performed by exploiting the FEM code HYDRUS-1D [55]. This adopts a finite element solution of the partial differential flow equation for unsaturated soils.
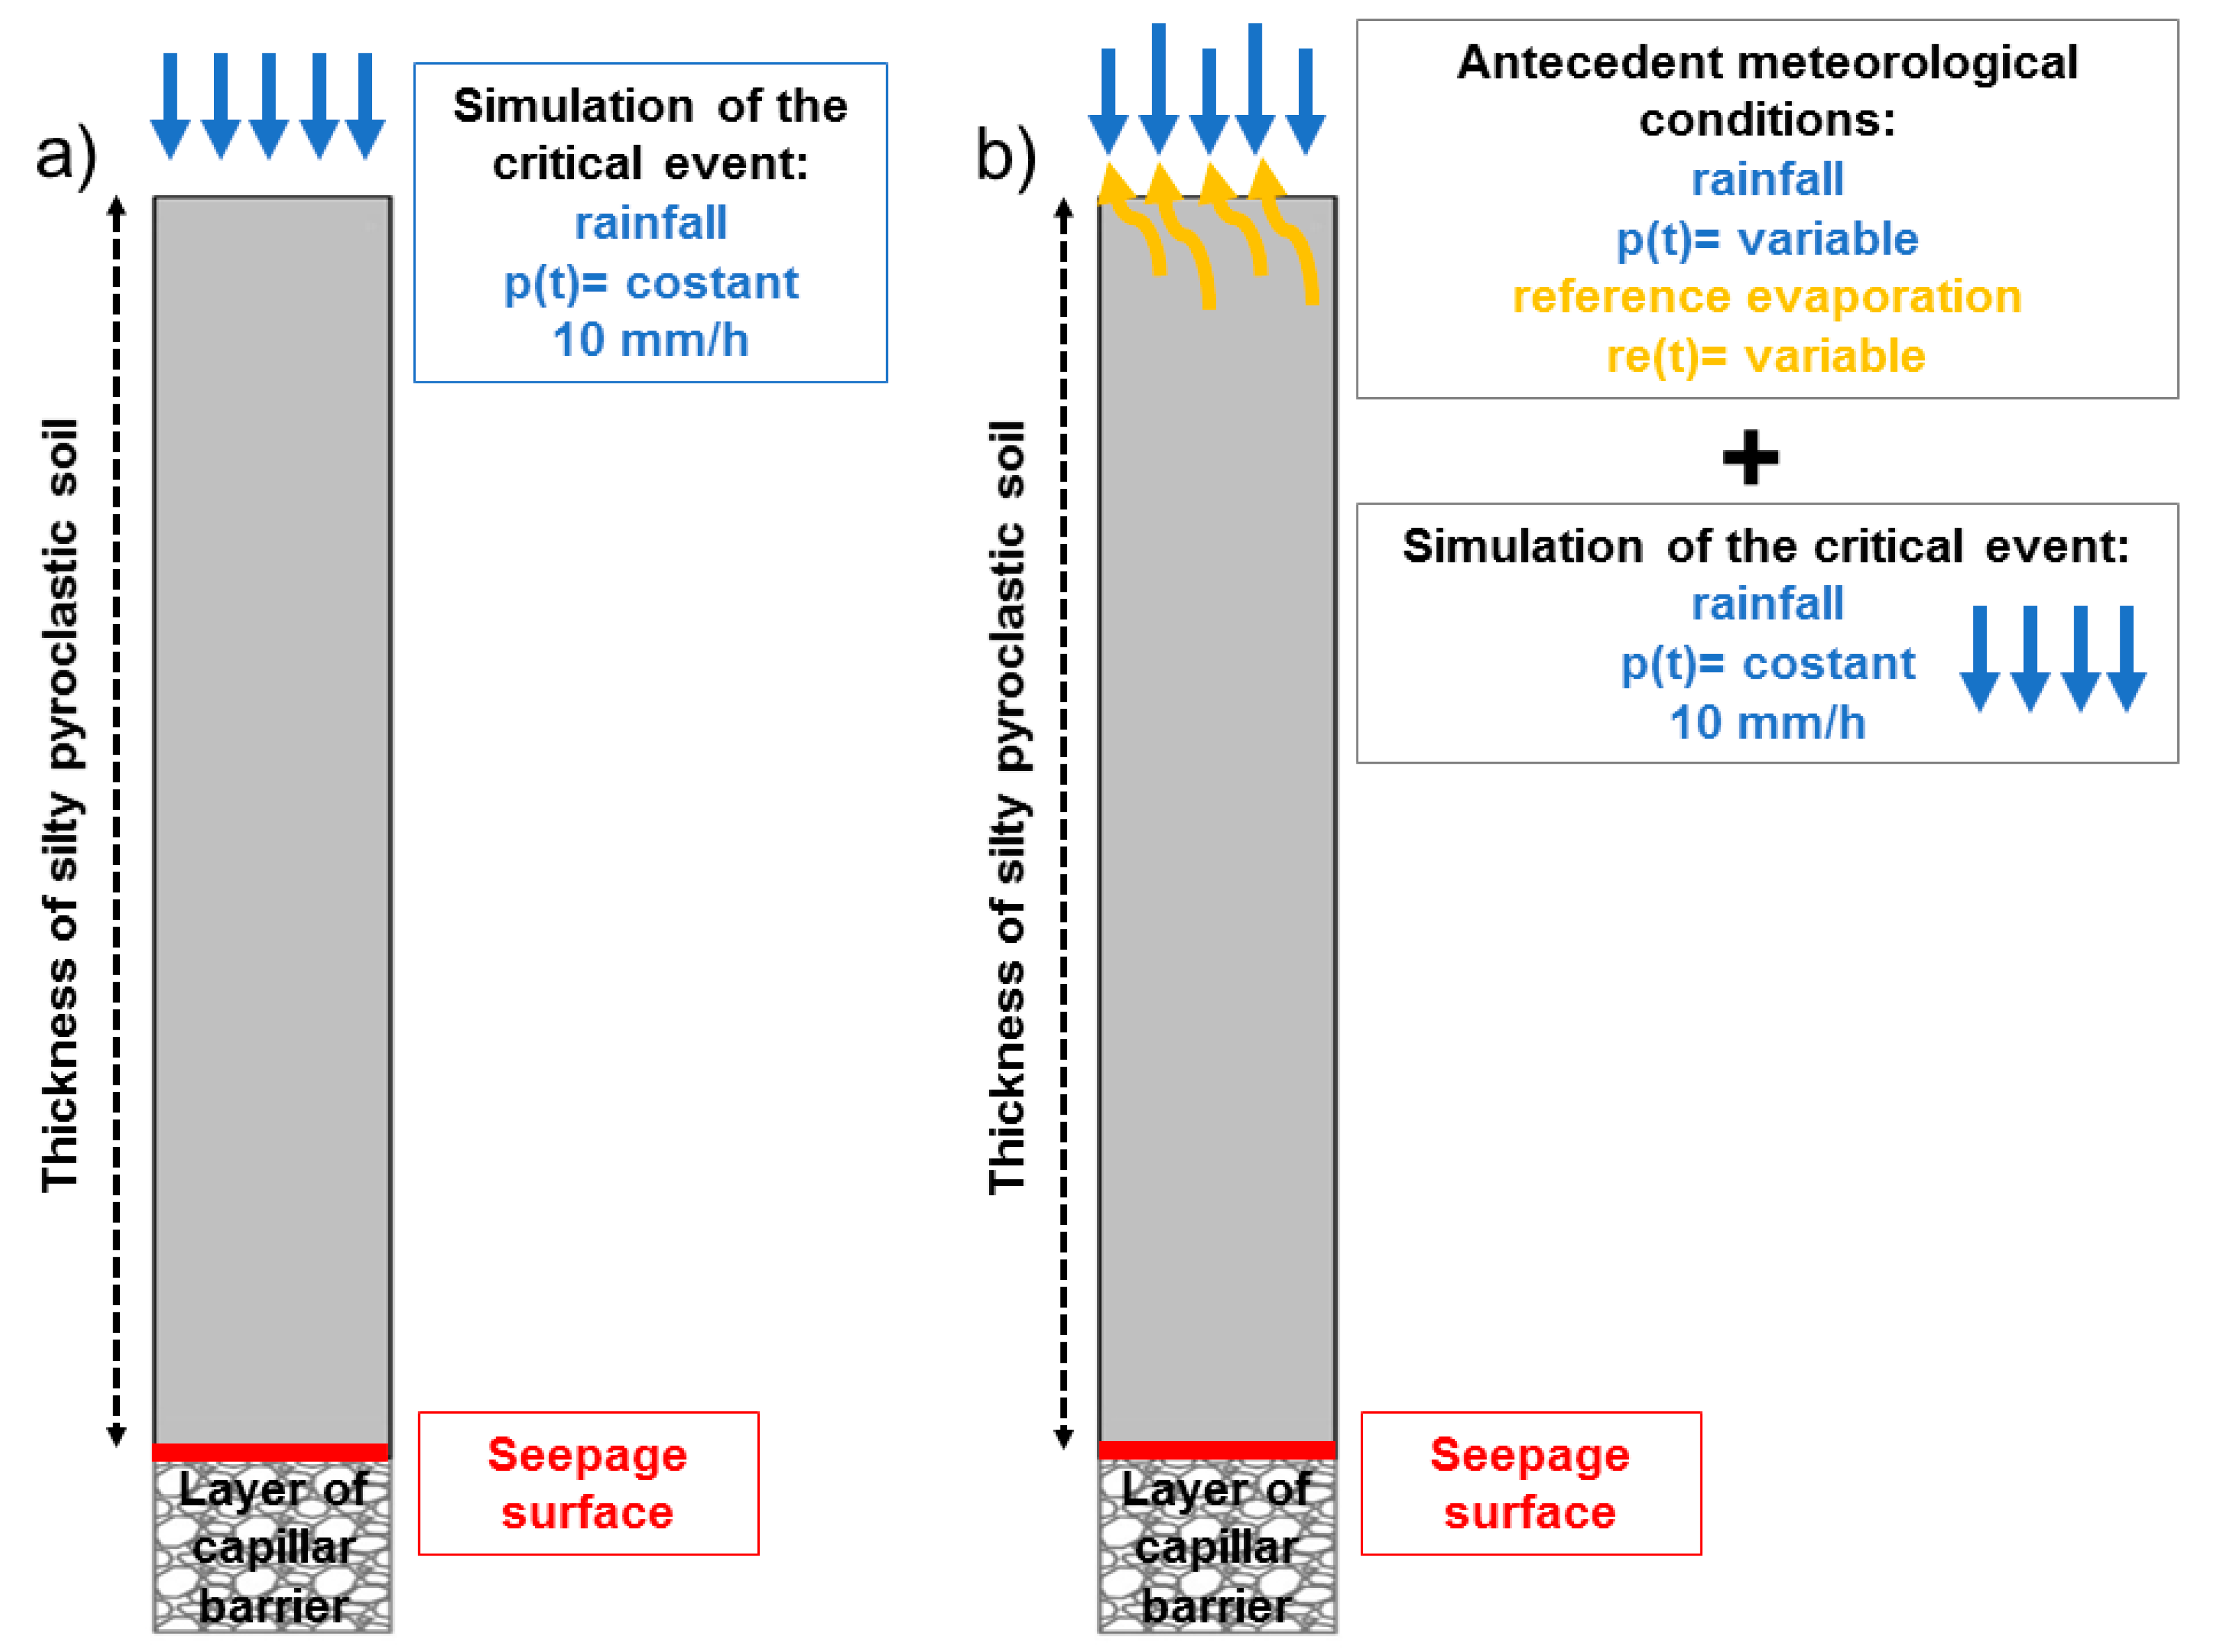
Two main set of analyses were conducted to characterize the relationship between cover thickness and critical event. The first set, set A, characterizes this relationship in the simplest way, neglecting the antecedent meteorological evolution and applying directly on the domain the critical event started by a fixed initial suction (Figure 5a). The steps followed in this case are:
- 1.A: assumption of an initial suction distribution (suA0) throughout the domain at the beginning of the critical event (4th March 2005);
- 2.A: simulation of the critical event.
The suA0 trend was assumed to be constant at 20 kPa throughout the domain, corresponding to the average suction level typically observed after the rainfalls of the autumnal season.
The critical event was defined of constant intensity, at 10 mm/h. This intensity is higher than the potential infiltration of the domain at full saturation (3.6 mm/h). In this way it generates a constant incoming flux when the domain approaches the near saturated state related to the occurrence of instability conditions, and should thus represent a realistic boundary condition for cases potentially leading to instability conditions. The critical event is hence characterized by a single parameter, i.e., the rainfall duration that induced the vanishing of the suction, consistent with findings by Rianna et al. [33].
Under the effects of a same antecedent meteorological evolution, different cover thicknesses are assumed to give rise to different suction distributions, in turn affecting the duration of the critical event. To investigate these dynamics, a second set of analyses, set B, were carried out. For these analyses, the critical event was again applied with a constant intensity at 10 mm/h, after the simulation of the antecedent meteorological evolution (Figure 5b). In this case, the steps followed are:
- 1.B: assumption of an initial suction distribution (suB0) at the beginning of the hydrological year (1st September);
- 2.B: simulating an antecedent meteorological evolution from the beginning of the hydrological year until the beginning of the critical event;
- 3.B: simulation of the critical event.
The suB0 trend was assumed to be constant throughout the domain. This synthetizes the suction distribution resulting from the hydrological years preceding the year that was analyzed.
Four different suB0 were adopted. The first, suB0 = 70 kPa, considers the occurrence of preceding dry years. The second, suB0 = 20 kPa, considers the occurrence of a preceding very wet year. Between these extremes, intermediate initial conditions of suB0 = 35 kPa and suB0 = 50 kPa were also analyzed.
Two further set of analysis were additionally carried out to investigate the sensitivity of results to variations in saturated hydraulic conductivity (set C) and to a change in the antecedent rainfall window, obtained by backdating the potential triggering event (set D)
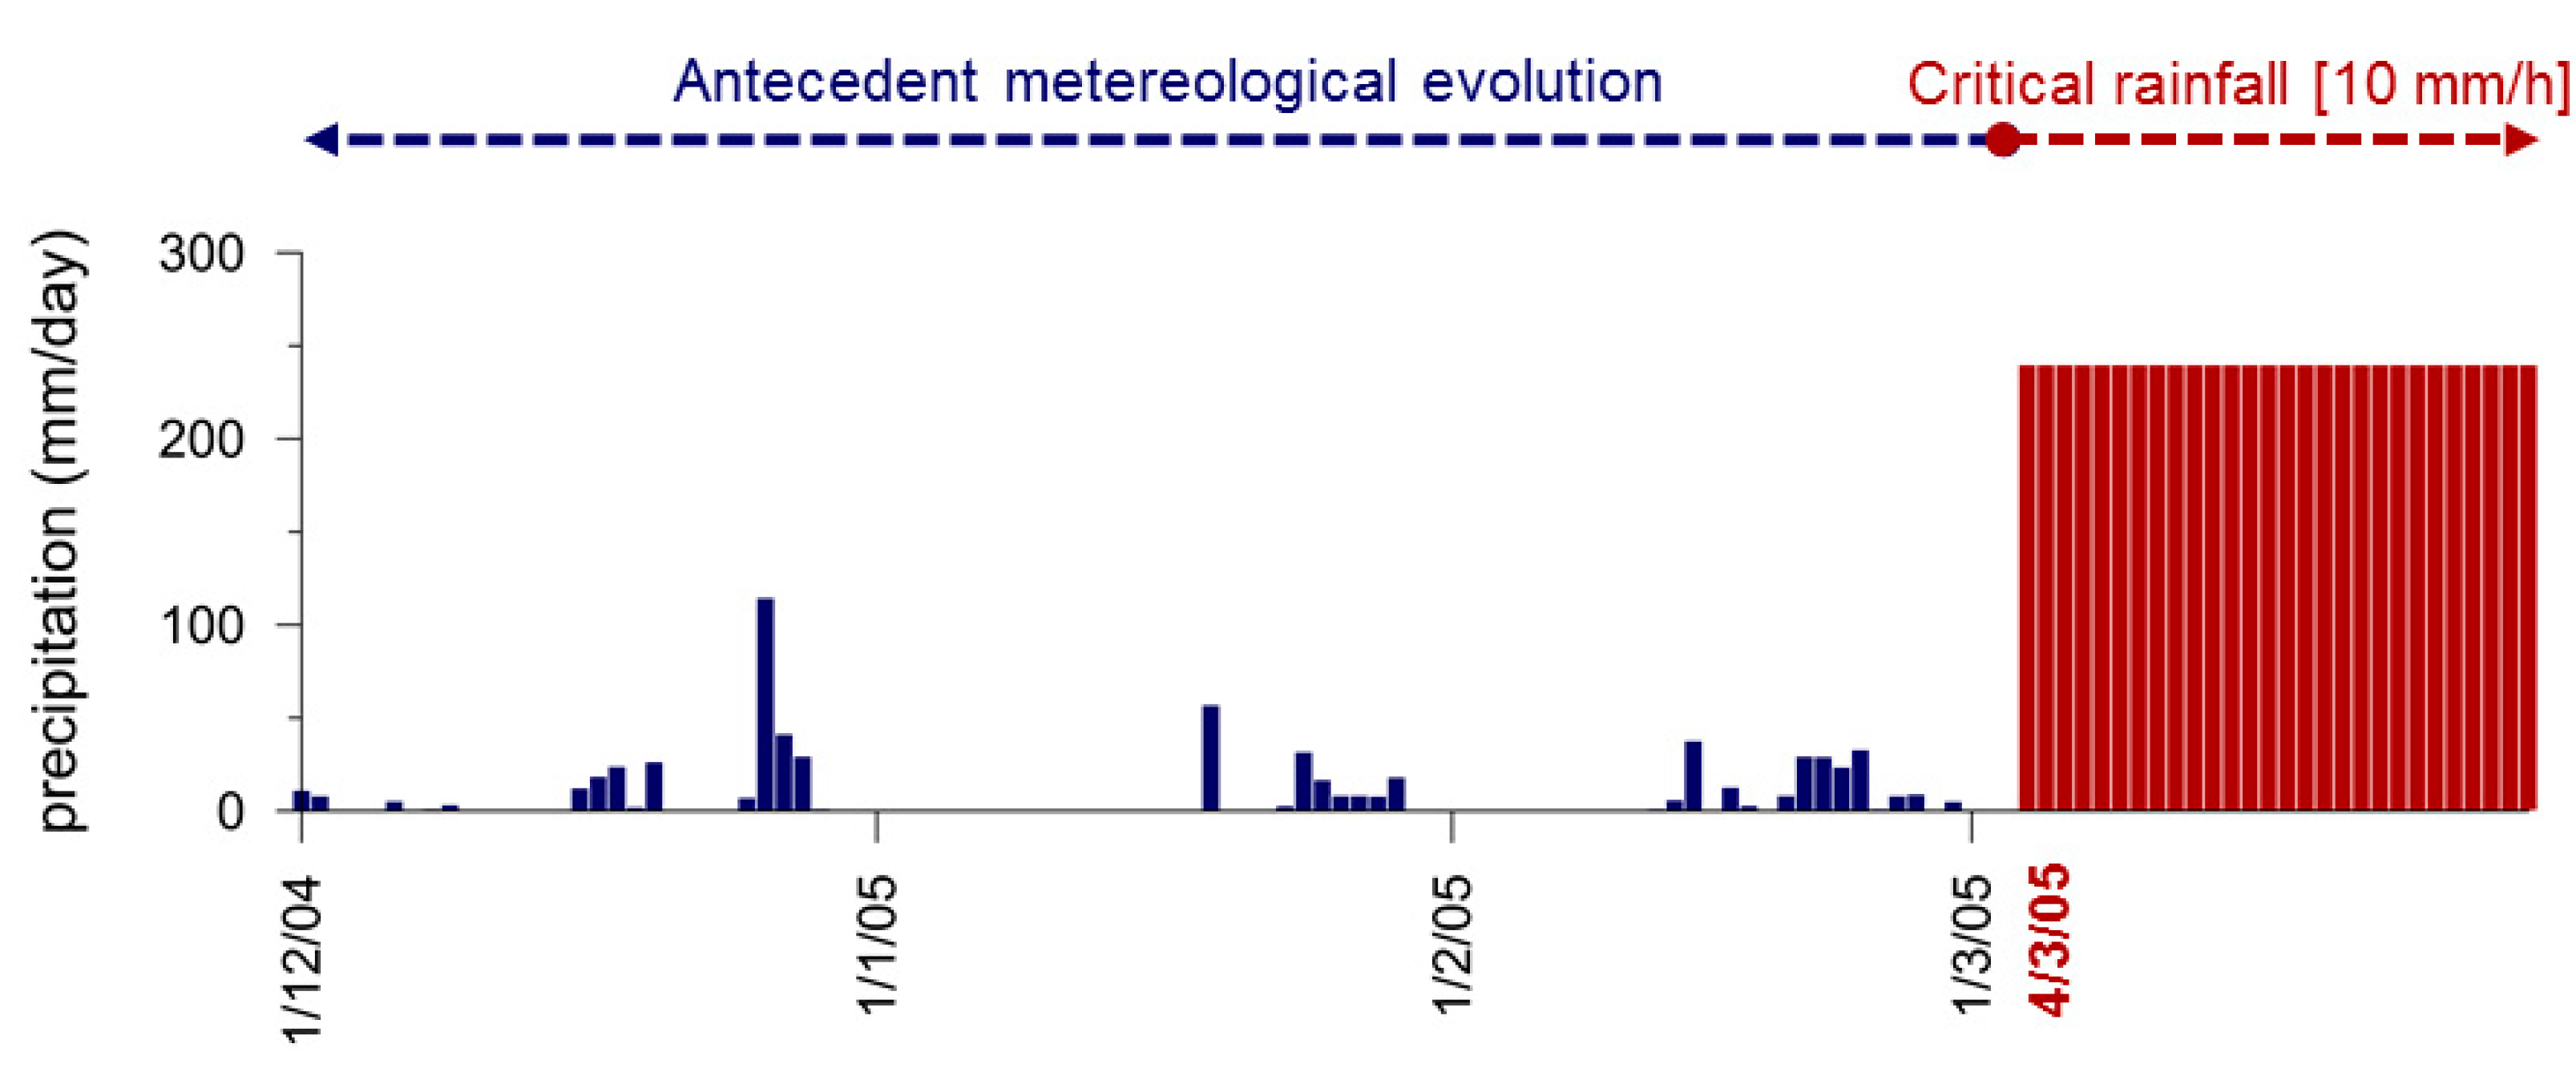
The antecedent meteorological evolution selected for the analyses was that recorded over the hydrological year of the Nocera Inferiore 2005 landslide. This was to study the effects of a realistic meteorological evolution and, at the same time, one that is consistent with the occurrence of a landslide. It was applied since the beginning of the hydrological year (1st September 2004) until the day preceding that of the landslide (3rd March 2005 for set A, B, and C, and 1st January 2005 for set D) (Figure 2).
Figure 6 shows the final part (last three months) of the antecedent meteorological evolution (in blue bars) preceding the potential critical rainfall event (in red), applied on 4th March 2005.
4. Results
4.1. Analysis of Set A
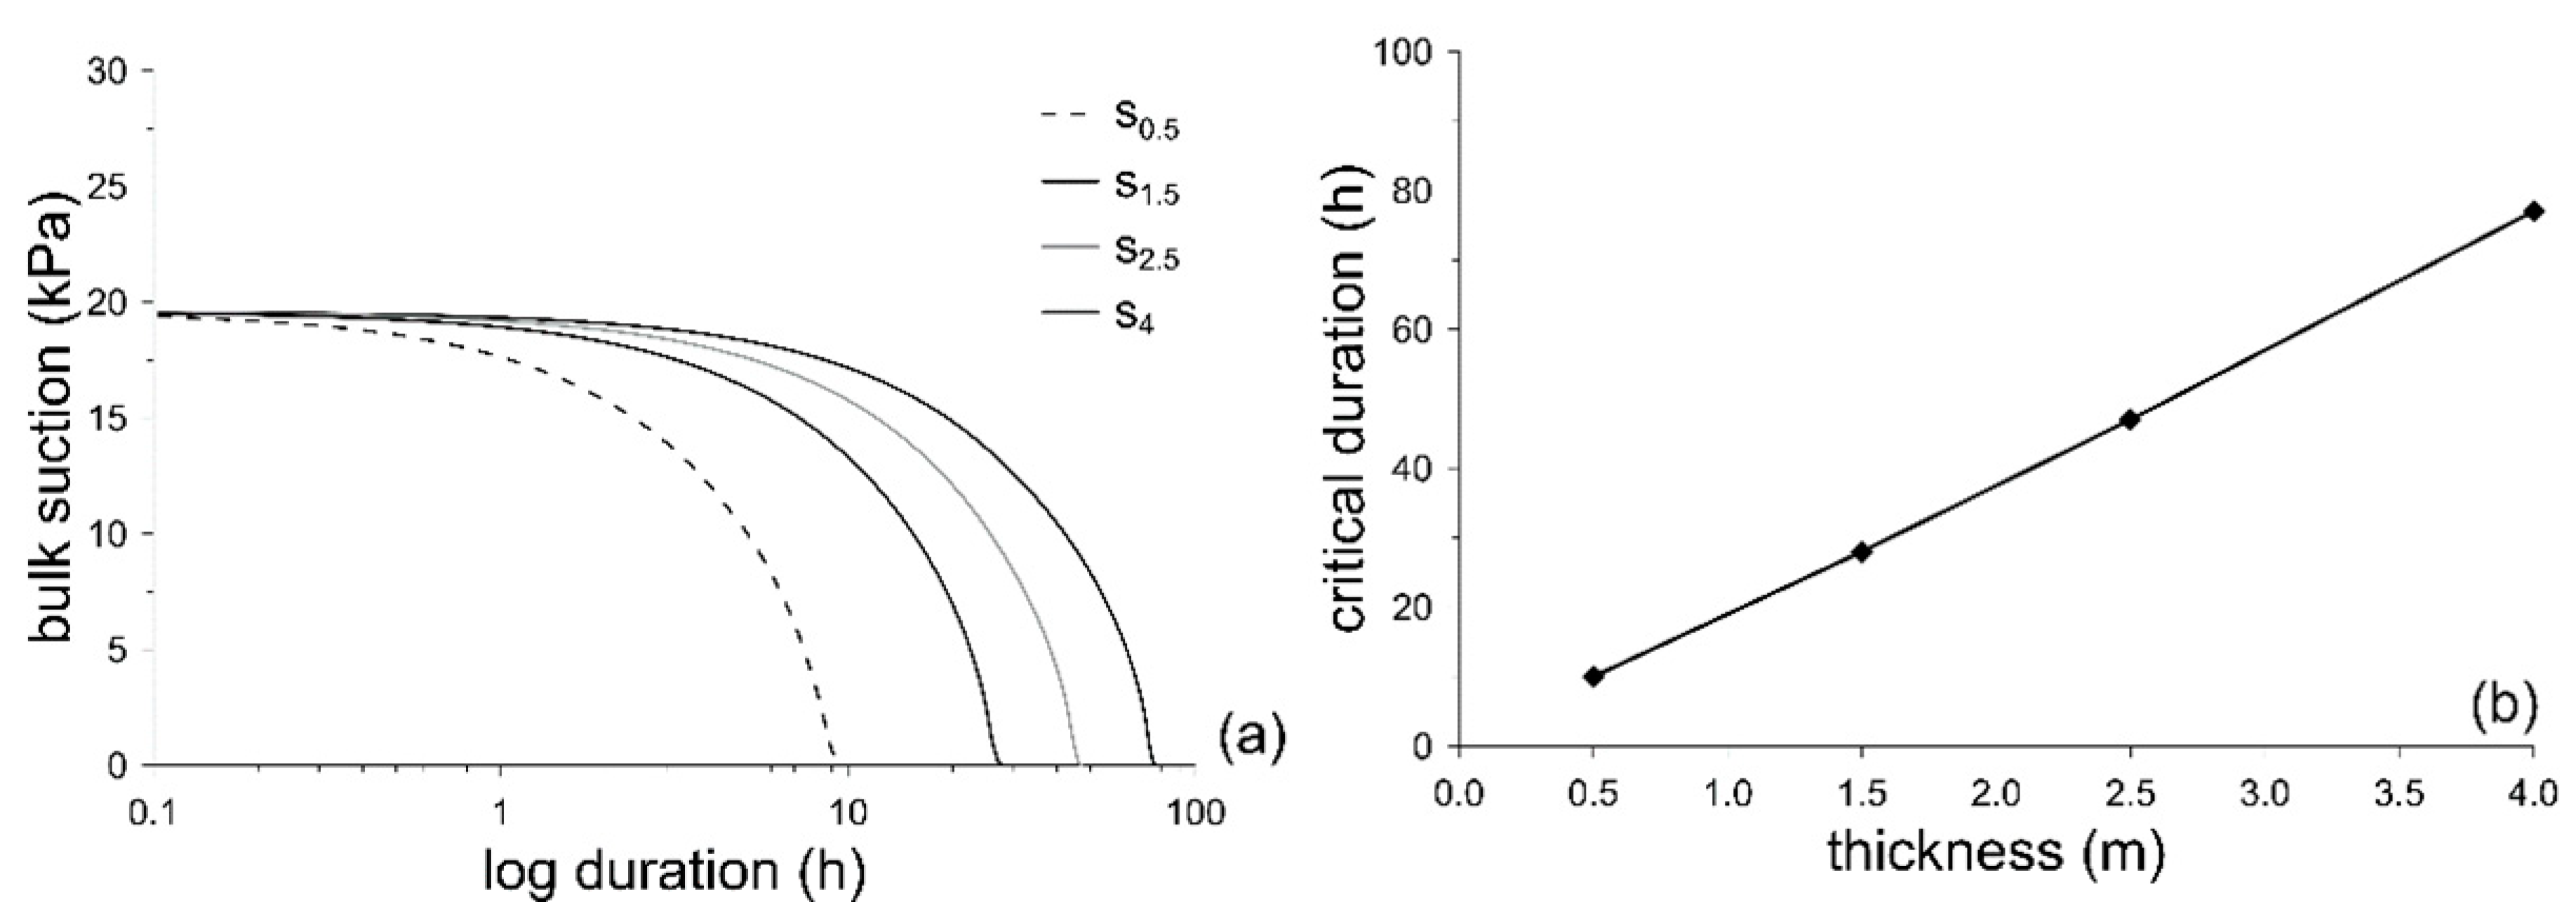
Figure 7a plots the suction evolution induced by critical events. Suctions are averaged throughout domains having four different thicknesses si (s0.5 = 0.5 m, s1.5 = 1.5 m, s2.5 = 2.5 m, s4 = 4 m). All curves move from the same initial suction level (suA0 = 20 kPa). They then evolve by falling to reach null suction. As expected, it can be seen that the rate of suction reduction decreases, and critical event duration (di) increases, with increasing domain thickness. The relationship between critical duration and domain thickness (di–si) is linear (Figure 7b), ranging between d0.5 = 10 and d4 = 80 h.
4.2. Analysis of Set B
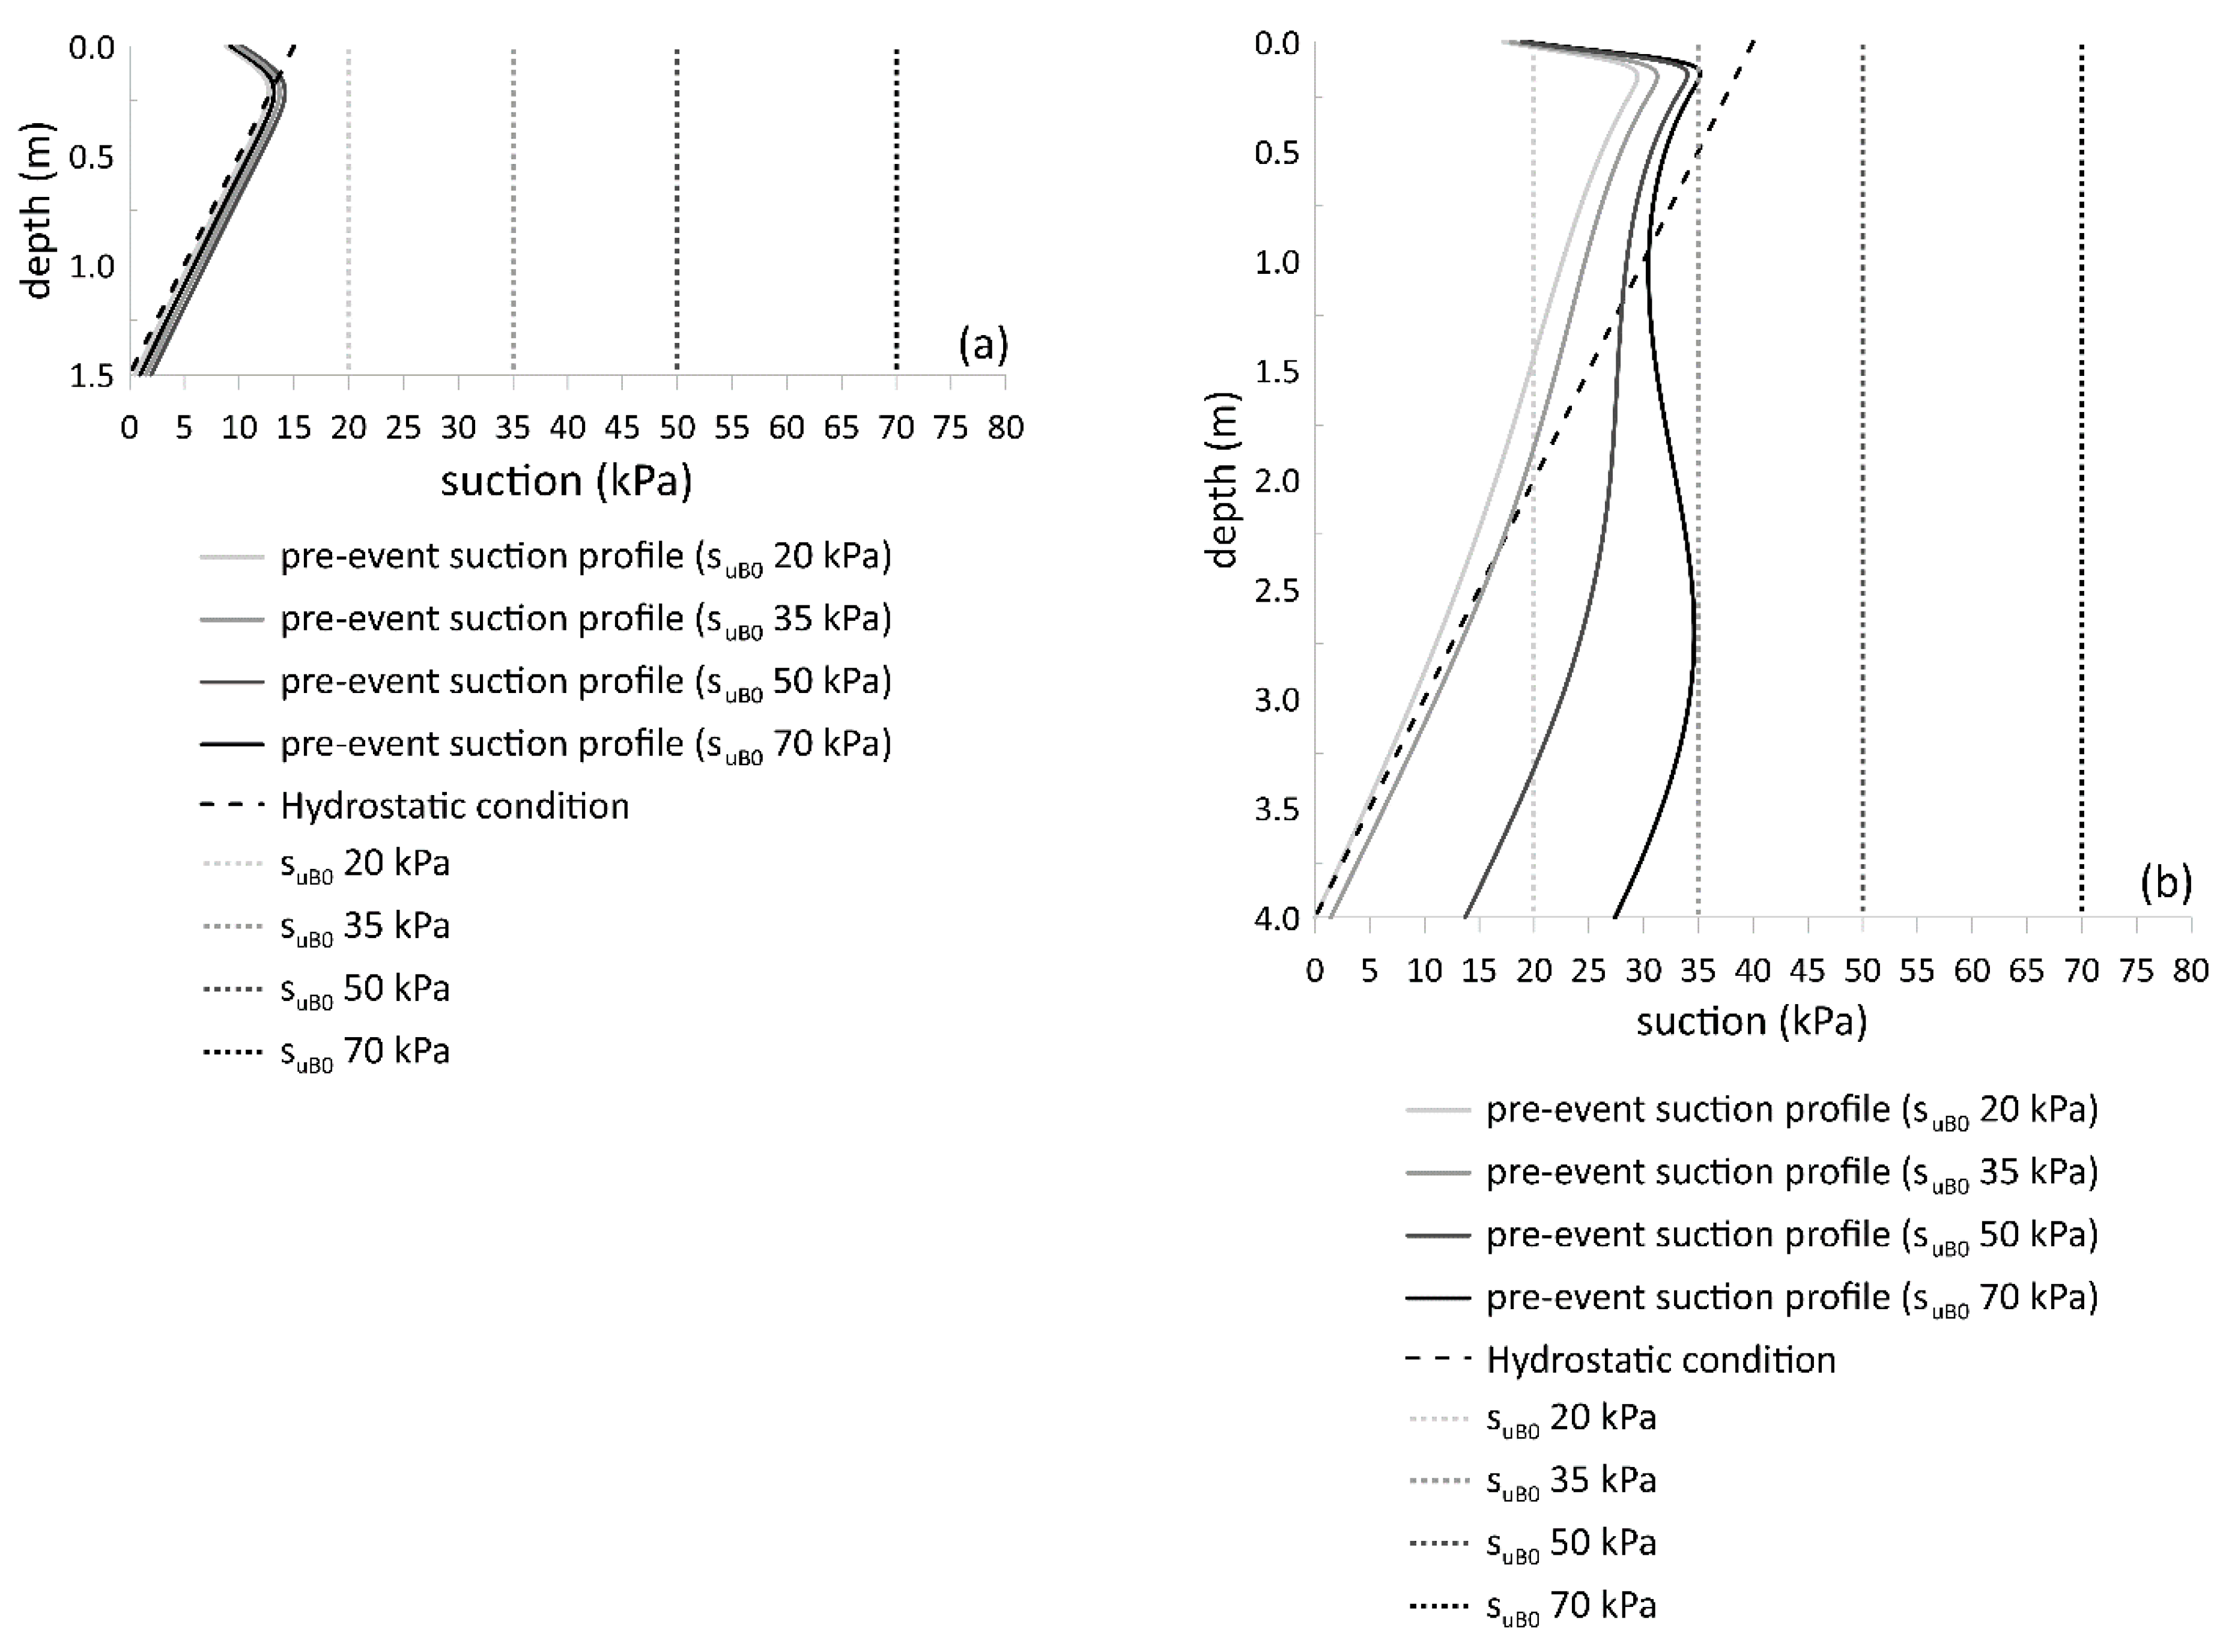
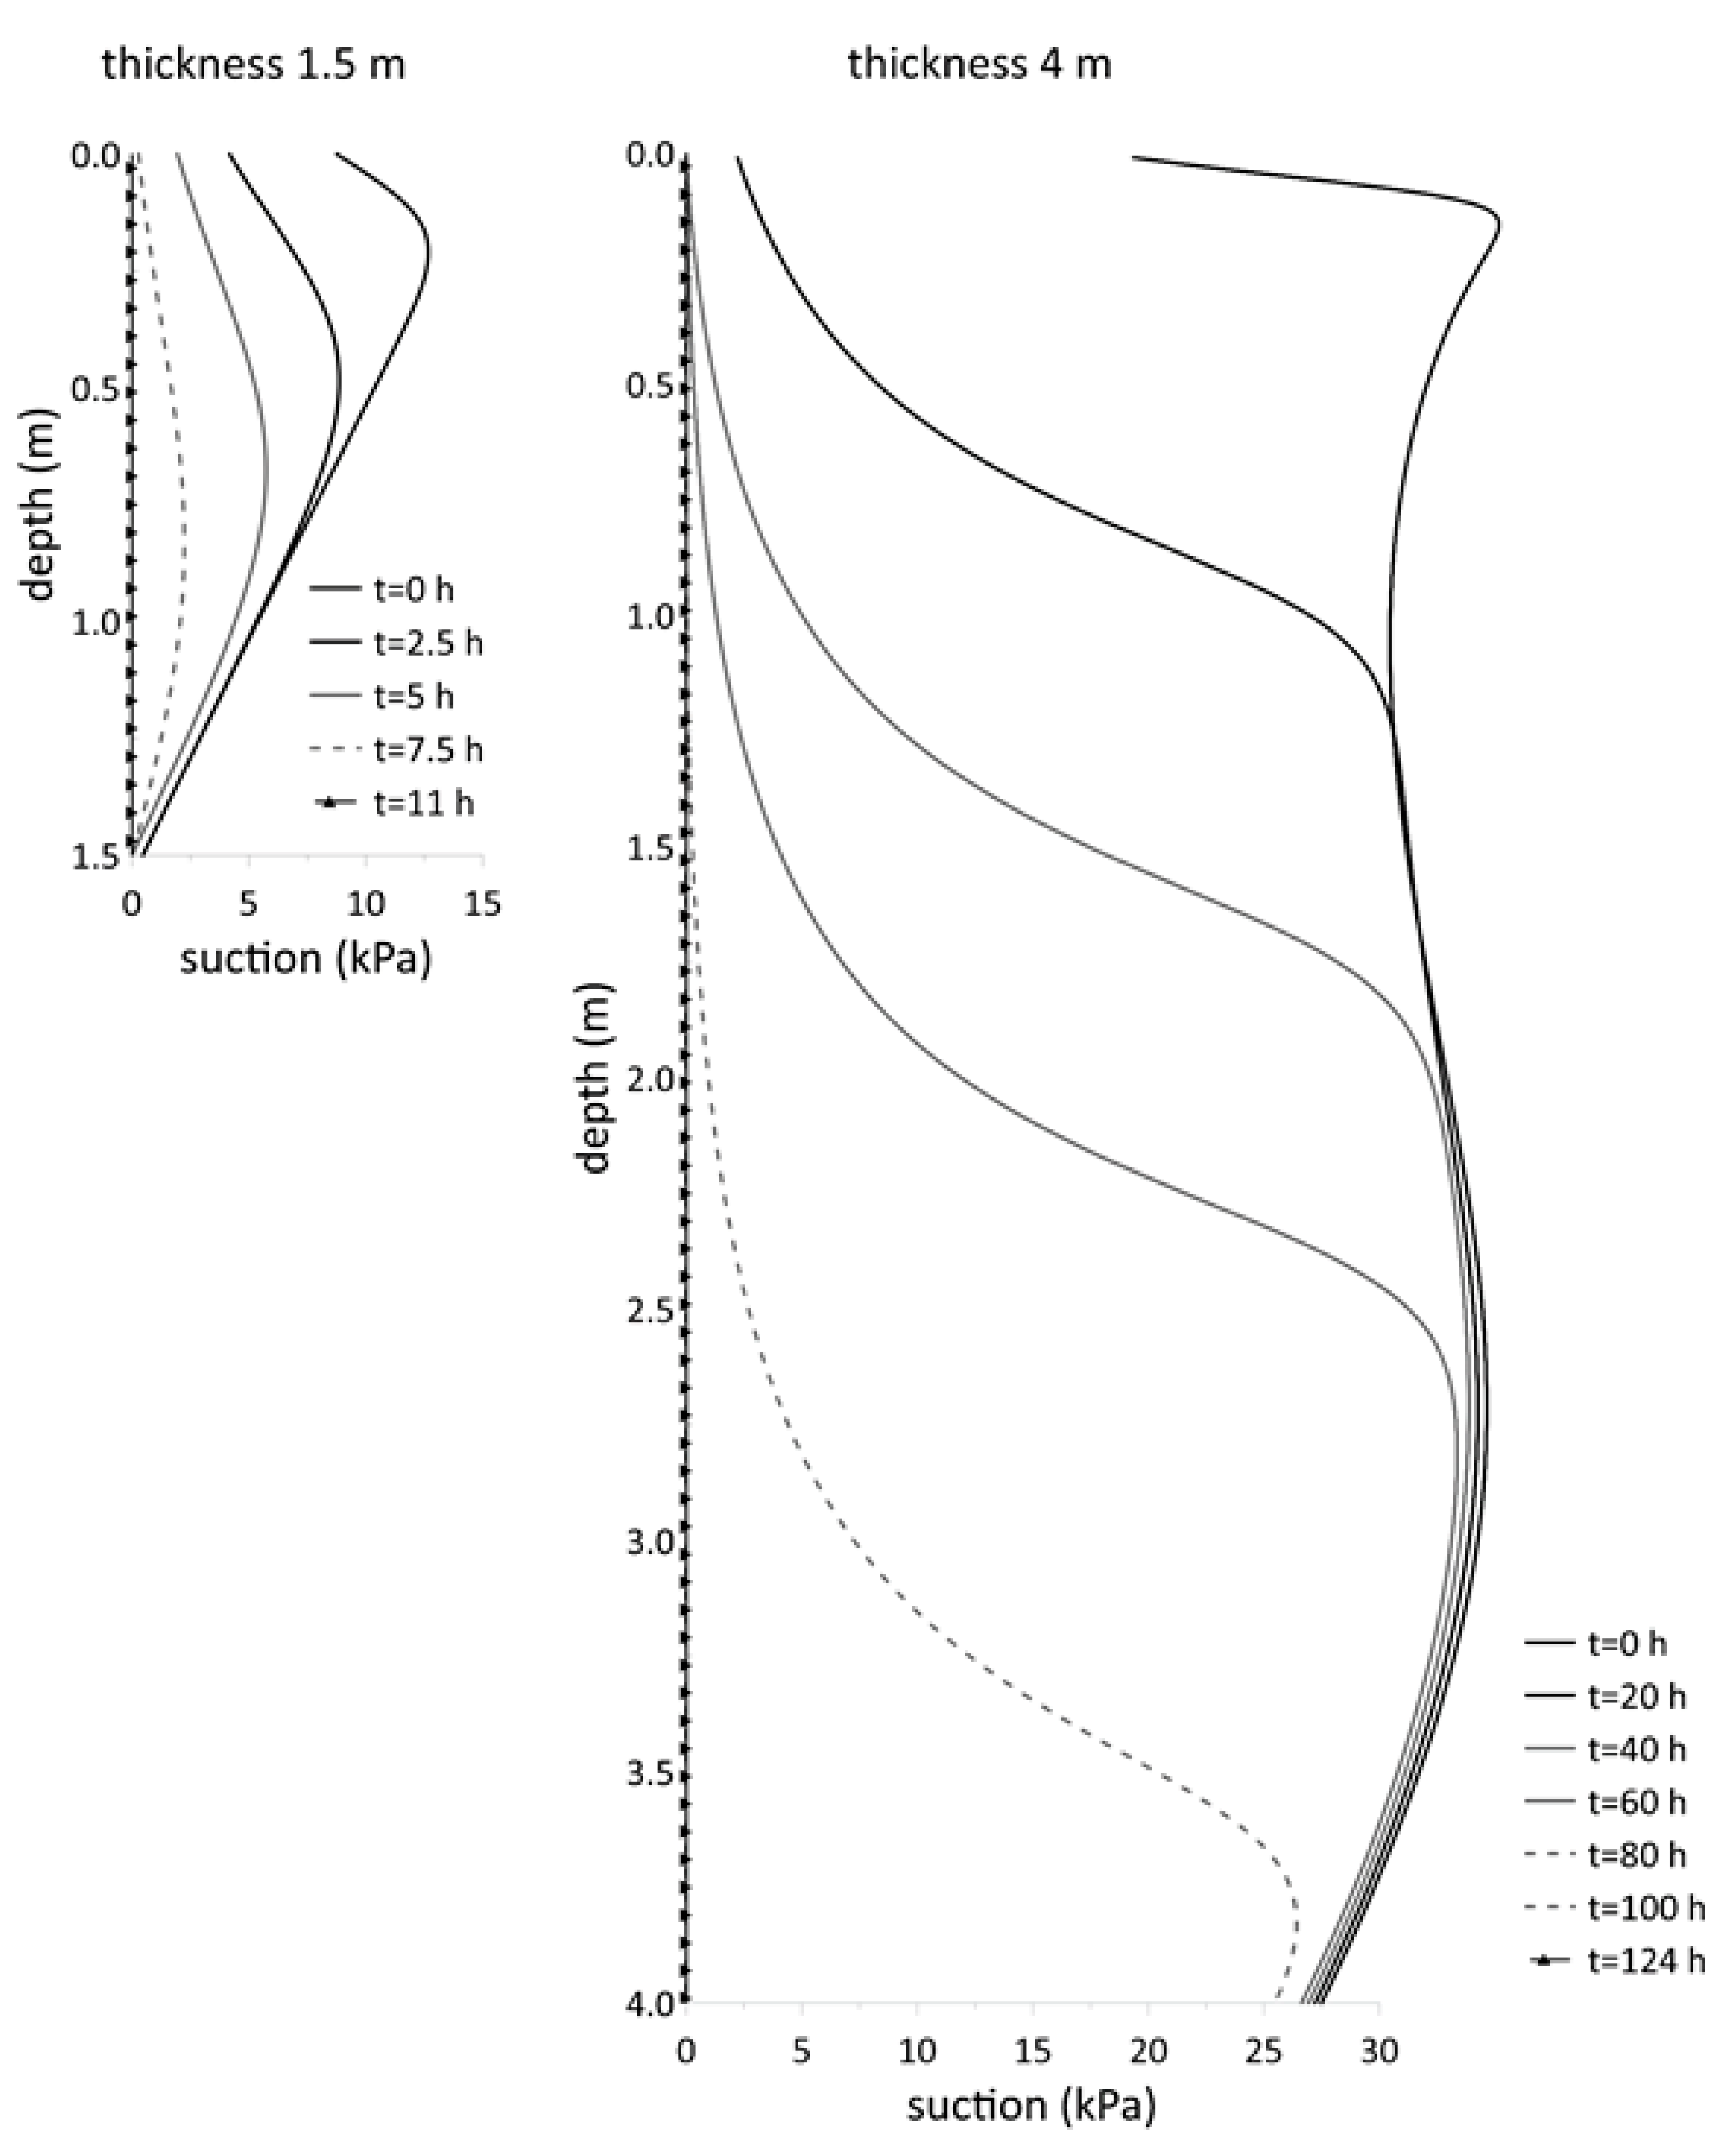
For the two domains s1.5 and s4, Figure 8 plots suction profiles predicted after the simulation of the antecedent meteorological evolution. The four profiles refer to the four initial suction values adopted: suB0 = 20 kPa; suB0 = 35 kPa; suB0 = 50 kPa and suB0 = 70 kPa.
All s1.5 profiles show a linear hydrostatic independent from suB0, with zero suction at the domain base and increasing suction upward. This is because the small size of the domain means that antecedent rainfall amounts are sufficient to increase water storage close to the maximum value, independently from the initial imbibition state. At the end of last precipitation of the antecedent period, suctions are reduced to very low levels, placed below the air entry value su* (about 10 kPa). When unsaturated conditions exist at the lowermost surface, the seepage surface acts as an impervious barrier, with accumulating precipitation water flowing downward and promoting the disappearance of suction. Once saturation has been reached, the surface seepage sets pore water pressure to zero and activates drainage. During the last three days of the antecedent period, no precipitation occurs (see Figure 6). During this period, suction tends to increase at any depth to re-establish hydraulic hydrostatic equilibrium, with water content falling due to base drainage. This process is rapid as suction changes, occurring below the air entry value (for su < su*), require very small changes in volumetric water content.
At the end of the antecedent period, the thicker domain s4 shows the suction profiles are markedly affected by initial suctions. Suction distributions obtained for the two initial applied limit conditions, suB0 = 20 kPa and suB0 = 70 kPa, differ from each other and both depart from the hydrostatic trend retuned by the thinner domain (s1.5).
For suB0 = 20, the analyses yield a profile less than that of the hydrostatic value, with zero suction at the base, while for suB0 = 70, analyses yield an irregular profile, fluctuating around 30 kPa.
For suB0 = 20kPa, a sequence like that described for the s1.5 domain takes place. Because of the initial relevant imbibition state, the amount of antecedent rainfall pushes suction below the air entry value at the end of the last precipitation of the antecedent period. Subsequently, suction travels at different rates towards a hydraulic hydrostatic equilibrium over the last three dry days. At elevations showing su < su*, suction changes are rapid (as explained above), while at elevations showing su > su*, changes are slow, requiring significant water content changes. Suction hence easily reaches the hydrostatic value only there where su < su*. In contrast, the re-equilibrium process remains uncompleted where hydrostatic equilibrium requires su > su*. In this latter case, suction remains close to the air entry value, departing from the hydrostatic value of an amount decreasing with depth.
For suB0 = 70kPa, suction cannot approach values close to su* under the effects of antecedent rainfall, because of the initial relevant dry state of the domain. The domain remains, therefore, in an unsaturated state, which is characterized by low unsaturated hydraulic conductivity and suction changes related to significant water content changes, according to the active branch of the SWCC. Both of these features promote re-equilibrium delay. Slow transient processes result in an irregular suction distribution far from that that of hydrostatic equilibrium.
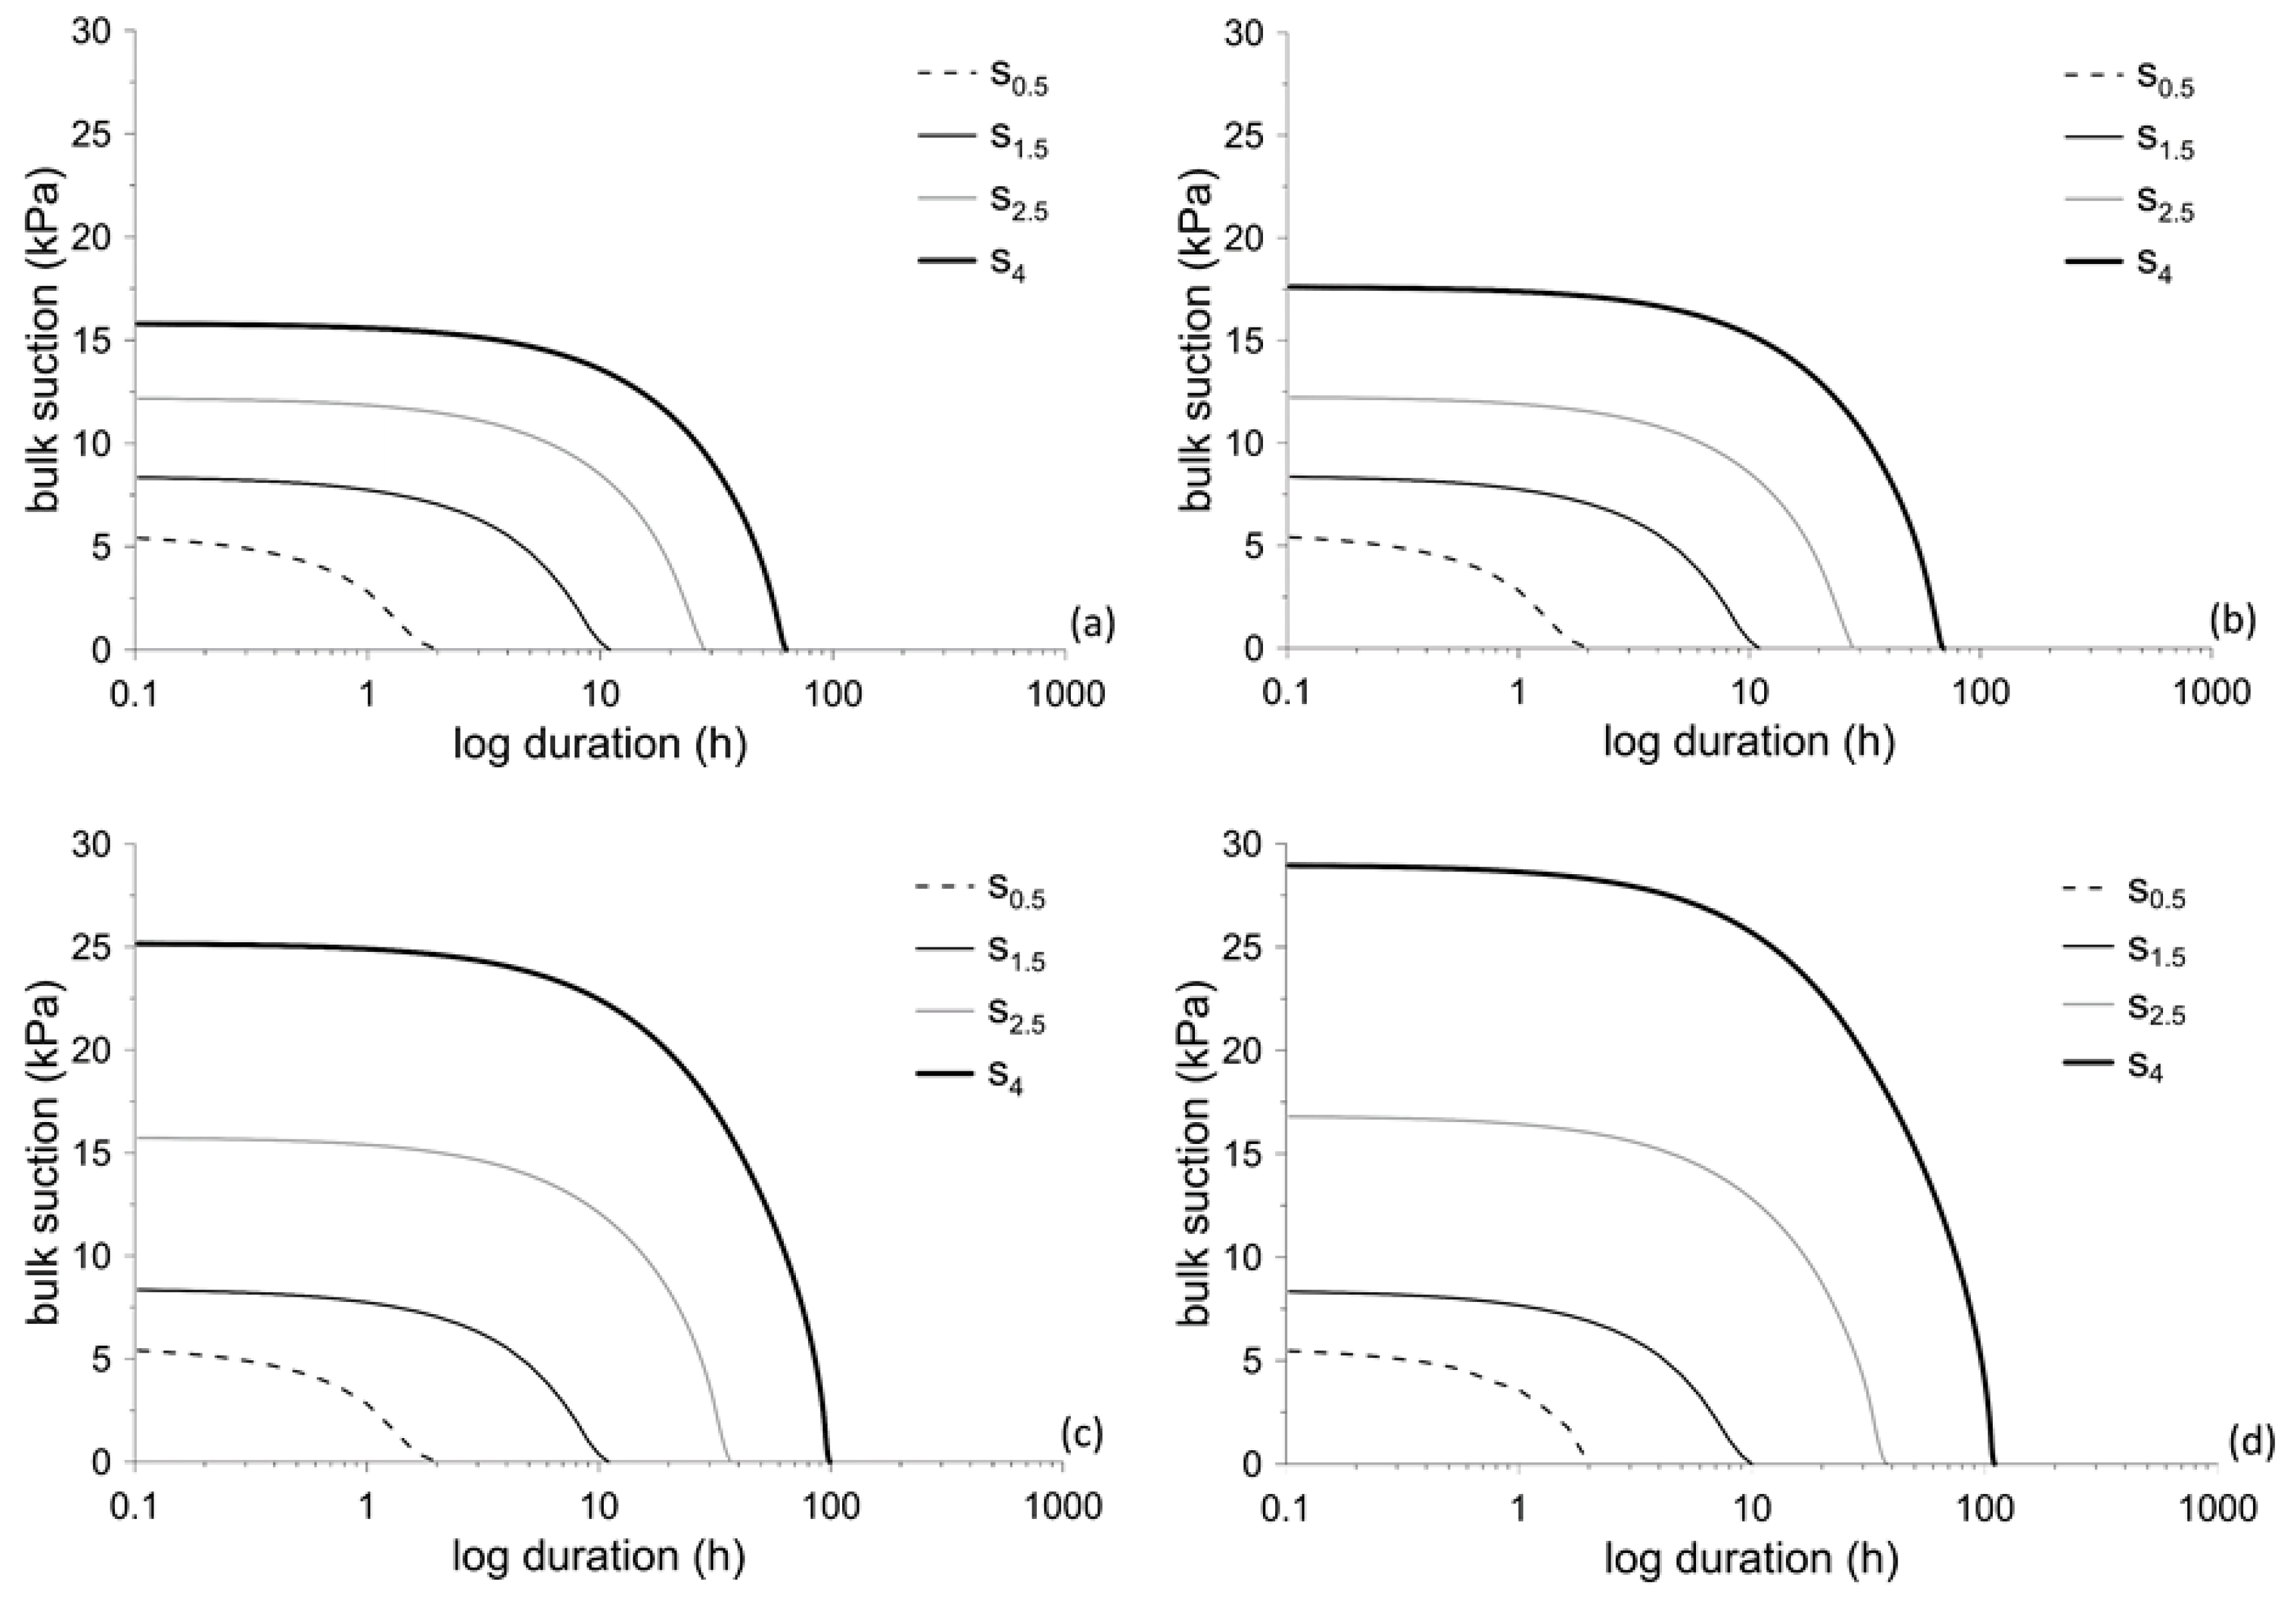
Figure 9 plots suction evolution induced by critical events. Suction is averaged throughout each domain si, for all four initial conditions assumed. For domains thinner than s1.5, the trends are unaffected by initial conditions, consistent with the previous insights about the effects of antecedent rainfall, which induce a same (hydrostatic) suction distribution at the beginning of the critical event (Figure 8). Domains thicker than s2 instead show an evolution clearly affected by initial conditions. At the end of the antecedent period, s2.5 yields suction values of su = 13 and 17 kPa, for suB0 = 20 and 70 kPa, respectively. For these same initial conditions, s4 yields su = 16 and 29 kPa.
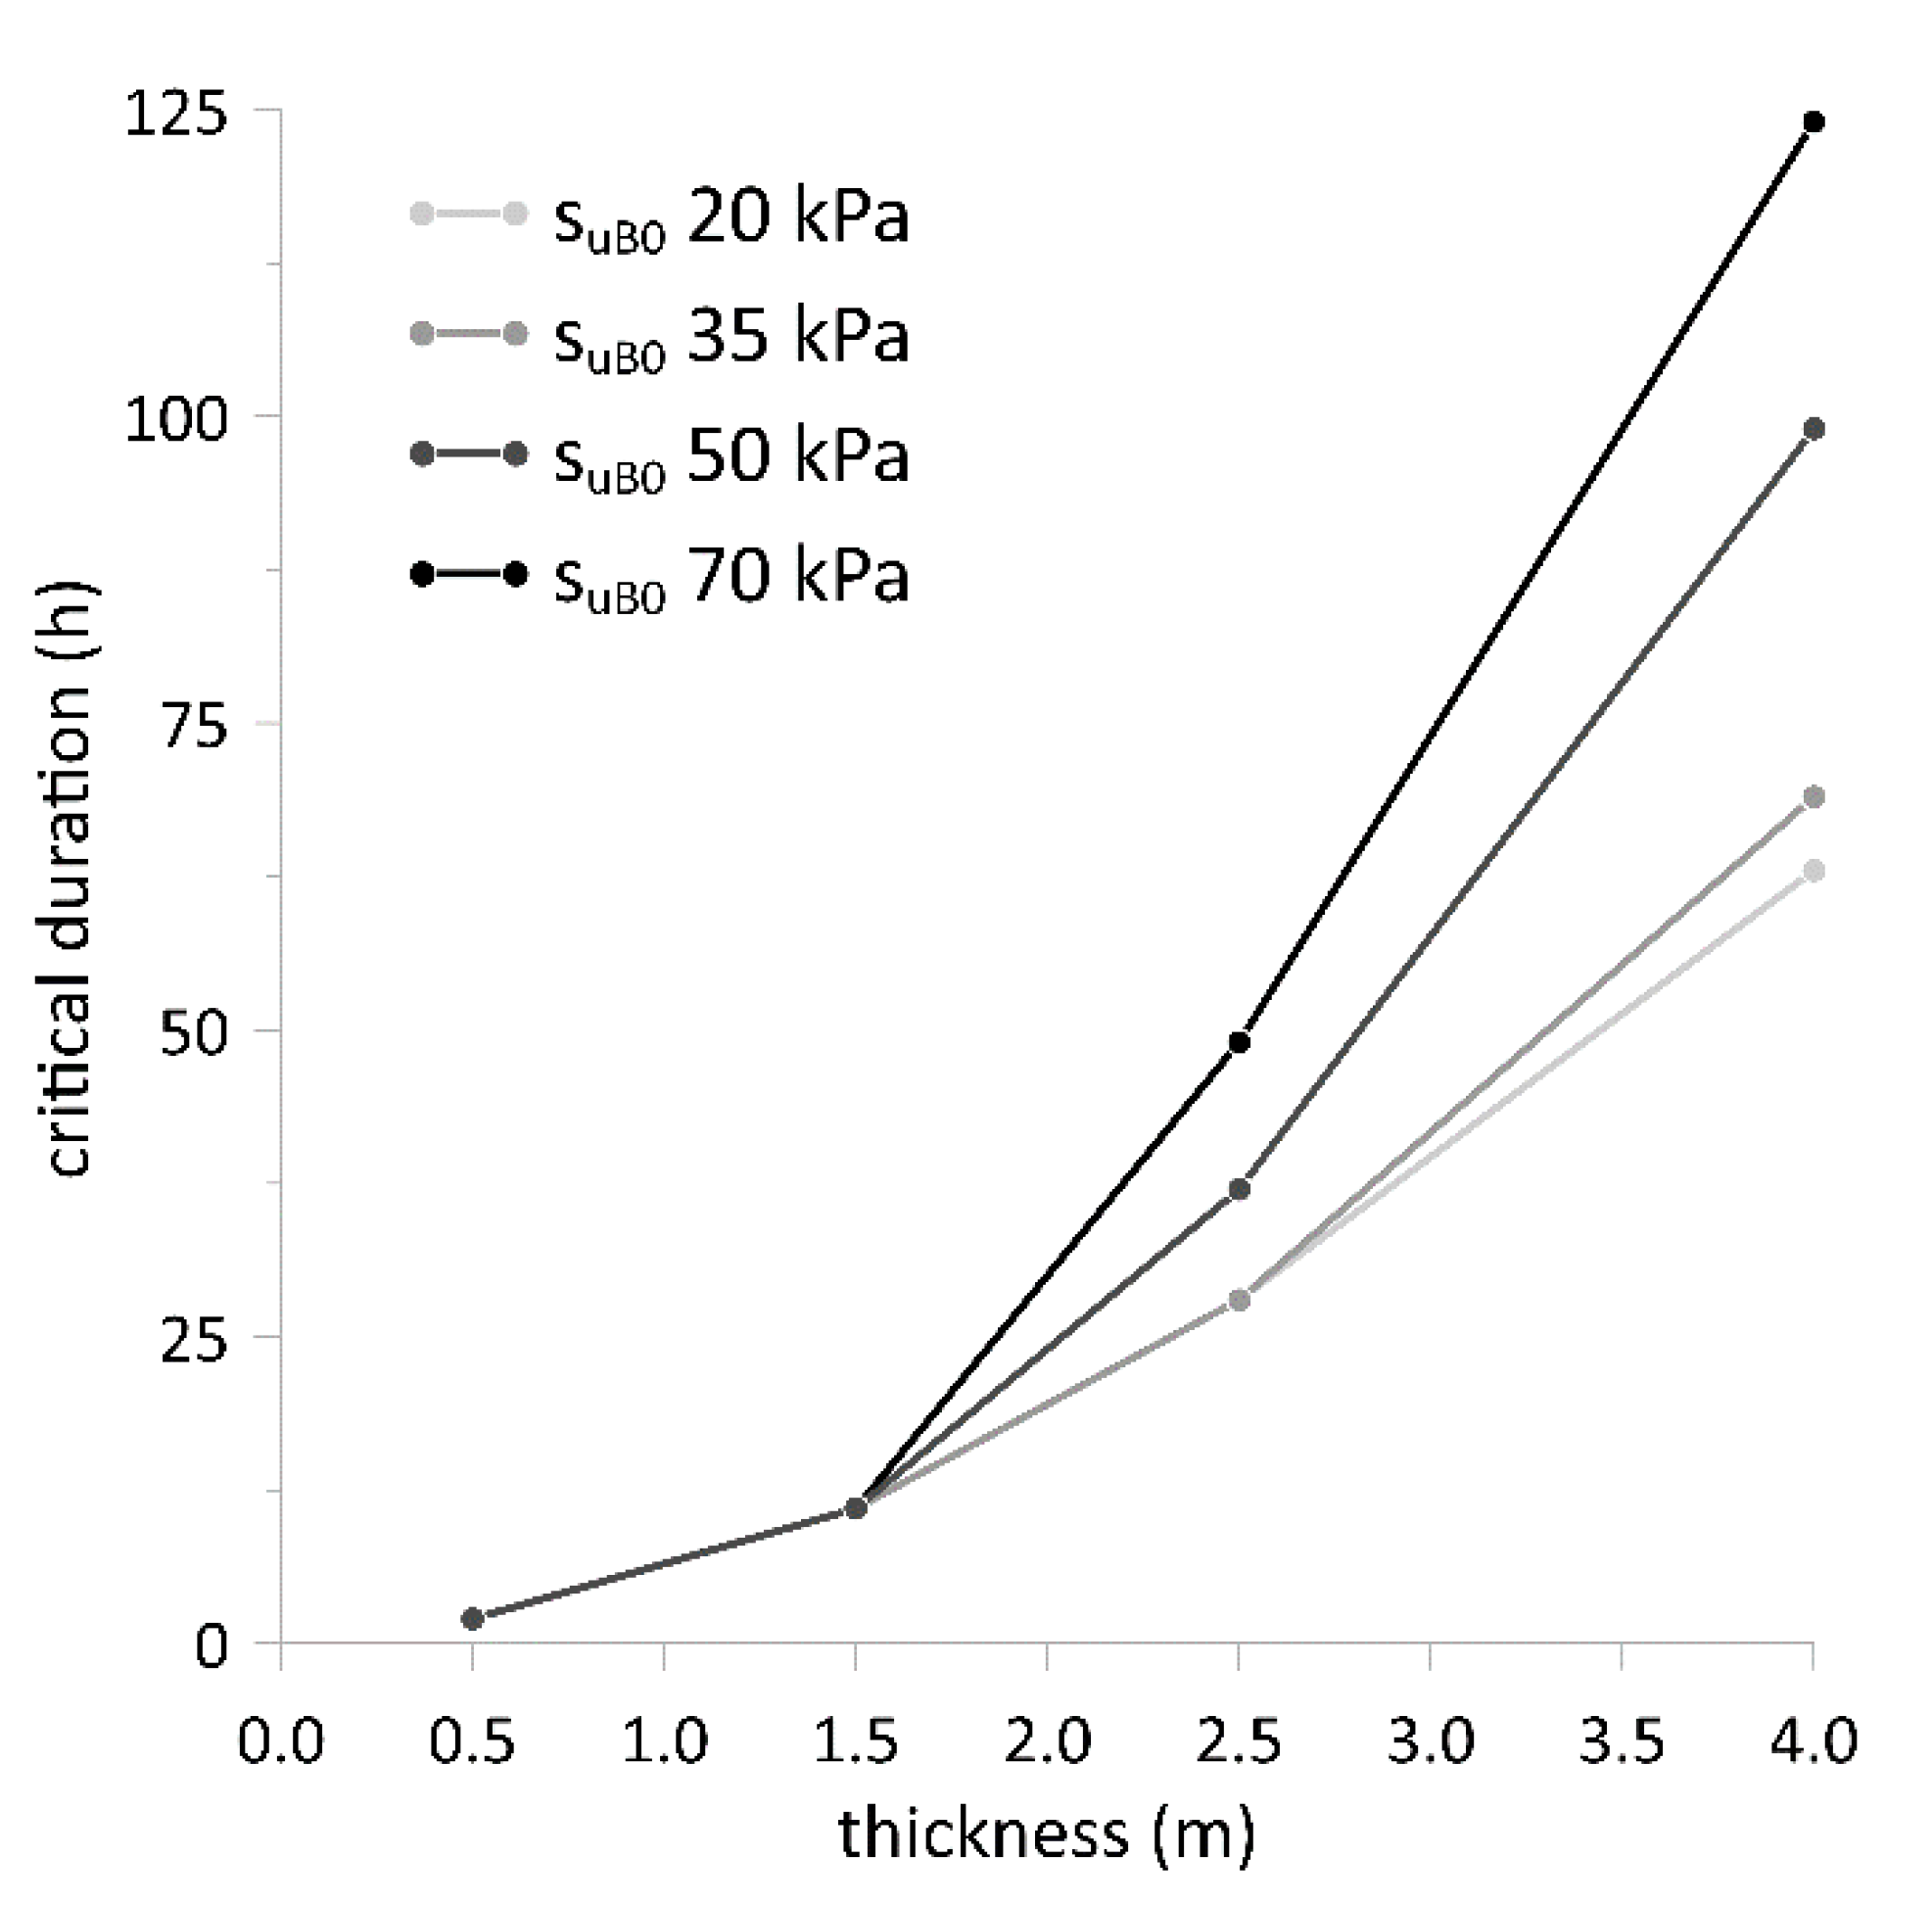
Figure 10 plots the relationships between domain thickness, si, and duration of critical event, di, for the four different initial conditions taken into consideration. It is possible to notice that taking into account the antecedent meteorological evolution implies that the di–si relationships follows a quadratic trend in place of the linear trend previously obtained (see Figure 7) without considering the effects of the antecedent meteorological evolution. For the actual cover thickness of the case study (si = s2), the plots obtained for initial conditions of 20 and 35 kPa deliver a critical event duration (16 h) consistent with that recorded.
4.3. Analysis of Set C
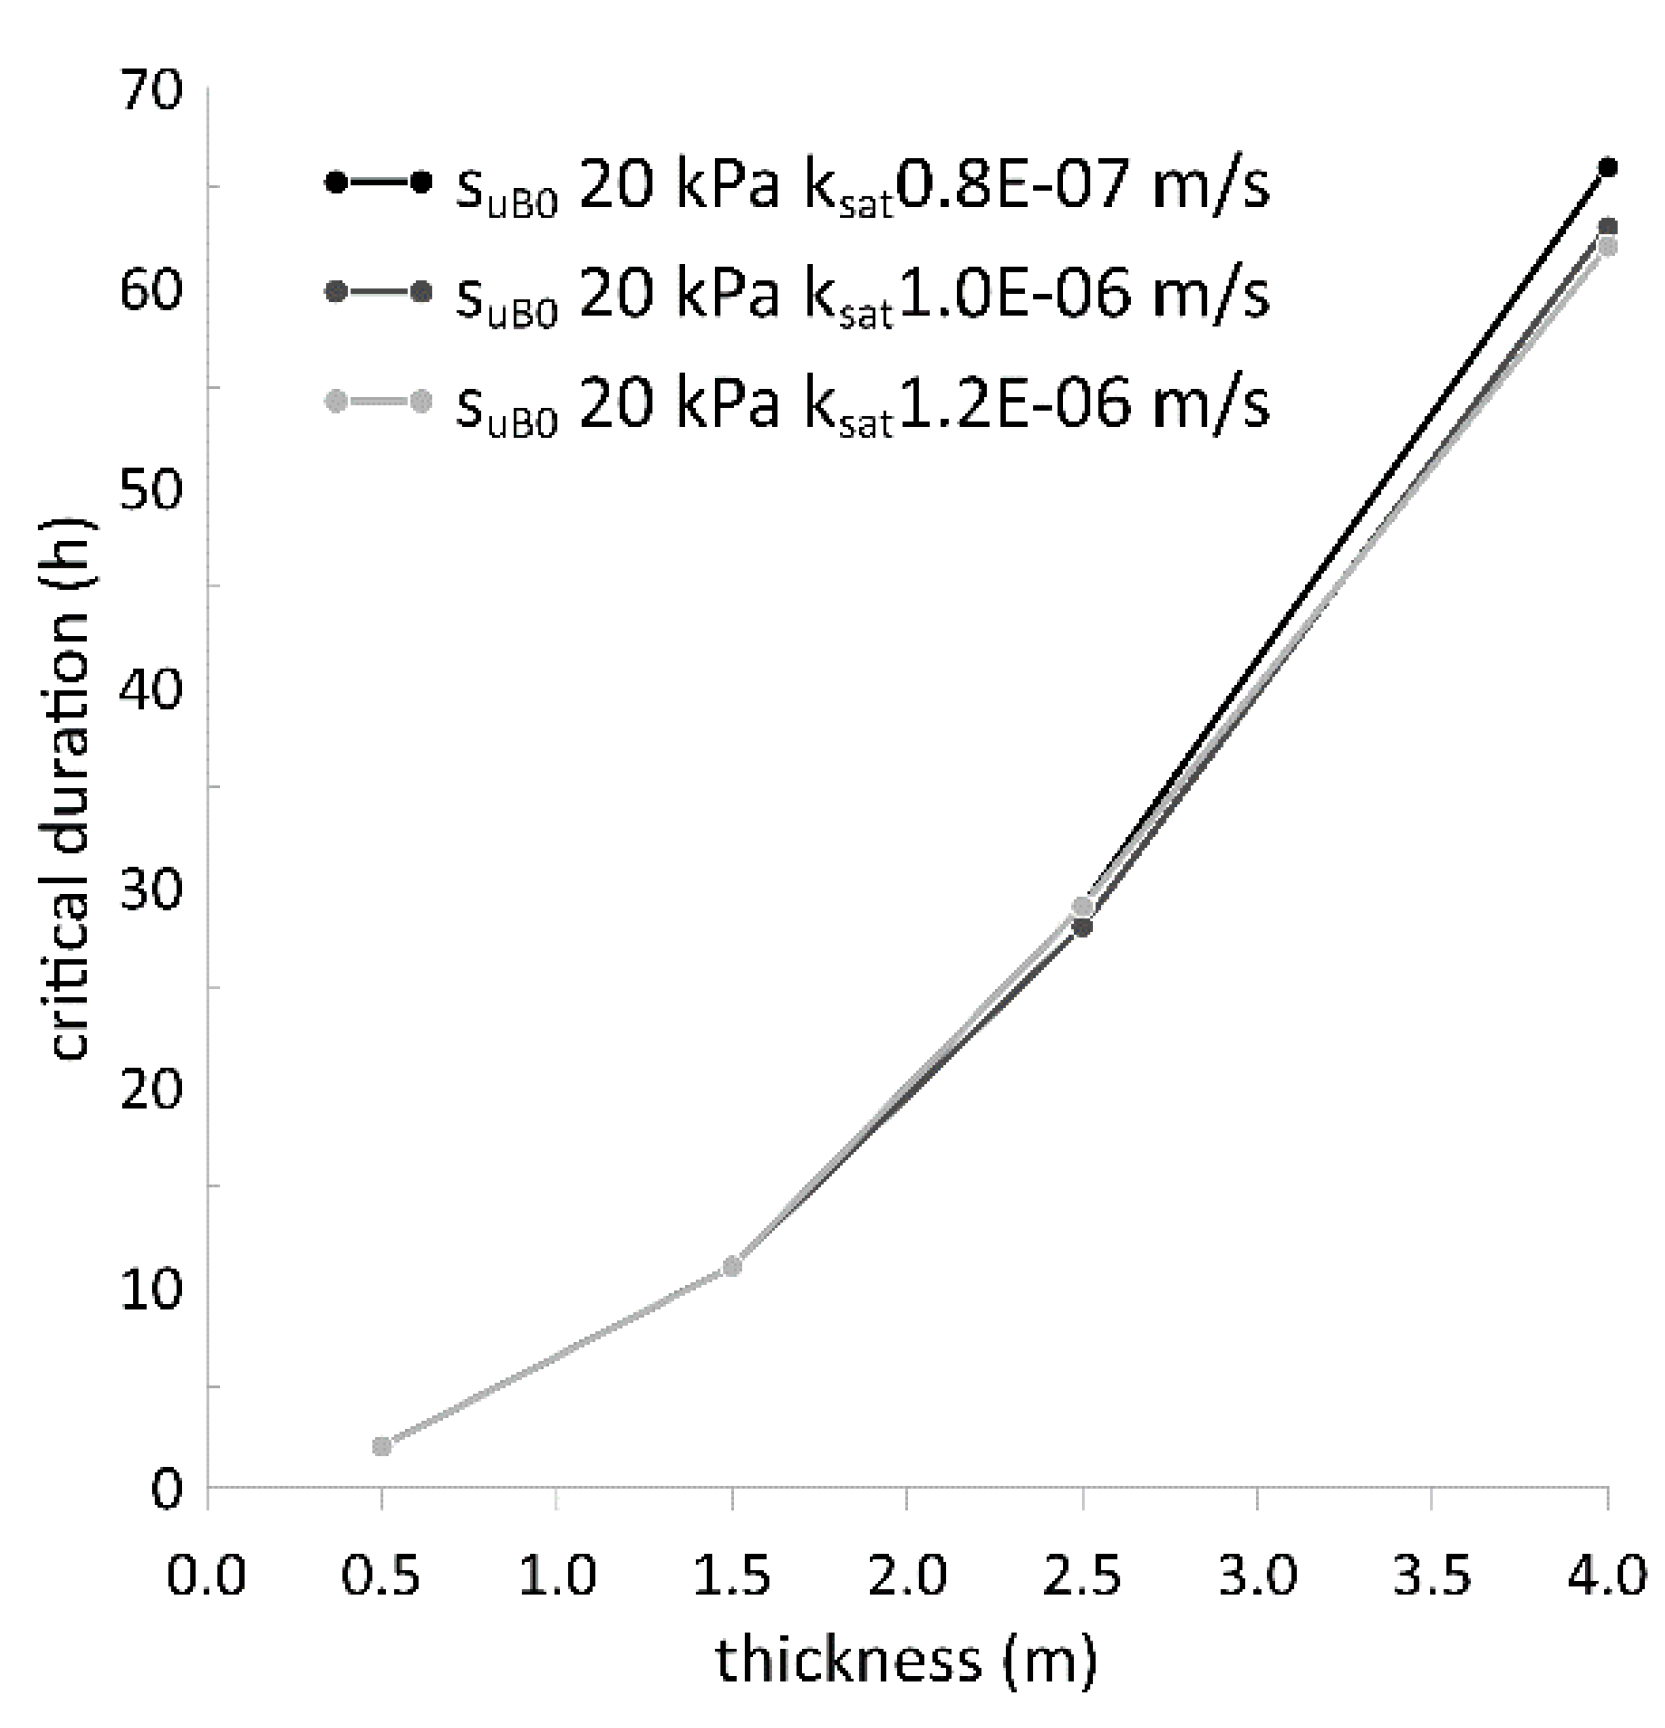
To investigate the sensitivity of results to the main parameter characterizing the hydraulic response of the system, the hydraulic conductivity at saturation, its value (1 × 10⁻⁶ m/s) was altered within a range of reasonable uncertainty. To this aim, the B analyses (Section 4.2) at suB0 = 20 kPa were repeated twice by lowering the parameter to 0.8 × 10⁻⁷ m/s and increasing it to 1.2 × 10⁻⁶ m/s. These two alterations result (Figure 11) in critical durations unaffected at all of the smallest thicknesses, and slight effects for largest thicknesses.
4.4. Analysis of Set D
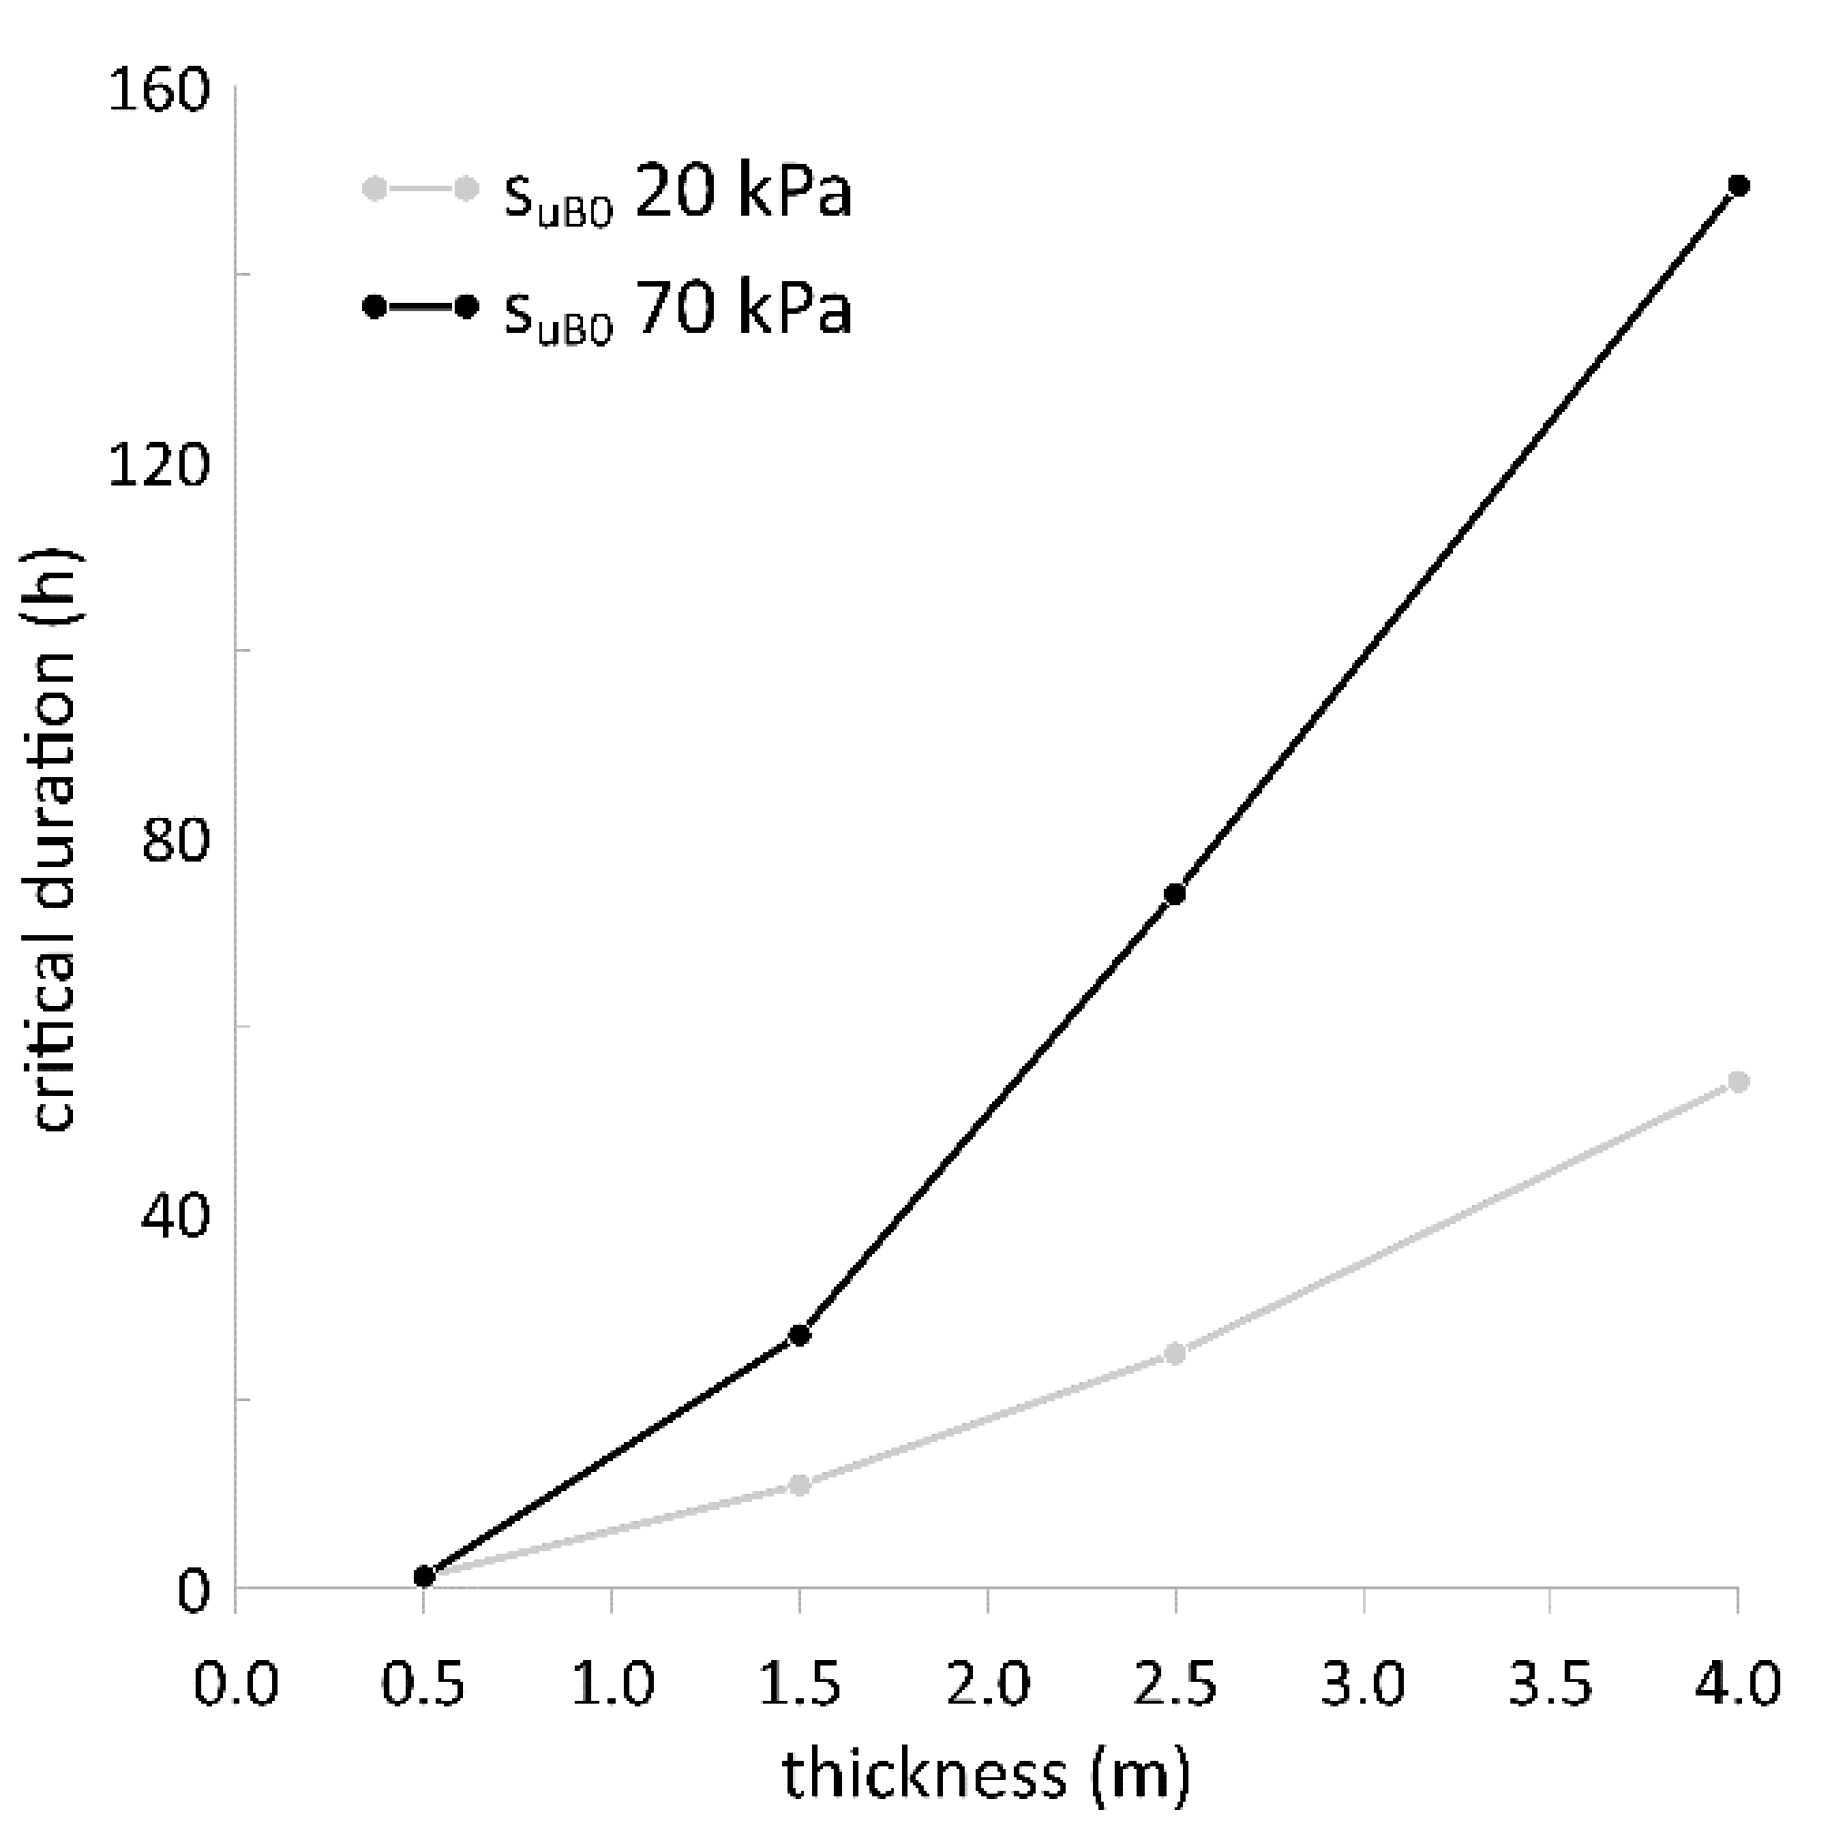
In order to better investigate the effects of antecedent rainfall, several analyses were carried out using the setting adopted in B analyses but backdating the starting time of the critical events to 1st January 2005, thus reducing the antecedent period of 62 days and the antecedent rainfall amount by about 500 mm (from about 1100 mm to 600 mm). The analyses were carried out for initial suctions (suB0) of 20 and 70 kPa. For suB0 = 20 kPa, antecedent rainfall amount is still enough to reduce suction levels (Figure 12) to the same values previously computed on 4th March (Figure 8). Obviously, this entails an unvaried relationship between critical duration and domain thickness (Figure 13). In contrast, for suB0 = 70 kPa, suction distributions (Figure 12) differ significantly from those previously obtained (Figure 8), and this results in a di–si relationship characterized by critical durations that are considerably longer at any thickness value.
4.5. Instability of Subdomains
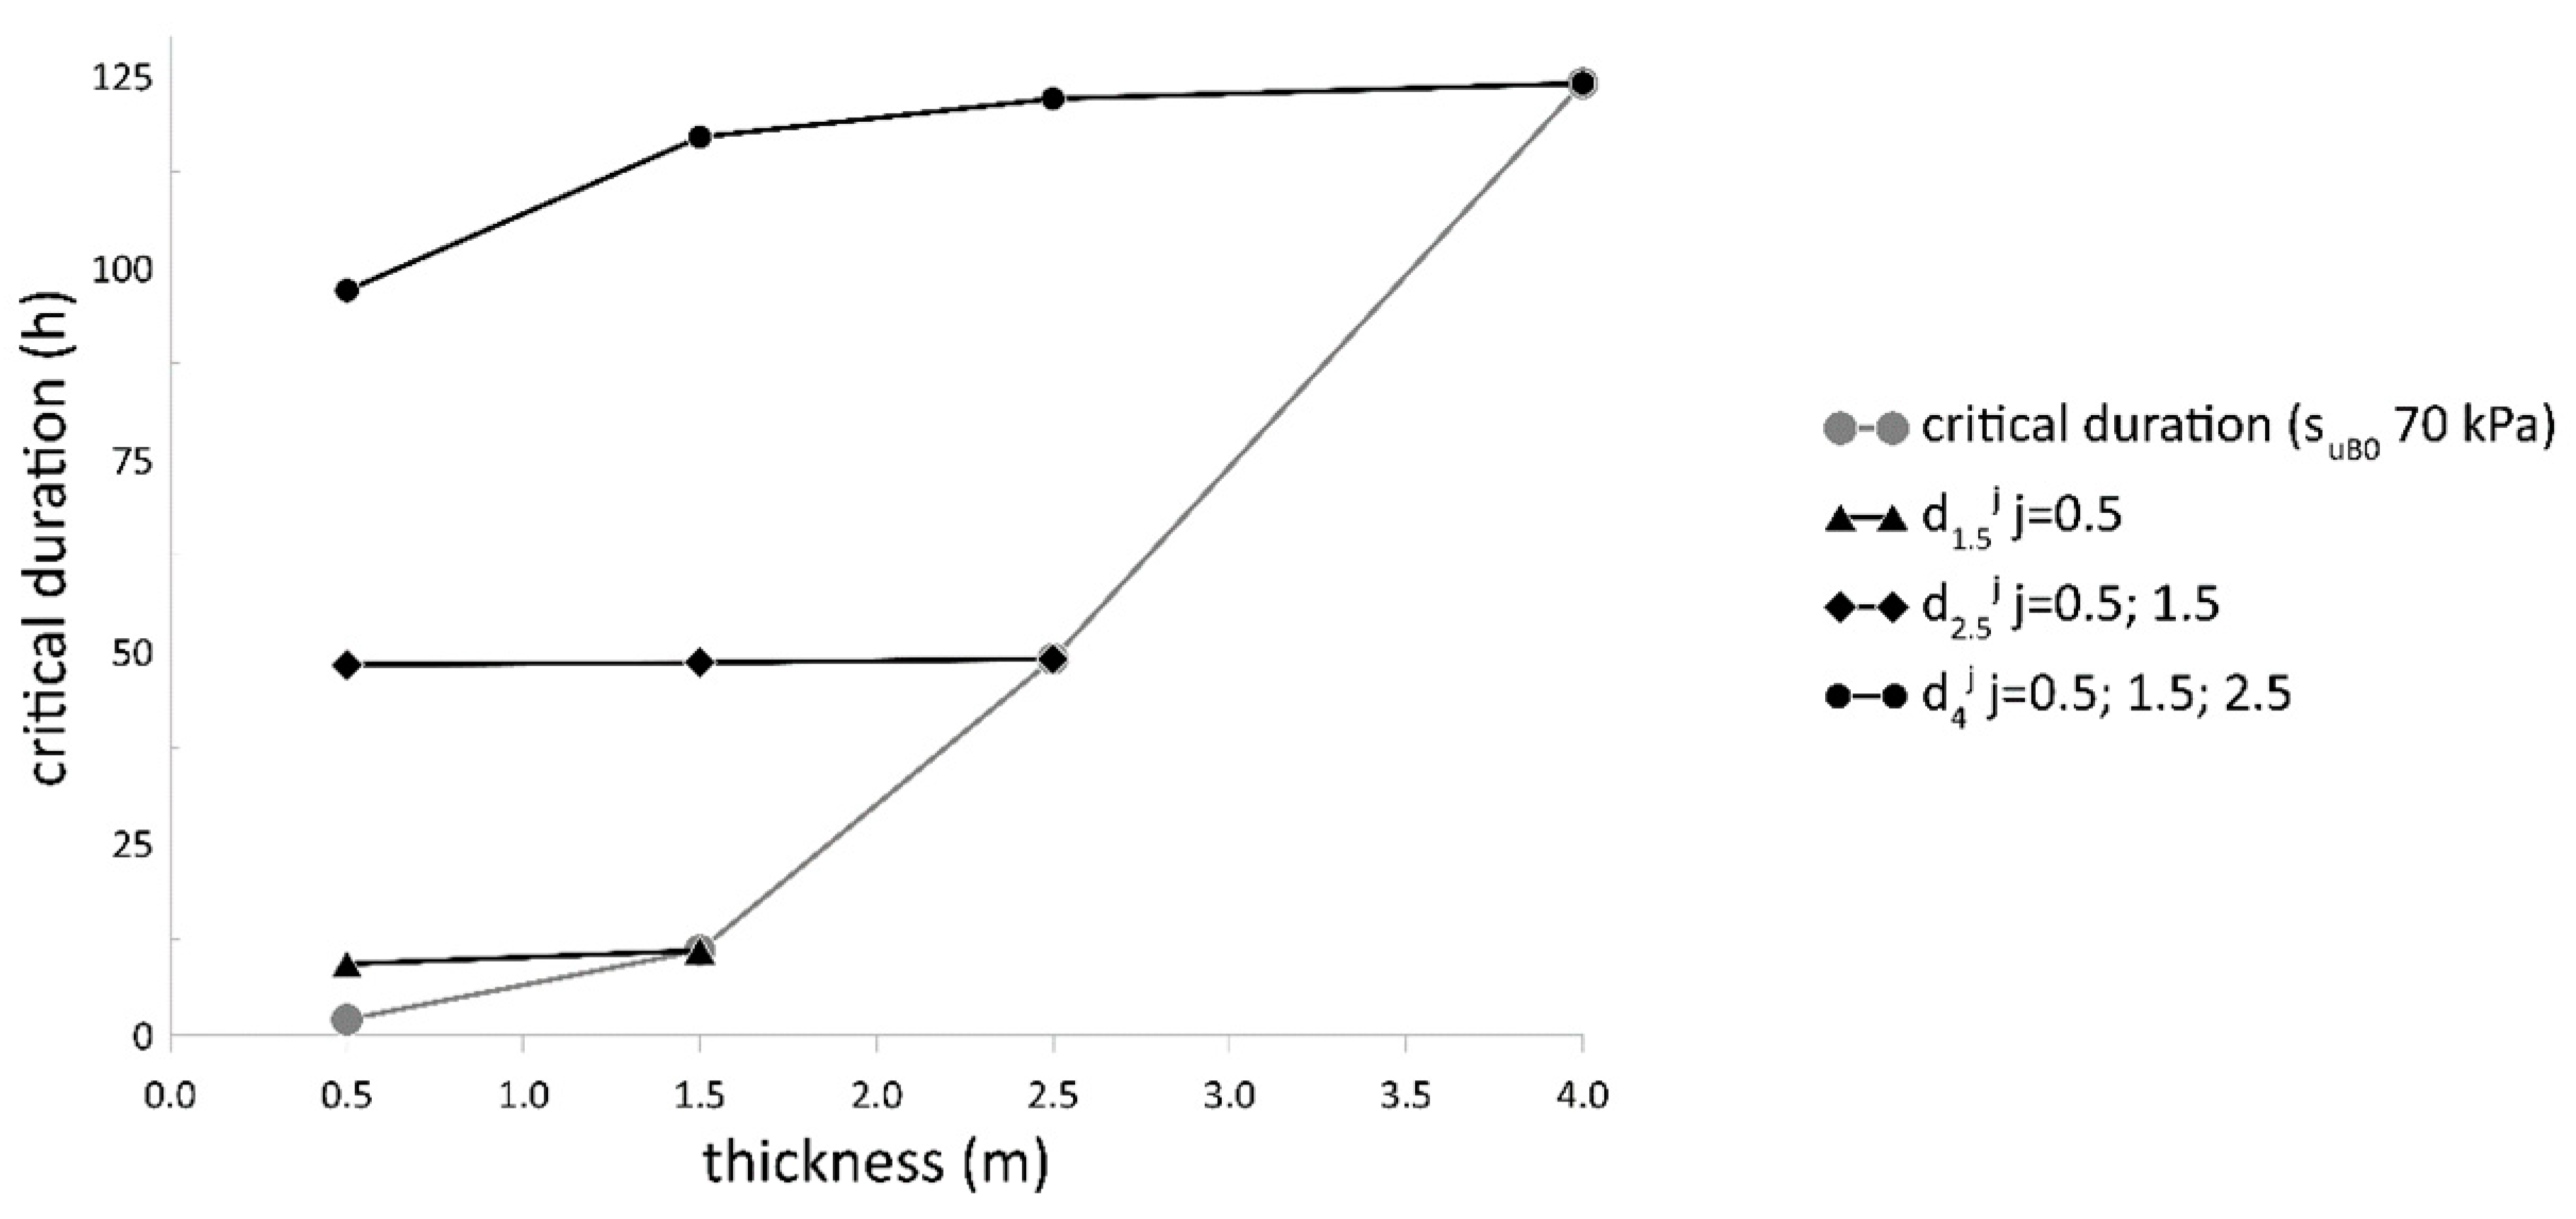
A further elaboration permits accounting for the possibility that, for each domain si, instability could take place partially due to suction vanishing throughout a shallow subdomain having thickness sik < si. This is assumed to occur under the effects of a critical sub-event lasting dik < di. Figure 14 plots the results yielded by several analyses carried out to characterize this feature. Each point di–si previously obtained for suB0 = 70 kPa is now connected to a line built with points (dik–sik), representing the subdomains of si and their critical sub-events. Regarding the domain s4, for which the critical event had been previously quantified in d4 = 124 h, Figure 14 shows that the subdomain s40.5 associates with a sub-critical event d40.5 = 97 h, s41 with d41 = 117 h, and s41.5 with d41.5 = 122 h. It is worth noting that the thinner subdomain analyzed shows a sub-critical event (97 h) that is only 20% shorter than the domain critical event (124 h).
5. Discussion
Rainfall-induced debris avalanches in densely rooted pyroclastic covers are associated with extensive liquefaction phenomena, relating to suction nullifying throughout the cover. Under this assumption, the results shown above clearly indicate how the duration of the critical rainfall significantly increases with increasing cover thickness. This outcome overturns previous prevailing literature findings about the topic (see Section 1, [36,37,38]), based on a traditional assumption about the instability criterion and often obtained under a full saturation hypothesis for the analyzed domain. According to the instability criterion proposed in this work, numerical results clearly show that, starting from the same initial suction distribution, a thicker cover better mitigates the drop in suction induced by rainfall, distributing the same rainfall volume through a greater depth. This results in a longer critical duration required for a debris avalanche. In this case, the thickness–critical duration relationship is linear. However, this enhanced capability to spread rainfall volumes also reflects the way that antecedent meteorological conditions affect suction distribution at the beginning of the critical event. Mean suction levels are in this case higher for thicker domains, further enhancing the capability of a thicker cover to mitigate a critical event. This explains why the previously mentioned relationship becomes quadratic, amplifying the beneficial effect on stability exerted by a larger thickness.
The influence of thickness on the critical event is substantially modified if the hydraulic condition applied to the lowermost boundary is varied. For example, if the shallowest portion of the cover is viewed as a subdomain that could be subject to instability, the subdomain’s lower boundary does not act as a discontinuity in the hydrological behavior and the capillary barrier results shift downward with respect to the subdomain base. This contact of the subdomain base with the same material entails a significant increase in the duration of this sub-critical event (Figure 14). Such duration is essentially affected by the distance between depths of the subdomain base and the capillary barrier, because the latter generates water accumulation, promoting increments in water content above it that reduce moving upward.
For a given capillary barrier depth, the relationships between subdomain thickness and duration of subcritical events (Figure 14) are linear. The relationships are also flattened, with subcritical events comparable with the critical event of the entire domain. This result may be explained through the analysis of the shapes of suction profiles and their evolution (Figure 15). These profiles approach a zero-distribution forming a sort of bell-shaped distribution, with suction values that tend to nullify through a partial branch just before it nullifies throughout the entire domain.
The relationships referred to subdomains (Figure 14) are shifted towards longer duration for deeper capillary barriers. This implies that subdomains having the same thicknesses, but different capillary barrier depths, are characterized by completely different subcritical events. For instance (Figure 14), the critical duration d40.5 (97 h), is much longer than that of d0.5 (10 h).
In Figure 10, the departing point of the curves marks the thickness (1.5–2 m) over which the antecedent period, which influences suction at the beginning of the critical event, becomes progressively longer than that analyzed (6 months). The analysis of stability conditions of covers thicker than 3 m should then go so far as to consider the influence of an antecedent meteorological window extended to some years. For these thicknesses, a landslide may be supposed to trigger under a critical event of realistic duration only if consecutive wet years have earlier dropped mean suction levels to very low values (about lower than 20 kPa).
A thicker domain is hence less hazardous, as it requires the occurrence of several consecutive very wet hydrological years to be affected by a landslide. On the other hand, it should also be noted that this lower likelihood of occurrence corresponds with a greater magnitude of the induced event.
It has been remarked that, for the steep slopes of the Lattari Mountains, pyroclastic cover frequently includes two layers that, although differing from a geological point of view, can be assumed to be very similar from a geotechnical point of view. Hence, the hypothesis of homogeneous medium is reliable, allowing for the results of the study to be extended to different contexts. The study may also be a reference for inhomogeneous stratigraphy if the shallowest silty layer overlays a pumice layer that acts as a seepage surface (capillary barrier) instead of the carbonaceous fractured bedrock. In such a frequent case, the results of the study may be referred to for the thickness of the shallowest silty layers.
6. Conclusions
The current study investigated the link between the domain thickness and critical event by parametrizing the thickness of a previously analyzed case study of a rainfall-induced landslide that occurred in Italy and involved a silty pyroclastic cover. Findings can be summarized as follows:
- if the antecedent meteorological evolution is neglected, starting from initial conditions in terms of domain imbibition typical of late autumnal periods, the relationship can be assumed to be linear;
- if the effects of an antecedent meteorological evolution, severe in terms of rainfall amount, is taken into account, the impact of the domain thickness is significantly more relevant and the relationship follows a quadratic trend;
- the influence of antecedent meteorological evolution implies that for relevant domain thicknesses the date of the critical event plays a crucial role;
- slight changes in hydraulic conductivity at saturation do not significantly affect results;
- the correct quantification of the critical event for domains thicker than 2 m requires that the antecedent meteorological evolution longer than one year is considered;
- under the same thickness, the duration of the critical event is strongly affected by the hydraulic boundary condition assumed at the lowermost boundary.
Author Contributions
Conceptualization, L.C., A.R., G.R. and L.P.; Data curation, L.C. and L.P.; Formal analysis, L.C., A.R. and G.R.; Funding acquisition, L.P.; Investigation, A.R., G.R. and L.P.; Methodology, L.C.; Validation, G.R.; Writing – original draft, L.C., A.R., G.R. and L.P. All authors have read and agreed to the published version of the manuscript.
Funding
This research received no external funding.
Acknowledgments
L.P., has partly developed this work within the framework of the PRIN 2015 project titled “Innovative Monitoring and Design Strategies for Sustainable Landslide Risk Mitigation”. They wish to thank the Ministero dell’Istruzione dell’Universitá e della Ricerca Scientifica (MIUR), which funded this project.
Conflicts of Interest
The authors declare no conflict of interest.
References
- Haque, U.; da Silva, P.F.; Devoli, G.; Pilz, J.; Zhao, B.; Khaloua, A.; Wilopo, W.; Andersen, P.; Lu, P.; Lee, J.; et al. The human cost of global warming: Deadly landslides and their triggers (1995–2014). Sci. Total Environ. 2019, 682, 673–684. [Google Scholar] [CrossRef]
- Ruangpan, L.; Vojinovic, Z.; Di Sabatino, S.; Leo, L.S.; Capobianco, V.; Oen, A.M.P.; McClain, M.E.; Lopez-Gunn, E. Nature-based solutions for hydro-meteorological risk reduction: A state-of-the-art review of the research area. Nat. Hazard. Earth Syst. Sci. 2020, 20, 243–270. [Google Scholar] [CrossRef] [Green Version]
- Greco, R.; Pagano, L. Basic features of the predictive tools of early warning systems for water-related natural hazards: Examples for shallow landslides. Nat. Hazard. Earth Syst. Sci. 2017, 17, 2213–2227. [Google Scholar] [CrossRef] [Green Version]
- Hojat, A.; Arosio, D.; Ivanov, V.; Longoni, L.; Papini, M.; Scaioni, M.; Tresoldi, G.; Zanzi, L. Geoelectrical characterization and monitoring of slopes on a rainfall-triggered landslide simulator. J. Appl. Geophys. 2019, 170. [Google Scholar] [CrossRef]
- Ivanov, V.; Arosio, D.; Tresoldi, G.; Hojat, A.; Zanzi, L.; Papini, M.; Longoni, L. Investigation on the Role of Water for the Stability of Shallow Landslides—Insights from Experimental Tests. Water 2020, 12, 1203. [Google Scholar] [CrossRef] [Green Version]
- Bilotta, E.; Cascini, L.; Foresta, V.; Sorbino, G. Geotechnical characterization of pyroclastic soils involved in huge flowslides. Geotech. Geol. Eng. 2005, 23, 365–402. [Google Scholar] [CrossRef]
- Olivares, L.; Picarelli, L. Shallow flowslides triggered by intense rainfalls on natural slopes covered by loose unsaturated pyroclastic soils. Geotechnique 2003, 53, 283–287. [Google Scholar] [CrossRef]
- Pagano, L.; Picarelli, L.; Rianna, G.; Urciuoli, G. A simplified approach for timely prediction of precipitation-induced landslides in unsaturated pyroclastic soils. Landslides 2010, 7, 273–289. [Google Scholar] [CrossRef]
- De Riso, R.; Budetta, P.; Calcaterra, D.; Santo, A.; Del Prete, S.; De Luca, C.; Di Crescenzo, G.; Guarino, P.M.; Mele, R.; Palma, B.; et al. Fenomeni di instabilità dei Monti Lattari e nell’area Flegrea (Campania): Scenari di sucettibilità da frana in area campione. Quaderni Geologia Applicata 2004, 11, 1–30. [Google Scholar]
- Matano, F.; De Chiara, G.; Ferlisi, S.; Cascini, L. Thickness of pyroclastic cover beds: The case study of Mount Albino (Campania region, southern Italy). J. Maps 2016, 12, 79–87. [Google Scholar] [CrossRef]
- De Vita, P.; Agrello, D.; Ambrosino, F. Landslide susceptibility assessment in ash-fall pyroclastic deposits surrounding Mount Somma-Vesuvius: Application of geophysical surveys for soil thickness mapping. J. Appl. Geophys. 2006, 59, 126–139. [Google Scholar] [CrossRef]
- Lucà, F.; Buttafuoco, G.; Robustelli, G.; Malafronte, A. Spatial modelling and uncertainty assessment of pyroclastic cover thickness in the Sorrento Peninsula. Environ. Earth Sci. 2014, 72, 3353–3367. [Google Scholar] [CrossRef]
- Del Soldato, M.; Pazzi, V.; Segoni, S.; De Vita, P.; Tofani, V.; Moretti, S. Spatial modeling of pyroclastic cover deposit thickness (depth to bedrock) in peri-volcanic areas of Campania (southern Italy). Earth Surf. Process. Landforms 2018, 43, 1757–1767. [Google Scholar] [CrossRef] [Green Version]
- Papa, R. Indagine Sperimentale Sulla Coltre Piroclastica di un Versante della Campania. Ph.D. Thesis, University of Naples “Federico II”, Naples, Italy, 2007. [Google Scholar]
- Picarelli, L.; Evangelista, A.; Rolandi, G.; Paone, A.; Nicotera, M.V.; Olivares, L.; Scotto di Santolo, A.; Lampitiello, S.; Rolandi, M. Mechanical properties of pyroclastic soils in Campania Region. In Proceedings of the 2nd International Workshop on Characterisation and Engineering Properties of Natural Soils, Singapore, 29 November–1 December 2006; Tan, T.S., Phoon, K.K., Hight, D.W., Leroueil, S., Eds.; CRC Press: London, UK, 2006; pp. 2331–2383. [Google Scholar]
- Papa, R.; Evangelista, A.; Nicotera, M.V.; Urciuoli, G. Mechanical properties of unsaturated pyroclastic soils affected by fast landslide phenomena. In Proceedings of the 1st European Conference on Unsaturated Soil, Durham, UK, 2–4 July 2008; Taylor and Francis Group plc: London, UK, 2008; pp. 917–923. [Google Scholar]
- Papa, R.; Nicotera, M.V. Shear strength of a pyroclastic unsaturated soil from suction-controlled direct shear tests. In Proceedings of the 5th International Conference on Unsaturated Soils—Unsaturated Soils, Barcelona, Spain, 6–8 September 2010; Alonso, E., Gens, A., Eds.; CRC Press/Balkema: Boka Raton, FL, USA, 2001; Volume 1, pp. 347–352. [Google Scholar]
- Damiano, E.; Olivares, L. The role of infiltration processes in steep slopes stability of pyroclastic granular soils: Laboratory and numerical investigation. Nat. Hazard. 2010, 52, 329–350. [Google Scholar] [CrossRef]
- Rotisciani, G.M.; di Prisco, C.; Desideri, A. Numerical analysis of wetting-induced instabilities in partially saturated soils under plane strain conditions. Int. J. Numer. Anal. Method. Geomech. 2019, 43, 1867–1884. [Google Scholar] [CrossRef]
- Olivares, L. Static liquefaction: An hypothesis for explaining transition from slide to flow in pyroclastic soils. In Proceedings of the Transition from Slide to Flow: Mechanisms and Remedial Measures, Trabzon, Turkey, 25–26 August 2001; [CD-ROM]. Karadeniz Technical University: Trabzon, Turkey, 2001. [Google Scholar]
- Olivares, L.; Picarelli, L. Susceptibility of loose pyroclastic soils to static liquefaction: Some preliminary data. In Proceedings of International Conference on Landslides—Causes, Impacts and Countermeasures, Davos, Switzerland, 17–21 June 2001; Kühne, M., Einstein, H.H., Krauter, E., Klapperich, H., Pöttler, R., Eds.; Verlag Gluckaüf: Essen, Germany, 2001; pp. 75–85. [Google Scholar]
- Nicotera, M.V.; Papa, R. Comportamento idraulico e meccanico della serie piroclastica di Monteforte Irpino. In Piattaforme Evolute di Telecomunicazioni e di Information Technology per l’Offerta di Servizi al settore Ambiente PETITOSA; Aracne Eds: Rome, Italy, 2007; pp. 272–288. [Google Scholar]
- Pirone, M.; Papa, R.; Nicotera, M.V.; Urciuoli, G. Soil water balance in an unsaturated pyroclastic slope for evaluation of soil hydraulic behaviour and boundary conditions. J. Hydrol. 2015, 528, 63–83. [Google Scholar] [CrossRef]
- Sorbino, G.; Foresta, V. Unsaturated hydraulic characteristics of pyroclastic soils. In Unsaturated Soils; Jucà, J.F.T., de Campos, T.M.P., Marinho, F.A.M., Eds.; CRC Press/A.A. BAlkema: Rotterdam, The Netherlands, 2002; Volume 1, pp. 405–410. [Google Scholar]
- Pagano, L.; Zingariello, M.C.; Vinale, F. A large physical model to simulate flowslides in pyroclastic soils. In Proceedings of the 1st European Conference on Unsaturated Soils: Unsaturated Soils—Advances in Geo-engineering, Durham, UK, 2–4 July 2008; Toll, D.G., Augarde, C.E., Gallipoli, D., Wheeler, S.J., Eds.; CRC Press: Boca Raton, FL, USA; pp. 111–115.
- Olivares, L.; Damiano, E.; Greco, R.; Zeni, L.; Picarelli, L.; Minardo, A.; Guida, A.; Bernini, R. An instrumented flume to investigate the mechanics of rainfall-induced landslides in unsaturated granular soils. Geotech. Test. J. 2009, 32, 108–118. [Google Scholar]
- Rojas, J.C.; Pagano, L.; Zingariello, M.C.; Mancuso, C.; Giordano, G.; Passeggio, G. A new high capacity tensiometer: First results. In Proceedings of the I European Conference on Unsaturated Soils, Durham, UK, 2–4 July 2008; CRC Press—Taylor & Francis Group: London, UK; pp. 205–211.
- Comegna, L.; Avolio, B.; Damiano, E.; Olivares, L.; Picarelli, L. Risposta idrologica di un deposito piroclastico parzialmente saturo. In Proceedings of the Incontro Annuale dei Ricercatori di Geotecnica (IARG), Padova, Italy, 2–4 July 2012. [Google Scholar]
- Pirone, M.; Damiano, E.; Picarelli, L.; Olivares, L.; Urciuoli, G. Groundwater-atmosphere interaction in unsaturated pyroclastic slopes at two sites in Italy. Italian Geotech. J. 2012, 3, 29–50. [Google Scholar]
- Pirone, M.; Papa, R.; Nicotera, M.V.; Urciuoli, G. In situ monitoring of the groundwater field in an unsaturated pyroclastic slope for slope stability evaluation. Landslides 2015, 12, 259–276. [Google Scholar] [CrossRef]
- Rotisciani, G.M.; Sciarra, G.; Casini, F.; Desideri, A. Modeling rainfall infiltration through coarse and fine-grained unsaturated geomaterials. In Unsaturated Soils: Research & Applications; Khalili, N., Russell, A., Khoshghalb, A., Eds.; CRC Press: Boca Raton, FL, USA, 2014; Volume 1, pp. 521–528. [Google Scholar]
- Reder, A. Interazione Delle Coltri Piroclastiche Con L’Atmosfera e il Substrato. Ph.D. Thesis, University of Naples “Federico II”, Naples, Italy, 2016. [Google Scholar]
- Rianna, G.; Pagano, L.; Urciuoli, G. Investigation of soil-atmosphere interaction in pyroclastic soils. J. Hydrol. 2014, 510, 480–492. [Google Scholar] [CrossRef]
- Reder, A.; Rianna, G.; Pagano, L. Physically based approaches incorporating evaporation for early warning predictions of rainfull-induced landslides. Nat. Hazard. Earth Syst. Sci. 2018, 18, 613–631. [Google Scholar] [CrossRef] [Green Version]
- Reder, A.; Pagano, L.; Picarelli, L.; Rianna, G. The role of the lowermost boundary conditions in the hydrological responde of shallow sloping covers. Landslides 2017, 14, 861–873. [Google Scholar] [CrossRef]
- Kim, M.S.; Onda, Y.; Uchida, T.; Kim, J.K. Effects of soil depth and subsurface flow along the subsurface topography on shallow landslide predictions at the site of a small granitic hillslope. Geomorphology 2016, 271, 40–54. [Google Scholar] [CrossRef]
- Uchida, T.; Tamura, K.; Akiyama, K. The role of grid cell size, flow routing algorithm and spatial variability of soil depth on shallow landslide prediction. Italian J. Eng. Geol. Environ. 2011, 11, 149–157. [Google Scholar] [CrossRef]
- Lanni, C.; Mcdonnell, J.; Hopp, L.; Rigon, R. Simulated effect of soil depth and bedrock topography on near-surface hydrologic response and slope stability. Earth Surf. Process. Landf. 2013, 38, 146–159. [Google Scholar] [CrossRef]
- Di Crescenzo, G.; Melania de Falco, M.; Iervolino, V.; Rinaldi, S.; Santangelo, N.; Santo, A. Proposal of a new semiquantitative methodology for flowslides triggering susceptibility assessment in the carbonate slope contexts of Campania (southern Italy). Italian J. Eng. Geol. Environ. 2008, 1, 63–81. [Google Scholar]
- Lu, N.; Godt, J.W. Infinite slope stability under steady unsaturated seepage conditions. Water Resour Res. 2008, 44, W11404. [Google Scholar] [CrossRef]
- De Vita, P.; Celico, P.; Siniscalchi, M.; Panza, R. Distribution, hydrogeological features and landslide hazard of pyroclastic soils on carbonate slopes in the area surrounding Mount Somma-Vesuvius. Italian J. Eng. Geol. Environ. 2006, 1, 1–24. [Google Scholar]
- De Vita, P.; Napolitano, E.; Godt, J.W.; Baum, R. Deterministic estimation of hydrological thresholds for shallow landslide initiation and slope stability models: Case study from the Somma-Vesuvius area of Southern Italy. Landslides 2013, 10, 713–728. [Google Scholar] [CrossRef]
- De Vita, P.; Fusco, F.; Tufano, R.; Cusano, D. Seasonal and Event-Based Hydrological and Slope Stability Modeling of Pyroclastic Fall Deposits Covering Slopes in Campania (Southern Italy). Water 2018, 10, 1140. [Google Scholar] [CrossRef] [Green Version]
- Di Crescenzo, G.; Santo, A. Analisi geomorfologica delle frane da scorrimento-colata rapida in depositi piroclastici della Penisola Sorrentina (Campania). Geogr. Fis. Din. Quartenario 1999, 22, 57–72. [Google Scholar]
- Revellino, P.; Guerriero, L.; Gerardo, G.; Hungr, O.; Fiorillo, F.; Esposito, L.; Guadagno, F.M. Initiation and propagation of the 2005 debris avalanche at Nocera inferior (Southern Italy). Italian J. Geosci. 2013, 132, 366–379. [Google Scholar] [CrossRef]
- Kottek, M.; Grieser, J.; Beck, C.; Rudolf, B.; Rubel, F. World Map of the Köppen–Geiger climate classification updated. Meteorologische Zeitschrift 2006, 15, 259–263. [Google Scholar] [CrossRef]
- Rianna, G.; Pagano, L.; Urciuoli, G. Rainfall patterns triggering flowslides in pyroclastic soils. Eng. Geol. 2014, 174, 22–35. [Google Scholar] [CrossRef]
- Pagano, L.; Reder, A.; Rianna, G. Effects of vegetation on hydrological response of silty volcanic covers. Can. Geotech. J. 2019, 56, 1261–1277. [Google Scholar] [CrossRef]
- De Riso, R.; Budetta, P.; Calcaterra, D.; Santo, A. Riflessioni sul comportamento delle colate rapide non incanalate della Campania, alla luce delle conoscenze pregresse. In Proceedings of the “La Mitigazione del Rischio da Colata di Fango a Sarno e Negli Altri Comuni Colpiti Dagli Eventi del Maggio 1988”, Napoli, Italy, 2–3 May 2005; 2007 Commissariato di governo per l’emergenza idrogeologica in Campania ed Avellino. pp. 81–92. [Google Scholar]
- Allen, R.G.; Pereira, L.S.; Raes, D.; Smith, M. Crop Evapotranspiration (Guidelines for Computing Crop Water Requirements). In FAO Irrigation and Drainage; Food and Agriculture Organization of the United Nations: Rome, Italy, 1998; Paper No. 56. [Google Scholar]
- Wilson, G.W.; Fredlund, D.G.; Barbour, S.L. Coupled soil-atmosphere modelling for soil evaporation. Can. Geotech. J. 1994, 31, 151–161. [Google Scholar] [CrossRef]
- Richards, L.A. Capillary conduction of liquid through porous media. J. Appl. Phys. 1931, 1, 318–333. [Google Scholar]
- Papa, R.; Pirone, M.; Nicotera, M.V.; Urciuoli, G. Meccanismo di innesco di colate di fango in piroclastiti parzialmente sature. In “Rainfall Induced Landslides”, Proceedings of the 1st Italian Workshop on Landslides, Naples, Italy, 8–10 June 2009. [Google Scholar]
- Damiano, E.; Greco, R.; Guida, G.; Olivares, L.; Picarelli, L. Investigation on rainwater infiltration into layered shallow covers in pyroclastic soils and its effect on slope stability. Eng. Geol. 2017, 220, 208–218. [Google Scholar] [CrossRef]
- Simunek, J.; Van Genuchten, M.; Sejna, M. Recent Developments and Applications of the HYDRUS Computer Software Packages. Vadose Zone J. 2013, 15, 1–25. [Google Scholar]
Figure 1.
Localization and geomorphological context of the study area: (a) national and regional frameworks (Campania region in Southern Italy); (b) slope map; (c) thickness map.
Figure 1.
Localization and geomorphological context of the study area: (a) national and regional frameworks (Campania region in Southern Italy); (b) slope map; (c) thickness map.

Figure 2.
Evolution of antecedent meteorological conditions recorded within the study area during the landslide hydrological year: (a) daily precipitation and cumulative precipitation; (b) daily reference evaporation and cumulative reference evaporation.
Figure 2.
Evolution of antecedent meteorological conditions recorded within the study area during the landslide hydrological year: (a) daily precipitation and cumulative precipitation; (b) daily reference evaporation and cumulative reference evaporation.

Figure 3.
Grain size distribution of soils constituting pyroclastic soil cover.

Figure 4.
Material hydraulic properties assessed by means of physical model of lysimeter: (a) soil-water characteristic curve (SWCC); (b) hydraulic conductivity function (modified by Reder et al. [34]).
Figure 4.
Material hydraulic properties assessed by means of physical model of lysimeter: (a) soil-water characteristic curve (SWCC); (b) hydraulic conductivity function (modified by Reder et al. [34]).

Figure 5.
Model of the domain considered for: (a) set A analysis—only (constant) critical rainfall acts at the upper surface; seepage surface is applied at the bottom boundary; (b) set B analysis—the antecedent meteorological evolution (recorded by a weather station) and the reference evaporative fluxes (computed according to FAO guidelines) act at the upper surface from 1st September 2004 to 3rd March 2005; then critical rainfall starts. Surface seepage is still applied at the bottom boundary.

Figure 6.
Final part of the rainfall history applied in analyses of set B, C, and D (1st December 2004–3rd March 2005).
Figure 6.
Final part of the rainfall history applied in analyses of set B, C, and D (1st December 2004–3rd March 2005).

Figure 7.
Results of set A analyses: (a) suction evolution for four different domain thicknesses induced by critical events; (b) critical duration against domain thickness.
Figure 7.
Results of set A analyses: (a) suction evolution for four different domain thicknesses induced by critical events; (b) critical duration against domain thickness.

Figure 8.
Results of set B analyses: suction distributions computed for four different initial suction values: (a) domain s1.5 = 1.5 m; (b) domain s4 = 4 m.
Figure 8.
Results of set B analyses: suction distributions computed for four different initial suction values: (a) domain s1.5 = 1.5 m; (b) domain s4 = 4 m.

Figure 9.
Results of set B analyses: suction evolution computed for four domain thicknesses si and initial suction values of: (a) suB0 = 20 kPa, (b) suB0 = 35 kPa, (c) suB0 = 50 kPa and (d) suB0 = 70 kPa.
Figure 9.
Results of set B analyses: suction evolution computed for four domain thicknesses si and initial suction values of: (a) suB0 = 20 kPa, (b) suB0 = 35 kPa, (c) suB0 = 50 kPa and (d) suB0 = 70 kPa.

Figure 10.
Results of set B analyses: critical duration against domain thickness computed for four different initial suction values.
Figure 10.
Results of set B analyses: critical duration against domain thickness computed for four different initial suction values.

Figure 11.
Results of set C analyses: critical duration against domain thickness for three different values of hydraulic conductivity at saturation (suB0 = 20 kPa).
Figure 11.
Results of set C analyses: critical duration against domain thickness for three different values of hydraulic conductivity at saturation (suB0 = 20 kPa).

Figure 12.
Results of set D analyses: suction distributions computed for two different initial suction values, at the end of the antecedent period defined by backdating the critical event on 1st January 2005: (a) domain s1.5 = 1.5 m; (b) domain s4 = 4 m.
Figure 12.
Results of set D analyses: suction distributions computed for two different initial suction values, at the end of the antecedent period defined by backdating the critical event on 1st January 2005: (a) domain s1.5 = 1.5 m; (b) domain s4 = 4 m.

Figure 13.
Results of set D analyses: backdated critical duration against domain thickness for two different initial suction values.
Figure 13.
Results of set D analyses: backdated critical duration against domain thickness for two different initial suction values.

Figure 14.
Results of set B analyses: critical duration against subdomain thickness computed for suB0 = 70 kPa.
Figure 14.
Results of set B analyses: critical duration against subdomain thickness computed for suB0 = 70 kPa.

Figure 15.
Results of set B analyses: temporary suction distribution computed for suB0 =70; (a) domain s1.5 = 1.5 m; (b) domain s4 = 4 m.
Figure 15.
Results of set B analyses: temporary suction distribution computed for suB0 =70; (a) domain s1.5 = 1.5 m; (b) domain s4 = 4 m.

© 2020 by the authors. Licensee MDPI, Basel, Switzerland. This article is an open access article distributed under the terms and conditions of the Creative Commons Attribution (CC BY) license (http://creativecommons.org/licenses/by/4.0/).
Share and Cite
MDPI and ACS Style
Coppola, L.; Reder, A.; Rianna, G.; Pagano, L. The Role of Cover Thickness in the Rainfall-Induced Landslides of Nocera Inferiore 2005. Geosciences 2020, 10, 228. https://doi.org/10.3390/geosciences10060228
AMA Style
Coppola L, Reder A, Rianna G, Pagano L. The Role of Cover Thickness in the Rainfall-Induced Landslides of Nocera Inferiore 2005. Geosciences. 2020; 10(6):228. https://doi.org/10.3390/geosciences10060228
Chicago/Turabian StyleCoppola, Lucia, Alfredo Reder, Guido Rianna, and Luca Pagano. 2020. "The Role of Cover Thickness in the Rainfall-Induced Landslides of Nocera Inferiore 2005" Geosciences 10, no. 6: 228. https://doi.org/10.3390/geosciences10060228
Note that from the first issue of 2016, this journal uses article numbers instead of page numbers. See further details here.