Article

Storm-Related Rhodolith Deposits from the Upper Pleistocene and Recycled Coastal Holocene on Sal Island (Cabo Verde Archipelago)

by
Markes E. Johnson
1,*,
Ricardo Ramalho
2,3,4,5 and
Carlos Marques da Silva
2,3
1
Department of Geosciences, Williams College, Williamstown, MA 01267, USA
2
Instituto Dom Luiz, Faculdade de Ciências, Universidade de Lisbon, 1749-016 Lisbon, Portugal
3
Departamento de Geologia, Faculdade de Ciências, Universidade de Lisbon, 1749-016 Lisbon, Portugal
4
School of Earth Sciences, University of Bristol, Wills Memorial Building, Queen’s Road, Bristol BS8 1RJ, UK
5
Lamont-Doherty Earth Observatory, Columbia University, Comer Geochemistry Building, P.O. Box 1000, Palisades, NY 10964, USA
*
Author to whom correspondence should be addressed.
Geosciences 2020, 10(11), 419; https://doi.org/10.3390/geosciences10110419
Submission received: 29 September 2020 / Revised: 15 October 2020 / Accepted: 21 October 2020 / Published: 23 October 2020
(This article belongs to the Special Issue Geomorphological and Sedimentological Imprints of Storm Events)

Abstract

:
This project examines the role of tropical storms in the northeast Atlantic Ocean related to the post-mortem deposition of rhodoliths in coastal settings during Neogene to Holocene time with primary emphasis on Sal Island in the Cabo Verde Archipelago located 600 km off the coast of Senegal in northwest Africa. Fossil rhodoliths from 10 to 15 cm in diameter are equal in size to contemporary rhodoliths that survive for a century or more at water depths undisturbed by all but the most energetic storms. The shape of large rhodoliths makes them susceptible to rare disturbances with sufficient energy to export them beyond their preferred habitat into extreme environments that include supratidal settings. The methodology of this study gauges the relative sphericity of rhodoliths based on measurements across three axes perpendicular to one another, plots size variations on bar graphs, and considers whether or not individual nodules are nucleated around rock cores eroded from proximal rocky shores. Sal Island is impacted on a steady basis by wave swell generated from the Northeast Trade Winds, but Pleistocene and Holocene deposits with large rhodoliths on the Island’s windward coast are interpreted as the result of major storms of hurricane intensity. Comparison of Sal Island rhodoliths with Pliocene and Miocene examples from other insular localities in the Northeast Atlantic considers evidence for displacement of the Inter-Tropical Convergence Zone (ITCZ) into more northern latitudes as an influence on past hurricane tracks that are less common today.

1. Introduction

Rhodoliths are free-rolling nodules formed by coralline red algae. These algae secrete high-magnesium calcite in their cell walls in a concentric pattern of outward growth expressed by surface crustose growth or as radial branches resulting in nodules of spheroidal to ellipsoidal shape. Fifty-nine genera currently recognized in the subclass Corallinophycidae within the division Rhodophyta trace an evolutionary history back to the early Cretaceous [1]. Global in distribution on oceanic shelves bordering many coastlines, the latitudinal range of rhodoliths extends from places as distant as New Zealand in the southern hemisphere to Spitsbergen in the northern hemisphere [2]. Penetration of sunlight through marine water is the primary limiting factor to the sustainable growth of rhodoliths, although these have been found living at the limit or even slightly below the photic zone. Ranging in diameter between that of a large grape to that of a large grapefruit, live rhodoliths occur in high concentrations of stony thalli blanketing the sea floor at water depths less than a meter deep around One Tree and Lizard islands on Australia’s Great Barrier Reef [3], between a couple meters in the Gulf of California [4] and 110 m on the Abrolhos Bank off Brazil [5]. Whereas light in the red spectrum is limited to shallow depths of only a few meters, sufficient sunlight for growth in the blue to purple spectrum of wave lengths reaches water depths in exceptionally clear water characteristic of the Abrolhos Bank.
Unlike other marine algae anchored to the sea floor by holdfasts, unattached rhodoliths are vulnerable to storm events due to their sub-spherical shape. Rhodoliths living at water depths below storm-wave base that often include ellipsoidal and discoidal forms are immune to changing weather conditions at the surface, but are more commonly subject to bioturbation by a variety of demersal fish and other benthic marine animals that co-habit the eco-space on rhodolith banks [6]. Rare water movements due to tidal currents [7] as well as tsunamis have the potential to transport rhodoliths living in deeper habitable depths. The rhodoliths from deep waters are more prone to extreme transport outside their normal habitat due to hurricanes driven by unusually strong surface winds. In contrast, rhodoliths living in shallow water are subject to gentle rotation on almost a daily basis by normal surface waves and bottom currents as well as greater disruptions due to hurricanes. Miocene rhodoliths from the Apennines of Italy analysed with co-occurring trace fossils also indicate re-depositon from shallower waters into deeper waters [8]. In principle, the larger any given fossil rhodolith, the longer it is believed to have lived prior to death and fossilization. However, growth may be discontinuous and cease altogether for a particular species of coralline red algae, before the same nodule is newly encrusted by the same or different species. Growth rates among different rhodolith-forming species of coralline red algae vary between 0.01 to 0.68 mm yr−1, according to a summary of 28 studies looking at 11 species arrayed among seven genera [9]. Among the highest recorded growth patterns, Lithothamnium crassiusculum from the Gulf of California yielded a rate of 0.6 mm yr−1 from a specimen with a radius in excess of 6 cm, suggesting an age span of more than 100 years [10]. Hypothetically, large rhodoliths may persist undisturbed in offshore waters for as much as a century before succumbing to wave action of super-storms capable of sweeping them ashore. In contrast, smaller rhodoliths may grow over a short time span, before being repeatedly disturbed and cast ashore by storms of lesser intensity.
Living rhodoliths are especially abundant on the insular shelves around many of the volcanic islands clustered in the Cabo Verde, Canary, Madeira, and Azores archipelagoes, where oceanographic and environmental conditions are unfavorable to coral growth [11]. Hence, the coastal areas of these islands offer a dynamic laboratory for study of beaches, supratidal berms, and sand dunes directly related to the onshore mobilization and post-mortem disintegration of substantial rhodolith deposits. Studies based on Miocene to Pliocene deposits that demonstrate offshore to onshore transport of rhodoliths include those from São Nicolau in the Cabo Verde Islands [12], Ilhéu de Cima off Porto Santo in Madeira [13,14], and Santa Maria Island in the Azores [15], as well as mainland Portugal [16]. Individual rhodolith fossils from deposits in these places vary in diameter between one or two centimeters to a maximum of 20 cm as recorded on Ilhéu de Cima [13]. Within the Cabo Verde Archipelago, an outstanding example of a supratidal rhodolith deposit is from the Holocene on Maio Island, where an over-wash deposit sits one meter above mean sea level and covers a surface area of 27,000 m2 with an average density of 450 rhodoliths/m2 [17].
Foremost, the goal of this contribution is to show how the growth profile of Sal Island rhodoliths lends insight on the relative intensity of storms that led to their final deposition. Rhodoliths sampled from Pleistocene and Holocene deposits at Baía da Parda and Praia das Gatas which constitute shallow-water in bays on the exposed windward shore of Sal Island are the main materials for this analysis. The overall shape, size, state of preservation, and nucleation origin of individual rhodoliths can be compared among deposits and to those from the Holocene drape deposit on Maio Island [17]. Such details reflect on the internal growth profile of rhodoliths and their end story with respect to the relative intensity of storms that led to their final deposition. The secondary objective aims to highlight patterns of long-term atmospheric circulation and storm dynamics in the region through Neogene time. To this end, Sal Island Pleistocene and Holocene rhodoliths are compared with older Pliocene and Miocene rhodoliths farther afield in the Cabo Verde Archipelago and neighboring islands in the northeast Atlantic Ocean [12,13,14,15] as well as mainland Portugal [16] in order to underscore features that are peculiar to Sal Island.

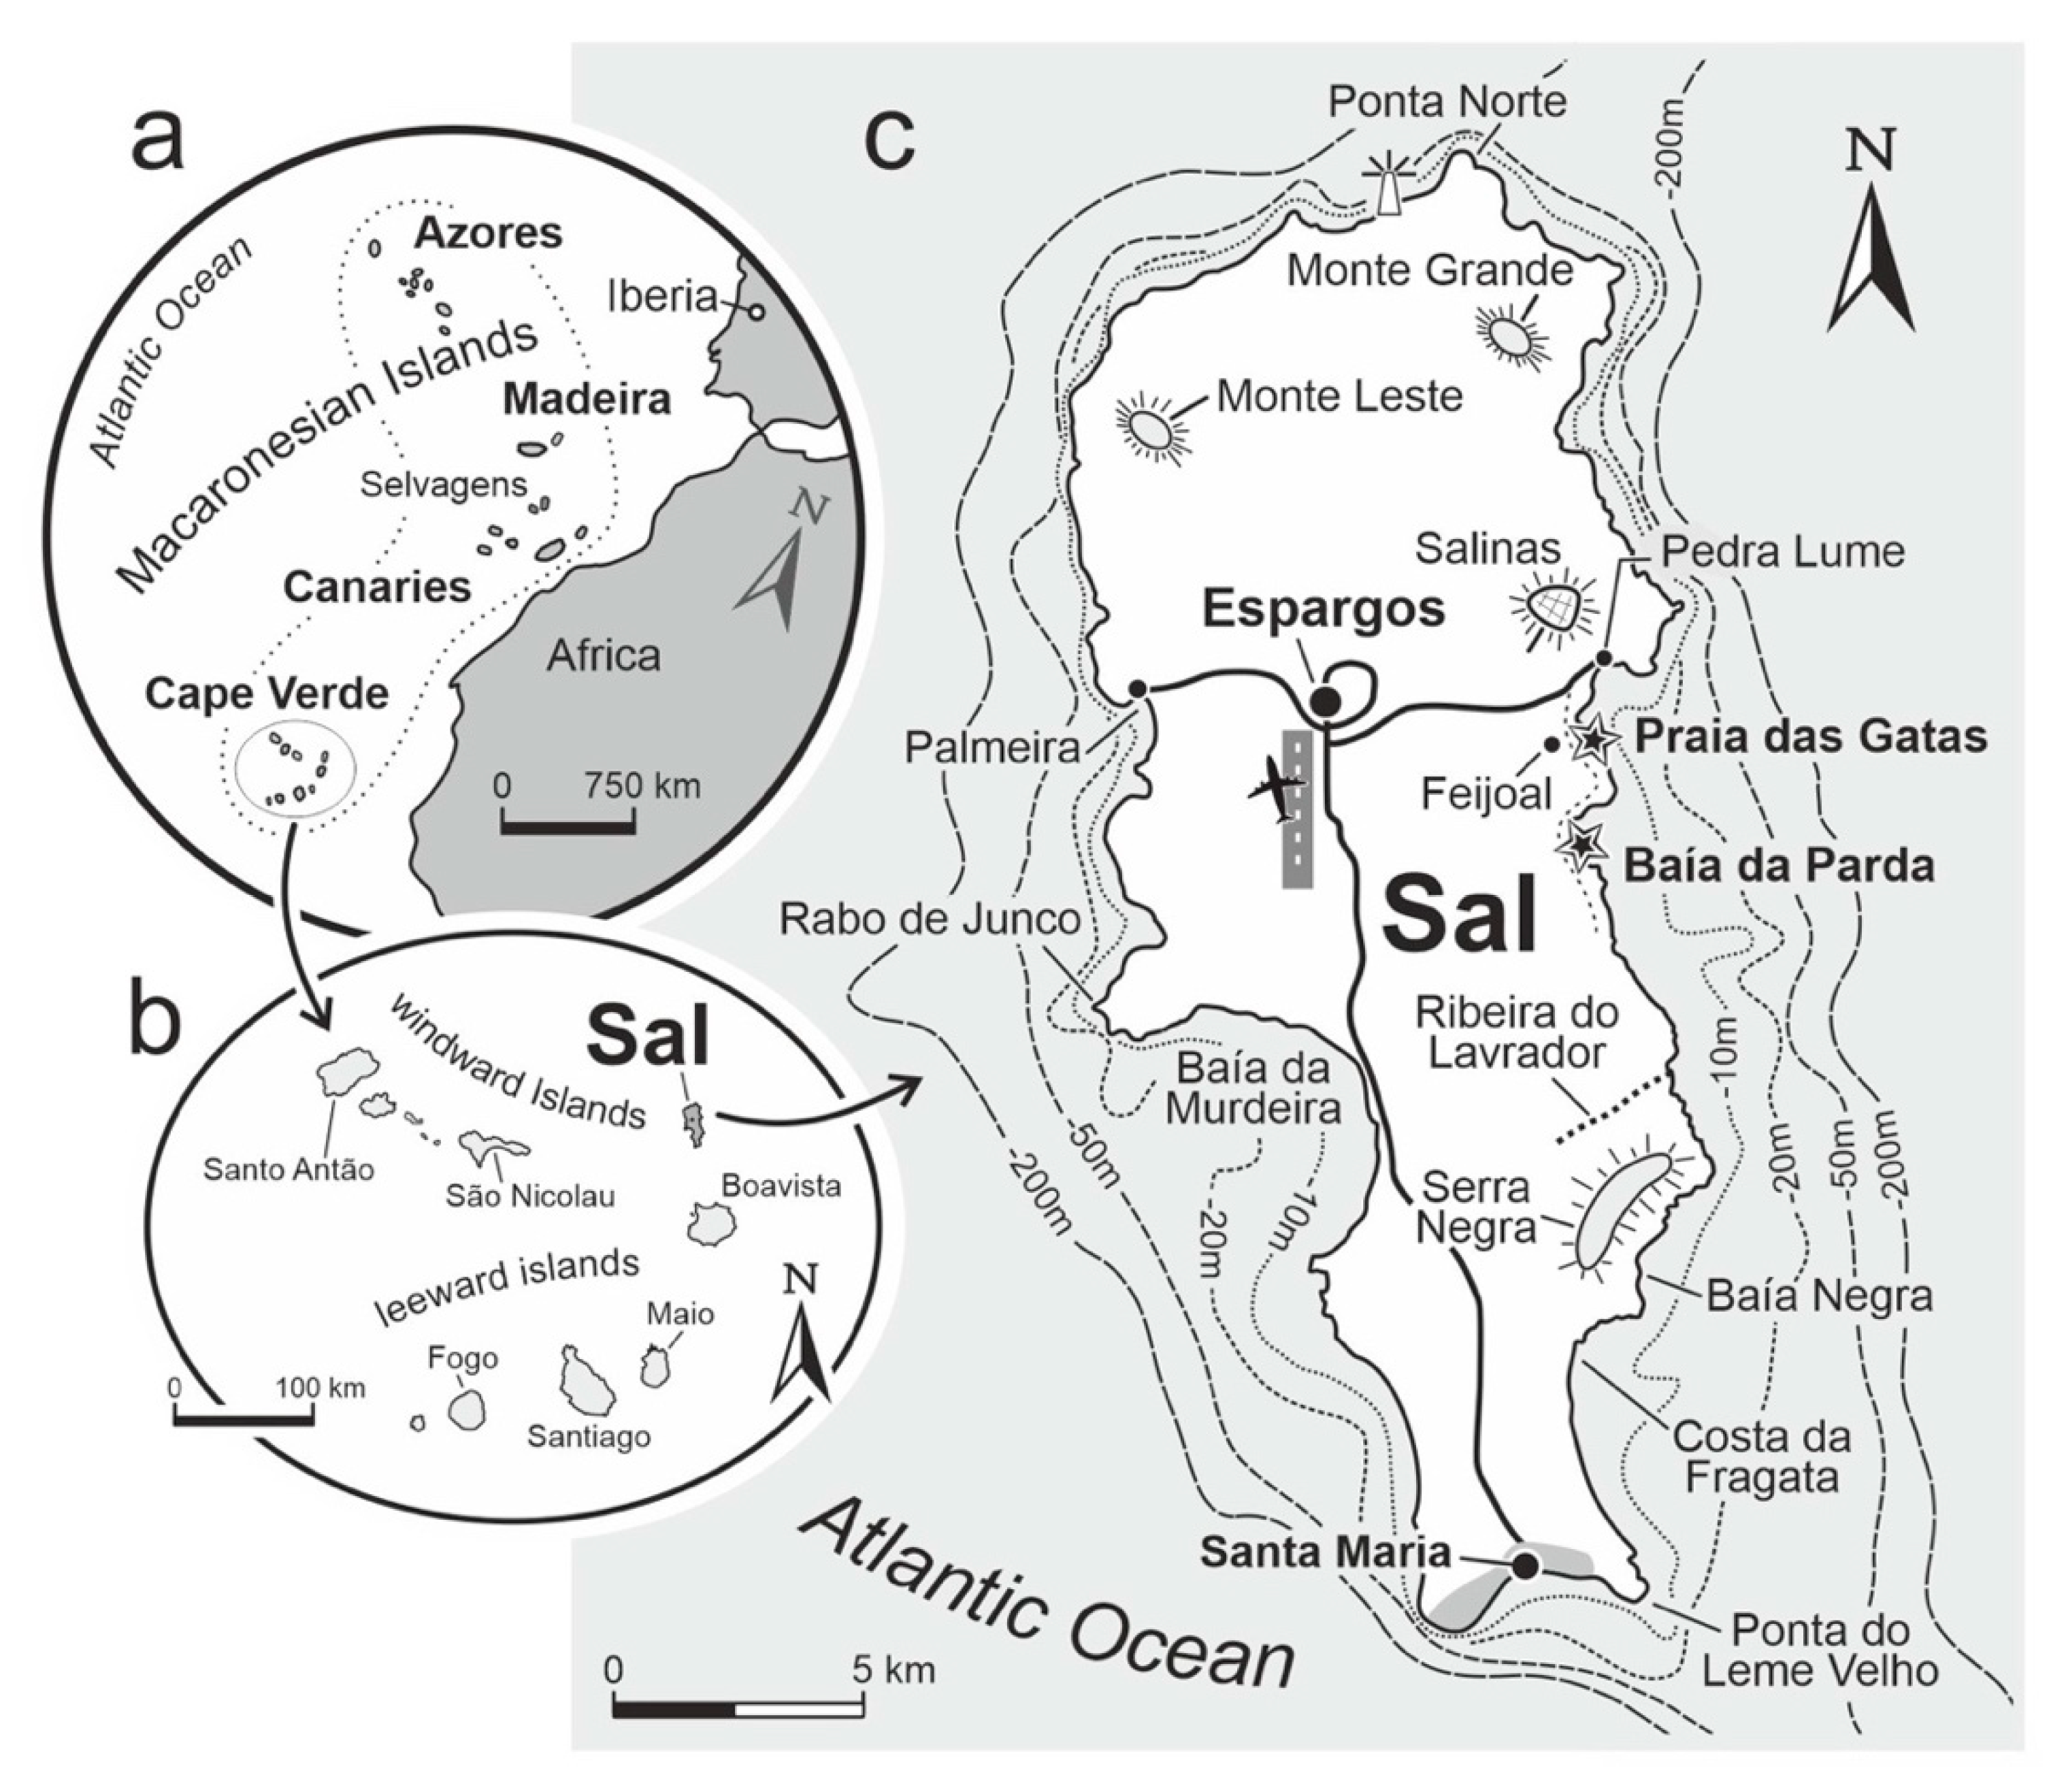
2. Geographical and Geological Setting

The Cabo Verde Archipelago is the most southern of several volcanic archipelagos that extend from the Azores at a latitude bordering N 40° approximately 1500 km due west of Portugal to the leeward islands of Cabo Verde at a latitude bordering 15° N (Figure 1a). Sal is one of the windward islands in the northern sector of the archipelago, which sits 600 km west of Senegal off the northwest coast of Africa (Figure 1b). It is the smallest of the populated islands in the group [18] with an area of 216 km2, circumference of 83 km, and maximum elevation of 406 m (Figure 1c). The island occupies a basalt core complex that dates to 26 Ma [19] and the enclosing 50-m isobath approaches nearest to the north end, where strong surf erodes the rocky coast due to direct impact of the persistent northeast trade winds as well as strong North Atlantic swell from the northwest [20]. The Northeast Trade Winds reaching Sal from the Canary Islands commonly register 5 to 6 on the Beaufort Scale, equivalent to speeds between 10.5 and 48.3 m/s (= 38 to 48.3 km/h) [21] and capable of generating surface swells with an amplitude of 3.5 m. Unimpeded by low topography, the trade winds sweep over Sal from a northeasterly direction and deflate carbonate-rich beach sand to form a succession of small dunes that climb through narrow valleys such as the Ribeira do Lavrador (Figure 1c), enriched from 50 to 67% in grains derived from crushed rhodoliths [11]. Except for the rugged northern shores of the island, fossil and present-day rhodoliths are found to occur along all other shores around the island. The focus of this study, however, is on the larger rhodoliths from the windward east coast.

3. Materials and Methods

Sampled at random, whole rhodoliths from deposits at two localities were measured (to the nearest half centimeter) across three principal axes (long, intermediate, and short). Both localities are on the east shore of Sal Island and differ in origin from consolidated (cemented) as opposed to unconsolidated (loose) deposits. Data from measurements were subject to analysis based on triangular plots among spherical, ellipsoidal, and discoidal shapes according to the standard format applied to rhodoliths by Bosence (1976, 1983) [22,23] as modified from Sneed and Folk (1958) [24]. In addition, these data are fitted to bar graphs to show variations in rhodolith size based on length of the long and intermediate axes correlated to the Wentworth scale for sedimentary particles in the range of pebbles and cobbles [25]. The volume of each fossil rhodolith was calculated applying the radius from the intermediate axis to the standard equation for the volume of a sphere. Few rhodoliths express the morphology of a perfect sphere, and hence the radius taken as half of the intermediate axis was used to calculate the average volume for a given rhodolith. As it was not possible to record the weight of fossil rhodolith in the field, a substitute method was applied to estimate weight. Dolomite density representative of high-magnesium carbonate was taken as 2.6 g/cm3 [26] and this value was applied to calculate weight based on rhodolith volume. Moreover, consideration is given to the wave intensity necessary to dislodge rhodoliths from a binding limestone under storm conditions. After obtaining field measurements, each rhodolith was broken open in order to check for possible nucleation around extraneous shells or shell fragments as opposed to basalt pebbles or cobbles. Potentially, an internal basalt cobble or pebble would have the effect of increasing the overall mass of the rhodolith due to the additional density of the basaltic core at about 3.0+ g/cm3. Any increase in overall density related to nucleation of a given rhodolith around a basalt pebble or cobble will increase the wave energy required to move it.

4. Results

4.1. Upper Pleistocene Deposit on Baía da Parda

The base map for Sal Island (Figure 1c) identifies the principal localities at Baía da Parda where the data from rhodoliths in a consolidated Pleistocene deposit and those from a loose aggregate at Praia das Gatas (in English: Beach of the Nurse Sharks), were collected, respectively. Low sea cliffs extend for approximately 2 km south from the headland bordering Baia da Parda, where rhodolithic limestone typically protrudes seaward with wave-eroded overhangs between 1 and 1.5 m above mean sea level (Figure 2). Based on 234U/238U dating of the fossil coral Siderastrea radians at Baía Parda [27], an age of 130.4 ± 1.4 ka falls within the range of Marine Isotope Substage 5(e), or the last interglacial interval before the present. A succession of other terraces at Serra Negra (Figure 1c) indicates that Sal Island underwent episodes of uplift beginning in earlier Pleistocene time [28]. However, upper Pleistocene deposits similarly rich in fossil rhodoliths occur at the shoreline as far south as Costa da Fragata [11].
Exposure of the same limestone strata extending a short distance south, but still within Baía da Parda offers a closer view of the dissected rhodolith deposit sitting unconformably on an unconformity above a basalt cobble base (Figure 3). Scattered basaltic pebbles occur cemented in place by a lime-rich matrix that binds the rhodoliths together, forming a dense algal conglomerate in pockets. Where naturally broken, very few rhodoliths reveal a basaltic pebble at the core. Cementation is relatively weak and individual rhodoliths are easily extracted from the matrix. The outer surface of individual rhodoliths is worn almost smooth, but reveals lumpy growth typical of species in the genus Lithothamnium. Internally, rhodolith growth in this case is the result of algal branches tightly pressed together in an outwardly expanding pattern.

4.2. Upper Pleistocene Deposit at Praia das Gatas

Beginning south from the cross-island paved road between Palmeira and Salinas (Figure 1c), a dirt road along the east shore runs parallel to the coast, where a small patch of Upper Pleistocene limestone equated with the unconformity at Baía da Parda is exposed in the present-day intertidal zone (Figure 4a). On closer view (Figure 4b), the patch is shown to consist of a single layer of welded rhodoliths sitting directly on a surface of basalt conglomerate. Like those at Baía da Parda, the rhodoliths are degraded by wear that smooths the lumpy surface texture typical of coralline red algae in the genus Lithothamnium. The patchy deposit also incorporates whole and broken shells belonging to the tropical conch, Thetystrombus latus (Gmelin, 1791) [29]. Some of the smaller shells are complete, but other larger shells are broken, revealing the shell’s internal spire structure.

4.3. Configuration of Holocene Supratidal Deposit at Praia das Gatas

At Praia das Gatas, a massive deposit of unconsolidated rhodoliths extends along the shore for a distance of about 75 m (Figure 5). The seaward sloping deposit occupies a supratidal zone variably 4 to 6 m in width and immediately adjacent to the intertidal zone occupied entirely by basalt boulders. Few basalt clasts are incorporated within the rhodolith deposit, which also includes broken shells belonging to the large conch, Thetystrombus latus.
In closer view (Figure 6), the loosely aggregated rhodoliths from this deposit resemble the worn Pleistocene rhodoliths exposed in the intertidal zone immediately to the north and the far more substantial limestone at Baía da Parda farther to the south. The condition of individual rhodoliths exhibits exterior smoothing by abrasion against neighboring rhodoliths under surf conditions. The surface density of rhodoliths varies from 430 to 480/m2 based on counts that frame sample grids marked off by the corners of a folding meter stick.

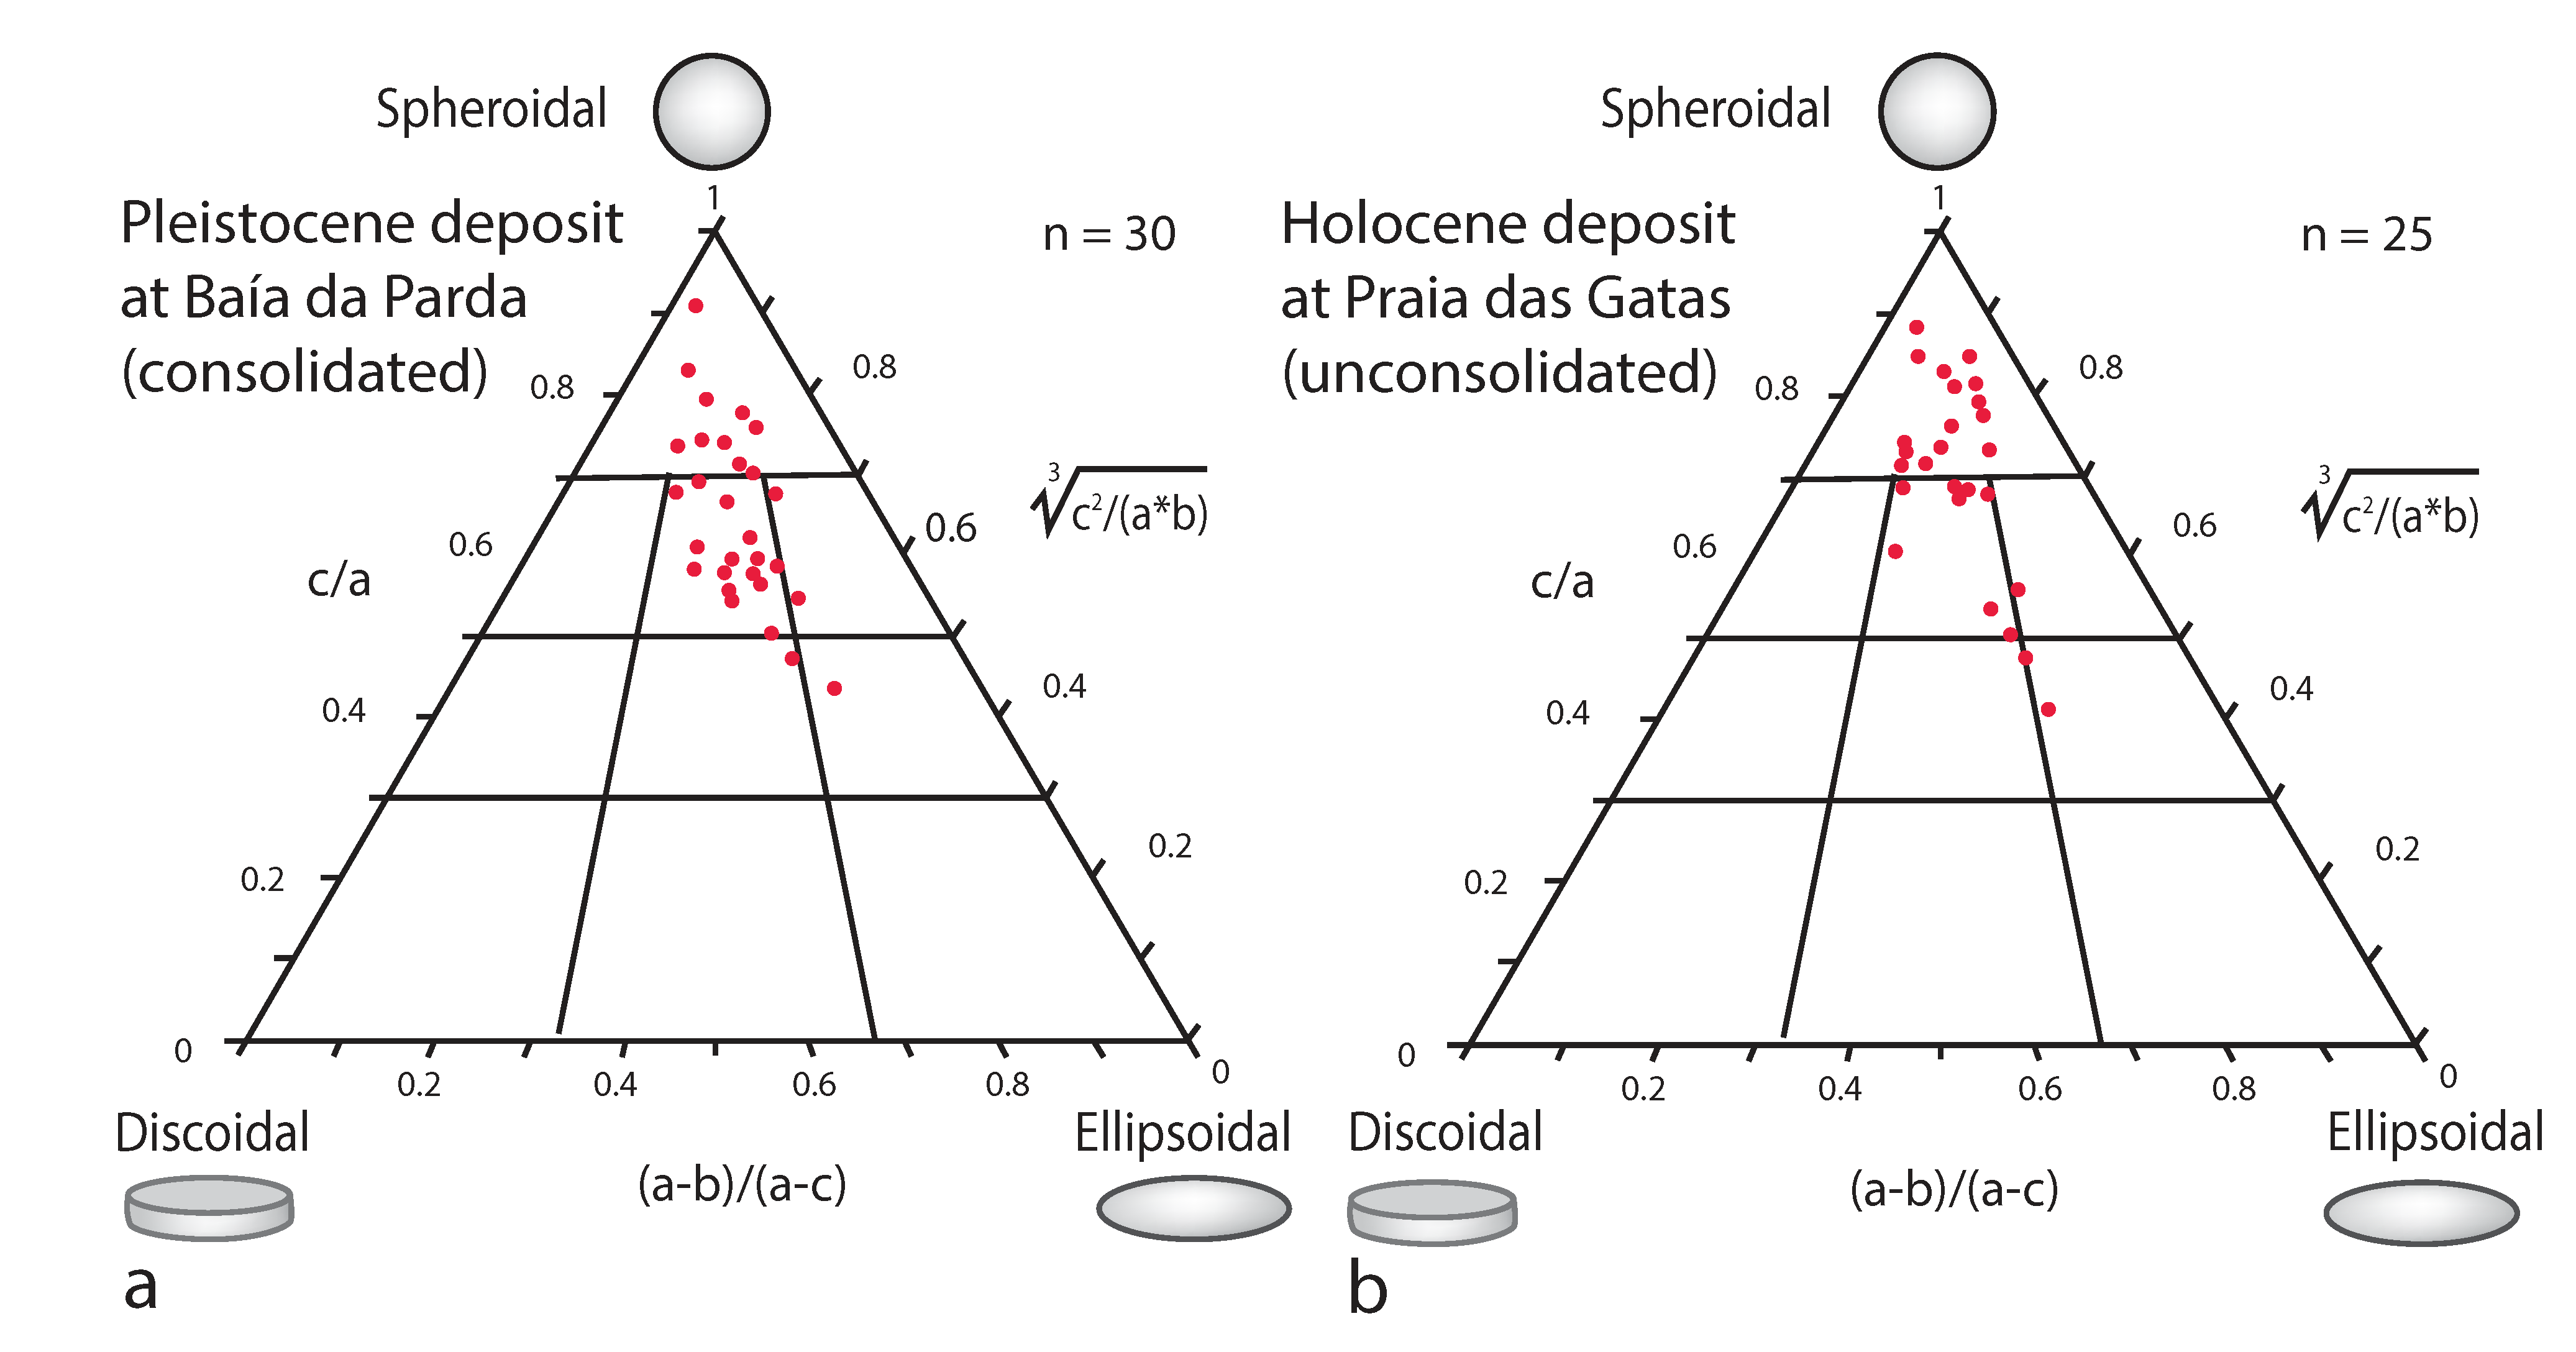
4.4. Comparative Variations in Rhodolith Shape

Raw data on rhodolith size collected from the sample sites at Baía da Parda and Praia das Gatas are listed in Appendix A (Table A1 and Table A2). With regard to shape, individual points representing individual rhodoliths are plotted on a set of Sneed-Folk triangular diagrams (Figure 7a,b). The spread of points compared in the two plots demonstrates a high degree of similarity in the variation of shapes between those localities. Points that fall into the top triangle represent the most spherical in shape. Thirty percent of rhodoliths sampled from the Pleistocene limestone fall into this category (Figure 7a), whereas the majority of points fall within the central part of the tier below the upper triangle. Points clustered around the core of the greater triangular represent rhodoliths for which two of the three dimensions are close in value. A few points fall into the right side of the plot, which signifies a tendency toward development of more ellipsoidal or spindle-shaped rhodoliths. The composite slope of points suggests a slightly diagonal trend, although the majority of points cluster vertically within the two central boxes. There is a total absence of points within the left side of the triangular diagram. At 60%, a higher percentage of rhodoliths sampled from the Holocene deposit at Praia das Gatas fall into the upper-most triangle of the Sneed-Folk diagram (Figure 7b), whereas a clear minority appear in the next tier directly below. As found in the Pleistocene sample (Figure 7a), very few rhodoliths from the unconsolidated Holocene deposit appear in the right side of the plot, and there are no points at all in the lower left part of the diagram (Figure 7b). The overall cluster of loose rhodoliths from the Holocene deposit is more diffuse than found in the Pleistocene sample, but also indicates a slightly diagonal tendency toward ellipsoidal shapes.

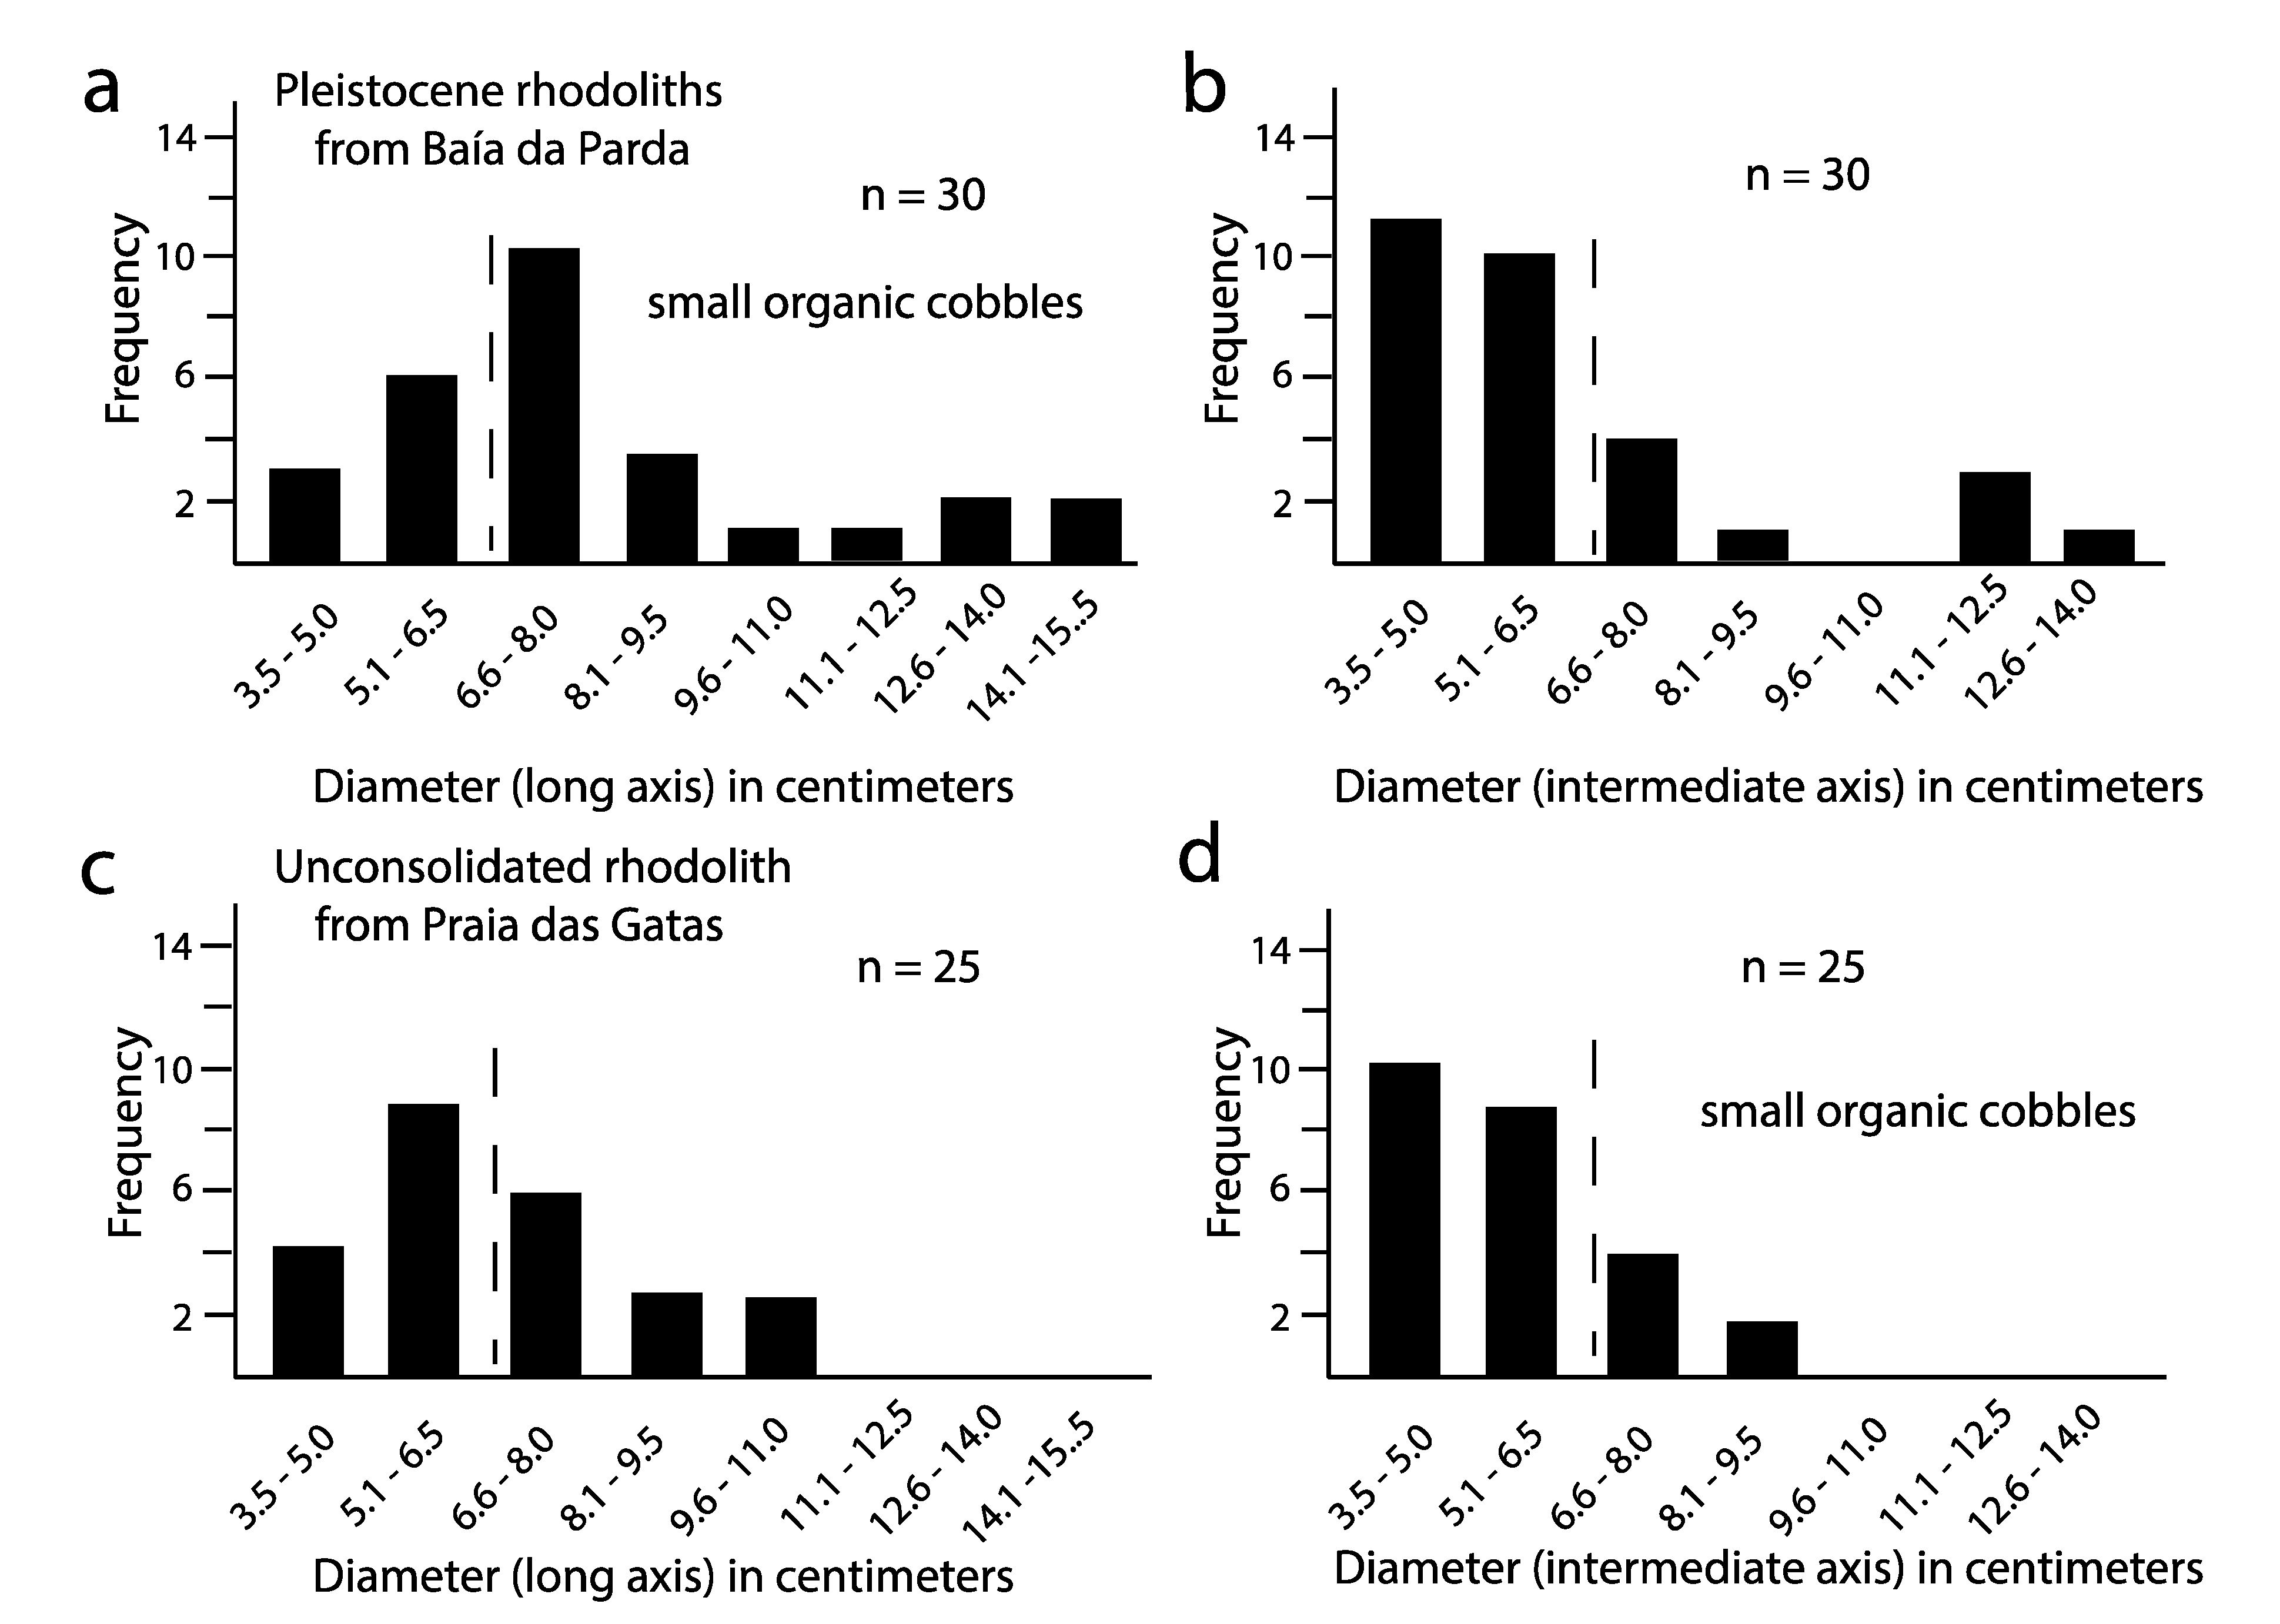
4.5. Comparative Variations in Rhodolith Size

Rhodolith size is conveniently plotted on bar graphs as a function of maximum and intermediate diameters drawn from the original data (Table A1 and Table A2). The results for field samples from the Pleistocene of Baía da Parda (Figure 8a,b) and Holocene of Praia das Gatas (Figure 8c,d) are related according to size at 1.5-cm intervals, within pebble and cobble size rhodoliths. By convention, pebbles are defined as exhibiting a range in diameter between 0.4 and 6.4 mm, whereas cobbles belong to the next larger category between 6.4 and 256 mm with boulders following thereafter [21]. The highest proportion of rhodoliths registered according to long axis (Figure 8a) falls into the interval with a diameter between 6.6 and 8.0 mm signifying small cobbles; however, data derived from the intermediate axes of the same rhodoliths indicates a downward shift in the largest proportion to a category in the range of large pebbles. On the whole, the size of the sampled Pleistocene rhodoliths may be characterized as bordering between large pebbles and small cobbles, but includes outliers with a few exceptionally large specimens attaining diameters as much as much as 13 and 15 cm. In contrast, the highest proportion of rhodoliths from the Holocene deposit based on the long axis (Figure 8c) falls below the threshold for cobbles and that proportion is even greater when measurements from the intermediate axes are taken into account (Figure 8d). Variations in samples from the two collections are most striking when contrasted with respect to measurements derived from the long axes of the respective rhodolith deposits (Figure 8a,c). More than two-thirds of the Pleistocene rhodoliths qualify as small cobbles, whereas less than half of those from the Holocene deposit meet the same standard. On the whole, the sample drawn from the Holocene deposit reflects a somewhat smaller range in size with no exceptionally large specimens greater than 11 cm in diameter.

4.6. Rhodolith Nucleation

Among the sampled rhodoliths from the Pleistocene limestone on Baía da Parda, a single rhodolith was found to be nucleated around a basaltic pebble and another was found to have formed around a visible shell fragment (Table A1). No evidence of nucleation around basalt pebbles or recognizable shell fragments was detected among rhodoliths sampled from the Holocene deposit at Praia das Gatas (Table A2). Nucleation by coralline red algae is required before the rhodolith begins expansion in semi-spherical form, but may initiate around a sand particle not readily detected when the structure is broken open. Except for clear examples of nucleation around a shell fragment or basalt pebble, 96% of sampled rhodoliths from the two study sites initiated growth around small particles.

4.7. Storm Intensity as Function of Estimated Rhodolith Volume and Weight

The mean value of rhodolith dimensions (long, intermediate, and short axes), calculated volume and estimated weight from the two study samples collected from the exposed east coast of Sal Island are summarized in Table 1, allowing for direct comparisons across all categories.
In contrast, recorded values for the single, largest rhodolith in size (long, intermediate, and short axes), calculated volume and estimated weight from the same two samples are featured in Table 2. A comparison between Table 1 and Table 2 brings into question the level of wave energy necessary to shift the largest rhodolith in each sample from a more offshore position to a final resting place in a more onshore position.
Indeed, the largest single rhodolith drawn from the Pleistocene sample has a calculated volume 4.25 times as great as the average rhodolith from the same sample and an estimated weight 4.20 times as great. By comparison, the largest single rhodolith drawn from the Holocene sample has a calculated volume 3.25 times as great as the average rhodolith from the same sample and an estimated weight 3.3 times as great. Accumulation of rhodoliths in such evident concentrations are peculiar to each locality and dependent on a depositional model that best fits those circumstances, respectively.

5. Discussion

5.1. Pleistocene and Holocene Depositional Models

The processes responsible for accumulation of Pleistocene and Holocene rhodoliths on the windward shores of Sal Island share certain aspects. The most striking is the relationship of organic cobble-size nodules left adjacent to or directly on top of basaltic cobbles (Figure 3 and Figure 5). It is notable that broken rhodoliths from both deposits rarely if ever feature a basaltic core, and when that style of nucleation is evident, the basalt core is smaller than available cobbles in the underlying substrate. Another shared factor is the preponderance of highly spherical rhodoliths capable of rolling in any direction under the influence of water turbulence (Figure 7a,b). The third and most distinctive aspect is the degree to which individual rhodoliths from Pleistocene and Holocene deposits are worn as a consequence of contact abrasion. It is instructive to compare the Sal Island rhodoliths with those from the supratidal deposit on Maio Island, found to cover an area of 27,000 m2 with roughly 25 million rhodoliths characterized by highly spherical shapes between 10 cm to 20 cm in diameter [17]. The primary difference registered by the Maio deposit is its inclusion of individual nodules with lumpy surfaces that are relatively fresh, although the overall concentration of rhodoliths per unit surface area is similar to deposits on Sal Island. Like the Sal rhodoliths, those from Maio Island lack basalt cores. A unique aspect of the Maio deposit features a sample nucleated around a worn fragment of ceramic shard, which places the deposit in the context of historical time. The hallmark of the Maio deposit appears to be a single storm event of hurricane or near-hurricane strength that swept large rhodoliths ashore with minimal degradation of surface features.
By observation of tidal flux, the loose rhodoliths at Praia das Gatas signify a massive supratidal deposit out of range of normal tides (Figure 5 and Figure 6). Rhodoliths from the better exposed Pleistocene deposit at Baía da Parda (Figure 2 and Figure 3) and more patchy exposure at Praia das Gatas (Figure 4a,b) differ only in the amount of carbonate matrix present. Pockets of matrix at Baía da Parda are interpreted as lime mud produced as a consequence of rhodolith abrasion. Another difference between the Pleistocene and Holocene deposits is the smaller average size range of the rhodoliths in the Holocene sample (Table 1). Because few of the Pleistocene rhodoliths and none of the Holocene rhodoliths possess a basalt core, they are sure to have accreted in an offshore setting where basalt pebbles or cobbles were mostly unavailable for nucleation. The largest rhodoliths from both deposits imply accretion over a long-time span in deeper waters normally unaffected by storms. The Pleistocene deposit cannot be interpreted as a supratidal deposit, because prior to cementation, the lime mud was more likely to be removed by the back swash of retreating waves. All factors considered, the depositional model for Pleistocene rhodoliths on the east shore points to a shallow, subtidal environment (similar to today) in a zone of rapid accumulation where surface degradation of rhodoliths was intense for a protracted period of time causing algal growth to cease. In terminology commonly applied to fossil deposits, the Pleistocene rhodoliths are attributed to a death assemblage (thanatocoenoses) marked by shoreward transport from a deeper-water habitat where they previously thrived undisturbed for as much as 100 years based on established growth rates [9,10].

5.2. Direction of Storm Impact

According to conch divers on Sal Island interviewed in March 2013 [11], large rhodoliths commonly occur as far offshore as three or more kilometers at a water depth around 40 m. Tropical cyclonic storms tracking northward between the African mainland and Sal Island would move in a direction contrary to the Northeast Trade Winds for a brief time, causing ocean swells greater than an amplitude of 3.5 m normally associated with the trade winds. The occurrence of such storms is rare and in terms of human record-keeping might be regarded as a once-in-a-century event, which corresponds to the age estimates of the longest-lived rhodoliths. Transport from deeper, offshore waters to shallow coastal waters over a distance of a few kilometers is unlikely to happen during a single super storm, but could bring larger rhodoliths to an intermediate position where lesser storms happening with greater frequency would roll those rhodoliths closer to shore. Once established as a deposit in shallower waters, these large rhodoliths were further subjected to the normal coastal surf generated by persistent Northeast Trade Winds, thereby causing post-mortem abrasion.
A different model is employed to explain how slightly smaller rhodoliths in the Holocene deposit at Praia das Gatas were recycled from the adjacent Pleistocene deposit (Figure 4a,b) as a result of selective remobilization by wave conditions only moderately more energetic than those created by the Northeast Trade Winds. Applications of mathematical equations from Nott (2003) [30] are often used to estimate the required wave height for the detachment, lifting, and removal of boulder-size clasts from joint-bound layers on rocky shores under storm attack, but this methodology is unsuited for application to fossil rhodoliths cemented in place by carbonate matrix as exposed at Baía da Parda. Instead, wave action related to squalls on a repeating, multi-decadal basis could be responsible for forming Holocene rhodolith deposits all along the east shores of Sal Island, creating supratidal accumulations. Individual rhodoliths are certain to have worked free of enclosing Pleistocene strata that protrude over the intertidal zone on Baía da Parda (Figure 2), but those particular rhodoliths were unlikely to be exported outside the bay and transported northward to Praia das Gatas against longshore currents in concert with the prevailing Northeast Trade Winds. The intertidal Pleistocene deposit of rhodoliths at Praia das Gatas would have been sufficient in scope to supply all the reworked rhodoliths in the adjacent supratidal deposit.

5.3. Inference from Historical Storms

Storm activity in the Cabo Verde Archipelago at a latitude around 15° N is notorious for the initiation of hurricanes that typically form under conditions of unusually warm surface-water (26–27 °C) leading to cyclonal rotation of the overlying air mass. Storm tracks traced by these disturbances have been the subject of scrutiny ever since the start of weather prediction for busy shipping lanes [31] and an average September during the North Atlantic hurricane season may entail as many as a dozen disturbances that usually dissipate in the more central, extra-tropical regions of that ocean. Only a few achieve wind speeds of 119 km/h equivalent to a Category 1 hurricane or more according to the Saffir-Simpson Hurricane Wind Scale. The 2020 North Atlantic hurricane season got off to an unusual pre-season start in May with two tropical storms registering wind speeds between 63 and 118 km/h (Arthur and Bertha) and a record number of actual hurricanes (Hanna, Isaias, Laura, Marco, Nana, and Sally) crossed the Atlantic Ocean to North and Central America by September [32]. On 7 September 2020, Tropical Storm Rene brought strong winds and heavy rain to the northern islands of the Cabo Verde Archipelago, including Sal Island [32]. The disturbance subsequently intensified to a Category 1 hurricane while tracking northwest into the central North Atlantic. Subsequent systems have entered the Atlantic Ocean during this busy season to include tropical storms Teddy and Vicky. The historical record shows that very few hurricanes depart from the Cabo Verde region on a northerly track to reach the Madeira Islands and even mainland Portugal. As recently as October 2005, however, the passage of Hurricane Vince crossed Madeira as a Category 1 event and continued onward to the Iberian mainland as a weakened tropical depression. The rarity of such an event compares to a historical event of comparable intensity that struck the same region in October 1842, 163 years earlier [33]. Admittedly uncommon from a human perspective, development of Category 1 hurricanes at a frequency of one every 150 years over the last 10,000 years is potentially sufficient to disrupt the growth of large, semi-spherical rhodoliths accustomed to a habitat at water depths normally untouched by storms. Rare events in the context of a human lifetime take on a greater significance in the context of geologic time, during which even the most infrequent repetitions amount to substantial impacts on the seabed around islands in the northeast Atlantic Ocean.

5.4. Sal Island Rhodolith Deposits Compared to Others in the North Atlantic

Rhodoliths degraded as organic pebbles and cobbles are widely distributed around islands in the northeast Atlantic Ocean and can be correlated with aspects of coastal geomorphology pertinent to storms from the geologic past. The contrast between two examples of middle Miocene age from opposite shores on Ilhéu de Cima off Porto Santo in Madeira [13,14] are insightful. Both entail highly spherical rhodoliths with diameters between 10 and 20 cm. The basal rhodolith deposit at Cabeço das Laranjas has a maximum thickness of 2.6 m and occupies a rocky shelf with tall sea stacks preserved in three dimensions [13]. Some rhodoliths reveal small basalt cores, but most are without. The initial deposit is followed by three more rhodolith layers, all thin and all elevated above the unconformity surface indicative of a coastal transgression. The thick basal layer is interpreted as a major storm deposit transported shoreward from deeper water and left in a rocky-shore setting among sea stacks that acted as a baffle trapping the rhodoliths in place [13]. At Pedra de Água on the island’s opposite shore, a thin rhodlolith deposit sits on an unconformity among basalt mounds with low relief occupied by corals in growth position [14]. The surrounding rhodoliths are also interpreted as part of a biocenosis preserved under life conditions. In this case, all feature a large basalt core as much as 6.5 cm in diameter and a relatively thin algal crust seldom more than 1.5 cm in thickness. The example demonstrates that large rhodoliths can form in shallow water equally conducive to the development of coral bioherms, but accreted around igneous cobbles eroded under nearshore conditions. The thin crust developed by such rhodoliths belies a shorter time span of growth compared to rhodoliths with the same diameter lacking a rock core.
Another example from the upper Miocene at Castilhano on São Nicolau in the Cabo Verde Archipelago [12] relates to smaller rhodoliths commonly 3.3 cm in diameter typically nucleated around basalt pebbles and deposited in a rocky-shore setting on an irregular basalt unconformity. A similar case may be cited from the lower Pliocene at Malbusca on Santa Maria Island in the Azores [15], where small rhodoliths from 2 to 3 cm in diameter occur with nuclei dominated by shell fragments and only rarely by basalt particles. These are found in deposits more than a meter thick entrained in surge channels eroded in pillow basalt. Based on the nucleation pattern of the Malbusca rhodoliths with few basalt cores, they are likely to have dwelled a bit father offshore than the São Nicolau rhodoliths but still in relatively shallow water. Small rhodoliths with a diameter between 4 and 5 cm are also reported in accumulations as much as a half-meter in thickness from the Lower Miocene of the Lagos-Portimão Formation in southern Portugal [16]. The exposed contact at Lagos between Miocene and Cretaceous strata is a paraconformity between limestone units. It is not surprising that the Miocene rhodoliths lack a rock core. Moreover, rhodolith beds are incorporated into the Lagos-Portimão Formation in a cyclic fashion that suggests episodic storm events. Overall, the depositional pattern shared by smaller fossil rhodoliths suggests a growth history cut short by the recurrence of lesser storms that raked sea bottoms closer to shore with greater frequency than hurricanes more capable of stirring deeper waters. Clearly, the largest deep-water rhodoliths recognized today from the Abrolhos Bank off Brazil [4] have adequate time to grow in size by accretion from smaller, incipient rhodoliths.
Hurricane incidence in the island groups of the northeast Atlantic Ocean may appear infrequent in terms of today’s historical records, but a higher incidence during Miocene and Pliocene times was sure to have occurred with the Inter-Tropical Convergence Zone (ITCZ) displaced from the equator during the boreal winter to a more northern latitude beyond 20° experienced today during the boreal summer’s monsoonal climate. Analysis of Ocean-Drilling-Program (ODP) Site 659 located east of Sal Island [34], indicates a higher level of terrigenous influx off the Cabo Verde plateau between 6.2 and 4.9 million years ago than typical today. The inference is that elevated levels of storminess led to enhanced rainfall over the islands on the plateau and this factor may account for the occurrence of the extensive Miocene rhodolith deposits on São Nicolau Island [12], as well as other places like Madeira [13] and southern Portugal [16]. Such differences in the organization of the ITCZ in a more northerly position are marshalled to account for changes registered as far north as Malta in the Mediterranean Sea following the Messinian Salinity Crisis [34,35]. It remains to be seen if the pattern of ongoing climate change that contributes to increasing storminess in the Atlantic Ocean may include wayward storm tracks affecting the Canary, Madeira, and Azorean islands.

6. Conclusions

Rhodolith samples from Pleistocene and Holocene sites on the windward eastern shore of Sal Island in the Cabo Verde Archipelago register variations in size, volume, and weight that offer insights on the effectiveness of storm waves in the final configuration of those deposits, as well as trends from older Pliocene and Miocene deposits from other Atlantic archipelagos.
  • Rhodoliths formed by the accretion of coralline red algae in nodules taking on a semi-spherical shape are moderately large at 15 cm in diameter from the upper Pleistocene at Bahía da Parda and 10 cm in diameter from the Holocene deposit at Praia das Gatas, respectively.
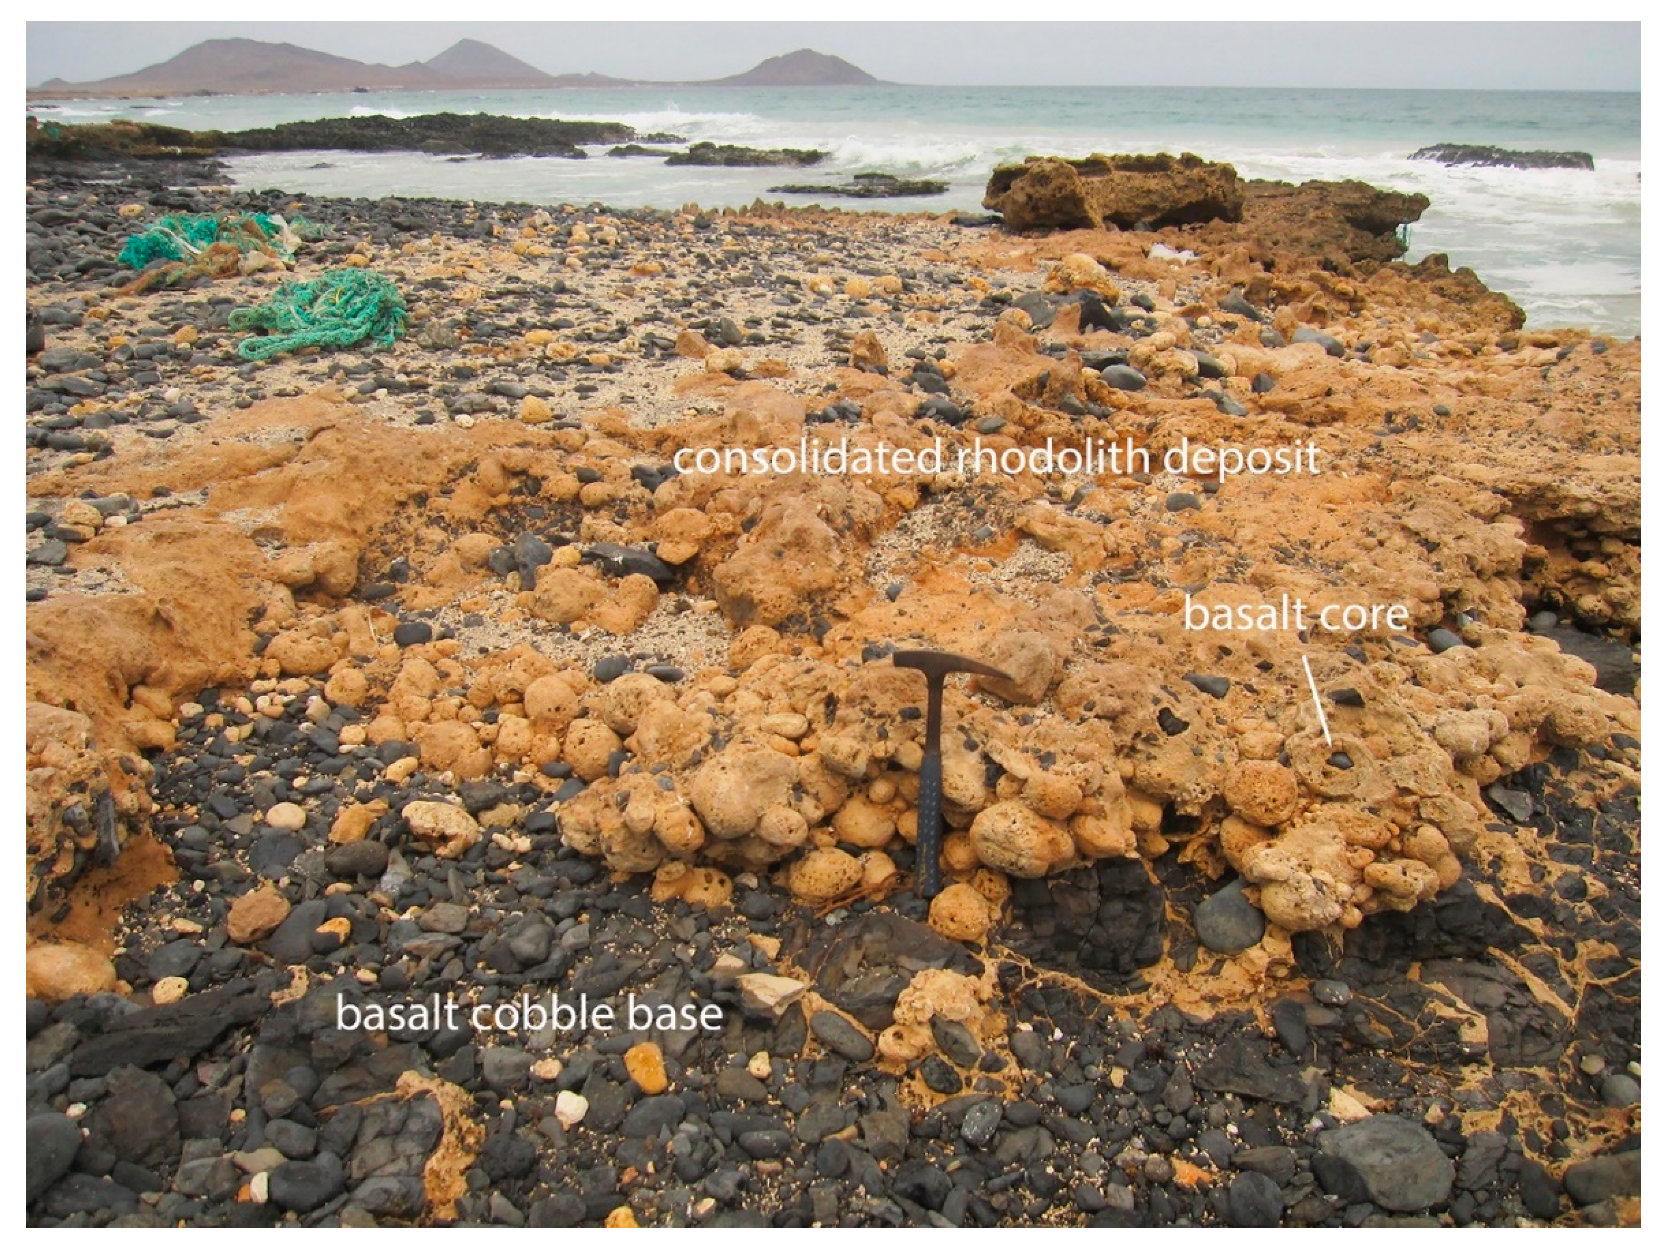
  • Fossil rhodoliths as large as 15 cm in diameter and lacking rock cores appear to have survived for a long time, potentially as much as 100 years through continuous development in deeper, offshore waters where disruption from storm events was seldom experienced, but were conveyed by storms to a position superimposed on basalt cobbles.
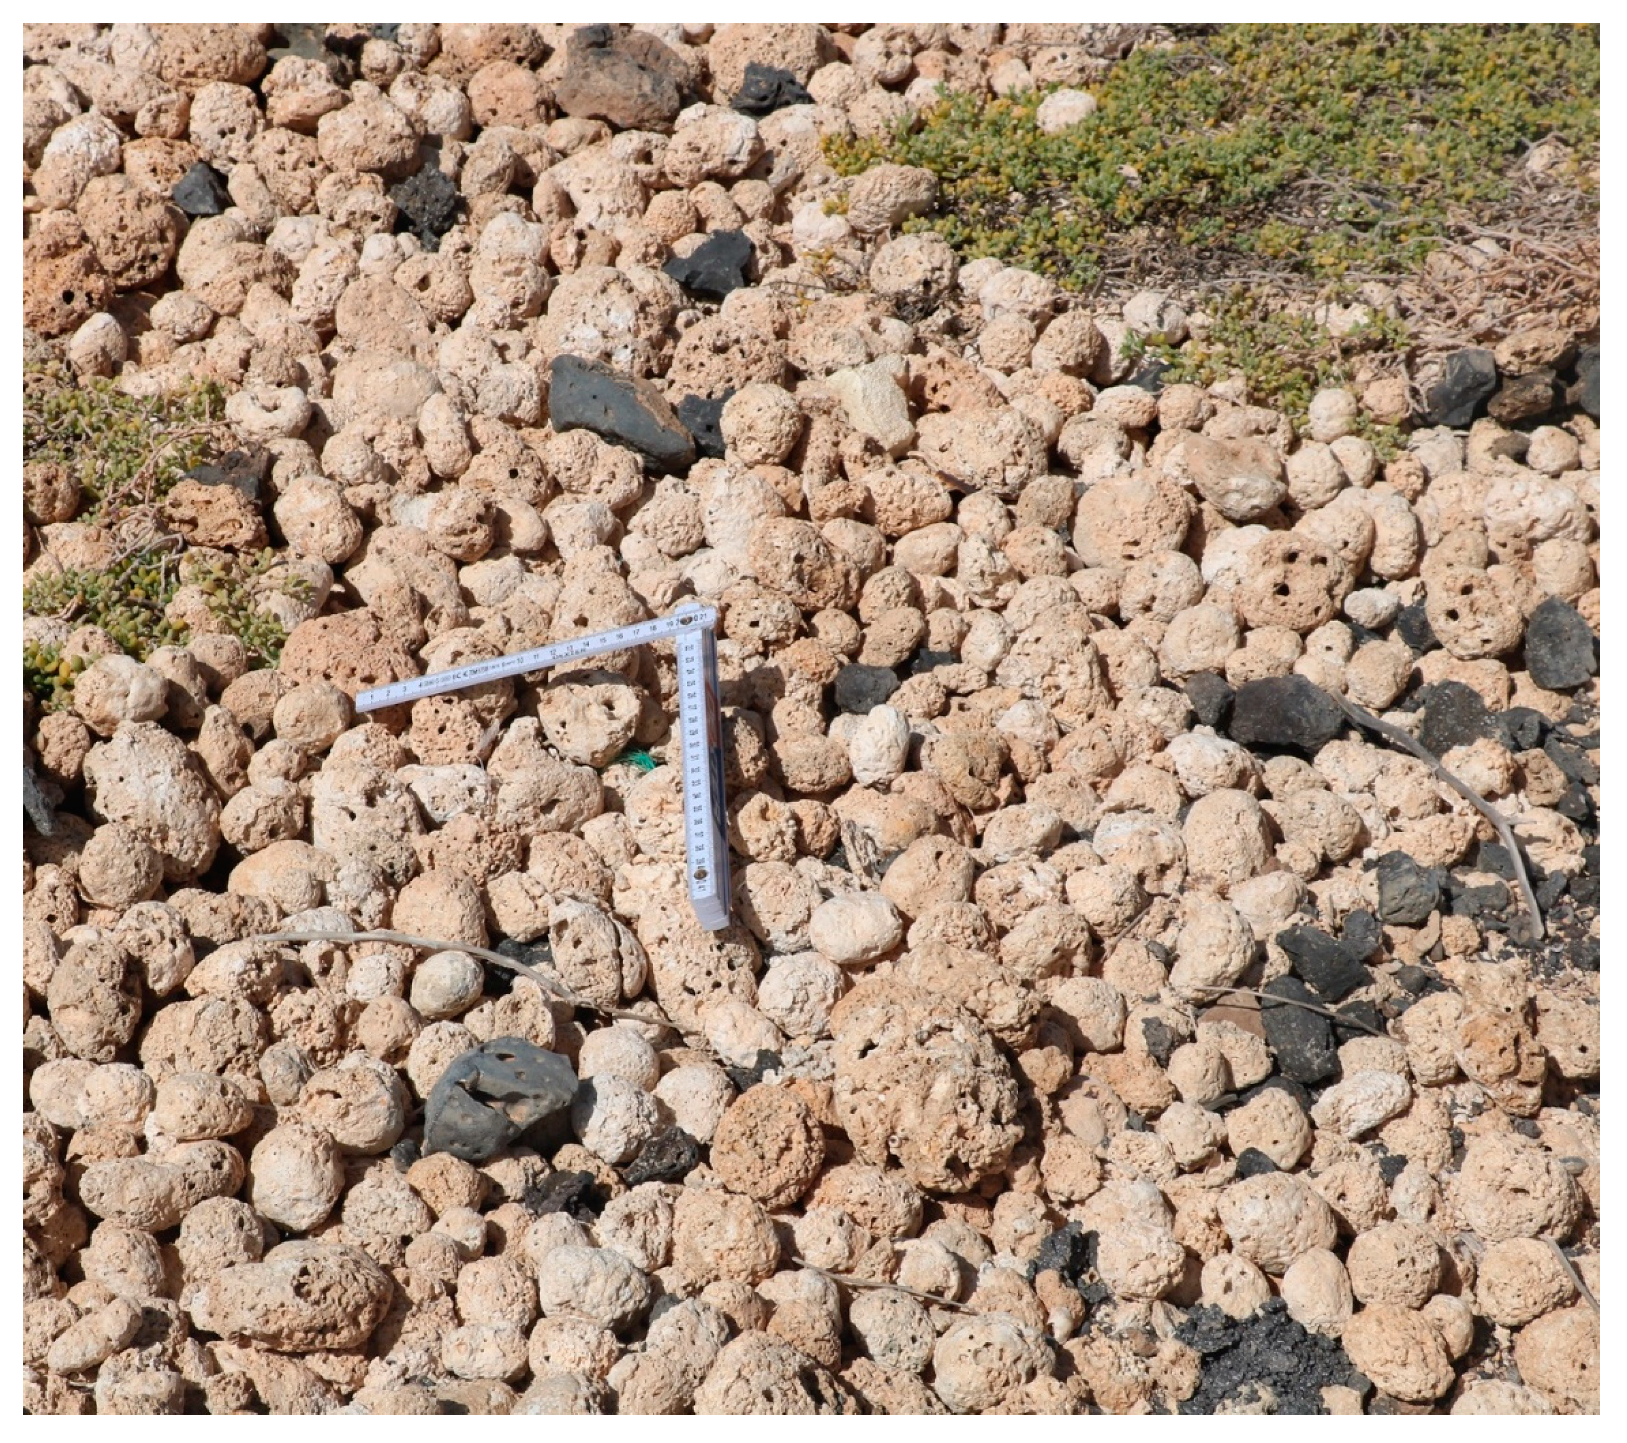
  • Upper Pleistocene deposits at Praia das Gatas and Baía da Parda correspond to death assemblages dominated by rhodoliths with minor faunal elements that include fragmented corals and marine gastropods. The worn outer surface of densely branched rhodoliths typical of species in the genus Lithothamnium points to a shallow, subtidal setting in which very fine biogenic carbonate was produced as a result of contact abrasion to provide the matrix in which the rhodoliths are cemented.
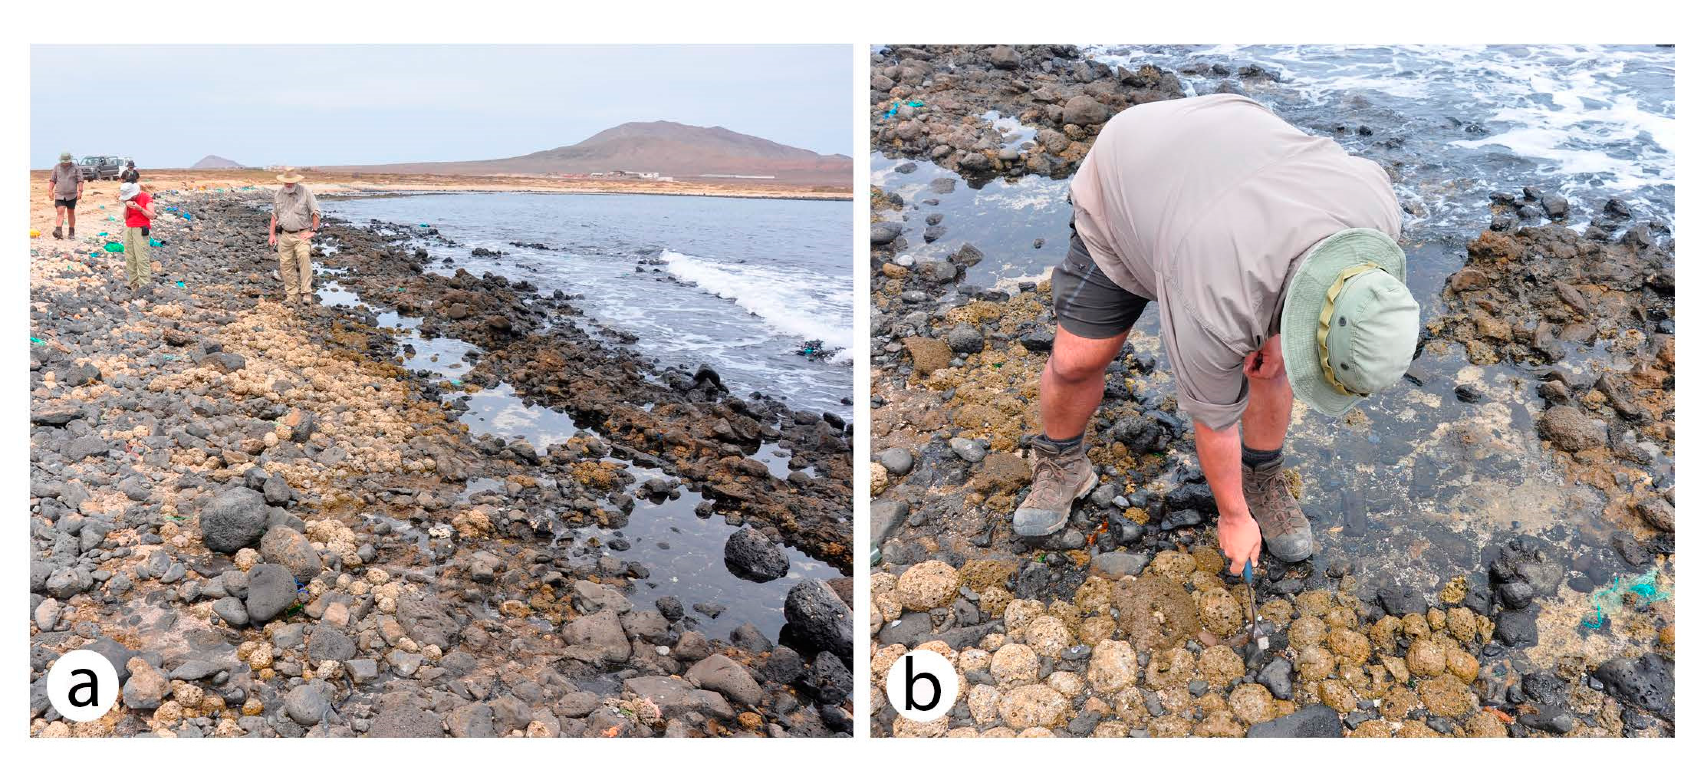
  • The extensive supratidal Holocene deposit of loose rhodoliths found at Praia das Gatas was recycled in its entirety from the adjacent Pleistocene deposit at the same locality as a result of storm activity that created surf conditions more energetic than generated by the constant Northeast Trade Winds on the exposed shore of Sal Island. Rhodoliths in the Holocene deposit are somewhat smaller, overall, but with surfaces subject to additional contact abrasion.
  • Analysis of the Sal Island rhodoliths compared with older Miocene and Pliocene rhodolith deposits elsewhere in the Cabo Verde Archipelago as well as other islands in Madeira, the Azores, and mainland Portugal where deposition under conditions of increased storminess is equated with a more northern position of the ITCZ.

Author Contributions

Study sites at Praia das Gatas and Baía da Parda were visited jointly by the authors during reconnaissance work on Sal Island conducted in March 2013. R.R. recorded the raw data on the dimensions of the sampled rhodoliths when he revisited the study sites in December 2019. M.E.J. was responsible for writing the first draft of this contribution and for plotting the data in the Sneed-Folk diagrams and bar graphs. C.M.d.S. contributed the maps in Figure 1. All authors shared field photos and collaborated on the final draft of the paper. All authors have read and agreed to the published version of the manuscript.

Funding

Reconnaissance work on Sal Island in 2013 was supported under grant CGL2010-15372-BTE from the Spanish Ministry of Science and Innovation to project leader Eduardo Mayoral (University of Huelva). R.R. acknowledges his IF/01641/2015 Investigador FCT contract. This work was supported by the project PTDC/CTA-GEO/28588/2017 LISBOA-01-0145-FEDER-028588 UNTIeD—funded by FCT, the Portuguese Science Foundation and FEDER—European Regional Development Fund.

Acknowledgments

Preparation of this report was in response to the call for papers on “Geomorphological and Sedimentological Imprints of Storm Events” as a Special Issue in Geosciences. Our submission is an outgrowth of the presentation on “Neogene and Present-day Hurricane Deposits from Islands in the Macaronesian Realm (NE Atlantic Ocean) delivered by M.E.J. during the Sixth Conference of the Regional Committee on Neogene Atlantic Stratigraphy under the Subcomission on Neogene Stratigraphy (International Union of Geological Sciences) held 10–13 July 2017 at Ponta Delgada in the Azores. The authors are grateful for recommendations offered by two anonymous reviewers that helped improve the final version of this contribution.

Conflicts of Interest

The authors declare no conflict of interest.

Appendix A

Table A1. Quantification of rhodolith size, volume, and estimated weight from Pleistocene samples at Baía da Parda. The density magnesium-rich limestone at 2.6 gm/cm3 is applied uniformly in order to estimate the weight of each sample based on the radius measured against the intermediate axis.
SampleLong Axis (cm)Intermediate Axis (cm)Short Axis (cm)Intermediate Volume (cm3)Estimated Weight (kg)Nucleus Basalt Core?
114.511.59.57962.05without
21311.57.57962.04without
386.54.51440.37without
41075.51800.49without
59.565.51130.29without
68.586.52680.64without
76.564.51130.29without
897.55.52210.57without
954.53.5480.12without
109.575.51800.49without
1175.53.56971.81without
127.565.51130.29without
13653.5650.17without
1475.54870.23shell
15754650.17without
1676,531440.37without
17765.51130.29without
18863.51130.29without
197.564.51130.91without
205.54.54.5480.12basalt
215.544340.08without
227.554.5650.17without
2313973820.99without
246.54.53.53820.99without
256442680.64without
2654.54.53820.99without
27443340.08without
286.5681130.29without
291513111,1502.99without
30121289052.35without
Mean8.136.65.22710.713%
Table A2. Quantification of rhodolith size, volume, and estimated weight from the Holocene deposit at Baía das Gatas. The density magnesium-rich limestone at 2.6 gm/cm3 is applied uniformly in order to estimate the weight of each sample based on the radius measured against the intermediate axis.
SampleLong Axis (cm)Intermediate Axis (cm)Short Axis (cm)Intermediate Volume (cm3)Estimated Weight (kg)Nucleus Basalt Core?
11095.53820.99without
28.56.561440.37without
35.55.54880.23without
4775.51800.49without
586.541440.37without
68.58.56.53220.84without
77.5641130.21without
885.55.5880.23without
9654650.17without
1010842680.7without
118.5741800.49without
127.5761800.49without
1310661130.21without
14665650.17without
1565.54880.23without
16655650.17without
175.54.55480.12without
18554650.17without
19654650.17without
205.544340.08without
217.55.55.5880.23without
225.554.5650.17without
2353.53.5220.06without
2443.53.5220.06without
2543.53220.06without
Mean6.85.74.61170.3zero%

References

  1. Peña, V.; Vieira, C.; Braga, J.C.; Aguirre, J.; Rösler, A.; Baele, G.; De Clerck, O.; Le Gall, L. Radiation of the coralline red algae (Corallinophycidae, Rhodophyta) crown group as inferred from a multilocus time-calibrated phylogeny. Mol. Phylogenet. Evol. 2020, 150, 106845. [Google Scholar] [CrossRef]
  2. Foster, M.S. Rhodoliths: Between rock and soft places. J. Phycol. 2001, 37, 659–667. [Google Scholar] [CrossRef]
  3. Bassi, D.; Braga, J.C.; Owada, M.; Aguirre, J.; Lipps, J.H.; Takaynagi, H.; Iryu, Y. Boring bivalve traces in modern reef and deeper-water macroid and rhodolith beds. Prog. Earth Planet. Sci. 2020, 7, 41. [Google Scholar] [CrossRef]
  4. Steller, D.L.; Riosmena-Rodríguez, R.; Foster, M.S.; Roberts, C.A. Rhodolith bed diversity in the Gulf of California: The importance of rhodolith structure and consequences of disturbance. Aquat. Conserv. Mar. Freshw. Ecosyst. 2003, 13, S5–S20. [Google Scholar] [CrossRef]
  5. Amado-Filho, G.M.; Moura, L.; Gastos, A.C.; Salgad, T.; Sumida, P.Y.; Guth, Z.; Francini-Filho, R.B.; Pereira-Filho, G.H.; Abrantes, D.P.; Brasileiro, P.S.; et al. Rhodolith beds are major CaCO3 bio-factories in the tropical South West Atlantic. PLoS ONE 2012, 7, e35171. [Google Scholar] [CrossRef] [Green Version]
  6. Marrack, E.C. The relationship between water motion and living rhodolith beds in the southwestern Gulf of California. Palaios 1999, 14, 159–171. [Google Scholar] [CrossRef]
  7. Matsuda, S.; Iryu, Y. Rholdoliths from deep fore-reef to shelf areas around Okinawa-jima, Rhukyu Islands, Japan. Mar. Geol. 2011, 281, 215–230. [Google Scholar] [CrossRef]
  8. Checconi, A.; Bassi, D.; Carannante, G.; Monaco, P. Re-deposited rhodolikths in the Middle Miocene hemipelagic deposits of Vitulano (Southern Apennines, Italy): Corallline assemblage characterization and related trace fossils. Sediment. Geol. 2010, 225, 50–66. [Google Scholar] [CrossRef]
  9. Schäfer, P.A.; Fortunato, H.; Bader, B.; Liebetrau, V.; Bauch, T.; Reijmer, J.J.G. Growth rates and carbonate production by coralline red algae in upwelling and non-upwelling setting along the Pacific coast of Panama. Palaios 2011, 26, 420–432. [Google Scholar] [CrossRef]
  10. Frantz, B.R.; Kashgarian, M.; Coale, K.H.; Foster, M.S. Growth rate and potential climate record from a rhodolith using 14C accelerator mass spectrometry. Limol. Oceanogr. 2000, 45, 1773–1777. [Google Scholar] [CrossRef]
  11. Johnson, M.E.; Ledesma-Vázquez, J.; Ramalho, R.S.; da Silva, C.M.; Rebelo, A.C.; Santos, A.; Baarli, G.B.; Mayoral, E.; Cachão, M. Taphonomic Range and Sedimentary Dynamics of Modern and Fossil Rhodolith Beds: Macaronesian Realm (North Atlantic Ocean). In Rhodolith/Maërl Beds: A Global Perspective; Riosmena-Rogríguez, R.R., Nelson, W., Aquirre, J., Eds.; Coastal Research Library 15; Springer: Berlin/Heidelberg, Germany, 2017; pp. 221–261. ISBN 978-3-319-29313-4. [Google Scholar]
  12. Johnson, M.E.; Ramalho, R.S.; Baarli, B.G.; Cachão, M.; da Silva, C.M.; Cachão, M.; Mayoral, E.; Santos, A. Miocene-Pliocene rocky shores on São Nicolau (Cape Verde Islands): Contrasting windward and leeward biofacies on a volcanically active oceanic island. Palaeogeog. Palaeoclim. Palaeoecol. 2014, 395, 131–143. [Google Scholar] [CrossRef] [Green Version]
  13. Johnson, M.E.; da Silva, C.M.; Santos, A.; Baarli, B.G.; Cachão, M.; Mayoral, E.J.; Rebelo, A.C.; Ledesma-Vázquez, J. Rhodolith transport and immobilization on a volcanically active rocky shore: Middle Miocene at Cabeço das Laranjas on Ilhéue de Cima (Madeira Archipelago, Portugal). Palaeogeog. Palaeoclim. Palaeoecol. 2011, 300, 113–127. [Google Scholar] [CrossRef]
  14. Santos, A.; Mayoral, E.; Johnson, M.E.; Baarli, B.G.; da Silva, C.M.; Cachão, M.; Ledesma-Vázquez, J. Basalt mounds and adjacent depressions attract contrasting biofacies on a volcanically active Middle Miocene coastline (Porto Santo, Madeira Archipelago, Portugal). Facies 2012, 58, 573–585. [Google Scholar] [CrossRef]
  15. Rebelo, A.C.; Rasser, M.W.; Kroh, A.; Johnson, M.E.; Ramalho, R.S.; Melo, C.; Uchman, A.; Berning, B.; Silva, L.; Zanon, V.; et al. Rocking around a volcanic island shelf: Pliocene rhodolith beds from Malbusca, Santa Maria Island (Azores, NE Atlantic). Facies 2016, 62, 1–31. [Google Scholar] [CrossRef]
  16. da Silva, C.M.; Cachão, M.; Rebelo, A.C.; Johnson, M.E.; Baarli, B.G.; Santos, A.; Mayorall, E.J. Paleoenvironment and taphonomy of lower Miocene biovale and macroid assemblages: The Lagos Biocalcarenite (Lagos-Portimão Formation, southern Portugal). Facies 2019, 65, 6. [Google Scholar] [CrossRef]
  17. Johnson, M.E.; Baarli, B.G.; da Silva, C.M.; Cachão, M.; Ramalho, R.S.; Santos, A.; Mayoral, E.J. Recent rhodolith deposits stranded on the windward shores of Maio (Cape Verde Islands): Historical resource for the local economy. J. Coast. Res. 2016, 32, 735–743. [Google Scholar] [CrossRef]
  18. Michell-Thomé, R.G. Outline of the geology of the Cape Verde Archipelago. Geol. Rundsch. 1972, 61, 1087–1109. [Google Scholar] [CrossRef]
  19. Torres, P.C.; Silva, L.C.; Serralheiro, A.; Tassinari, C.; Munhá, J. Enquadramento geocronológico pelo método K/Ar das principais sequências volcano-estratigráficas da Ilha do Sal—Cabo Verde. Garcia Orta Ser. Geol. Lisb. 2002, 18, 9–13. [Google Scholar]
  20. Bernardino, M.; Rusu, L.; Soares, C.G. Evaluation of the wave energy resources in the Cape Verde Islands. Renew. Energy 2017, 101, 316–326. [Google Scholar] [CrossRef]
  21. Stuut, J.-B.; Zabel, M.; Ratmeyer, V.; Helmke, P.; Schefuss, E.; Lavik, G.; Schneider, R. Provenance of present-day eolian dust collected off NW Africa. J. Geophys. Res. Atmos. 2005, 110, D04202. [Google Scholar] [CrossRef]
  22. Bosence, D. Ecological studies on two unattached coralline algae from western Ireland. Palaeontology 1976, 19, 71–88. [Google Scholar]
  23. Bosence, D.K.J. The Occurrence and Ecology of Recent Rhodoliths—A Review. In Coated Grains; Peryt, T.M., Ed.; Springer: Berlin/Heidelberg, Germany, 1983; pp. 217–224. [Google Scholar]
  24. Sneed, E.D.; Folk, R.L. Pebbles in the lower Colorado River of Texas: A study in particle morphogenesis. J. Geol. 1958, 66, 114–150. [Google Scholar] [CrossRef]
  25. Wentworth, C.K. A scale of grade and class terms for clastic sediments. J. Geol. 1922, 27, 377–392. [Google Scholar] [CrossRef]
  26. Manger, G.E. Porosity and bulk density of sedimentary rocks: Contributions to geochemistry. U. S. Geol. Surv. Bull. 1963, 1144-E, 55. [Google Scholar]
  27. Zazo, C.; Goy, J.L.; Hillaire-Marcel, C.; Dadrio, C.J.; González-Delgado, J.A.; Cabero, A.; Bardaji, T.; Ghaleb, B.; Soler, V. Sea level changes during the last and present interglacials in Sal Island (Cape Verde archipelago). Glob. Planet. Chang. 2010, 72, 301–317. [Google Scholar] [CrossRef] [Green Version]
  28. Ramalho, R.; Helffrich, G.; Schmidt, D.N.; Vance, D. Tracers of uplift and subsidence in the Cape Verde Archipelago. J. Geol. Soc. 2010, 167, 519–538. [Google Scholar] [CrossRef] [Green Version]
  29. Gmelin, J.F. Vermes. In Caroli a Linnaei Systema Naturae per Regna Tria Naturae, 13th ed.; Gmelin, J.F., Ed.; Tome 1(6); G.E. Beer: Lipsiae, Germany, 1791; pp. 3021–3910. Available online: http://biodiversitylibrary.org/item/83098#5 (accessed on 22 October 2020).
  30. Nott, J.F. Waves, coastal boulder deposits and the importance of the pre-transport setting. Earth Planet. Sci. Lett. 2003, 210, 269–276. [Google Scholar] [CrossRef]
  31. Harding, E.T.; Kotsch, W.J. Heavy Weather Guide; United States Naval Institute: Menasha, WI, USA, 1965; p. 209. [Google Scholar]
  32. National Hurricane Center Website. Available online: https://www.nhc.noaa.gov/refresh/graphics_at3+shtml/085405.shtml?swath#contents (accessed on 22 October 2020).
  33. Vaquero, J.M.; García-Herrera, R.; Wheeler, D.; Chenoweth, M.; Mock, C.J. A historical analog of 2005 Hurricane Vince. Am. Meterol. Soc. Bull. 2008, 89, 191–202. [Google Scholar] [CrossRef] [Green Version]
  34. Colin, C.; Siani, G.; Liu, Z.; Blamart, D.; Skonieczny, C.; Zhao, Y.; Bory, A.; Frank, N.; Duchamp-Alphonse, S.; Thil, F.; et al. Late Miocene to early Pliocene climate variability off NW Africa (ODP Site 659). Palaeogeog., Palaeoclim., Palaeoecol. 2014, 401, 81–95. [Google Scholar] [CrossRef]
  35. John, C.M.; Mutti, M.; Adatte, T. Mixed carbonate-siliciclastic record on the North African margin (Malta)—Coupling of weathering processes and mid Miocene climate. Bull. Geol. Soc. Am. 2003, 115, 217–229. [Google Scholar] [CrossRef]
Figure 1. Maps showing the location of Sal Island in the Northwest Atlantic Ocean (a) with respect to other islands in the Cabo Verde archipelago demarking the 4000 m line of bathymetry (b), as well as the island’s detailed shelf bathymetry (c). Modified from Johnson et al. (2017) [6].
Geosciences 10 00419 g001
Figure 2. Upper Pleistocene rhodolithic limestone at Baía da Parda on the east coast of Sal Island in the Cabo Verde Archipelago (view to the north). The seaward overhang of protruding sea cliffs is typical along this stretch of the coast.
Geosciences 10 00419 g002
Figure 3. Close-up view of the Pleistocene rhodolith deposit at Baía da Parda showing a consolidated deposit of worn rhodoliths stacked two to three deep above a basalt cobble base (rock hammer for scale). View is to the north.
Geosciences 10 00419 g003
Figure 4. Patchy exposure of upper Pleistocene rhodolithic limestone at the north end of Praia das Gatas on the east coast of Sal Island in the Cabo Verde archipelago; (a) View to the north at low tide showing a thin deposit of rhodoliths on a conglomerate of basalt cobbles and small boulders; (b) Closer view of a single layer of rhodoliths approximately 10 cm in diameter.
Geosciences 10 00419 g004
Figure 5. Holocene supratidal rhodolith deposit at Praia das Gatas north of Baía da Parda on Sal Island (figure and rock hammer for scale).
Geosciences 10 00419 g005
Figure 6. Close-up view of the Holocene supra-tidal deposit at Praía das Gatas (folding meter stick for scale, 20 cm by 20 cm).
Geosciences 10 00419 g006
Figure 7. Set of triangular Sneed-Folk diagrams used to appraise variations in rhodolith shapes; (a) Plots from rhodoliths sampled from the consolidated deposit in Upper Pleistocene limestone on Bahía da Parda; (b) Plots from unconsolidated Holocene deposit at Praia das Gatas.
Geosciences 10 00419 g007
Figure 8. A set of bar graphs used to contrast size variations based on measurements of maximum and intermediate axes in rhodoliths sampled from Pleistocene and Holocene deposits; (a) Bar graph plotting the diameter from the long axis of Pleistocene rhodoliths; (b) Bar graph for the same rhodoliths but based on the length of intermediate axes; (c) Bar graph plotting the diameter from the long axis of rhodoliths in the Holocene deposit; (d) Bar graph for the same rhodoliths but based on the length of intermediate axes. Dashed vertical line denotes the size boundary between large organic pebbles and small cobbles.
Geosciences 10 00419 g008
Table 1. Summary data from Appendix A (Table A1 and Table A2) listing mean values for rhodoliths measured across long, intermediate, and short axes, rhodolith volume, and estimated weight. Note: the density magnesium-rich carbonate at 2.6 gm/cm3 applies uniformly to calculations for weight estimates.
LocalityNumber of SamplesLong Axis (cm3)Intermediate Axis (cm)Short Axis (cm)Calculated Volume (cm3)Estimated Weight (kg)
Parda Pleistocene308.136.605.202710.71
Gatas Holocene256.805.704.601170.30
Average of Means27.57.506.154.901941.01
Table 2. Summary data from Appendix A (Table A1 and Table A2) listing values for the largest single rhodolith measured across long, intermediate, and short axes, and corresponding values for volume and estimated weight. Note: the density magnesium-rich carbonate at 2.6 gm/cm3 applies uniformly to calculations for weight estimates.
LocalityNumber of SamplesLong Axis (cm3)Intermediate Axis (cm)Short Axis (cm)Calculated Volume (cm3)Estimated Weight (kg)
Parda Pleistocene115131111502.99
Gatas Holocene11095.53820.99
Average of Means112.5118.257661.99
Publisher’s Note: MDPI stays neutral with regard to jurisdictional claims in published maps and institutional affiliations.

