Metal(loid)s Transport in Hydrographic Networks of Mining Basins: The Case of the La Carolina Mining District (Southeast Spain)

 , , , and
Abstract
:1. Introduction
2. Materials and Methods
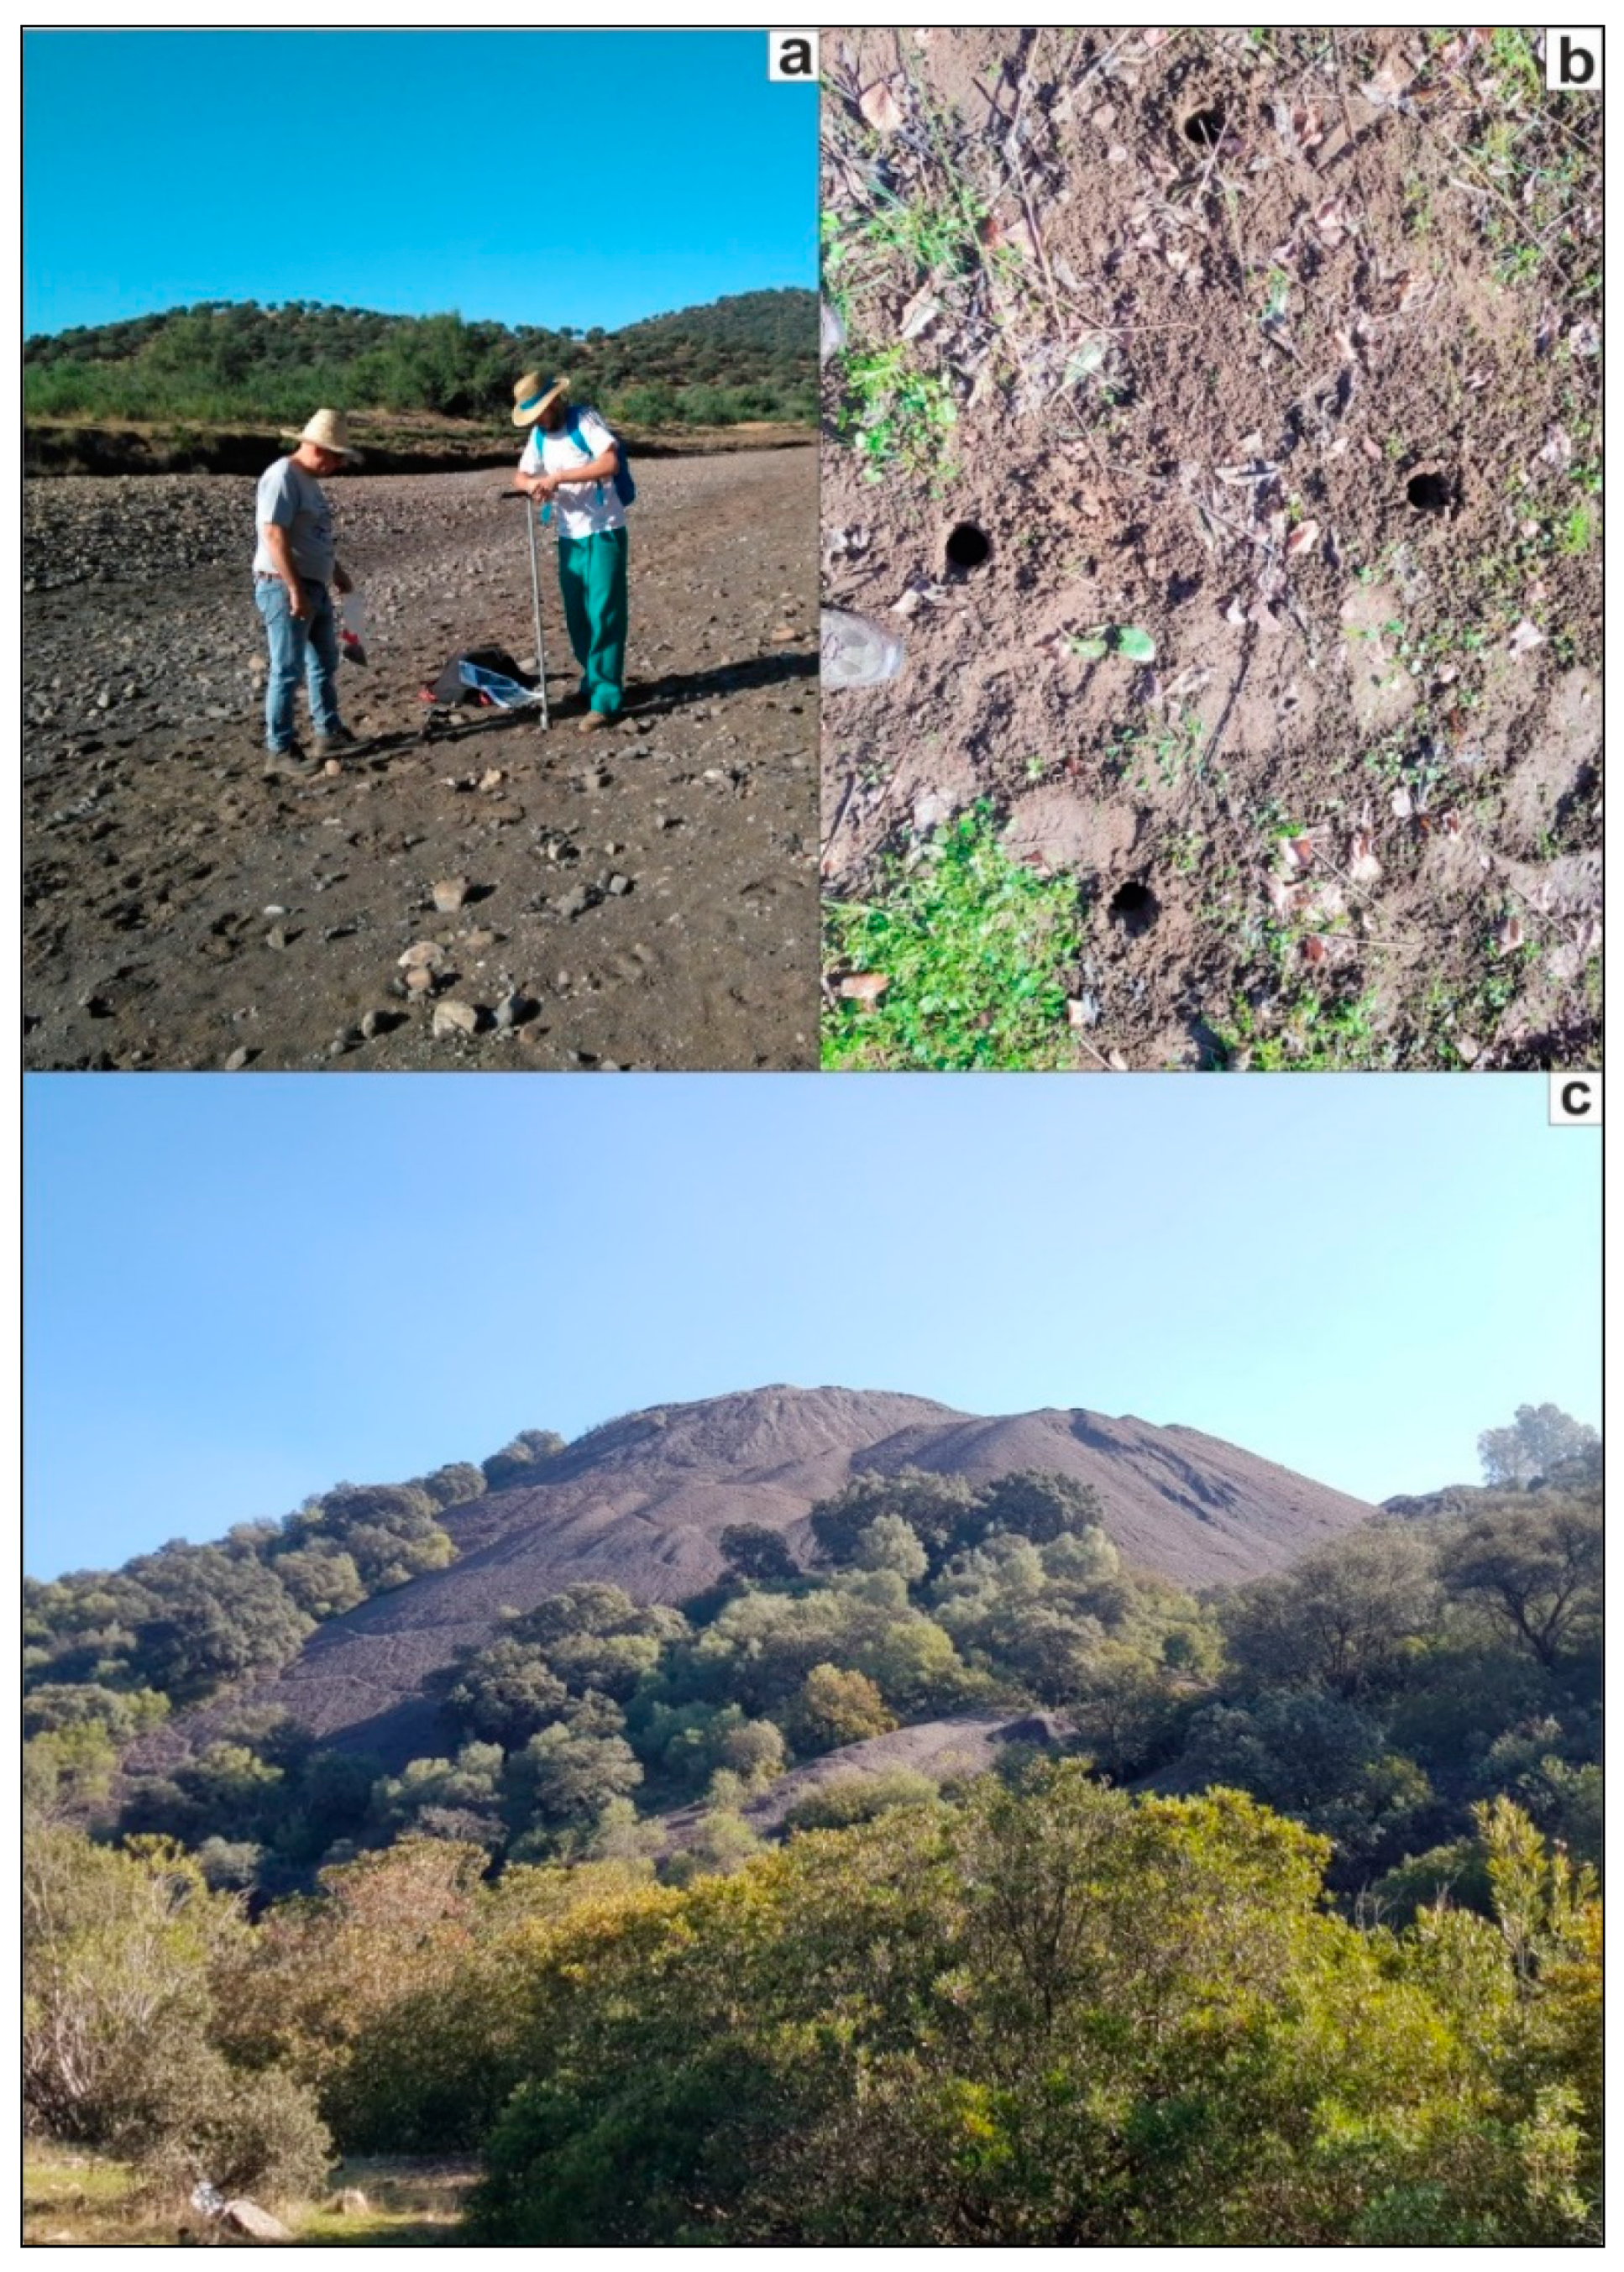
2.1. Study Area
2.2. Sampling and Analysis
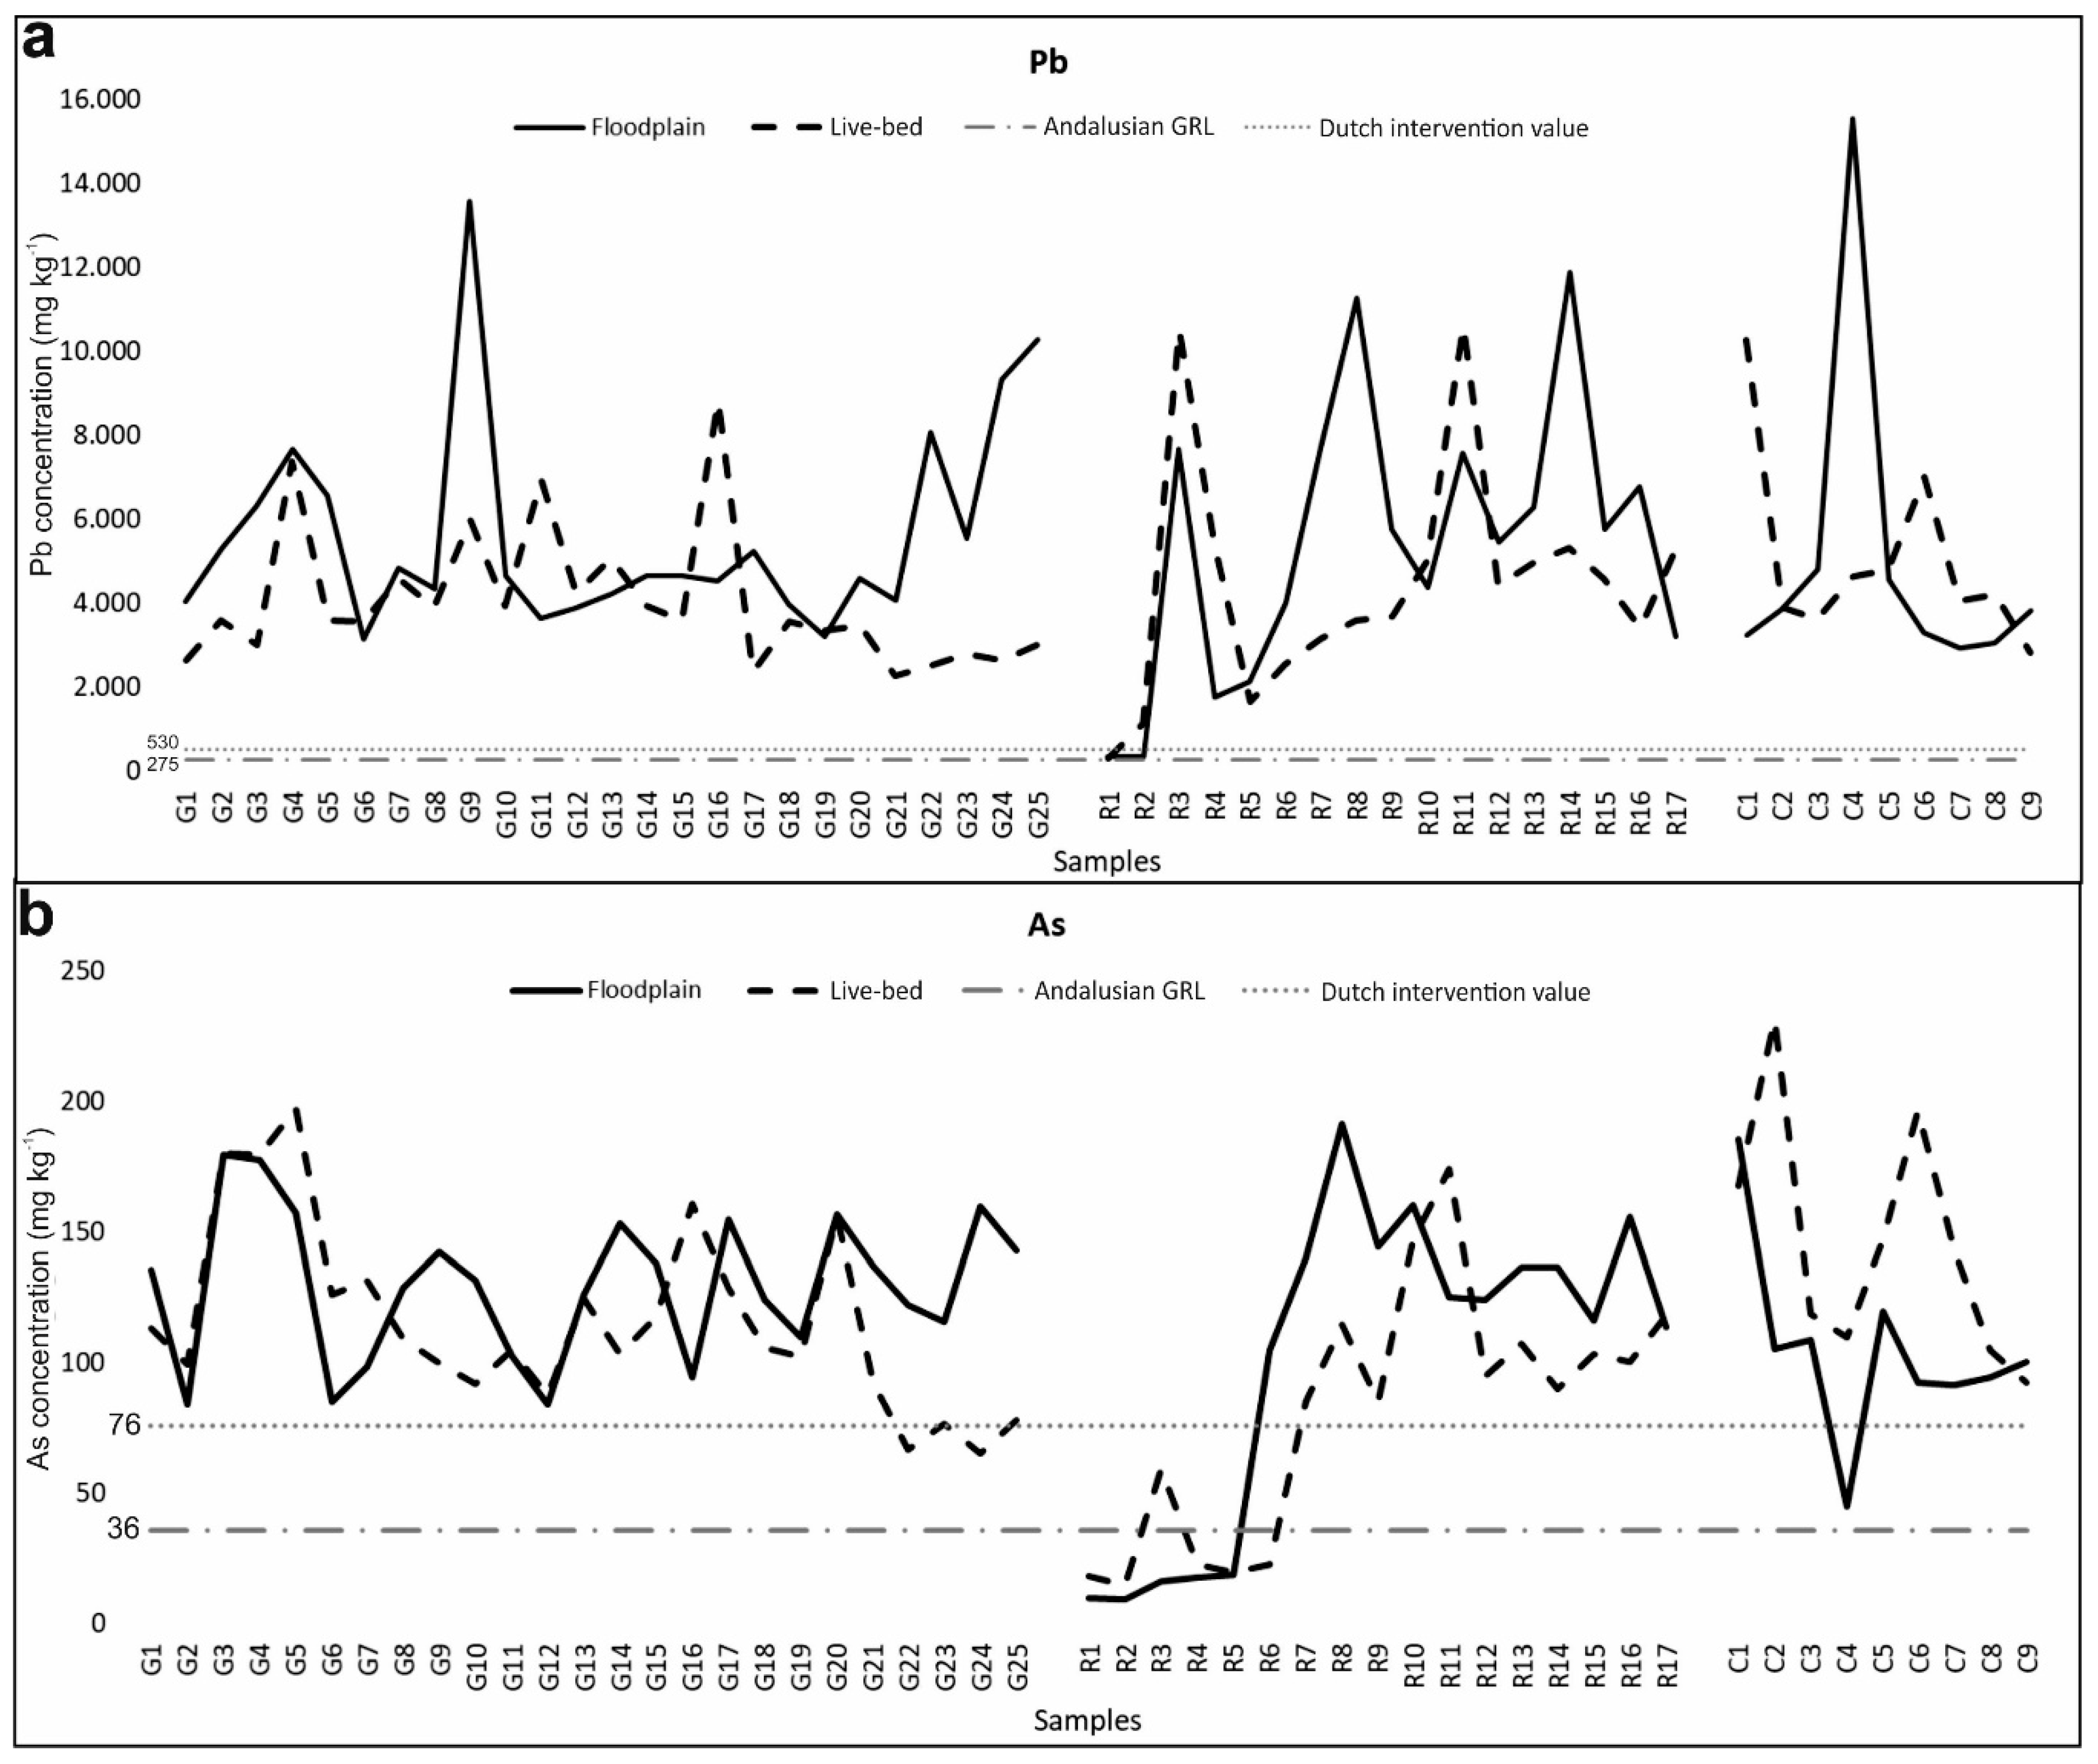
2.3. Evaluation of the Heavy Metal Content in Sediments
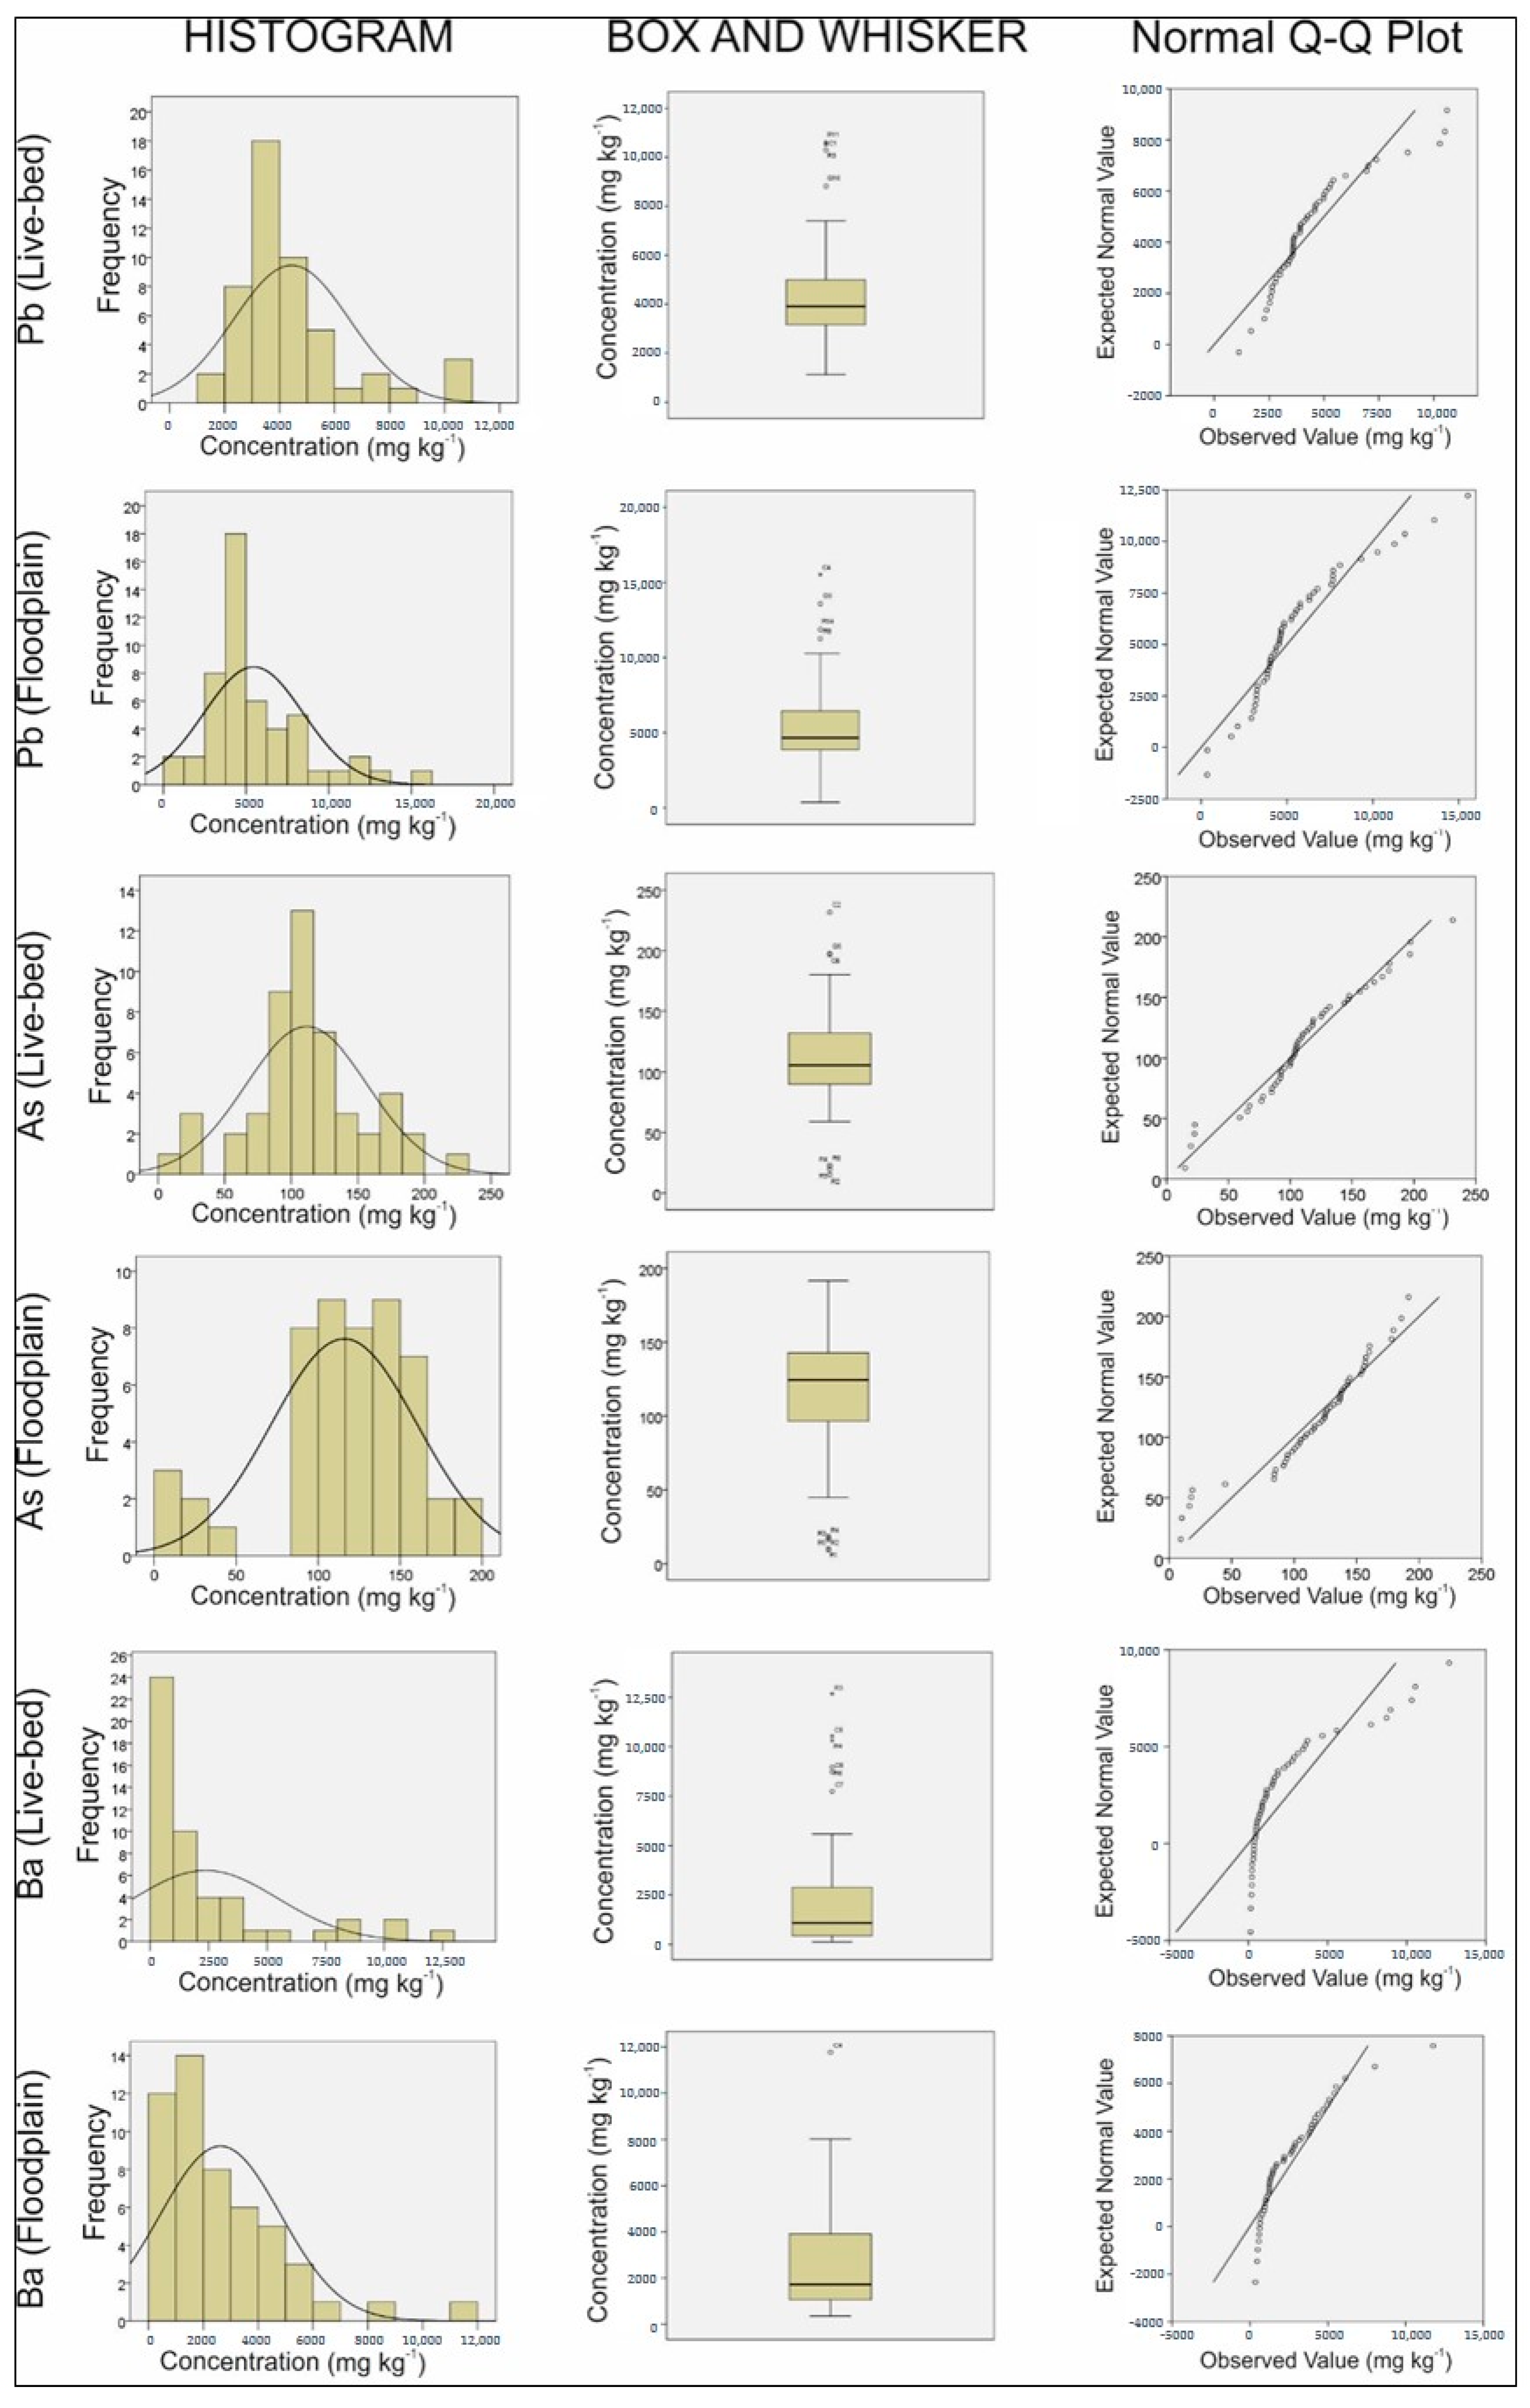
2.4. Statistical Analysis
3. Results and Discussion
4. Conclusions
Author Contributions
Funding
Acknowledgments
Conflicts of Interest
References
- Barcan, V.; Kovnatsky, E. Soil surface geochemical anomaly around the copper-nickel metallurgical smelter. Water. Air. Soil Pollut. 1998, 103, 197–218. [Google Scholar] [CrossRef]
- Byrne, P.; Reid, I.; Wood, P.J. Sediment geochemistry of streams draining abandoned lead/ zinc mines in central Wales: The Afon Twymyn. J. Soils Sediments 2010, 10, 683–697. [Google Scholar] [CrossRef] [Green Version]
- Horvat, M.; Nolde, N.; Fajon, V.; Jereb, V.; Logar, M.; Lojen, S.; Jacimovic, R.; Falnoga, I.; Liya, Q.; Faganeli, J.; et al. Total mercury methylmercury and selenium in mercury polluted areas in the province Guizhou China. Sci. Total Environ. 2003, 304, 231–256. [Google Scholar] [CrossRef]
- Byrne, P.; Wood, P.J.; Reid, I. The impairment of river systems by metal mine contamination: A review including remediation options. Crit. Rev. Environ. Sci. Technol. 2012, 42, 2017–2077. [Google Scholar] [CrossRef]
- Hudson-Edwards, K.A.; Macklin, M.G.; Brewer, P.A.; Dennis, I.A. Assessment of Metal Mining-Contaminated River. 2008. Available online: http://www.eugris.info/displayresource.aspx?r=6681 (accessed on 10 June 2020).
- Dennis, I.; Coulthard, T.; Brewer, P.; Macklin, M. The role of floodplains in attenuating contaminated sediment fluxes in formerly mined drainage basins. Earth Surf. Process. Landforms 2009, 34, 453–466. [Google Scholar] [CrossRef]
- Oyarzun, R.; Lillo, J.; López-García, J.A.; Esbrí, J.M.; Cubas, P.; Llanos, W.; Higueras, P. The Mazarrón Pb-(Ag)-Zn mining district (SE Spain) as a source of heavy metal contamination in a semiarid realm: Geochemical data from mine wastes soils and stream sediments. J. Geochem. Explor. 2011, 109, 113–124. [Google Scholar] [CrossRef] [Green Version]
- Resongles, E.; Casiot, C.; Freydier, R.; Dezileau, L.; Viers, J.Ô.; Elbaz-Poulichet, F. Persisting impact of historical mining activity to metal (Pb Zn Cd Tl Hg) and metalloid (As Sb) enrichment in sediments of the Gardon River Southern France. Sci. Total Environ. 2014, 481, 509–521. [Google Scholar] [CrossRef]
- Ali, M.M.; Ali, M.L.; Islam, M.S.; Rahman, M.Z. Preliminary assessment of heavy metals in water and sediment of Karnaphuli River Bangladesh. Environ. Nanotechnol. Monit. Manag. 2016, 5, 27–35. [Google Scholar] [CrossRef] [Green Version]
- Cortada, U.; Hidalgo, M.C.; Martínez, J.; Rey, J. Dispersion of metal(loid)s in fluvial sediments: An example from the Linares mining district (southern Spain). Int. J. Environ. Sci. Technol. 2019, 16, 469–484. [Google Scholar] [CrossRef]
- Huang, X.; Luo, D.; Zhao, D.; Li, N.; Xiao, T.; Liu, J.; Wei, L.; Liu, Y.; Liu, L.; Liu, G. Distribution Source and Risk Assessment of Heavy Metal(oid)s in Water Sediments and Corbicula Fluminea of Xijiang River China. Int. J. Environ. Res. Public Health 2019, 16, 1823. [Google Scholar] [CrossRef] [Green Version]
- Ciszewski, D. The past and prognosis of mining cessation impact on river sediment pollution. J. Soils Sediments 2019, 19, 393–402. [Google Scholar] [CrossRef] [Green Version]
- Dennis, I.A.; Macklin, M.G.; Coulthard, T.J.; Brewer, P.A. The impact of the October-November 2000 floods on contaminant metal dispersal in the River Swale catchment North Yorkshire UK. Hydrol. Process. 2003, 17, 1641–1657. [Google Scholar] [CrossRef]
- Mulder, C.; Rutgers, M. Legislation and ecological quality assessment of soil: Implementation of ecological indication systems in Europe. Ecotoxicol. Environ. Saf. 2005, 62, 201–210. [Google Scholar]
- de Andalucía, J. Decreto 18/2015. Boletín Oficial de la Junta de Andalucía; Consejería de Medio Ambiente: Madrid, Spain, 2015; Available online: https://www.juntadeandalucia.es/boja/2015/38/3 (accessed on 15 May 2020).
- Yang, Q.; Li, Z.; Lu, X.; Duan, Q.; Huang, L.; Bi, J. A review of soil heavy metal pollution from industrial and agricultural regions in China: Pollution and risk assessment. Sci. Total Environ. 2018, 642, 690–700. [Google Scholar] [CrossRef]
- Bortey-Sam, N.; Nakayama, S.M.M.; Ikenaka, Y.; Akoto, O.; Baidoo, E.; Yohannes, Y.B.; Mizukawa, H.; Ishizuka, M. Human health risks from metals and metalloid via consumption of food animals near gold mines in Tarkwa Ghana: Estimation of the daily intakes and target hazard quotients (THQs). Ecotoxicol. Environ. Saf. 2015, 111, 160–167. [Google Scholar] [CrossRef] [Green Version]
- Lillo, F.J. Geology and Geochemistry of Linares—La Carolina Pb-ore Field (Sootheastern Border of the Hesperian Massif). Ph.D. Thesis, University of Leeds, Leeds, UK, 1992. [Google Scholar]
- Azcárate, J.E. Mapa Geológico y Memoria Explicativa de la Hoja 905 (Linares) Escala 1:50.000; I.G.M.E.: Madrid, Spain, 1977. [Google Scholar]
- Gutiérrez Guzmán, F. Las Minas De Linares. Apuntes Históricos; COLEGIO OF.: Jaén, Spain, 1999; ISBN 84-930339-1-X. [Google Scholar]
- Anju, M.; Banerjee, D.K. Multivariate statistical analysis of heavy metals in soils of a Pb–Zn mining area India. Environ. Monit. Assess. 2012, 184, 4191–4206. [Google Scholar] [CrossRef]
- Chandrasekaran, A.; Ravisankar, R.; Harikrishnan, N.; Satapathy, K.K.; Prasad, M.V.R.; Kanagasabapathy, K.V. Multivariate statistical analysis of heavy metal concentration in soils of Yelagiri Hills Tamilnadu India—Spectroscopical approach. Spectrochim. Acta Part A Mol. Biomol. Spectrosc. 2015, 137, 589–600. [Google Scholar] [CrossRef]
- Ferguson, C.C.; Kasamas, H. Risk Assessment for Contaminated Sites in Europe: Policy Framework; LQM Press: Nottingham, UK, 1999; Volume 2, ISBN 0953-309010. [Google Scholar]
- Martínez, J.; Llamas, J.; de Miguel, E.; Rey, J.; Hidalgo, M.C. Determination of the geochemical background in a metal mining site: Example of the mining district of Linares (South Spain). J. Geochem. Explor. 2007, 94, 19–29. [Google Scholar]
- Rijkswaterstaat Ministry of Infrastructure and Water Management. Soil Remediation Circular 2013, Version of 1 July 2013. Available online: https://rwsenvironment.eu/subjects/soil/legislation-and/soil-remediation/ (accessed on 15 May 2020).
- Meteorology Statal Agency (Spain); Institute of Meteorology (Portugal). Iberian Climate Atlas; Government of Spain: Madrid, Spain, 2011; ISBN 978-84-7837-079-5.
- Rojas, D. Influence of Mine Wastes on the Water Resources in the La Carolina Mining District (Jaen). Ph.D. Thesis, University of Jaen, Jaén, Spain, 2019. [Google Scholar]
- Gutiérrez Guzmán, F. Minería en Sierra Morena El Distrito Minero De La Carolina; Ilustre Colegio Oficial de Ingenieros de Minas de Linares: Jaén, Spain, 2007. [Google Scholar]
- Rey, J.; Hidalgo, M.C.; Martínez-López, J. Upper Ordovician–Lower Silurian transgressive–regressive cycles of the Central Iberian Zone (NE Jaén Spain). Geol. J. 2005, 40, 477–495. [Google Scholar] [CrossRef]
- Martínez, J.; Hidalgo, M.C.; Rey, J.; Garrido, J.; Kohfahl, C.; Benavente, J.; Rojas, D. A multidisciplinary characterization of a tailings pond in the Linares-La Carolina mining district Spain. J. Geochem. Explor. 2016, 162, 62–71. [Google Scholar] [CrossRef]
- Rojas, D.; Hidalgo, M.; Kohfahl, C.; Rey, J.; Martínez, J.; Benavente, J. Oxidation Dynamics and Composition of the Flotation Plant Derived Tailing Impoundment Aquisgrana (Spain). Water Air Soil Pollut. 2019, 230, 158. [Google Scholar] [CrossRef]
- De La Torre, M.J.; Hidalgo, C.; Rey, J.; Martínez, J. Mineralogical Characterization of Tailing Dams: Incidence of Abandoned Mining Works on Soil Pollution (Linares Jaén). In Proceedings of the EGU General Assembly 2012, Vienna, Austria, 22–27 April 2012. [Google Scholar]
- Pavlowsky, R.T.; Lecce, S.A.; Owen, M.R.; Martin, D.J. Legacy sediment lead and zinc storage in channel and floodplain deposits of the Big River Old Lead Belt Mining District MO USA. Geomorphology 2017, 299, 54–75. [Google Scholar] [CrossRef]
- Langston, W.J.; Spence, S.K. Metal Analysis. A Handbook of Ecotoxicology; Blackwell Sci.: London, UK, 1994; Volume 2. [Google Scholar]
- Xing, B.; Veneman, P.L.M. Microwave digestion for analysis of metals in soil. Commun. Soil Sci. Plant Anal. 1998, 29, 923–930. [Google Scholar] [CrossRef]
- Peinado, F.M.; Ruano, S.M.; González, M.G.B.; Molina, C.E. A rapid field procedure for screening trace elements in polluted soil using portable X-ray fluorescence (PXRF). Geoderma 2010, 159, 76–82. [Google Scholar] [CrossRef]
- Schneider, A.R.; Morvan, X.; Saby, N.P.A.; Cancès, B.; Ponthieu, M.; Gommeaux, M.; Marin, B. Multivariate spatial analyses of the distribution and origin of trace and major elements in soils surrounding a secondary lead smelter. Environ. Sci. Pollut. Res. 2016, 23, 15164–15174. [Google Scholar] [CrossRef] [PubMed]
- Mason, B. Principles of Geochemistry; John Wiley and Sons: New York, NY, USA, 1966. [Google Scholar]
- Rösler, H.J.; Lange, H. Geochemical Tables; Elsevier: New York, NY, USA, 1972. [Google Scholar]
- Sponza, D.; Karaoǧlu, N. Environmental geochemistry and pollution studies of Aliaǧa metal industry district. Environ. Int. 2002, 27, 541–553. [Google Scholar] [CrossRef]
- Zoller, W.H.; Gladney, E.S.; Duce, R.A. Atmospheric concentrations and sources of trace metals at the South Pole. Science 1974, 183, 198–201. [Google Scholar] [CrossRef]
- Selvaraj, K.; Ram Mohan, V.; Szefer, P. Evaluation of metal contamination in coastal sediments of the Bay of Bengal India: Geochemical and statistical approaches. Mar. Pollut. Bull. 2004, 49, 174–185. [Google Scholar] [CrossRef]
- Zhang, J.; Liu, C.L. Riverine composition and estuarine geochemistry of particulate metals in China—Weathering features anthropogenic impact and chemical fluxes. Estuar. Coast. Shelf Sci. 2002, 54, 1051–1070. [Google Scholar] [CrossRef]
- Birch, G.F.; Olmos, M.A. Sediment-bound heavy metals as indicators of human influence and biological risk in coastal water bodies. ICES J. Mar. Sci. 2008, 65, 1407–1413. [Google Scholar] [CrossRef]
- Muller, G. Index of geoaccumulation in sediments of the Rhine River. GeoJournal 1969, 2, 108–118. [Google Scholar]
- Yu, G.B.; Liu, Y.; Yu, S.; Wu, S.C.; Leung, A.O.W.; Luo, X.S.; Xu, B.; Li, H.B.; Wong, M.H. Inconsistency and comprehensiveness of risk assessments for heavy metals in urban surface sediments. Chemosphere 2011, 85, 1080–1087. [Google Scholar] [CrossRef] [PubMed]
- Hakanson, L. An ecological risk index for aquatic pollution control. A sedimentological approach. Water Res. 1980, 14, 975–1001. [Google Scholar] [CrossRef]
- Tomlinson, D.L.; Wilson, J.G.; Harris, C.R.; Jeffrey, D.W. Problems in the assessment of heavy-metal levels in estuaries and the formation of a pollution index. Helgol. Meeresunters. 1980, 33, 566–575. [Google Scholar] [CrossRef] [Green Version]
- Turekian, K.K.; Wedepohl, K.H. Distribution of the Elements in Some Major Units of the Earths Crust. Geol. Soc. Am. Bull. 1961, 72, 175–192. [Google Scholar] [CrossRef]
- Loska, K.; Cebula, J.; Pelczar, J.; Wiechuła, D.; Kwapuliński, J. Use of enrichment and contamination factors together with geoaccumulation indexes to evaluate the content of Cd Cu and Ni in the Rybnik water Reservoir in Poland. Water Air Soil Pollut. 1997, 93, 347–365. [Google Scholar] [CrossRef]
- Sainz, A.; Grande, J.A.; de la Torre, M.L. Odiel River acid mine drainage and current characterisation by means of univariate analysis. Environ. Int. 2003, 29, 51–59. [Google Scholar] [CrossRef]
- Filzmoser, P.; Hron, K.; Reimann, C. Univariate statistical analysis of environmental (compositional) data: Problems and possibilities. Sci. Total Environ. 2009, 407, 6100–6108. [Google Scholar] [CrossRef]
- Einax, J.W.; Truckenbrodt, D.; Kampe, O. River Pollution Data Interpreted by Means of Chemometric Methods. Microchem. J. 1998, 58, 315–324. [Google Scholar] [CrossRef]
- Tahri, M.; Benyaïch, F.; Bounakhla, M.; Bilal, E.; Gruffat, J.J.; Moutte, J.; Garcia, D. Multivariate analysis of heavy metal contents in soils sediments and water in the region of Meknes (Central Morocco). Environ. Monit. Assess. 2005, 102, 405–417. [Google Scholar] [CrossRef]
- Astel, A.; Tsakovski, S.; Barbieri, P.; Simeonov, V. Comparison of self-organizing maps classification approach with cluster and principal components analysis for large environmental data sets. Water Res. 2007, 41, 4566–4578. [Google Scholar] [CrossRef] [PubMed]
- Lu, X.; Wang, L.; Li, L.Y.; Lei, K.; Huang, L.; Kang, D. Multivariate statistical analysis of heavy metals in street dust of Baoji NW China. J. Hazard. Mater. 2010, 173, 744–749. [Google Scholar] [CrossRef] [PubMed]
- Goovaerts, P. Geostatistical modelling of uncertainty in soil science. Geoderma 2001, 103, 3–26. [Google Scholar] [CrossRef]


| Samples | Ag | As | Ba | Ca | Cd | Co | Cr | Cu | Fe | Mg | Mn | Ni | P | Pb | Sr | V | Zn |
|---|---|---|---|---|---|---|---|---|---|---|---|---|---|---|---|---|---|
| Floodplain | |||||||||||||||||
| G1 | 4.8 | 136 | 502 | 1453 | 1.9 | 18 | 12 | 101 | 24,453 | 1461 | 1990 | 24 | 488 | 4035 | 18 | 11 | 293 |
| G2 | 6.4 | 84 | 987 | 1053 | 4.1 | 16 | 15 | 60 | 25,156 | 1283 | 2313 | 22 | 417 | 5294 | 25 | 17 | 481 |
| G3 | 7.3 | 179 | 1248 | 762 | 1.6 | 15 | 11 | 340 | 26,640 | 1049 | 1062 | 18 | 482 | 6312 | 35 | 10 | 240 |
| G4 | 8.1 | 178 | 2148 | 1685 | 5.0 | 31 | 16 | 432 | 31,229 | 1620 | 4492 | 46 | 568 | 7680 | 29 | 19 | 546 |
| G5 | 7.2 | 157 | 1081 | 890 | 2.6 | 20 | 11 | 307 | 25,222 | 1061 | 1573 | 23 | 474 | 6558 | 50 | 10 | 329 |
| G6 | 3.4 | 85 | 602 | 613 | 1.4 | 14 | 12 | 147 | 26,791 | 1477 | 933 | 24 | 461 | 3152 | 60 | 12 | 276 |
| G7 | 4.4 | 98 | 1242 | 835 | 1.7 | 16 | 12 | 166 | 25,384 | 1392 | 1075 | 22 | 473 | 4828 | 55 | 12 | 263 |
| G8 | 4.5 | 129 | 800 | 1510 | 4.7 | 15 | 15 | 68 | 26,592 | 2494 | 1093 | 32 | 536 | 4365 | 18 | 18 | 491 |
| G9 | 9.2 | 143 | 6139 | 3225 | 5.1 | 13 | 13 | 99 | 24,682 | 2625 | 1038 | 27 | 558 | 13,585 | 67 | 16 | 504 |
| G10 | 3.3 | 132 | 942 | 1096 | 3.0 | 12 | 11 | 72 | 23,880 | 2122 | 831 | 26 | 498 | 4674 | 18 | 12 | 501 |
| G11 | 3.2 | 103 | 1036 | 2484 | 3.4 | 14 | 22 | 54 | 32,980 | 3248 | 894 | 31 | 643 | 3642 | 26 | 23 | 857 |
| G12 | 2.6 | 84 | 577 | 1851 | 3.9 | 12 | 16 | 42 | 24,977 | 2879 | 760 | 26 | 565 | 3894 | 13 | 17 | 619 |
| G13 | 3.1 | 126 | 1345 | 2690 | 3.4 | 15 | 19 | 63 | 31,604 | 3201 | 1028 | 30 | 644 | 4226 | 29 | 19 | 836 |
| G14 | 3.5 | 153 | 1680 | 3093 | 3.8 | 15 | 15 | 71 | 31,494 | 3027 | 1091 | 29 | 621 | 4646 | 32 | 16 | 838 |
| G15 | 3.5 | 138 | 1209 | 2893 | 3.8 | 15 | 19 | 68 | 32,674 | 3233 | 1103 | 32 | 664 | 4674 | 28 | 20 | 821 |
| G16 | 2.9 | 94 | 670 | 1711 | 3.8 | 11 | 14 | 53 | 30,990 | 2864 | 880 | 26 | 588 | 4531 | 14 | 16 | 607 |
| G17 | 3.8 | 155 | 1471 | 2921 | 4.1 | 15 | 15 | 86 | 32,516 | 3056 | 1129 | 28 | 643 | 5254 | 30 | 14 | 865 |
| G18 | 2.4 | 124 | 916 | 2010 | 2.9 | 14 | 17 | 61 | 32,329 | 3186 | 876 | 31 | 614 | 3989 | 22 | 18 | 688 |
| G19 | 1.9 | 110 | 469 | 1383 | 2.7 | 15 | 20 | 56 | 34,025 | 3100 | 749 | 34 | 624 | 3226 | 18 | 24 | 597 |
| G20 | 3.1 | 157 | 1455 | 2240 | 3.4 | 14 | 14 | 71 | 31,616 | 2918 | 991 | 27 | 610 | 4588 | 29 | 14 | 767 |
| G21 | 2.8 | 137 | 1317 | 2251 | 3.4 | 14 | 15 | 69 | 32,406 | 2928 | 1018 | 29 | 631 | 4078 | 27 | 16 | 779 |
| G22 | 6.8 | 122 | 2205 | 2214 | 4.7 | 10 | 12 | 51 | 18,736 | 2076 | 714 | 18 | 357 | 8084 | 27 | 13 | 495 |
| G23 | 4.0 | 116 | 1262 | 1890 | 4.1 | 11 | 14 | 47 | 21,335 | 2291 | 711 | 21 | 424 | 5547 | 21 | 16 | 538 |
| G24 | 8.4 | 160 | 3321 | 3193 | 6.3 | 12 | 15 | 54 | 25,211 | 2704 | 890 | 23 | 550 | 9328 | 38 | 15 | 685 |
| G25 | 9.4 | 143 | 2773 | 3498 | 6.2 | 14 | 16 | 60 | 25,720 | 2974 | 1027 | 25 | 590 | 10,270 | 32 | 15 | 668 |
| R1 | 0.1 | 10 | 626 | 918 | 0.2 | 12 | 21 | 16 | 27,860 | 2751 | 444 | 25 | 408 | 367 | 21 | 18 | 72 |
| R2 | 0.1 | 9 | 649 | 545 | 0.1 | 10 | 20 | 14 | 28,946 | 2744 | 326 | 22 | 400 | 358 | 16 | 17 | 72 |
| R3 | 5.9 | 16 | 8027 | 2077 | 5.2 | 11 | 16 | 311 | 30,981 | 2437 | 630 | 21 | 493 | 7674 | 48 | 13 | 475 |
| R4 | 1.0 | 18 | 1513 | 935 | 2.1 | 11 | 19 | 21 | 29,921 | 2778 | 668 | 26 | 431 | 1759 | 27 | 17 | 583 |
| R5 | 1.5 | 19 | 4697 | 970 | 3.0 | 10 | 21 | 34 | 33,116 | 3025 | 580 | 25 | 448 | 2134 | 62 | 18 | 551 |
| R6 | 3.6 | 105 | 3965 | 2481 | 2.9 | 11 | 19 | 55 | 28,601 | 2705 | 582 | 22 | 611 | 4027 | 54 | 18 | 642 |
| R7 | 4.8 | 140 | 2193 | 1271 | 1.9 | 16 | 17 | 78 | 28,330 | 2011 | 795 | 27 | 488 | 7697 | 27 | 17 | 445 |
| R8 | 11.8 | 192 | 5537 | 3768 | 11.1 | 20 | 18 | 112 | 37,114 | 2583 | 1155 | 29 | 719 | 11,258 | 87 | 18 | 1694 |
| R9 | 6.2 | 145 | 3950 | 5417 | 5.9 | 18 | 22 | 76 | 32,889 | 3595 | 1108 | 32 | 797 | 5777 | 60 | 22 | 987 |
| R10 | 3.8 | 160 | 4383 | 3745 | 3.1 | 15 | 33 | 76 | 30,665 | 3853 | 843 | 31 | 680 | 4374 | 68 | 38 | 592 |
| R11 | 7.3 | 125 | 4958 | 3954 | 7.0 | 15 | 17 | 68 | 34,018 | 3489 | 1192 | 28 | 663 | 7584 | 48 | 18 | 924 |
| R12 | 4.9 | 124 | 5105 | 4036 | 4.9 | 16 | 22 | 102 | 39,019 | 3744 | 1033 | 34 | 738 | 5471 | 74 | 25 | 1029 |
| R13 | 5.8 | 137 | 5425 | 4475 | 5.2 | 16 | 20 | 222 | 38,069 | 3653 | 1077 | 33 | 694 | 6302 | 77 | 23 | 1010 |
| R14 | 10.0 | 137 | 3865 | 3723 | 8.2 | 16 | 19 | 75 | 33,385 | 3398 | 1240 | 29 | 750 | 11871 | 47 | 20 | 985 |
| R15 | 5.0 | 116 | 1717 | 3364 | 4.3 | 18 | 19 | 71 | 35,769 | 3586 | 981 | 33 | 657 | 5777 | 30 | 23 | 911 |
| R16 | 5.9 | 156 | 3173 | 5432 | 5.3 | 18 | 20 | 76 | 35,435 | 3918 | 1264 | 33 | 674 | 6788 | 48 | 23 | 1003 |
| R17 | 2.9 | 114 | 349 | 1522 | 3.0 | 13 | 24 | 60 | 28,607 | 2935 | 711 | 36 | 814 | 3222 | 20 | 32 | 554 |
| C1 | 2.8 | 186 | 1240 | 3215 | 4.3 | 12 | 15 | 41 | 22,977 | 2693 | 785 | 20 | 532 | 3254 | 24 | 18 | 687 |
| C2 | 3.1 | 105 | 2907 | 4713 | 3.7 | 12 | 31 | 44 | 23,681 | 2985 | 643 | 32 | 738 | 3873 | 51 | 21 | 582 |
| C3 | 4.5 | 109 | 4189 | 3011 | 3.6 | 11 | 20 | 48 | 19,725 | 2395 | 689 | 18 | 465 | 4826 | 56 | 13 | 583 |
| C4 | 9.5 | 45 | 11762 | 2395 | 12.5 | 15 | 19 | 59 | 39,207 | 3195 | 1167 | 26 | 482 | 15,533 | 172 | 18 | 1794 |
| C5 | 3.9 | 120 | 2610 | 3678 | 3.7 | 12 | 25 | 58 | 24,780 | 3029 | 627 | 27 | 689 | 4566 | 41 | 17 | 693 |
| C6 | 3.4 | 93 | 3762 | 2015 | 2.7 | 10 | 20 | 35 | 20,338 | 2434 | 590 | 19 | 482 | 3295 | 53 | 17 | 422 |
| C7 | 2.8 | 91 | 2702 | 2972 | 3.3 | 10 | 24 | 46 | 21,273 | 2693 | 481 | 22 | 757 | 2925 | 43 | 18 | 596 |
| C8 | 2.9 | 95 | 2891 | 3022 | 3.2 | 10 | 24 | 46 | 20,201 | 2503 | 517 | 21 | 710 | 3066 | 47 | 17 | 558 |
| C9 | 4.2 | 100 | 4141 | 2974 | 3.9 | 10 | 26 | 43 | 21,364 | 2526 | 544 | 24 | 708 | 3838 | 60 | 19 | 588 |
| Live-bed | |||||||||||||||||
| G1 | 3.2 | 113 | 432 | 910 | 1.2 | 14 | 14 | 109 | 19,747 | 1412 | 1205 | 20 | 396 | 2644 | 13 | 15 | 212 |
| G2 | 3.8 | 100 | 474 | 601 | 2.1 | 12 | 12 | 46 | 21,064 | 1089 | 1303 | 18 | 358 | 3598 | 13 | 15 | 342 |
| G3 | 3.7 | 180 | 908 | 549 | 1.2 | 12 | 11 | 329 | 22,189 | 1114 | 962 | 20 | 378 | 3007 | 16 | 12 | 270 |
| G4 | 8.8 | 180 | 1149 | 3132 | 5.8 | 32 | 17 | 361 | 28,782 | 1988 | 4660 | 47 | 585 | 7391 | 27 | 19 | 593 |
| G5 | 4.1 | 197 | 575 | 504 | 1.2 | 13 | 12 | 223 | 26,245 | 1198 | 736 | 22 | 462 | 3599 | 14 | 13 | 309 |
| G6 | 4.4 | 126 | 2244 | 1022 | 1.8 | 19 | 17 | 244 | 31,657 | 1855 | 1542 | 36 | 518 | 3579 | 34 | 18 | 329 |
| G7 | 3.4 | 132 | 1138 | 848 | 2.5 | 17 | 16 | 200 | 27,020 | 1672 | 1501 | 33 | 451 | 4589 | 23 | 18 | 343 |
| G8 | 3.4 | 110 | 719 | 1009 | 2.7 | 11 | 18 | 53 | 26,541 | 3065 | 712 | 28 | 538 | 3909 | 17 | 22 | 354 |
| G9 | 4.3 | 100 | 655 | 2235 | 2.9 | 11 | 16 | 35 | 19,156 | 2696 | 702 | 24 | 548 | 5983 | 21 | 21 | 303 |
| G10 | 2.6 | 92 | 233 | 1393 | 1.7 | 11 | 12 | 46 | 21,387 | 2412 | 545 | 25 | 513 | 3942 | 12 | 13 | 269 |
| G11 | 6.7 | 105 | 801 | 2280 | 4.3 | 14 | 19 | 59 | 39,565 | 3076 | 1124 | 31 | 636 | 6940 | 21 | 21 | 942 |
| G12 | 4.1 | 88 | 499 | 1777 | 4.4 | 13 | 15 | 54 | 29,017 | 2778 | 840 | 27 | 575 | 4246 | 12 | 18 | 635 |
| G13 | 4.4 | 125 | 486 | 2318 | 3.0 | 14 | 16 | 103 | 33,253 | 2892 | 843 | 32 | 723 | 5083 | 19 | 20 | 695 |
| G14 | 2.8 | 104 | 377 | 1751 | 3.4 | 14 | 15 | 50 | 33,853 | 2862 | 933 | 30 | 639 | 3922 | 12 | 17 | 781 |
| G15 | 2.5 | 118 | 866 | 1872 | 2.7 | 12 | 21 | 51 | 32,584 | 3049 | 806 | 30 | 635 | 3584 | 27 | 25 | 640 |
| G16 | 7.6 | 161 | 2881 | 3255 | 6.7 | 13 | 16 | 61 | 27,353 | 2869 | 1116 | 25 | 591 | 8816 | 35 | 18 | 706 |
| G17 | 1.7 | 129 | 218 | 1184 | 2.4 | 12 | 17 | 39 | 28,185 | 2606 | 666 | 25 | 579 | 2378 | 12 | 20 | 522 |
| G18 | 2.9 | 106 | 304 | 1355 | 2.7 | 13 | 18 | 50 | 33,025 | 2656 | 740 | 29 | 622 | 3582 | 13 | 20 | 649 |
| G19 | 2.3 | 102 | 346 | 1499 | 3.0 | 14 | 18 | 47 | 35,642 | 2937 | 864 | 33 | 632 | 3364 | 14 | 19 | 709 |
| G20 | 2.6 | 156 | 237 | 1284 | 2.5 | 13 | 20 | 61 | 33,697 | 2767 | 680 | 31 | 614 | 3490 | 15 | 25 | 608 |
| G21 | 2.0 | 92 | 129 | 975 | 1.8 | 12 | 16 | 54 | 24,534 | 2490 | 552 | 24 | 551 | 2285 | 10 | 18 | 463 |
| G22 | 1.9 | 67 | 193 | 891 | 2.4 | 8 | 10 | 34 | 20,390 | 1935 | 456 | 20 | 419 | 2531 | 7 | 12 | 409 |
| G23 | 2.0 | 77 | 149 | 893 | 2.7 | 9 | 11 | 35 | 25,326 | 2032 | 546 | 23 | 471 | 2785 | 6 | 13 | 465 |
| G24 | 2.0 | 65 | 224 | 1057 | 3.2 | 10 | 13 | 27 | 22,784 | 2341 | 705 | 22 | 515 | 2640 | 9 | 15 | 436 |
| G25 | 2.4 | 78 | 324 | 1158 | 2.9 | 9 | 12 | 49 | 24,535 | 2497 | 571 | 23 | 557 | 3005 | 10 | 14 | 418 |
| R1 | 0.1 | 18 | 904 | 434 | 0.1 | 11 | 23 | 18 | 37,278 | 3277 | 330 | 27 | 483 | 309 | 18 | 19 | 81 |
| R2 | 0.7 | 15 | 1649 | 522 | 0.3 | 10 | 22 | 14 | 31,087 | 2902 | 296 | 26 | 400 | 1125 | 27 | 19 | 88 |
| R3 | 8.2 | 59 | 12671 | 1542 | 4.3 | 15 | 19 | 81 | 34,753 | 2899 | 692 | 27 | 465 | 10,511 | 173 | 17 | 619 |
| R4 | 3.2 | 23 | 10310 | 1365 | 2.6 | 10 | 21 | 23 | 34,266 | 3193 | 615 | 28 | 467 | 5433 | 146 | 19 | 635 |
| R5 | 0.7 | 20 | 1592 | 630 | 2.3 | 10 | 22 | 19 | 35,946 | 3337 | 528 | 28 | 482 | 1677 | 25 | 18 | 619 |
| R6 | 1.3 | 23 | 8966 | 1523 | 4.4 | 13 | 20 | 20 | 29,753 | 2616 | 1233 | 28 | 460 | 2568 | 115 | 20 | 830 |
| R7 | 3.3 | 85 | 1531 | 1709 | 2.4 | 10 | 19 | 49 | 28,013 | 2716 | 417 | 26 | 727 | 3164 | 26 | 17 | 567 |
| R8 | 4.1 | 115 | 3591 | 5159 | 5.2 | 16 | 28 | 59 | 31,304 | 3690 | 954 | 32 | 989 | 3607 | 61 | 26 | 912 |
| R9 | 4.7 | 85 | 1446 | 4053 | 3.9 | 14 | 22 | 56 | 33,905 | 4047 | 886 | 32 | 728 | 3696 | 28 | 24 | 760 |
| R10 | 4.1 | 147 | 3125 | 4603 | 4.6 | 16 | 23 | 85 | 32,557 | 4054 | 1052 | 32 | 798 | 4998 | 51 | 25 | 723 |
| R11 | 10.9 | 174 | 3440 | 6098 | 9.0 | 18 | 10 | 83 | 37,289 | 3852 | 1855 | 28 | 606 | 10,606 | 40 | 12 | 1350 |
| R12 | 3.9 | 95 | 1046 | 2595 | 7.0 | 17 | 20 | 58 | 39,933 | 3268 | 1516 | 38 | 712 | 4413 | 22 | 24 | 1087 |
| R13 | 3.6 | 107 | 862 | 3361 | 5.2 | 16 | 22 | 57 | 40,213 | 3645 | 1022 | 36 | 713 | 4995 | 22 | 25 | 1038 |
| R14 | 4.6 | 90 | 1850 | 2997 | 5.0 | 12 | 19 | 43 | 25,852 | 3166 | 823 | 23 | 573 | 5312 | 26 | 19 | 673 |
| R15 | 4.2 | 104 | 1848 | 3310 | 5.3 | 15 | 21 | 56 | 36,510 | 3522 | 1061 | 34 | 709 | 4584 | 33 | 24 | 975 |
| R16 | 3.2 | 100 | 537 | 2492 | 4.0 | 17 | 19 | 49 | 31,106 | 3235 | 1007 | 33 | 645 | 3423 | 14 | 20 | 865 |
| R17 | 4.1 | 118 | 348 | 3874 | 3.3 | 17 | 19 | 60 | 28,578 | 3629 | 946 | 39 | 856 | 5243 | 23 | 24 | 520 |
| C1 | 6.7 | 168 | 5579 | 1163 | 2.3 | 14 | 14 | 98 | 28,353 | 1898 | 686 | 28 | 481 | 10,282 | 66 | 17 | 462 |
| C2 | 3.2 | 231 | 1122 | 1819 | 5.0 | 12 | 13 | 53 | 27,583 | 2288 | 765 | 24 | 532 | 3916 | 18 | 15 | 805 |
| C3 | 3.1 | 119 | 2491 | 3822 | 4.7 | 13 | 37 | 48 | 18,652 | 2399 | 454 | 30 | 1111 | 3634 | 50 | 20 | 642 |
| C4 | 3.8 | 110 | 4669 | 5346 | 4.6 | 9 | 44 | 61 | 19,855 | 3019 | 407 | 32 | 1251 | 4631 | 74 | 19 | 688 |
| C5 | 3.6 | 148 | 2767 | 5043 | 7.1 | 13 | 63 | 57 | 22,207 | 3058 | 689 | 39 | 1575 | 4784 | 57 | 20 | 888 |
| C6 | 6.4 | 197 | 8727 | 5604 | 7.7 | 9 | 38 | 59 | 22,070 | 2354 | 415 | 21 | 839 | 7022 | 128 | 15 | 911 |
| C7 | 5.4 | 144 | 7741 | 2693 | 6.8 | 11 | 27 | 58 | 23,684 | 2387 | 545 | 24 | 805 | 4071 | 105 | 18 | 781 |
| C8 | 4.6 | 105 | 10539 | 2704 | 5.4 | 8 | 36 | 36 | 21,741 | 2145 | 313 | 28 | 526 | 4211 | 136 | 17 | 582 |
| C9 | 3.1 | 93 | 3735 | 2754 | 3.7 | 8 | 20 | 45 | 17,753 | 2346 | 393 | 19 | 560 | 2824 | 54 | 15 | 490 |
| Element | Min. | Max. | Mean | Median | Range | Std. Deviation | Variance | Skewness | Kurtosis | Crust Clarke Values | Acid Rocks |
| Ag | 0 | 12 | 5 | 4 | 12 | 3 | 7 | 0.78 | 0.33 | 0.10 | 0.15 |
| As | 9 | 192 | 116 | 124 | 182 | 44 | 1.978 | −0.92 | 0.71 | 5 | 2 |
| Ba | 349 | 11,762 | 2622 | 1717 | 11,414 | 2203 | 4,852,462 | 1.85 | 4.92 | 260 | 830 |
| Ca | 545 | 5432 | 2472 | 2395 | 4887 | 1243 | 1,544,183 | 0.42 | −0.39 | 36,300 | - |
| Cd | 0 | 12 | 4 | 4 | 12 | 2 | 5 | 1.69 | 4.92 | 0.15 | 0.10 |
| Co | 10 | 31 | 14 | 14 | 21 | 4 | 13 | 2.09 | 8.31 | 23 | 5 |
| Cr (III-VI) | 11 | 33 | 18 | 18 | 22 | 5 | 23 | 0.83 | 1.09 | 200 | 25 |
| Cu | 14 | 432 | 90 | 63 | 418 | 85 | 7196 | 2.62 | 6.72 | 70 | 30 |
| Fe | 18,736 | 39,207 | 28,724 | 28,607 | 20,471 | 5308 | 28,173,431 | 0.03 | −0.79 | 50,000 | - |
| Mg | 1049 | 3918 | 2704 | 2778 | 2869 | 705 | 497,429 | −0.69 | 0.15 | 20,900 | - |
| Mn | 326 | 4492 | 999 | 894 | 4166 | 611 | 373,780 | 4.08 | 21.61 | 1000 | 600 |
| Ni | 18 | 46 | 27 | 26 | 28 | 5 | 29 | 0.74 | 1.44 | 80 | 8 |
| P | 357 | 814 | 583 | 590 | 457 | 115 | 13,332 | 0.03 | −0.98 | 180 | 700 |
| Pb | 358 | 15,533 | 5452 | 4646 | 15,175 | 3010 | 9,061,307 | 1.36 | 2.40 | 16 | 2 |
| Sr | 13 | 172 | 42 | 31 | 159 | 28 | 759 | 2.66 | 10.77 | 300 | 300 |
| V | 10 | 38 | 18 | 17 | 27 | 5 | 25 | 1.66 | 4.97 | 150 | 40 |
| Zn | 72 | 1794 | 659 | 596 | 1723 | 318 | 101,411 | 1.36 | 3.94 | 132 | 60 |
| Element | Enrichment Factor (crust) | Enrichment Factor (acid rocks) | Generic Reference Levels in Andalucia | Dutch Regulations for Standard Soils Intervention Value | |||||||
| Industrial | Urban | Others | |||||||||
| Ag | 94 | 37 | - | - | - | - | |||||
| As | 47 | 93 | 40 | 36 | 36 | 76 | |||||
| Ba | 20 | 3.79 | 10,000 | 10,000 | 10,000 | 625 | |||||
| Ca | 0.14 | - | - | - | - | - | |||||
| Cd | 54 | 48 | 750 | 75 | 25 | 13 | |||||
| Co | 1.24 | 3.39 | 250 | 25 | 24 | 190 | |||||
| Cr (III-VI) | 0.18 | 0.87 | 10,000–100 | 10,000–20 | 10,000–20 | 180–78 | |||||
| Cu | 2.60 | 3.60 | 10,000 | 3130 | 595 | 190 | |||||
| Fe | 1.16 | - | - | - | - | - | |||||
| Mg | 0.26 | - | - | - | - | - | |||||
| Mn | 2.02 | 2.00 | - | - | - | - | |||||
| Ni | 0.68 | 4.04 | 10,000 | 1530 | 1530 | 100 | |||||
| P | 1 | 1 | - | - | - | - | |||||
| Pb | 689 | 3272 | 2750 | 275 | 275 | 530 | |||||
| Sr | 0.28 | 0.17 | - | - | - | - | |||||
| V | 0.24 | 0.54 | 3650 | 365 | 50 | - | |||||
| Zn | 10 | 13 | 10,000 | 10,000 | 10,000 | 720 | |||||
| (a) Live-Bed | (b) Floodplain | ||||||||
|---|---|---|---|---|---|---|---|---|---|
| Variable | Component | Variable | Component | ||||||
| 1 | 2 | 3 | 4 | 1 | 2 | 3 | 4 | ||
| Mn | 0.860 | 0.233 | −0.113 | −0.002 | Ba | 0.919 | −0.055 | 0.143 | −0.113 |
| Co | 0.855 | 0.413 | −0.023 | −0.019 | Sr | 0.893 | −0.047 | 0.261 | −0.164 |
| Cu | 0.822 | −0.260 | −0.125 | −0.099 | Cd | 0.890 | 0.181 | −0.038 | 0.270 |
| As | 0.667 | −0.292 | 0.350 | 0.054 | Pb | 0.825 | 0.218 | −0.251 | 0.273 |
| Fe | 0.130 | 0.866 | −0.251 | 0.096 | Zn | 0.784 | 0.200 | 0.259 | 0.230 |
| Mg | −0.214 | 0.837 | 0.308 | 0.127 | Ag | 0.769 | 0.283 | −0.214 | 0.421 |
| V | −0.037 | 0.755 | 0.313 | −0.139 | Co | 0.176 | 0.928 | 0.097 | 0.197 |
| Ni | 0.451 | 0.675 | 0.327 | −0.106 | Mn | 0.124 | 0.917 | −0.186 | 0.115 |
| Zn | 0.117 | 0.609 | 0.426 | 0.395 | Cu | 0.108 | 0.884 | −0.111 | 0.121 |
| P | −0.016 | 0.186 | 0.943 | −0.022 | Ni | −0.049 | 0.842 | 0.443 | 0.112 |
| Cr | −0.200 | 0.029 | 0.860 | 0.161 | Fe | 0.358 | 0.527 | 0.508 | −0.147 |
| Ca | 0.182 | 0.280 | 0.783 | 0.356 | V | −0.042 | 0.215 | 0.820 | 0.037 |
| Cd | 0.245 | 0.277 | 0.579 | 0.552 | Mg | 0.210 | −0.038 | 0.819 | 0.143 |
| Ba | −0.209 | −0.059 | 0.097 | 0.875 | Cr | −0.052 | −0.186 | 0.786 | −0.087 |
| Sr | −0.214 | −0.033 | 0.172 | 0.842 | P | 0.068 | 0.144 | 0.657 | 0.596 |
| Pb | 0.468 | 0.140 | 0.047 | 0.727 | As | 0.100 | 0.374 | −0.099 | 0.845 |
| Ag | 0.641 | 0.070 | 0.105 | 0.667 | Ca | 0.414 | −0.030 | 0.431 | 0.692 |
| % Var | 21.92% | 20.25% | 19.56% | 18.42% | % Var | 27.91% | 23.05% | 19.79% | 12.31% |
© 2020 by the authors. Licensee MDPI, Basel, Switzerland. This article is an open access article distributed under the terms and conditions of the Creative Commons Attribution (CC BY) license (http://creativecommons.org/licenses/by/4.0/).
Share and Cite
Mendoza, R.; Martínez, J.; Rey, J.; Hidalgo, M.C.; Campos-Suñol, M.J. Metal(loid)s Transport in Hydrographic Networks of Mining Basins: The Case of the La Carolina Mining District (Southeast Spain). Geosciences 2020, 10, 391. https://doi.org/10.3390/geosciences10100391
Mendoza R, Martínez J, Rey J, Hidalgo MC, Campos-Suñol MJ. Metal(loid)s Transport in Hydrographic Networks of Mining Basins: The Case of the La Carolina Mining District (Southeast Spain). Geosciences. 2020; 10(10):391. https://doi.org/10.3390/geosciences10100391
Chicago/Turabian StyleMendoza, Rosendo, Julián Martínez, Javier Rey, M. Carmen Hidalgo, and M. José Campos-Suñol. 2020. "Metal(loid)s Transport in Hydrographic Networks of Mining Basins: The Case of the La Carolina Mining District (Southeast Spain)" Geosciences 10, no. 10: 391. https://doi.org/10.3390/geosciences10100391