Relation between the Friction Angle of Sand at Triaxial Compression and Triaxial Extension and Plane Strain Conditions


Department of Geotechnics and Structural Mechanics, Faculty of Civil Engineering and Environmental Sciences, Bialystok University of Technology, 15-351 Bialystok, Poland
Geosciences 2020, 10(1), 29; https://doi.org/10.3390/geosciences10010029
Submission received: 12 December 2019
/
Revised: 3 January 2020
/
Accepted: 9 January 2020
/
Published: 14 January 2020
Abstract
:The strength of sand is usually characterized by the maximum value of the secant friction angle. The friction angle is a function of deformation mode, density, and stress level and is strongly correlated with dilatancy at failure. Most often, the friction angle is evaluated from results of conventional compression tests, and correlation between the friction angle of sand at triaxial compression and triaxial extension and plane strain conditions is a vital problem of soil mechanics. These correlations can be obtained from laboratory test results. The failure criteria for sand presented in literature also give the possibility of finding correlations between friction angles for different deformation modes. The general stress-dilatancy relationship obtained from the frictional state concept, with some additional assumptions, gives the possibility of finding theoretical relationships between the friction angle of sand at triaxial compression and triaxial extension and plane strain conditions. The theoretically obtained relationships presented in the paper are fully consistent with theoretical and experimental findings of soil mechanics.
1. Introduction
The shear strength of sand is the sum of the critical state component and dilatancy component [1,2,3,4]. The critical state component is represented by the critical state friction angle (). It is commonly assumed that the critical state friction angle is independent of the deformation mode and stress level [3,4,5,6]. For siliceous sands, critical state friction angle values range between 30° and 36° depending on the sand grading and grain roundness [7]. Loose sand is compacted during shear and reaches maximum resistance at critical state (). Dense sand exhibits maximum resistance () at failure accompanied by maximum dilatancy and minimum resistance at the ultimate state ().
Triaxial drained compression (TXC) tests are most often performed in soil mechanics laboratories. Triaxial extension tests (TXE) and the plane strain condition (biaxial compression tests; BXC) are more sensitive to small errors than the triaxial compression tests are, e.g., [2,8,9,10] and are less commonly used.
Triaxial extension tests of cylindrical samples provide similar or 2°–4° higher angles of friction than cylindrical compression tests [2,11,12]. Cuboidal triaxial extension tests provide higher strength than cylindrical extension tests [11]. Compression tests at the plane strain compression (BXC) always exhibit a higher angle of friction than triaxial compression tests [4,5].
Rowe’s stress-dilatancy relationships [3,13], positively verified theoretically by Horne [14] and experimentally with some additional dilatancy conditions assumed in this paper, give the possibility of finding relationships between the angle of friction for TXC, BXC, and TXE. Bolton’s [4] relationships also give the possibility of finding relationships between angles of friction for TXC and BXC [14,15].
The general stress-dilatancy relationship obtained from the frictional state concept [16,17,18], with some assumptions for dilatancy at failure, give the possibility of finding theoretical relationships between friction angles at TXC, BXC, and TXE.
The strength criteria presented in the literature for soils also give the possibility of finding relationships between angles of friction for different deformation modes, especially TXC, BXC, and TXE. In this paper, only the Coulomb–Mohr [1], Matsuoka-Nakai [19], and Lade-Duncan [20] criteria are taken for analysis.
Primarily, for sand the correctness of stress-dilatancy relationships obtained from the frictional state concept [16,17,18] for drained conventional TXC, BXC, and TXE tests are proven by comparison with Bolton’s [4] and Rowe’s [3,13] relationships. Later, the excess of friction angles (ϕ′ − ϕ°) for BXC and TXE, as a function of excess friction angle for TXC with use of different theories, are shown. Finally, the difference between angles of friction for BXC and TXE and angle of friction for TXC, as a function of excess angle of friction for TXC, is shown. Obtained results are consistent with theoretical and experimental findings of soil mechanics.
2. Stress-Dilatancy Relationship for Sand
Rowe [3,13] presented a stress-dilatancy theory based on evaluating energy loses during shearing. He proposed the stress-dilatancy relationships in the form
and
where
and
where is the semi-empirical friction angle. For TXC, the value of ranges between and and for BXC . The value of depends on the relative density and stress level [5,6]. The minimum value when sand is sheared in the densest state and the maximum when sand is sheared in the loosest state. is the angle of friction between mineral particles of sand and is the critical state angle. Rowe also indicated that the dilatancy factor D* is equal to 1.0 for sand in the loosest state and 2.0 for sand in the densest state. This means for the loosest state at failure it is and for the densest state . For the convenience of further consideration, we sign values with subscripts c, b, and e for the TXC, BXC, and TXE deformation modes, respectively. Therefore, the stress ratios for TXC, BXC, and TXE are signed as , , , respectively, and the strain increment ratios for TXC, BXC, and TXE are signed , , and , respectively.
In this paper, it is assumed that at failure
The identical stress ratios at failure for TXC and BXC are proved by Bolton [4]. Assuming give D* = 2 in shearing of densest sand in TXC and TXE as suggested by Rowe [3,13].
In this paper, it is also assumed that
and
We can see that for the shearing of sand in the loosest state at failure, and and for the shearing of sand in the densest state , the angle , as suggested by Rowe. The strain increment ratio at failure is a function of not only density but also stress level. Therefore, we assume that Equations (4) and (5) are generally correct for sands.
Bolton [4] analyzed the stress ratios and friction angles of 17 silica sands for TXC and BXC and proposed relationships
and
where IR = ID (10 − ln p′) − 1 is the relative dilatancy index defined by Bolton [4], ID is the density index and p’ is in units of kilonewtons per square meter. Equations (6)–(8) are correct for 0 ≤ IR ≤ 4. Therefore, . These ranges of strain increment ratios are taken later for calculation.
Comparing Equations (6)–(8) we can write
where and are the angles of friction for TXC and BXC, respectively. Bolton [4] did not give a similar relationship for TXE.
Schanz and Vermeer [14,15], after analyzing Bolton’s relationship, gave the relation between friction angles for TXC and BXC in the simple form
In engineering practice, the relation between the friction angle for TXC and BXC most frequently presented in literature has the form [20]
From the frictional state concept [16] the stress ratio may be expressed by Equation
where
In the above formulas, is a critical frictional state angle, and and are new parameters of soil. For sands, and at failure, α = 0, β = 1.0 for TXC and TXE and α = 0 and β = 1.4 for BXC [16]. The θ and θε are the Lode’s angles for stresses and strain increments respectively. The parameters α and β represent the difference between current and frictional states [16,17,18]. At failure, δp′ = 0; therefore, the elastic parts of the strain increments vanish and the global strain increment is equal to the plastic strain increment, and symbol “p” is omitted in the remainder of this paper.
| , | , | , |
| , | , | , |
For TXC, θ = θε = π/6:
For TXE, θ = θε= − π/6:
For BXC, [18]
The value b at failure ranges between 0.2 and 0.3 (13° < θb < 19°) and depends on the contact conditions on the confining platens, initial porosity, and the height-to-width ratio of the sample [18,21,22]. In later calculations, it is assumed θb = 15°. The stress ratio at failure is calculated from Equation (13) with use of Equations (16)–(18).
The secant friction angle may be calculated from the following Equations:
or
In Figure 1 the friction angles as functions of strain increment ratios are shown.
The friction angles obtained from the frictional state concept are close and very close, respectively, to those calculated using Bolton’s and Rowe’s relationships. This means that the general stress-dilatancy equations obtained from the frictional state concept are correct. The correctness of this relationship was also presented in [17,18].
3. Relation between the Friction Angle of Sand at TXC, BXC, and TXE
Because the general stress-dilatancy relationship obtained from the frictional state concept is correct, it is possible to find the relation between the friction angle at TXC, BXC, and TXE. Assuming the value of the friction angle at TXC, the strain increment ratio can be back calculated. Because for a similar stress level at failure , the friction angle of sand for BXC and TXE can be calculated using the general frictional state and Bolton’s and Rowe’s stress-dilatancy relationships can be used.
The Mohr–Coulomb failure criterion assumes that intermediate stress does not influence friction angle and . Using this failure criterion in engineering practice gives a conservative solution. In practice, the most frequently used are failure criteria given by Lade and Duncan [20]
or Matsuoka-Nakai [19]
where I1, I2, I3 are invariants of the effective stress tensor. For assumed values of friction angle for TXC, the friction angles for BXC and TXE can be simply calculated and the relation between them specified.
Because stress-dilatancy relationships are functions of the critical frictional state angle, it is more convenient to use the excess of friction angles , , instead of , , .
In Figure 2, the relationships between the excess angle for BXC, as a function of the excess angle for TXC, are shown for 30°, 33°, and 36°.
The maximum excess angle for = 30° and about 11° for = 33° and 36°. Excesses of friction angles for BXC, obtained using the frictional state concept (Bolton’s and Rowe’s theories), are similar and grow with the growth of the excess friction angle for TXC.
For sand sheared in the loosest state at failure, the critical state is reached; therefore, and as obtained from the frictional state concept (Bolton’s and Rowe’s theories). The excess of friction angles for BXC obtained from the Lade-Duncan and Matsuoka-Nakai failure criteria are about 4°−5° and 5°−6°, respectively. We can see that excesses of friction angles for sand sheared at the dense state are similar. Generally, the friction angle for BXC is higher than for TXC.
A similar relation between excesses of friction angles for TXE and TXC is shown in Figure 3.
Mohr-Coulomb and Matsuoka-Nakai failure criteria assume that , and . Frictional state and Rowe’s theories give for and for . The maximum difference is 3°−4°. The Lade-Duncan failure criterion gives about 5° higher friction angle than that obtained using the frictional state and Rowe’s theories.
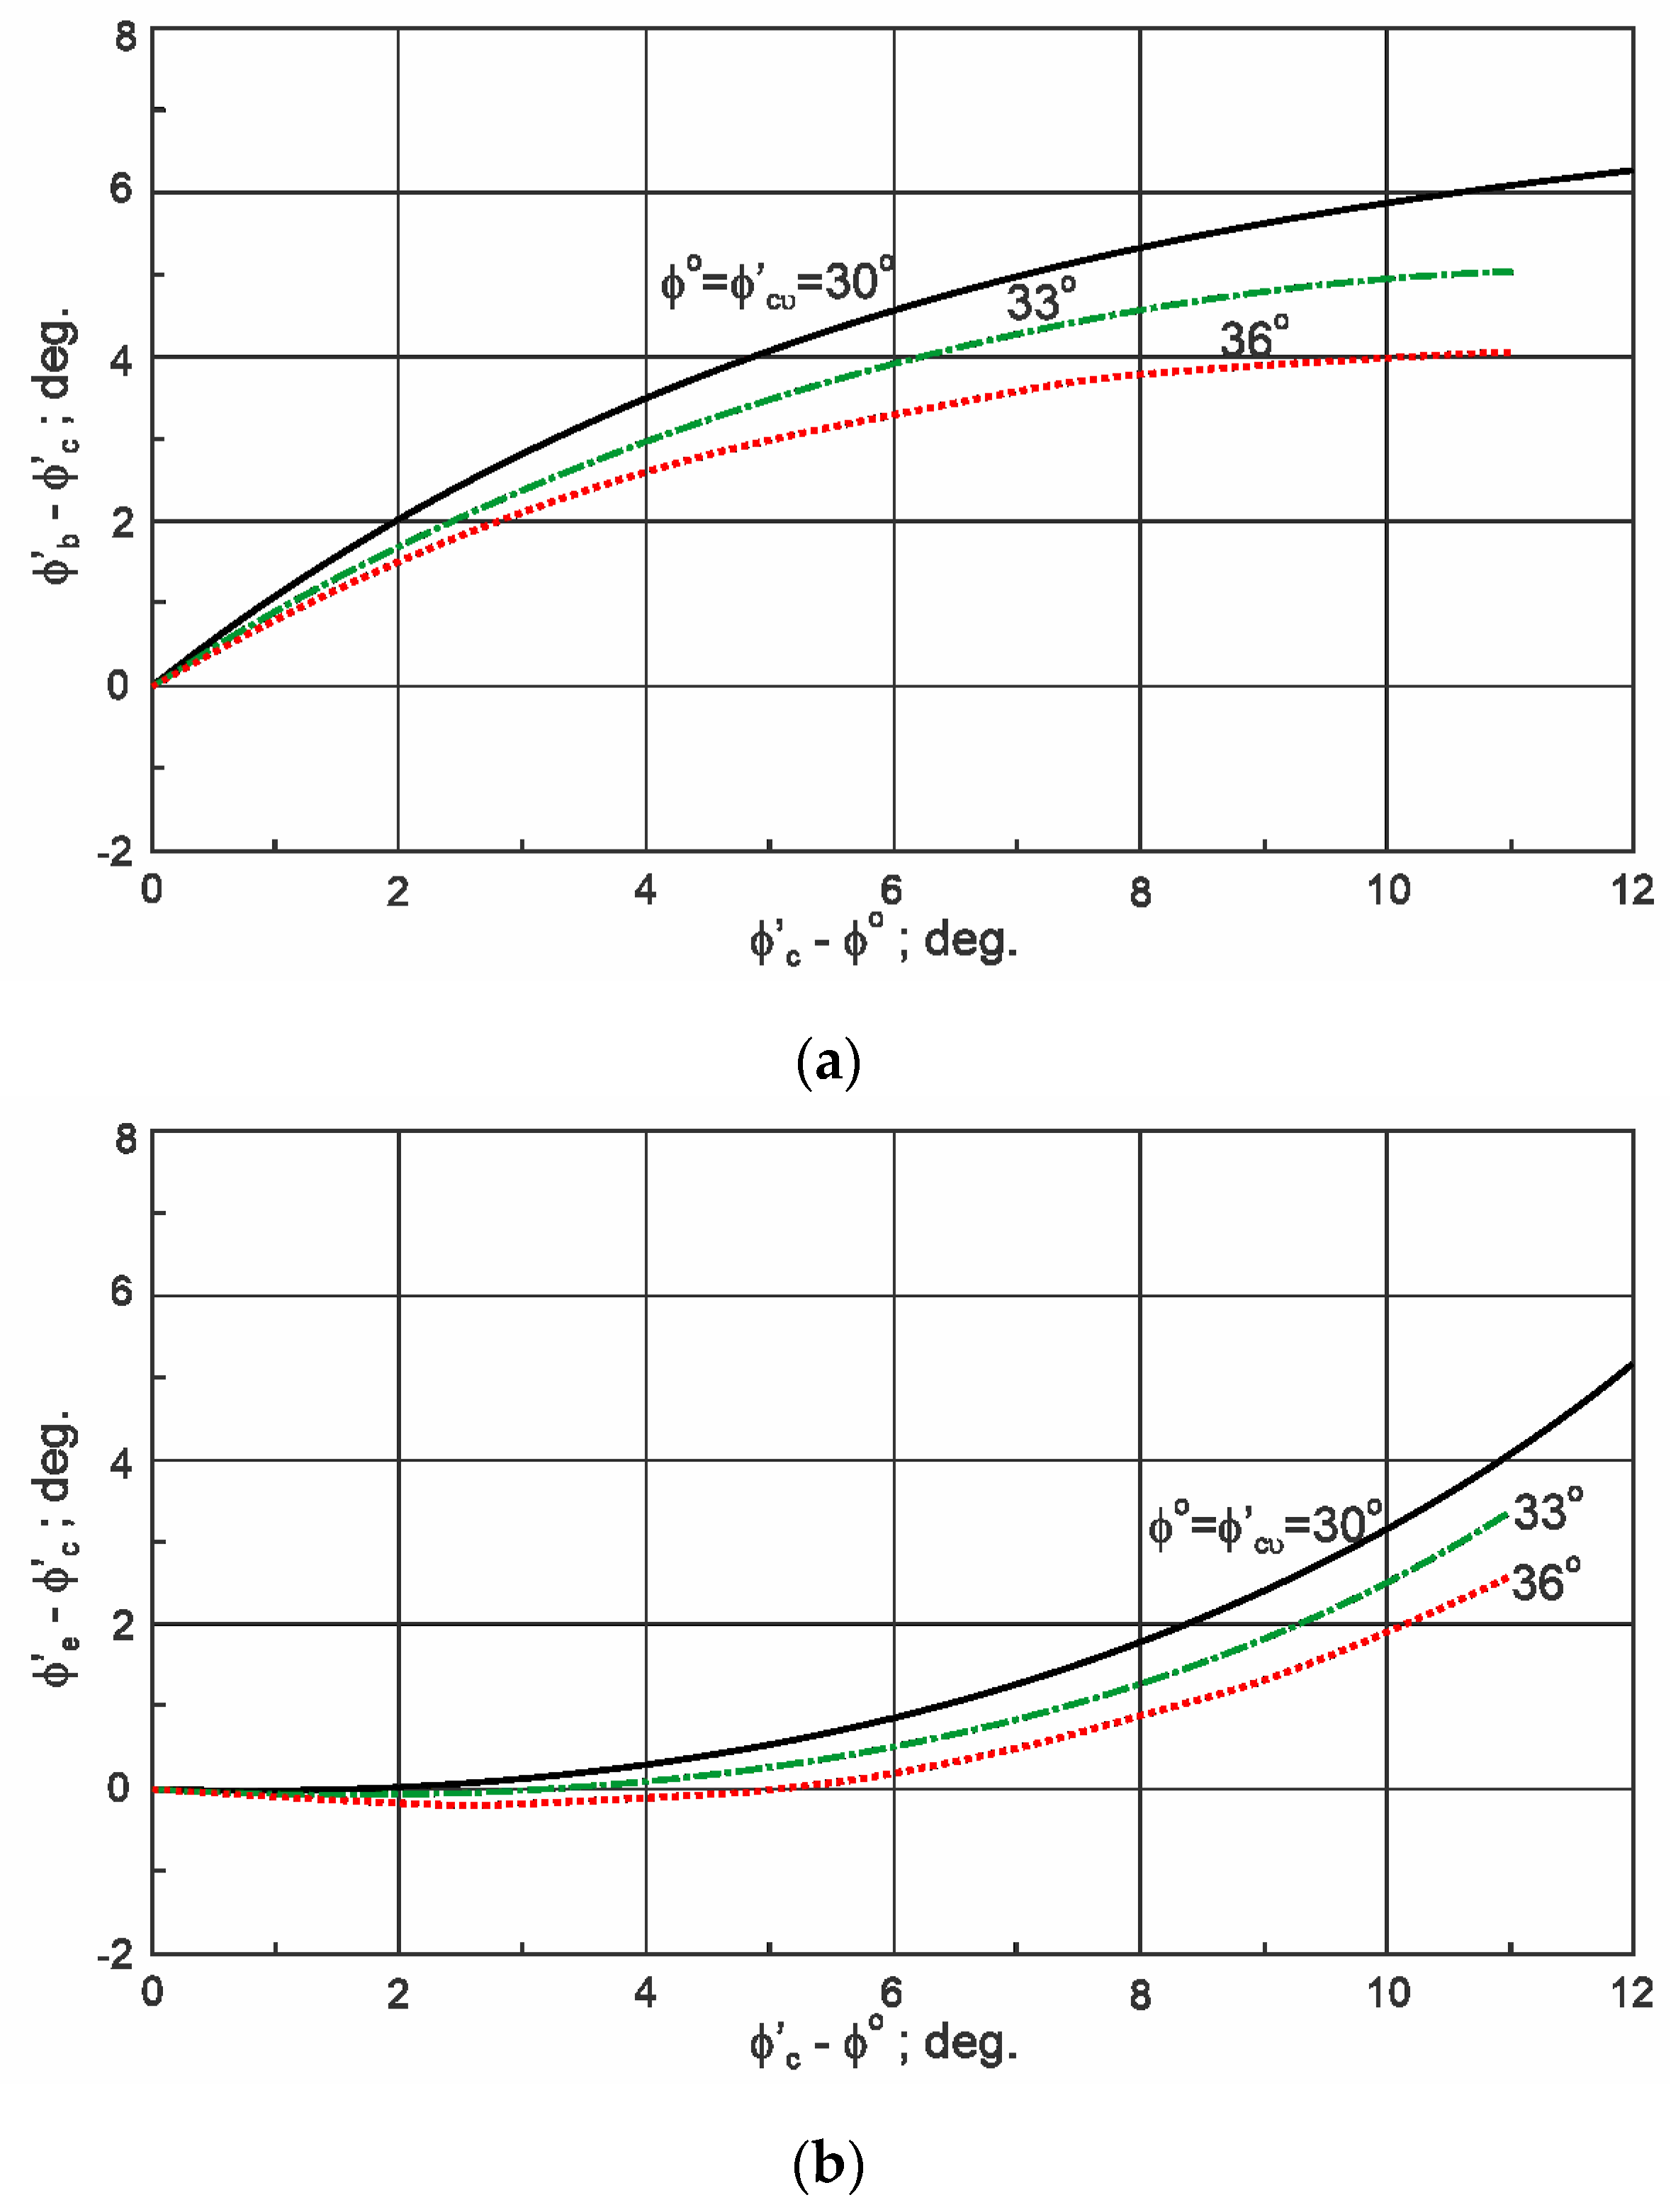
In Figure 4, the difference between friction angles for BXC and TXC as a function of the excess angle for TXC obtained using the frictional state concept is shown.
We can see that the angle of friction for BXC is always higher than that for TXC. The difference grows with the growth of the excess angle. The maximum difference is about 6°, 5°, and 4° for 30°, 33°, and 36°, respectively. For the shear of sand in the loose and medium dense states, , the friction angles for TXE and TXC are very similar. For the shear of sand in the dense state, the angle of friction for TXE is a little higher than that for TXC. The maximum difference is about 5°, 3°, and 2° for 30°, 33°, and 36°, respectively. Theoretically obtained differences between friction angles for BXC or TXE and TXC correspond with those obtained in laboratory tests [1]. In engineering practice, it is most frequently assumed that and .
4. Conclusions
The assumptions proposed in this paper, that at failure and angle in Rowe’s equations is a function of the strain increment ratio, are correct.
Friction angles calculated using the frictional state and Bolton’s and Rowe’s stress-dilatancy relationships are similar.
Relations between friction angles for drained TXC, BXC, and TXE obtained using the general stress-dilatancy equation of the frictional state concept are correct for the dilative behavior of sand during shear.
Funding
This research received no external funding.
Acknowledgments
This work, conducted at Bialystok University of Technology, Poland, was supported by the Polish Financial Resources on Science (Project No. WZ/WBiIŚ/7/2019).
Conflicts of Interest
The authors declare no conflict of interest.
References
- Taylor, D.W. Fundamentals of Soil Mechanics; John Wiley & Sons: New York, NY, USA, 1948. [Google Scholar]
- Bishop, A.W. Correspondence on shear characteristics of a saturated silt measured in triaxial compression. Géotechnique 1954, 4, 43–45. [Google Scholar] [CrossRef]
- Rowe, P.W. The stress-dilatancy relation for static equilibrium of an assembly of particles in contact. Proc. Roy. Soc. London. Ser. Math. Phys. 1962, 269, 500–527. [Google Scholar]
- Bolton, M.D. The strength and dilatancy of sands. Géotechnique 1986, 36, 65–78. [Google Scholar] [CrossRef] [Green Version]
- Cornforth, D.H. Some experiments on the influence of strain conditions on the strength of sand. Géotechnique 1964, 14, 143–167. [Google Scholar] [CrossRef]
- Wood, D.M. Soil Behavior and Critical State Soil Mechanics; Cambridge University Press: Cambridge, UK, 1990. [Google Scholar]
- Bond, A.; Harris, A. Decoding Eurocode 7; Taylor and Francis Group: London, UK, 2008. [Google Scholar]
- Das, B.M. Advanced soil mechanics, 3rd ed.; Taylor and Francis Group: London, UK, 2008. [Google Scholar]
- Corfdir, A.; Sulem, J. Comparison of extension and compression triaxial tests for dense sand and sandstone. Acta Geotech. 2008, 3, 241–246. [Google Scholar] [CrossRef]
- Kolymbas, D.; Wu, W. Recent results of triaxial tests with granular materials. Powder Technol. 1990, 60, 99–119. [Google Scholar] [CrossRef]
- Green, G.E.; Bishop, A.W. A note on the drained strength of sand under generalized strain conditions. Géotechnique 1969, 19, 144–149. [Google Scholar] [CrossRef]
- Green, G.E.; Reades, D.E. Boundary conditions, anisotropy and sample shape effects on the stress–strain behaviour of sand on triaxial compression and plane strain. Géotechnique 1975, 25, 333–356. [Google Scholar] [CrossRef]
- Rowe, P.W. The relation between shear strength of sands in triaxial compression, plane strain and direct shear. Géotechnique 1969, 19, 75–86. [Google Scholar] [CrossRef]
- Schanz, T.; Vermeer, P.A. Angles of friction and dilatancy of sand. Géotechnique 1996, 46, 145–151. [Google Scholar] [CrossRef] [Green Version]
- Schanz, T.; Vermeer, P.A. Angles of friction and dilatancy of sand. Discussion. Géotechnique 1997, 47, 887–892. [Google Scholar]
- Szypcio, Z. Stress-dilatancy for soils. Part I: The frictional state theory. Stud. Geotech. Mech. 2016, 38, 51–57. [Google Scholar] [CrossRef] [Green Version]
- Szypcio, Z. Stress-dilatancy for soils. Part II: Experimental validation for triaxial tests. Stud. Geotech. Mech. 2016, 38, 59–65. [Google Scholar] [CrossRef] [Green Version]
- Szypcio, Z. Stress-dilatancy for soils. Part III: Experimental validation for the biaxial condition. Stud. Geotech. Mech. 2017, 39, 73–90. [Google Scholar] [CrossRef] [Green Version]
- Matsuoka, H.; Nakai, T. Stress-deformation and strength characteristics of soil under three different principal stresses. In Proceedings of the Japan Society of Civil Engineers; Japan Society of Civil Engineers: Tokyo, Japan, 1974; No. 232; pp. 59–70. [Google Scholar]
- Lade, P.V.; Duncan, J.M. Cubical triaxial tests on cohesionless soil. J Soil Mech. Fdns. Div. 1973, 99, 793–811. [Google Scholar] [CrossRef]
- Pradhan, T.B.S.; Tatsuoka, F.; Horii, N. Strength and deformation characteristics of sand in torsional simple shear. Soils Found. 1988, 28, 131–148. [Google Scholar] [CrossRef] [Green Version]
- Tatsuoka, F.; Sakamoto, M.; Kawamura, T.; Fukushima, S. Strength and deformation characteristics of sand in plane strain compression at extremely low pressures. Soils Found. 1986, 1, 65–84. [Google Scholar] [CrossRef] [Green Version]
Figure 1.
Relationship between the friction angle and strain increment ratio: (a) Triaxial compressing testing, (b) Biaxial testing, (c) Triaxial extension testing.
Figure 1.
Relationship between the friction angle and strain increment ratio: (a) Triaxial compressing testing, (b) Biaxial testing, (c) Triaxial extension testing.
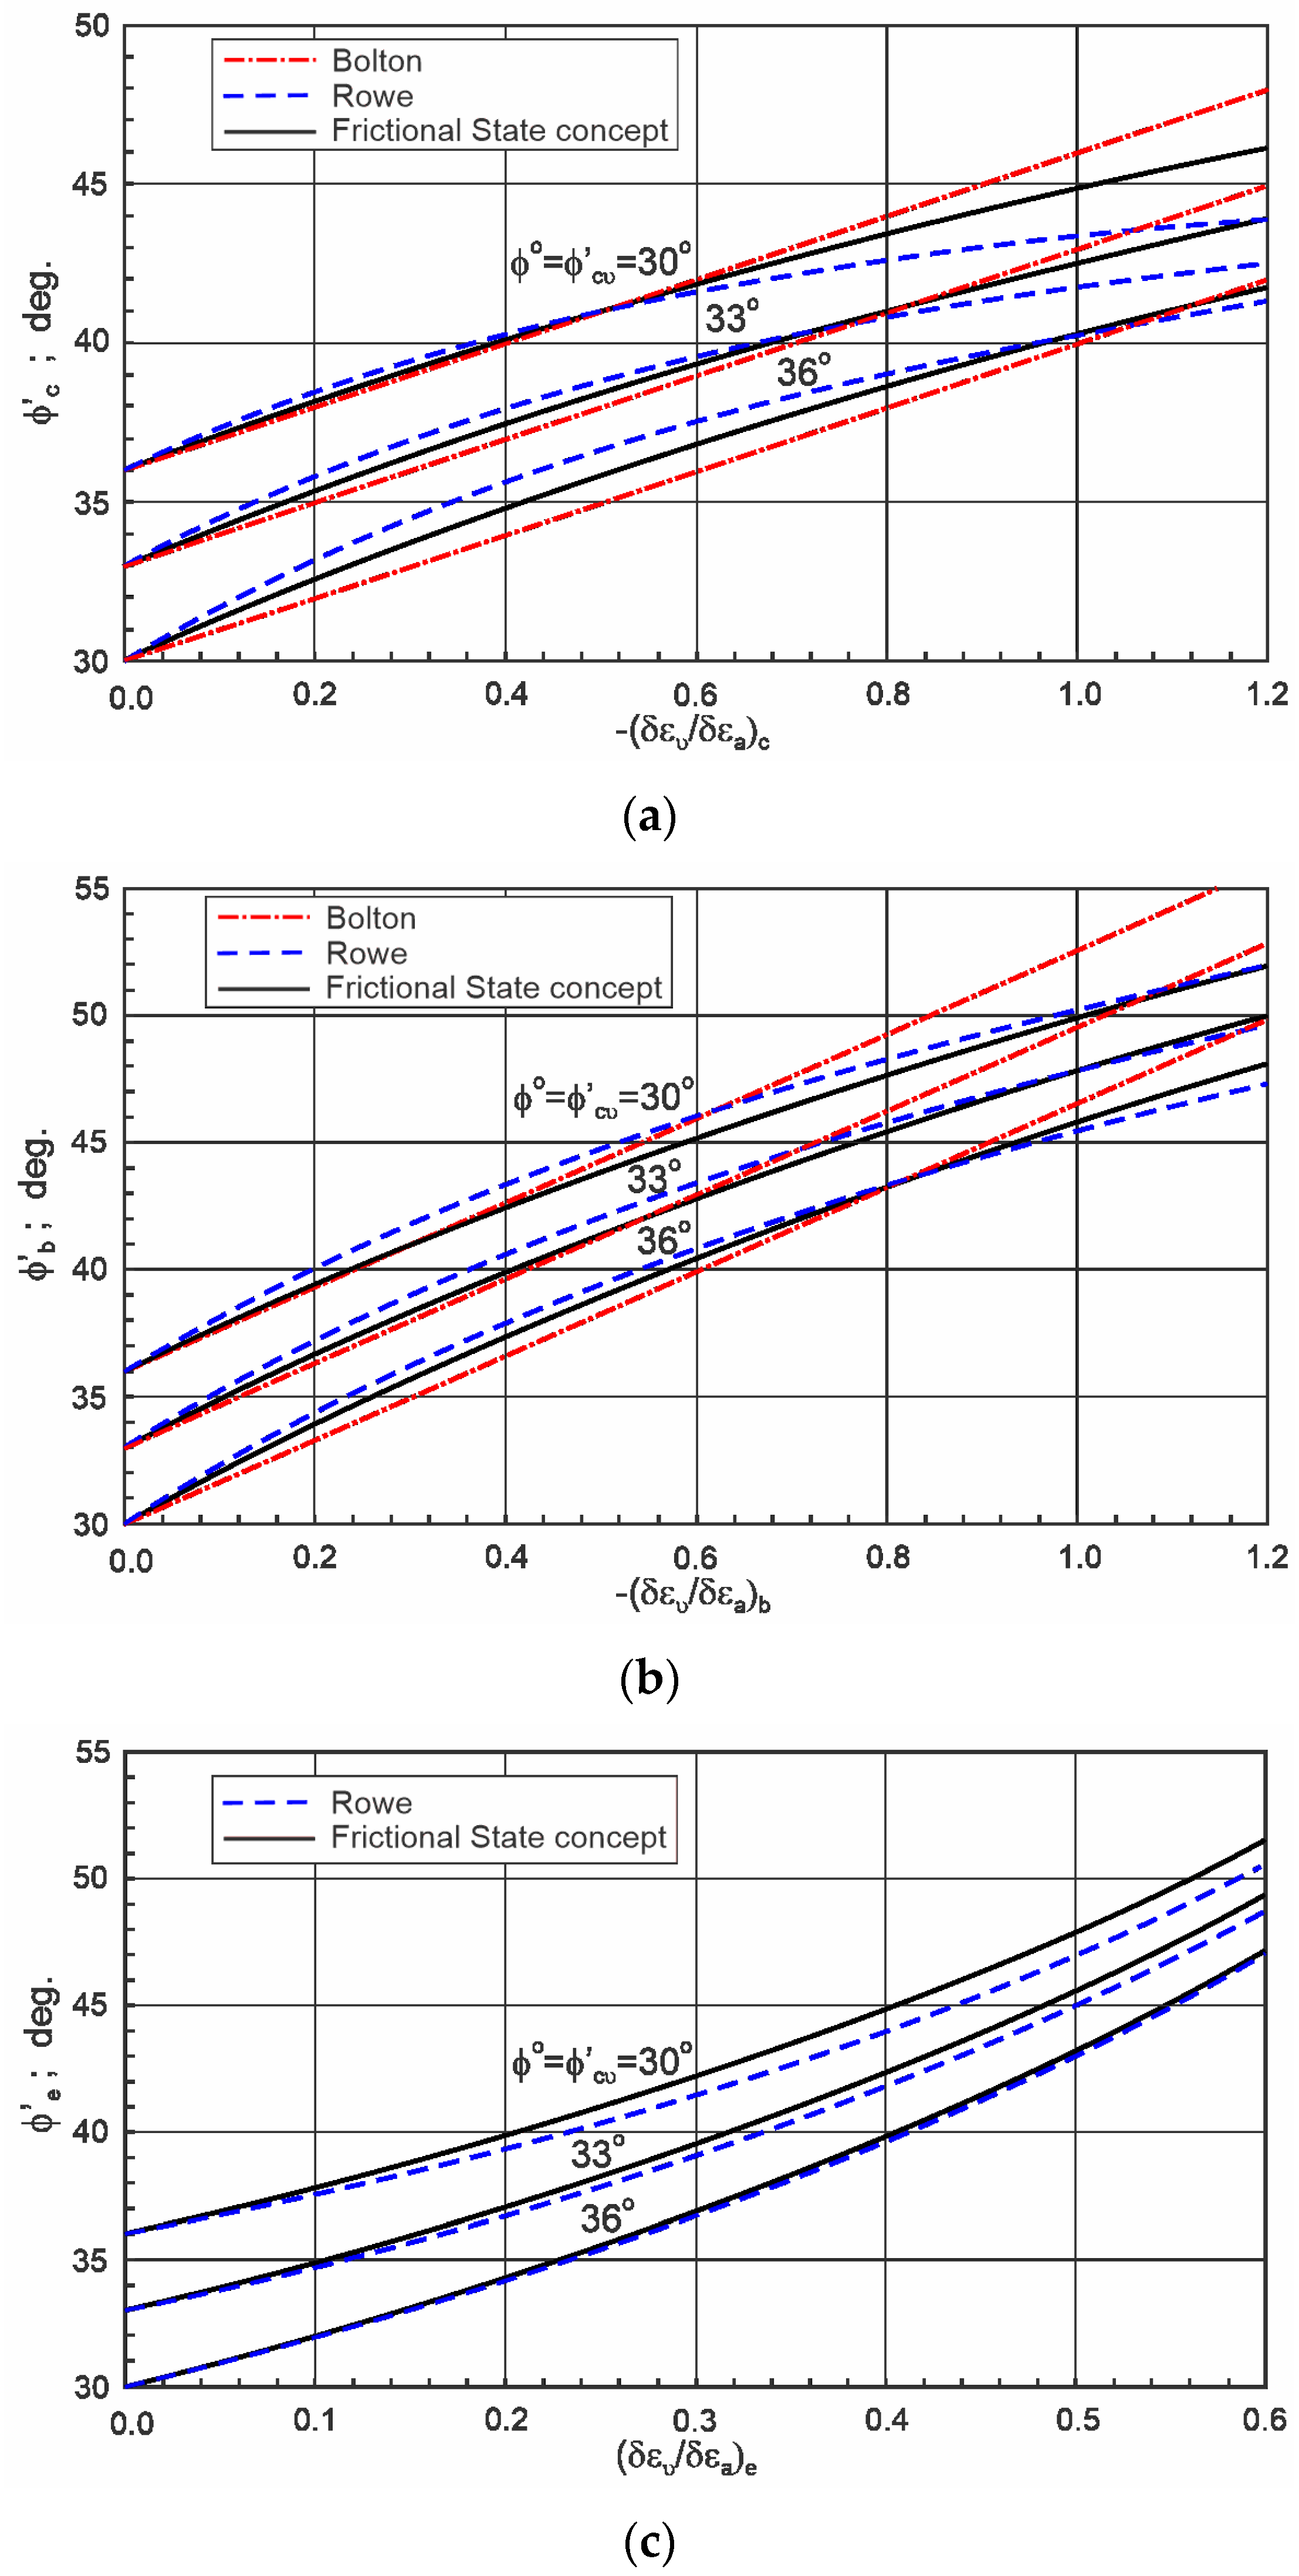
Figure 2.
Relationship between the excess of friction angle for biaxial and triaxial compression: (a) , (b) , (c) .
Figure 2.
Relationship between the excess of friction angle for biaxial and triaxial compression: (a) , (b) , (c) .
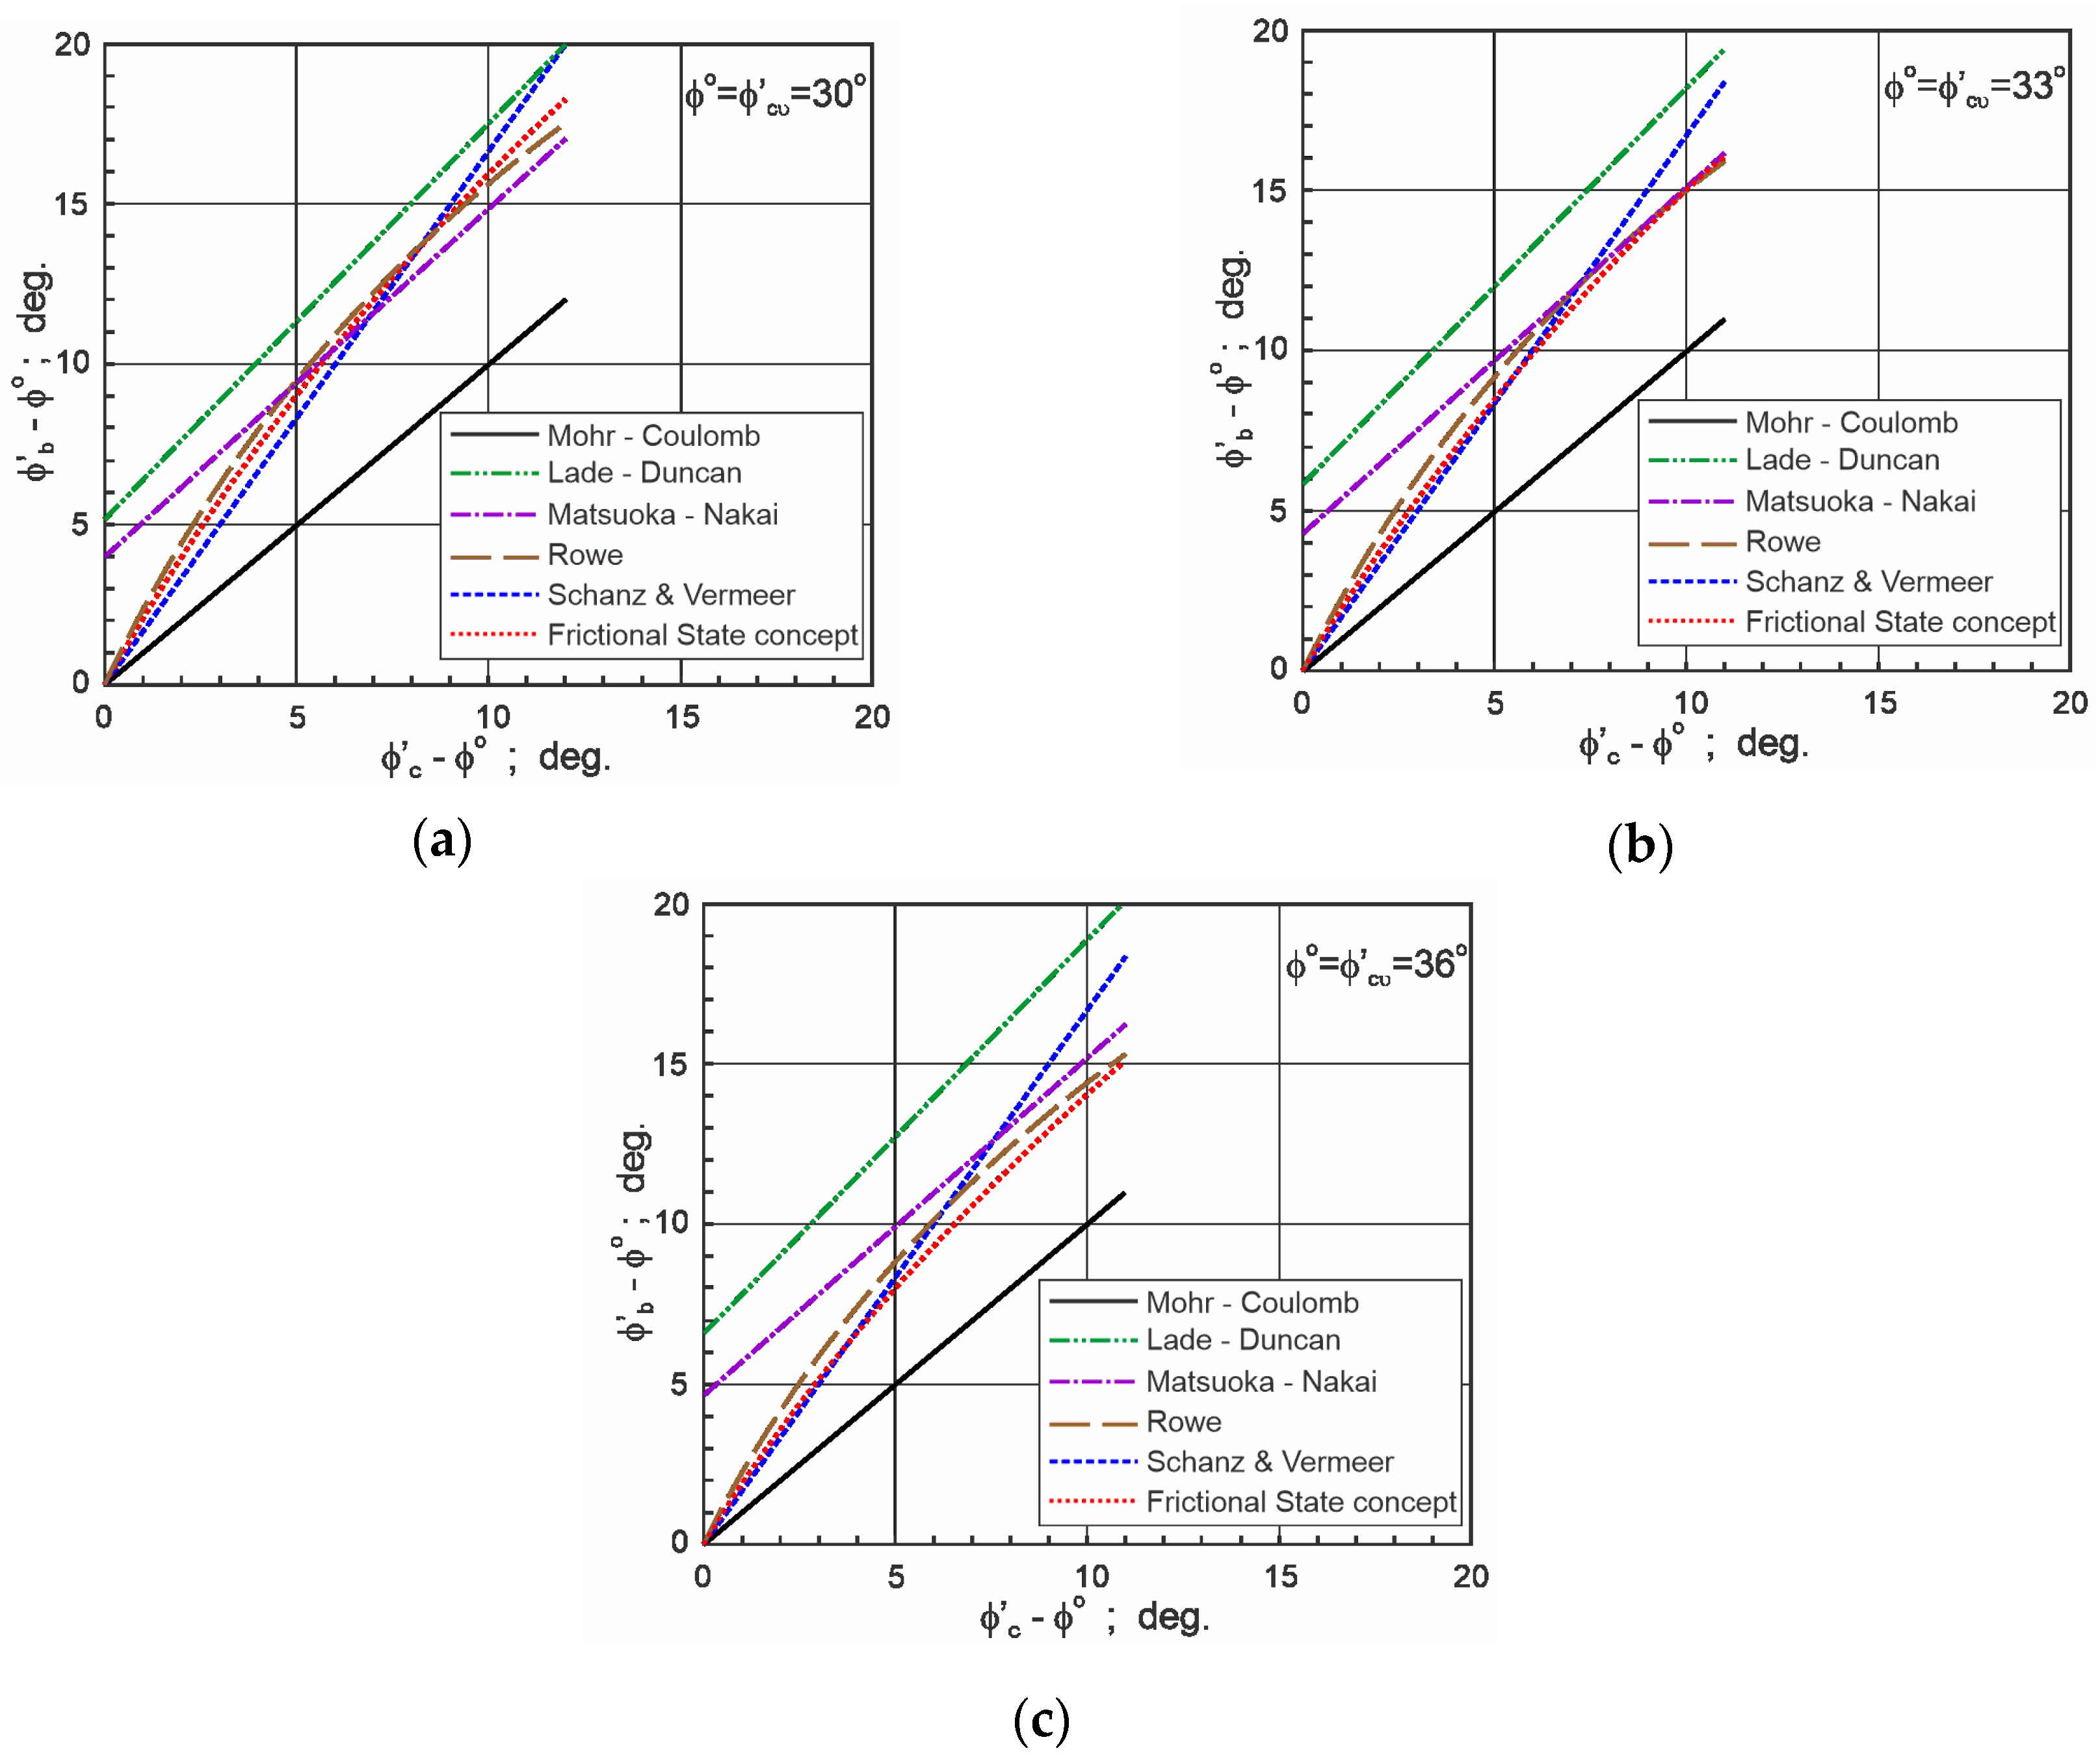
Figure 3.
Relationship between excesses of friction angles for triaxial extension and triaxial compression: (a) , (b) , (c) .
Figure 3.
Relationship between excesses of friction angles for triaxial extension and triaxial compression: (a) , (b) , (c) .
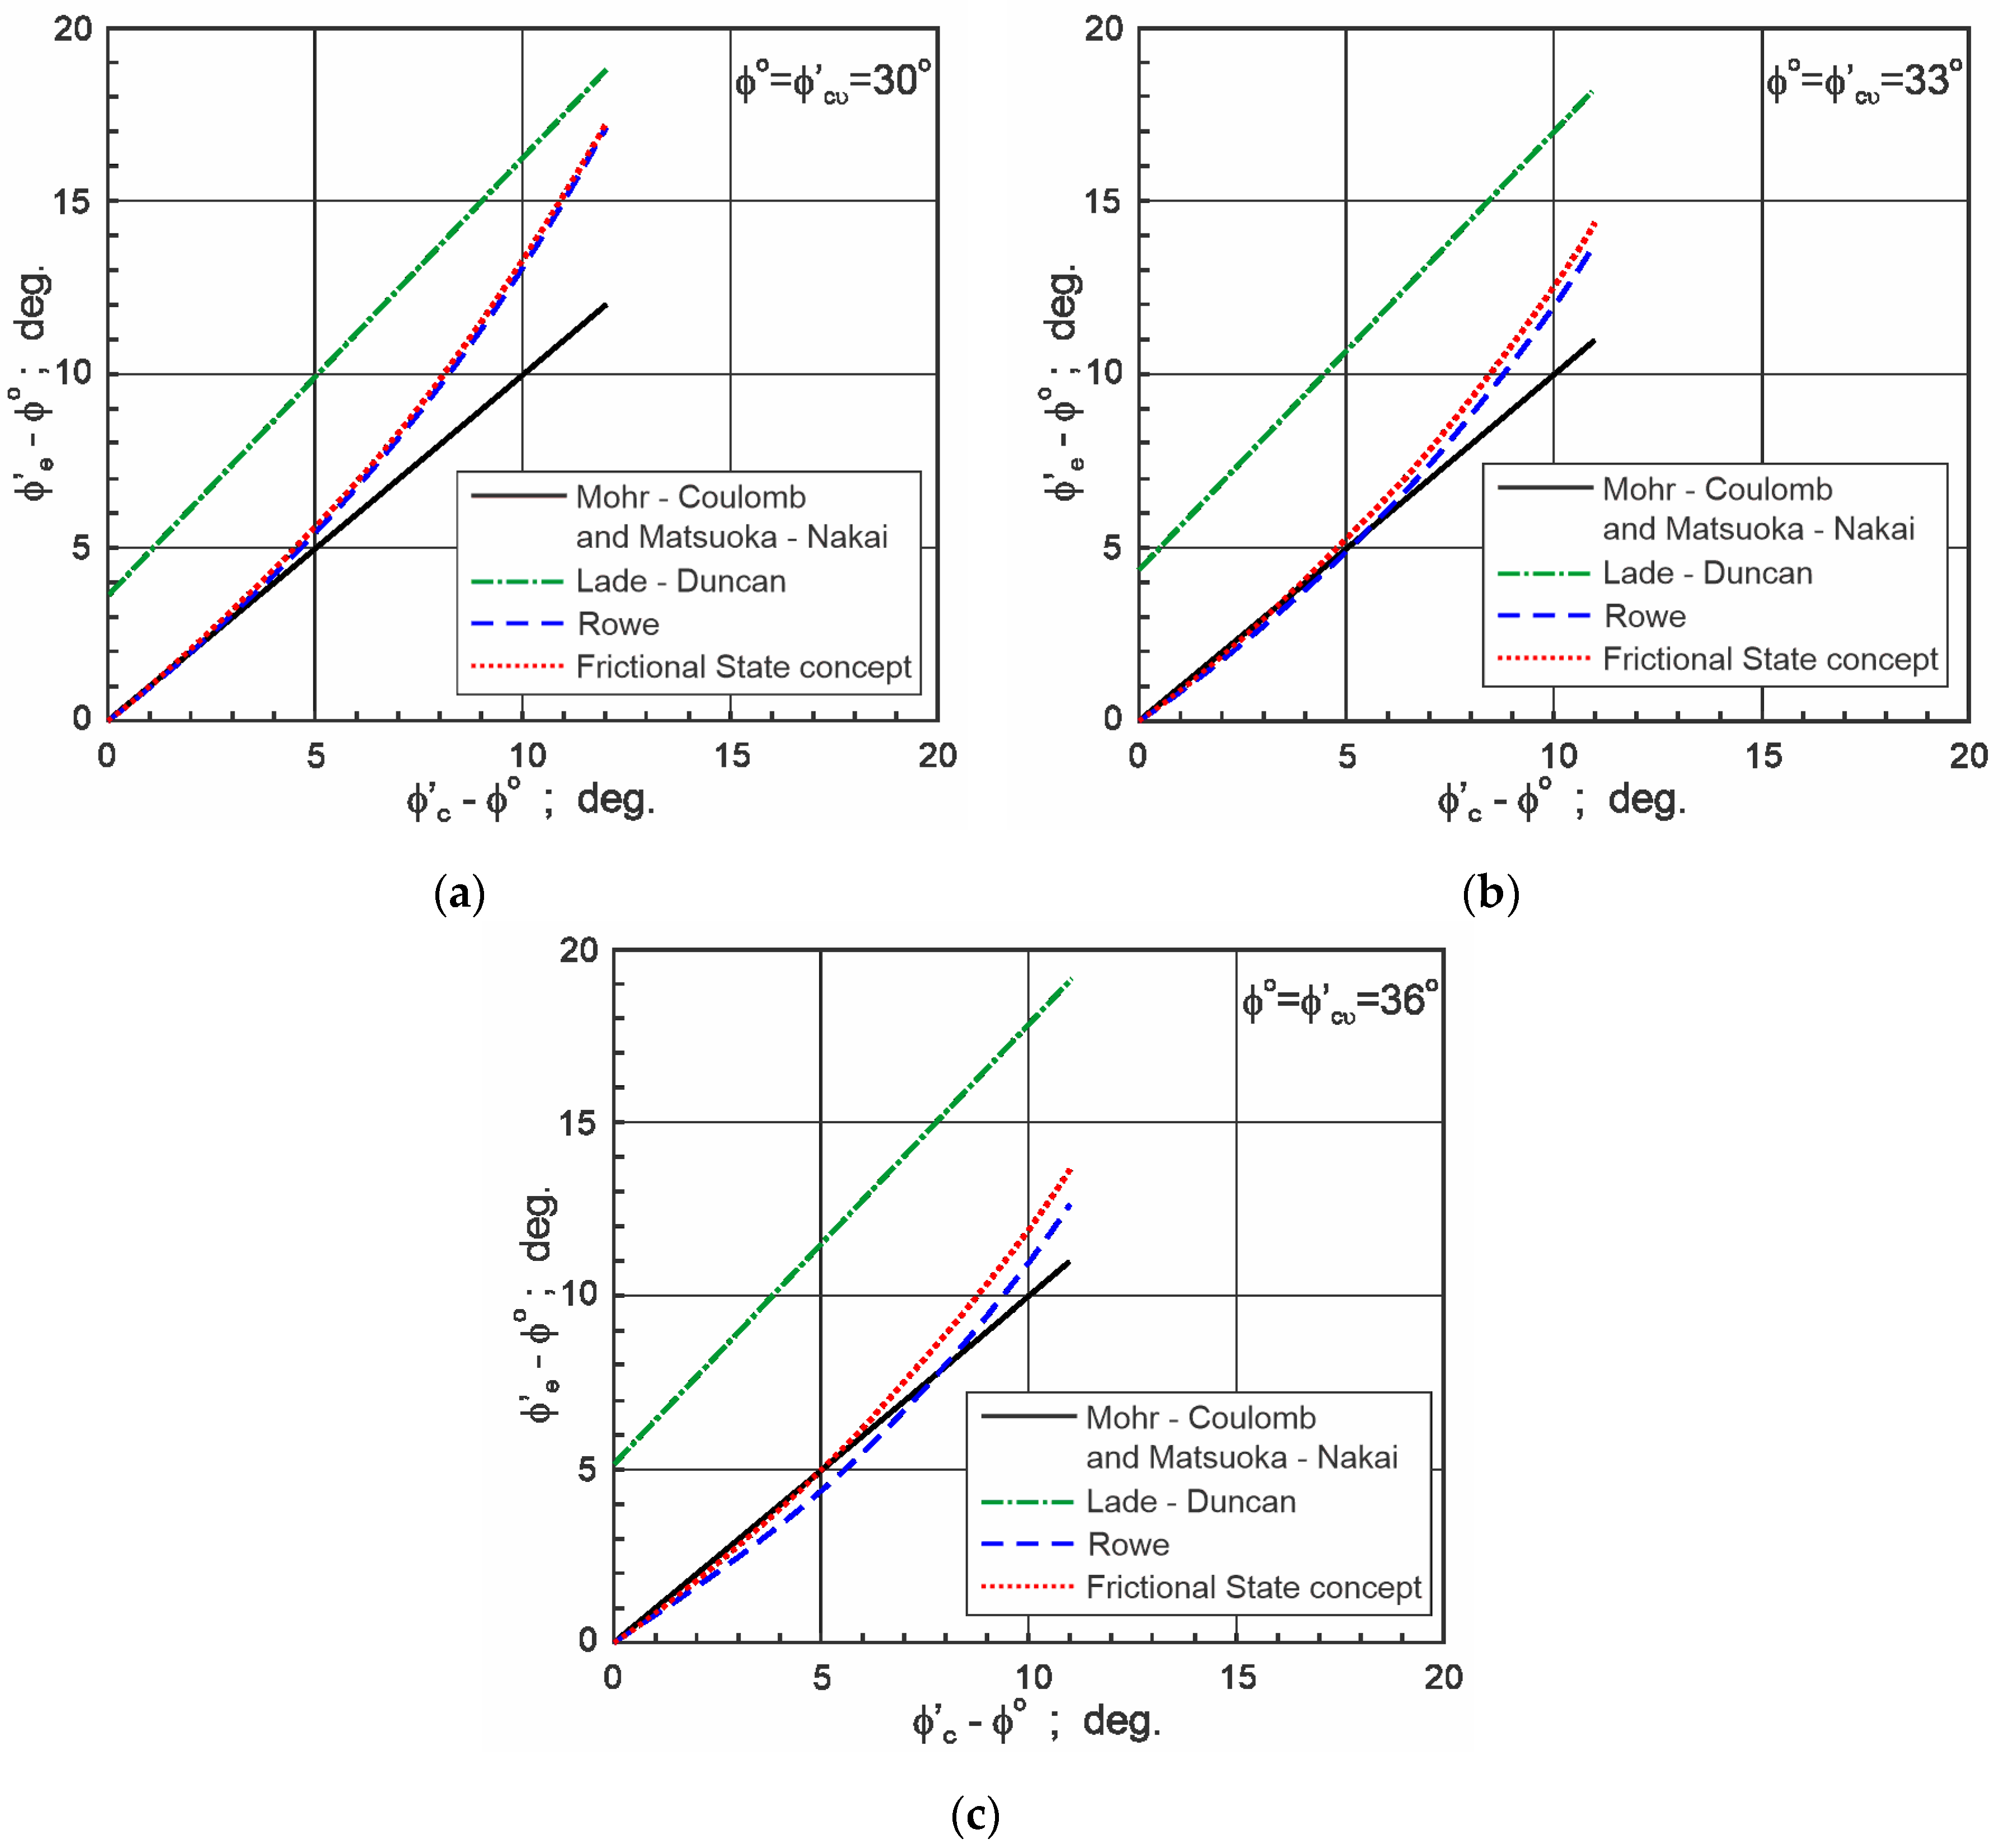
Figure 4.
Difference between the friction angle for biaxial testing or triaxial extension testing and the excess of friction angle for triaxial compression testing: (a) , (b) .
Figure 4.
Difference between the friction angle for biaxial testing or triaxial extension testing and the excess of friction angle for triaxial compression testing: (a) , (b) .
© 2020 by the author. Licensee MDPI, Basel, Switzerland. This article is an open access article distributed under the terms and conditions of the Creative Commons Attribution (CC BY) license (http://creativecommons.org/licenses/by/4.0/).
Share and Cite
MDPI and ACS Style
Szypcio, Z. Relation between the Friction Angle of Sand at Triaxial Compression and Triaxial Extension and Plane Strain Conditions. Geosciences 2020, 10, 29. https://doi.org/10.3390/geosciences10010029
AMA Style
Szypcio Z. Relation between the Friction Angle of Sand at Triaxial Compression and Triaxial Extension and Plane Strain Conditions. Geosciences. 2020; 10(1):29. https://doi.org/10.3390/geosciences10010029
Chicago/Turabian StyleSzypcio, Zenon. 2020. "Relation between the Friction Angle of Sand at Triaxial Compression and Triaxial Extension and Plane Strain Conditions" Geosciences 10, no. 1: 29. https://doi.org/10.3390/geosciences10010029
Note that from the first issue of 2016, this journal uses article numbers instead of page numbers. See further details here.