Genome Survey of Male and Female Spotted Scat (Scatophagus argus)
by
 ,
,
Yuanqing Huang
†, 
Dongneng Jiang
†,
Ming Li
,
Umar Farouk Mustapha
 ,
,
Changxu Tian
, 
Huapu Chen
,
Yang Huang
,
Siping Deng
,
Tianli Wu
,
Chunhua Zhu
and
Guangli Li
* Guangdong Research Center on Reproductive Control and Breeding Technology of Indigenous Valuable Fish Species, Fisheries College, Guangdong Ocean University, Zhanjiang 524088, China
*
Author to whom correspondence should be addressed.
†
These authors contributed equally to this work.
Animals 2019, 9(12), 1117; https://doi.org/10.3390/ani9121117
Submission received: 15 November 2019
/
Revised: 7 December 2019
/
Accepted: 9 December 2019
/
Published: 11 December 2019
(This article belongs to the Section Animal Genetics and Genomics)
Abstract
:Simple Summary
The spotted scat, Scatophagus argus, is a marine aquaculture fish species that is economically important in Asia. As the spotted scat exhibits notable sexual dimorphism with respect to growth, aquaculture efficiency can be increased through the practice of sex control breeding. However, genomic data from S. argus is lacking. In the present study, a genomic survey was conducted using next-generation sequencing technologies. Data, including the size of the genome, sequence repeat ratio, heterozygosity ratio, whole genome sequence and gene annotation were obtained. This information will serve to support the breeding and aquaculture of S. argus.
Abstract
The spotted scat, Scatophagus argus, is a species of fish that is widely propagated within the Chinese aquaculture industry and therefore has significant economic value. Despite this, studies of its genome are severely lacking. In the present study, a genomic survey of S. argus was conducted using next-generation sequencing (NGS). In total, 55.699 GB (female) and 51.047 GB (male) of high-quality sequence data were obtained. Genome sizes were estimated to be 598.73 (female) and 597.60 (male) Mbp. The sequence repeat ratios were calculated to be 27.06% (female) and 26.99% (male). Heterozygosity ratios were 0.37% for females and 0.38% for males. Reads were assembled into 444,961 (female) and 453,459 (male) contigs with N50 lengths of 5,747 and 5,745 bp for females and males, respectively. The average guanine-cytosine (GC) content of the female genome was 41.78%, and 41.82% for the male. A total of 42,869 (female) and 43,283 (male) genes were annotated to the non-redundant (NR) and SwissProt databases. The female and male genomes contained 66.6% and 67.8% BUSCO core genes, respectively. Dinucleotide repeats were the dominant form of simple sequence repeats (SSR) observed in females (68.69%) and males (68.56%). Additionally, gene fragments of Dmrt1 were only observed in the male genome. This is the first report of a genome-wide characterization of S. argus.
1. Introduction
The spotted scat, Scatophagus argus, (Perciformes, Scatophagidae), is a popular species of fish known for both its aesthetic value and human consumption due to its rhombic spotted body and high nutrient value [1,2,3]. Moreover, unlike other species, the cultivation of S. argus is relatively easy with low cost of feeding and high market price, making it an important farmed fish with considerable economic value in East and Southeast Asia [4,5,6,7]. The S. argus is widely distributed in the littoral and salt/freshwater rivers of the Indo Pacific, Australia, the Malay Archipelago, the Philippines and South and South East Asia, including China [8]. Analysis of the gut contents of S. argus has revealed a combination of both algae and detritus, indicating that it is an omnivorous fish [8]. S. argus is able to tolerate movement directly from freshwater to seawater, suggesting that it has a robust capacity for osmoregulation [9]. Furthermore, S. argus is a leading seafood for both its desirable taste and high nutritional value [1,8]. The adaptability of S. argus to a broad range of temperatures and levels of salinity, combined with their excellent edibility, has enabled it to become an attractive aquaculture species in China. However, the main supply of S. argus fingerlings derives from wild capture. In the absence of proper management, this has the potential to endanger the resource through overfishing [10]. Most studies examining this species have focused on reproduction and the importance of solving challenges associated with artificial propagation [11,12,13,14]. The female S. argus grows significantly faster and larger than males. Therefore, from an economic perspective, all-female farms will improve the rate of production and the total market value. Thus, sex control would be a good strategy to employ in an S. argus breeding program. In addition, understanding the mechanisms of sex determination and differentiation would be crucial to the effective maintenance of all-female production [15]. In addition, differences in growth rate between males and females provide a valuable model to explore the mechanisms of sexual dimorphisms in vertebrates [16]. To date, the genomic information of S. argus is lacking, essential for basic and applied research of this species [17].
Next-generation, high-throughput sequencing (NGS) is an efficient strategy for generating genomic resources. This technology is currently in wide use for transcriptomic and genomic studies [18,19,20,21]. Many genes in S. argus related to reproduction have previously been identified from the transcriptome of mixed ribonucleic acid (RNA) from various female and male tissues [4]. Furthermore, a comparative transcriptomic analysis of testicular and ovarian tissue has discovered many genes involved in sex determination and differentiation in S. argus [22]. Recently, NGS was used to conduct genomic surveys which enhanced the field’s understanding of genetic variation, evolutionary analysis, genome structure analysis, and marker development [23,24,25]. To further compare the genomes of male and female S. argus, complete genome sequences were obtained using NGS, the data of which was used to assemble the genome, perform genome size estimation, evaluate the guanine-cytosine (GC) content and identify simple sequence repeats (SSR). These data will be the basis of a fundamental genomic resource for reproduction-related studies. In addition, these data also provide a foundation for future genomic studies of S. argus.
2. Materials and Methods
2.1. Sample and Tissue Collection
Specimens of S. argus were obtained from the Zhanjiang Donghai Island Cultivation Base (Zhanjiang, Guangdong, China). Two adults, one female and one male, were subjected to genome sequencing. The animals were immediately dissected following tricaine MS-222 anaesthesia. White muscle tissue was used for DNA extraction. Samples were flash-frozen in liquid nitrogen for 1 h before storage at −80 °C. All animal experiments were conducted in accordance with the guidelines and approval (201903004) of the Animal Research and Ethics Committees of the Institute of Aquatic Economic Animals of Guangdong Ocean University.
2.2. Whole Genome Sequencing
Genomic DNA was isolated from muscle using a nucleic acid purification kit (N1173, DONGSHENG BIOTECON, Guangzhou, China) according to the manufacturer’s instructions. The DNA was then sheared randomly into small fragments using an ultrasonic shearing device. Two paired-end libraries with an insert size of 350 base pairs (bp) were constructed from randomly fragmented genomic DNA, following a standard protocol (Illumina, Beijing, China). The DNA library was then sequenced in paired-end, 150-bp mode using the Illumina HiSeq X Ten platform (Novogene, Beijing, China) in accordance with the manufacturer’s instructions.
To obtain clean reads, raw reads were filtered using the high-throughput quality control (HTQC) package [26]. The raw data were cleaned as follows: (1) adaptor sequences introduced during sequencing library construction were removed; (2) paired reads were removed when at least 10% of nucleotides were uncertain in either read; (3) paired reads were discarded when low-quality nucleotides (base quality <5) accounted for >50% of either read. Next, 5,000 clean-read pairs from each library were randomly selected and blasted against the National Center for Biotechnology Information (NCBI) nonredundant (NR) nucleotide database to check for obvious sample contamination. All subsequent analyses were based on these clean reads. Entire read sets were deposited in the short read archive (SRA) databank (http://www.ncbi.nlm.nih.gov/sra/) and are available under accession number PRJNA559409.
2.3. Genome Size Estimation and Identification of Heterozygosity and Repeat Ratios
A K-mer analysis was performed for each library to estimate the genome size, level of heterozygosity and repeat frequencies of the genomes by Marçais [27] to assess the genome complexity of S. argus. The K-mer statistic was used to assign discrete probability distributions for a number of possible K-mer combinations [28]. To minimize the influence of sequencing errors, low-frequency K-mers (≤5) were discarded. The copy number of a given K-mer (17-mer) present in all clean Illumina reads were counted then divided by the total length of each sequence read. The distribution of copy numbers was then plotted. The K-mer distribution can be used to infer the size of the genome. The peak value of the frequency curve represents the overall sequencing depth. Genome size was calculated as follows: K-mer number/peak depth [27],
Revised genome size = genome size × (1 − error rate).
In a heterozygous genome, the single nucleotide polymorphism (SNP) sites will be sparse, and ideally 2 × K heterozygous K-mers around each SNP site would be present. Heterozygous K-mers will have half of the expected coverage depth compared to the homozygous K-mers. The heterozygosity rate can be estimated as follows:
Heterozygosity rate = (a1/2 × nKspecies/(2 × K))/(nKspecies − a1/2 × nKspecies/2) = a1/2 /(K(2 − a1/2)).
In this formula, nKspecies denotes the total number of K-mer species and a1/2 denotes the ratio of heterozygous K-mer species [29,30]. The difference between the k-mer distribution and Poisson distribution is large due to the presence of incorrect sequences, or the number of sequence layers, which affects later estimates. Hence, the repeat rates were calculated according to the percentage of the total number of K-mers after the main peak, which was 1.8 times of all K-mer numbers [29].
2.4. Genome Assembly and GC Content
The software SOAPdenovo (v2.04) was used for de novo genome assembly [31]. All clean reads were used in the assembly, with a K-mer size of 41 selected as the default parameter used to construct a de Bruijn graph [32]. The de Bruijn graph was simplified by breaking the connections at repeat boundaries, with unambiguous sequence fragments outputted as contigs. After realigning all useable reads to the contig sequences and obtaining aligned paired-end reads, the number of shared paired-end reads having a relationship between each pair of contigs was calculated, the rate of consistent and conflicting paired-end reads was rated and scaffolds constructed step-by-step using SOAPdenovo. Gaps in the scaffolds were closed using GapCloser software (v1.12), and those longer than 100 bases in length were selected.
To measure the sequencing bias of S. argus, the guanine plus cytosine (GC) content and average sequencing depth were counted. The GC content is strictly controlled and moderately balanced across the genome [33,34]. Ten kb non-overlapping sliding windows were used along the assembled sequences to calculate the GC average sequencing depth.
2.5. Gene Prediction, Annotation, and Assembly Assessment
GlimmerHMM software (v.3.01) was used for de novo prediction of genes using default parameters (genemodel = zebrafish) [35]. Next, the predicted genes were used to BLAST the NR and SwissProt databases using BLASTx (E-value < 1e−5). Gene ontology (GO), Clusters of euKaryotic Orthologous Groups (KOG) and Kyoto Encyclopedia of Genes and Genomes (KEGG) pathway annotations were also assigned to genes using Blast2GO software [36]. In addition, the genes described in this way were classified into KOG slim and GO categories, then mapped onto the KEGG descriptors. To assess the completeness of the assembly, a Benchmarking Universal Single-Copy Orthologs (BUSCO, v.3.0) evaluation was performed using the Actinopterygii_odb9 database [37].
2.6. Alignment of The Male and Female Scaffolds on Dmrt1s Exons
Our previous research indicated that Dmrt1 is linked to the Y chromosome, and the truncated homologue Dmrt1b, is X chromosome-linked [38]. The predicted Dmrt1 and Dmrt1b genes observed during S. argus transcriptome analysis were mapped to the draft genome using Localblast software (NCBI-blast-2.2.27) [22]. Sequence homology alignment of male and female fragments was performed using the MegAlign application of DNASTAR software (http://www.dnastar.com).
2.7. Identification of SSRs
Sequence repeat search software in the MIcroSAtellite (MISA) model was used to detect simple repeat sequences (SSRs) in the DNA sequence. The software is divided into two modules. The first module was used to detect all the SSRs in the DNA sequences. The minimum numbers of SSRs for mono-, di-, tri-, tetra-, penta- and hexa-nucleotides adopted for identification were 10, 6, 5, 5, 5, and 5, respectively. The second module was used to filter the results of the first module and then remove SSRs which were too close.
3. Results
3.1. Genome Sequencing and Sequence Quality Estimation
A total of 55.809 and 51.154 GB of raw data were generated from female and male S. argus, respectively. After filtering, 55.699 (female) and 51.047 (male) GB of clean data were obtained, with Q30 scores assigned to 91.94% and 92.03% of the female and male libraries, respectively. The error rates of these libraries were 0.03% (Table 1). It was observed that the best BLAST results of reads were enriched for closely related fish species, including Dicentrarchus labrax, Scatophagus argus, Haplochromis burtoni and Oreochromis niloticus (Table S1).
3.2. Genome Size, Ratio of Heterozygosity, and Repeats by K-Mer Analysis
The K-mer analysis indicated that the depth of female and male S. argus were at 74 and 68×, respectively (Figure 1, Table 2). The estimated size of the female and male genomes was 613.16 and 612.32 MB, respectively. The revised genome sizes were 598.73 and 597.60 MB, respectively. The rates of heterozygosity were calculated to be 0.37% and 0.38%, and repeat rates calculated to be 27.06% and 26.99%.
3.3. Genome Assembly and GC Content
According to the analysis, a total of 444,961 and 453,459 contigs were assembled from female and male S. argus, with an N50 of 5747 bp and 5745 bp, respectively. Based on the contigs, the genome assembly contained 335,162 and 340,134 scaffolds, with an N50 of 13,556 and 13,591 bp (Table 3). The average GC content of female and male S. argus genomes were 41.78% and 41.82%, respectively. In Figure 2, the red regions represent relatively dense portions of the scatter plot, with the GC depth being blocked into two layers, partly due to the rate of heterozygosity [39].
3.4. Gene Prediction, Annotation, and Evaluation
Based on our assembled genome sequences, a total of 94,862 female genes and 95,273 male genes were predicted by GlimmerHMM software. The predicted genes ranged from 101 to 52,424 bp in length. Among the predicted genes, 42,869 female and 43,283 male genes were functionally annotated in the NR and SwissProt databases (Table 4). The KOG, KEGG and GO annotation or classification of these annotated genes were similar in the males and females (Figures S1–S3; Table S2). Among 4584 conserved Actinopterygii genes searched, 3055 (66.6%) and 881 (19.2%) BUSCO core genes were completed and partially identified, respectively, in the female genome. The BUSCO core genes of the male genome were similar to those of the female (Table S3). The partially identified core genes in both sexes were a little high caused by incomplete genome assembly based on short NGS reads.
3.5. Characterization of the Dmrt1s Gene
Gene prediction and annotation confirmed that Dmrt1 is male-specific, whereas Dmrt1b is observed in both male and female fish. Three and four scaffolds containing Dmrt1b and Dmrt1 were obtained from the female and male genomes, respectively (Figure 3, Supplementary Sequences). Alignment demonstrated that Dmrt1 exons 1, 2, 3, and 4 had 79.9%, 90.7%, 75.8%, and 84.1% similarity with the corresponding fragments on Dmrt1b, respectively. The Dmrt1b fragment corresponding to Dmrt1 exon 5 was not found, possibly be due to incomplete sequencing in female fish. The female scalffold49157 had a similarity of 70.2% with the Dmrt1 3’ UTR on the male scalffold152219 in their overlapping region (~500 bp). In the first and second exons of Dmrt1b, several mutations were observed that resulted in the premature termination of Dmrt1b. In addition, five male scaffolds (162,645, 106,307, 107,747, 68,937, and 118,347) were found to cover the Dmrt1b region (Figure S4; Supplementary Sequences). The average length of scaffolds covering Dmrt1b from male and female are 1448 and 3667 bp, respectively. It seems that the assemble quality of Dmrt1b region in male is relatively lower than that of the female.
3.6. Identification of SSR
After filtering the SSR sequences from the contig sequences at both sides (the distances of SSR sequences to contig sequences at both ends were less than 100 bp), a total of 299,574 and 299,893 SSRs were detected in female and male fish, respectively (Table 5). In the female, the predominant SSR motif types observed were dinucleotide repeats, occurring at 205,789 loci (68.69%), followed by trinucleotide repeats (31,228, 10.42%) (Figure 4). Among the dinucleotide repeat motifs, the AC/GT repeats were the most abundant, accounting for 75.85% (Figure S5). The most common tri-nucleotide motifs were AGG/CCT and AAT/ATT, accounting for 31.36% and 27.53%, respectively (Figure S6). In the male fish, the SSR motif profile was similar to that of the female (Figure 4; Figures S5 and S6; Table 5).
4. Discussion
According to K-mer (K = 17) analysis, the sizes of female and male S. argus genomes were estimated to be 598.73 MB and 597.60 MB, respectively. It has been reported that using a bulk fluorometric assay, the DNA content of S. argus red blood cells is approximately 0.77 pg [40]. According to a mass conversion formula, 1 pg DNA equates to approximately 0.978 × 10⁹ bp. Based on this estimation, the genome size of S. argus is approximately 753.06 MB, which is larger than the K-mer predicted genome size [41]. The larger genome size estimated by the fluorometric assay could be due to the non-specific nature of the fluorescent dye used, possibly detecting binding to non-genomic nucleotides. The size of the genome of S. argus estimated in this study was larger than that of Sillago sinica (534 MB) [42], but smaller than that of Lateolabrax maculatus (670 MB) [43], Dicentrarchus labrax (675 MB) [44] and Larimichthys crocea (679 MB) [45].
The rate of heterozygosity in the female was 0.37%, which is lower than that of the male fish (0.38%). Consistently, sex-linked markers demonstrated that the sex-determination system of S. argus is male heterozygous XY and female homozygous XX. This indicates that the heterozygosity rate of XY males should be higher than that of female fish [38]. However, the heterozygosity rate difference between the sexes was only 0.01%. This is possibly because the Y chromosome is still “young” in S. argus [46]. Consistently, no morphologically distinguishable sex chromosome has been observed in the species [47]. Because lower rates of heterozygosity tend to simplify genome assembly, the data presented here suggest that female S. argus would be preferable to males for the development of a draft genome in future studies [28]. The heterozygosity rate observed here was higher than that of Oplegnathus fasciatus (0.29%) [48], but smaller than that of Pelteobagrus fulvidraco (0.45%) [49], Seriola dumerili (0.65%) [50] and Sillago sinica (0.66–0.76%) [42]. The lower heterozygosity rate of S. argus suggests that wild-caught fish are close to being over-fished.
The genome assembled here appears to be of higher quality than that of S. sihama in spite of the same sequencing strategy being employed, also in our lab [51]. This might be due to the heterozygosity rate of S. argus being substantially lower than that of S. sihama (0.92%) [51]. Male-specific Dmrt1 is the candidate sex determination gene in S. argus [38]. Consistently, gene fragments of Dmrt1 were present in the male genome (Supplementary Sequences), while being absent in the female genome (data not shown). The complete Dmrt1 gene sequence is not available at present due to the read quality and ultimately, assembly status. On the other hand, the Dmrt1 gene is always very long in fish species. For example, the shortest Dmrt1 gene was found to be 12kb in Takifugu rubripes, which has a compressed genome [38]. To obtain better-assembled genomes by NGS, long-insert libraries should be constructed for sequencing [20]. Alternatively, third-generation sequencing technologies, such as Pacific Biosciences (PacBio) sequencing platform could be used to enhance genome assembly in future studies [42].
Both male and female genomes appeared capable of developing tremendous SSR markers, which will help to solve the problem that SSR markers are principally derived from transcriptomic data in S. argus [4,52]. The number of SSR markers observed in male fish was slightly higher than that of female fish. The difference might be due to the male proto-Y sex chromosome having more repetitive elements [38,53].
5. Conclusions
In the present study, the first reference genome of S. argus was sequenced. Two spotted scat, a female and male, underwent whole-genome sequencing. The genome sizes of the female and male were 598.73 MB and 597.60 MB, respectively. The genome was annotated with 42,869 female and 43,283 male genes. The S. argus genomes contained 66.6% and 67.8% of the core genes in conserved Actinopterygii orthologs for each sex, respectively. The rate of genome heterozygosity of the male fish was slightly higher than that of the female. The number of SSR markers developed from the male was slightly greater than that of the female fish. These data suggest that the differences between male and female genomes of S. argus are minor. It was also confirmed that the male-specific Dmrt1 is a good candidate sex determination gene via genome sequencing. This study provides an important genome resource for further studies of S. argus.
Supplementary Materials
The following are available online at https://www.mdpi.com/2076-2615/9/12/1117/s1, Figure S1: KOG function classification of predicted genes in S. argus. Figure S2: KEGG pathway annotation of predicted genes in S. argus. The different color code represented different category, Figure S3: Gene Ontology classification of predicted genes in S. argus. Genes were assigned to three categories: biological process, cellular component and molecular function, Figure S4: The Dmrt1b gene from male genome. Numbers indicate base pairs (loci) of exon and intron sequences, Figure S5: Percentage of different motifs in di-nucleotide repeats of female and male S. argus genome, Figure S6: Percentage of different motifs in trinucleotide repeats of female and male S. argus genome. Table S1: Statistics of top 4 similar species blasted against the NCBI nonredundant nucleotide database, Table S2: Statistics of KOG function classification of predicted genes in S. argus, Table S3: Assessment of S. argus genome assembly and completeness using BUSCO. Supplementary Sequences.
Author Contributions
Conceptualization, G.L. and D.J.; methodology, D.J.; software, C.T.; validation, T.W.; formal analysis, Y.H. (Yuanqing Huang); investigation, M.L.; resources, Y.H. (Yang Huang) and C.Z.; writing—original draft preparation, Y.H. (Yuanqing Huang); writing—review and editing, D.J., G.L. and U.F.M.; supervision, S.D. and H.C.; project administration, G.L., Y.H. (Yuanqing Huang) and D.J.; funding acquisition, G.L. and D.J.
Funding
This study was supported by grants from the Key Project of “Blue Granary Science and Technology Innovation” of the Ministry of Science and Technology (2018YFD0901203); the National Natural Science Foundation of China (Nos. 31702326 and 41706174); Natural Science Foundation of Guangdong Province (2018B030311050); Guangdong Basic and Applied Basic Research Foundation (2019A1515012042 and 2019A1515010958); Independent Project of Guangdong Province Laboratory (ZJW-2019-06); grant from the Guangdong Provincial Special Fund For Modern Agriculture Industry Technology Innovation Teams (2019KJ149); Department of Education of Guangdong Province (2018KTSCX090); Program for Scientific Research Start-Up Funds of Guangdong Ocean University.
Conflicts of Interest
The authors declare no conflicts of interest. The funders had no role in the design of the study; in the collection, analyses, or interpretation of data; in the writing of the manuscript, or in the decision to publish the results.
References
- Gupta, S. An overview on morphology, biology, and culture of spotted scat Scatophagus argus (Linnaeus 1766). Rev. Fish. Sci. Aquac. 2016, 24, 203–212. [Google Scholar] [CrossRef]
- Mathew, A.K. Studies on Some Aspects of Biology of Two Estuarine Fishes Megalops Cyprinoides and Scatophagus argus. Ph.D. Thesis, Cochin University of Science and Technology, Cochin, India, 1988. [Google Scholar]
- Morgan, S. Scats: Personable, hardy garbage disposals for the brackish water aquarium. Trop. Fish Hobbyist 1983, 318, 65–69. [Google Scholar]
- Yang, W.; Chen, H.P.; Cui, X.F.; Zhang, K.W.; Jiang, D.N.; Deng, S.P.; Zhu, C.H.; Li, G.L. Sequencing, de novo assembly and characterization of the spotted scat Scatophagus argus (Linnaeus 1766) transcriptome for discovery of reproduction related genes and SSRs. Chin. J. Oceanol. Limnol. 2018, 36, 1329–1341. [Google Scholar] [CrossRef]
- Shao, Y.T.; Hwang, L.Y.; Lee, T.H. Histological observations of ovotestis in the spotted scat Scatophagus argus. Fish. Sci. 2004, 70, 716–718. [Google Scholar] [CrossRef]
- Barry, T.P.; Fast, A.W. Biology of the spotted scat (Scatophagus argus) in the Philippines. Asian Fish. Sci. 1992, 5, 163–179. [Google Scholar]
- Chang, S.L. Studies on the early development and larval rearing of spotted scat Scatophagus argus. J. Taiwan Fish. Res. 1997, 5, 41–49. [Google Scholar]
- Sivan, G.; Radhakrishnan, C.K. Food, feeding habits and biochemical composition of Scatophagus argus. Turk. J. Fish. Aquat. Sci. 2011, 11, 603–608. [Google Scholar]
- Ghazilou, A.; Chenary, F.; Morovvati, H.; Zolgarneine, H. Time course of saltwater adaptation in spotted scat (Scatophagus argus) (Pisces): A histomorphometric approach. Ital. J. Zool. 2011, 78, 82–89. [Google Scholar] [CrossRef]
- Cai, Z.P.; Wang, Y.; Hu, J.W.; Zhang, J.B.; Lin, Y.G. Reproductive biology of Scatophagus argus and artificial induction of spawning. J. Trop Oceanogr. 2010, 29, 180–185. [Google Scholar] [CrossRef]
- Li, G.L.; Zhang, M.Z.; Deng, S.P.; Chen, H.P.; Zhu, C.H. Effects of temperature and fish oil supplementation on ovarian development and foxl2 mRNA expression in spotted scat Scatophagus argus. J. Fish. Biol. 2015, 86, 248–260. [Google Scholar] [CrossRef]
- Jiang, D.N.; Li, J.T.; Tao, Y.X.; Chen, H.P.; Deng, S.P.; Zhu, C.H.; Li, G.L. Effects of melanocortin-4 receptor agonists and antagonists on expression of genes related to reproduction in spotted scat, Scatophagus argus. J. Comp. Physiol. B 2017, 187, 603–612. [Google Scholar] [CrossRef]
- Jiang, D.N.; Mustapha, U.F.; Shi, H.J.; Huang, Y.Q.; Si-Tu, J.X.; Wang, M.; Deng, S.P.; Chen, H.P.; Tian, C.X.; Zhu, C.H.; et al. Expression and transcriptional regulation of gsdf in spotted scat (Scatophagus argus). Comp. Biochem. Physiol. B Biochem. Mol. Biol. 2019, 233, 35–45. [Google Scholar] [CrossRef]
- Zhang, G.; Wang, W.; Su, M.L.; Zhang, J.B. Effects of recombinant gonadotropin hormones on the gonadal maturation in the spotted scat, Scatophagus argus. Aquaculture 2018, 483, 263–272. [Google Scholar] [CrossRef]
- Mei, J.; Gui, J.F. Genetic basis and biotechnological manipulation of sexual dimorphism and sex determination in fish. Sci. China Life Sci. 2015, 58, 124–136. [Google Scholar] [CrossRef] [Green Version]
- Deng, S.P.; Wu, B.; Zhu, C.H.; Li, G.L. Molecular cloning and dimorphic expression of growth hormone (gh) in female and male spotted scat Scatophagus argus. Fish. Sci. 2014, 80, 715–723. [Google Scholar] [CrossRef]
- Shen, Y.; Yue, G. Current status of research on aquaculture genetics and genomics-information from ISGA 2018. Aquac. Fish. 2019, 4, 43–47. [Google Scholar] [CrossRef]
- Tao, W.J.; Yuan, J.; Zhou, L.Y.; Sun, L.N.; Sun, Y.L.; Yang, S.J.; Li, M.H.; Zeng, S.; Huang, B.F.; Wang, D.S. Characterization of gonadal transcriptomes from Nile tilapia (Oreochromis niloticus) reveals differentially expressed genes. PLoS ONE 2013, 8, e63604. [Google Scholar] [CrossRef] [Green Version]
- Tian, C.X.; Li, Z.Y.; Dong, Z.D.; Huang, Y.; Du, T.; Chen, H.P.; Jiang, D.N.; Deng, S.P.; Zhang, Y.L.; Wanida, S.; et al. Transcriptome analysis of male and female mature gonads of silver sillago (Sillago sihama). Genes 2019, 10, 129. [Google Scholar] [CrossRef] [Green Version]
- Bian, C.; Li, J.; Lin, X.Q.; Chen, X.Y.; Yi, Y.H.; You, X.X.; Zhang, Y.P.; Lv, Y.Y.; Shi, Q. Whole genome sequencing of the blue tilapia (Oreochromis aureus) provides a valuable genetic resource for biomedical research on tilapias. Mar. Drugs 2019, 17, 386. [Google Scholar] [CrossRef] [Green Version]
- Schartl, M.; Kneitz, S.; Volkoff, H.; Adolfi, M.; Schmidt, C.; Fischer, P.; Minx, P.; Tomlinson, C.; Meyer, A.; Warren, W.C. The piranha genome provides molecular insight associated to its unique feeding behavior. Genome Biol. Evol. 2019, 11, 2099–2106. [Google Scholar] [CrossRef]
- He, F.X.; Jiang, D.N.; Huang, Y.Q.; Mustapha, U.F.; Yang, W.; Cui, X.F.; Tian, C.X.; Chen, H.P.; Shi, H.J.; Deng, S.P.; et al. Comparative transcriptome analysis of male and female gonads reveals sex-biased genes in spotted scat (Scatophagus argus). Fish. Physiol. Biochem. 2019, 45, 1963–1980. [Google Scholar] [CrossRef]
- Zhou, W.; Hu, Y.Y.; Sui, Z.H.; Fu, F.; Wang, J.G.; Chang, L.P.; Guo, W.H.; Li, B.B. Genome survey sequencing and genetic background characterization of Gracilariopsis lemaneiformis (Rhodophyta) based on next-generation sequencing. PLoS ONE 2013, 8, e69909. [Google Scholar] [CrossRef]
- Tang, Q.; Ma, X.J.; Mo, C.M.; Pan, L.M.; Wei, R.C.; Zhao, H. Genome survey analysis in Siraitia grosvenorii. Guihaia 2015, 35, 786–791. [Google Scholar]
- Shi, L.L.; Yi, S.K.; Li, Y.H. Genome survey sequencing of red swamp crayfish Procambarus clarkii. Mol. Biol. Rep. 2018, 45, 799–806. [Google Scholar] [CrossRef]
- Yang, X.; Liu, D.; Liu, F.; Wu, J.; Zou, J.; Xiao, X.; Zhao, F.Q.; Zhu, B.L. HTQC: A fast quality control toolkit for Illumina sequencing data. BMC Bioinform. 2013, 14, 33. [Google Scholar] [CrossRef] [Green Version]
- Marcais, G.; Kingsford, C. A fast, lock-free approach for efficient parallel counting of occurrences of k-mers. Bioinformatics 2011, 27, 764–770. [Google Scholar] [CrossRef] [Green Version]
- Chor, B.; Horn, D.; Goldman, N.; Levy, Y.; Massingham, T. Genomic DNA k-mer spectra: Models and modalities. Genome Biol. 2009, 10, R108. [Google Scholar] [CrossRef] [Green Version]
- Liu, B.H.; Shi, Y.J.; Yuan, J.Y.; Hu, X.S.; Zhang, H.; Li, N.; Li, Z.Y.; Chen, Y.X.; Mu, D.S.; Fan, W. Estimation of genomic characteristics by analyzing k-mer frequency in de novo genome projects. arXiv 2013, arXiv:1308.2012v1. Available online: https://arxiv.org/abs/1308.2012v1 (accessed on 20 August 2019).
- Li, X.; Waterman, M.S. Estimating the repeat structure and length of DNA sequences using L-tuples. Genome Res. 2003, 13, 1916–1922. [Google Scholar]
- Luo, R.B.; Liu, B.H.; Xie, Y.L.; Li, Z.Y.; Huang, W.H.; Yuan, J.Y.; He, G.Z.; Chen, Y.X.; Pan, Q.; Liu, Y.J. SOAPdenovo2: An empirically improved memory-efficient short-read de novo assembler. Gigascience 2012, 1, 18. [Google Scholar] [CrossRef]
- Li, R.Q.; Fan, W.; Tian, G.; Zhu, H.M.; He, L.; Cai, J.; Huang, Q.F.; Cai, Q.L.; Li, B.; Bai, Y.Q.; et al. The sequence and de novo assembly of the giant panda genome. Nature 2010, 463, 311–317. [Google Scholar] [CrossRef] [PubMed] [Green Version]
- Parker, S.C.J.; Margulies, E.H.; Tullius, T.D. The relationship between fine scale DNA structure, GC content, and functional elements in 1% of the human genome. Genome Inf. 2008, 20, 199–211. [Google Scholar] [CrossRef] [Green Version]
- Lu, M.; An, H.M.; Li, L.L. Genome survey sequencing for the characterization of the genetic background of Rosa roxburghii Tratt and leaf ascorbate metabolism genes. PLoS ONE 2016, 11, e0147530. [Google Scholar] [CrossRef] [PubMed]
- Majoros, W.H.; Pertea, M.; Salzberg, S.L. TigrScan and GlimmerHMM: Two open-source ab initio eukaryotic gene-finders. Bioinformatics 2004, 20, 2878–2879. [Google Scholar] [CrossRef]
- Conesa, A.; Gotz, S.; Garcia-Gomez, J.M.; Terol, J.; Talon, M.; Robles, M. Blast2GO: A universal tool for annotation, visualization and analysis in functional genomics research. Bioinformatics 2005, 21, 3674–3676. [Google Scholar] [CrossRef] [Green Version]
- Waterhouse, R.M.; Seppey, M.; Simão, F.A.; Manni, M.; Ioannidis, P.; Klioutchnikov, G.; Kriventseva, E.V.; Zdobnov, E.M. BUSCO applications from quality assessments to gene prediction and phylogenomics. Mol. Biol. Evol. 2017, 35, 543–548. [Google Scholar] [CrossRef] [Green Version]
- Mustapha, U.F.; Jiang, D.N.; Liang, Z.H.; Gu, H.T.; Yang, W.; Chen, H.P.; Deng, S.P.; Wu, T.L.; Tian, C.X.; Zhu, C.H.; et al. Male-specific Dmrt1 is a candidate sex determination gene in spotted scat (Scatophagus argus). Aquaculture 2018, 495, 351–358. [Google Scholar] [CrossRef]
- Zhou, W.; Li, B.; Li, L.; Ma, W.; Liu, Y.C.; Feng, S.C.; Wang, Z.Z. Genome survey sequencing of Dioscorea zingiberensis. Genome 2018, 61, 567–574. [Google Scholar] [CrossRef]
- Hinegardner, R.; Rosen, D.E. Cellular DNA content and the evolution of teleostean fishes. Am. Nat. 1972, 106, 621–644. [Google Scholar] [CrossRef]
- Dolezel, J.; Bartos, J.; Voglmayr, H.; Greilhuber, J. Nuclear DNA content and genome size of trout and human. Cytom. A 2003, 51, 127–128. [Google Scholar] [CrossRef]
- Xu, S.Y.; Xiao, S.J.; Zhu, S.L.; Zeng, X.F.; Luo, J.; Liu, J.Q.; Gao, T.X.; Chen, N.S. A draft genome assembly of the Chinese sillago (Sillago sinica), the first reference genome for Sillaginidae fishes. Gigascience 2018, 7, giy108. [Google Scholar] [CrossRef]
- Shao, C.W.; Li, C.; Wang, N.; Qin, Y.T.; Xu, W.T.; Liu, Q.; Zhou, Q.; Zhao, Y.; Li, X.H.; Liu, S.S.; et al. Chromosome-level genome assembly of the spotted sea bass, Lateolabrax maculatus. Gigascience 2018, 7. [Google Scholar] [CrossRef]
- Tine, M.; Kuhl, H.; Gagnaire, P.A.; Louro, B.; Desmarais, E.; Martins, R.S.; Hecht, J.; Knaust, F.; Belkhir, K.; Klages, S.; et al. European sea bass genome and its variation provide insights into adaptation to euryhalinity and speciation. Nat. Commun. 2014, 5, 5770. [Google Scholar] [CrossRef] [Green Version]
- Ao, J.; Mu, Y.; Xiang, L.X.; Fan, D.; Feng, M.; Zhang, S.; Shi, Q.; Zhu, L.Y.; Li, T.; Ding, Y.; et al. Genome sequencing of the perciform fish Larimichthys crocea provides insights into molecular and genetic mechanisms of stress adaptation. PLoS Genet. 2015, 11, e1005118. [Google Scholar] [CrossRef] [Green Version]
- Martinez, P.; Vinas, A.M.; Sanchez, L.; Diaz, N.; Ribas, L.; Piferrer, F. Genetic architecture of sex determination in fish: Applications to sex ratio control in aquaculture. Front. Genet. 2014, 5, 340. [Google Scholar] [CrossRef] [Green Version]
- Zhou, B.C.; Shu, H.; Liu, F.; Cai, X.Y.; Tan, J.H.; Zhang, H.F. Karyotypes in three marine important fish species. Fish. Sci. 2009, 28, 325–328. [Google Scholar]
- Xiao, Y.S.; Xiao, Z.Z.; Ma, D.Y.; Liu, J.; Li, J. Genome sequence of the barred knifejaw Oplegnathus fasciatus (Temminck & Schlegel, 1844): The first chromosome-level draft genome in the family Oplegnathidae. Gigascience 2019, 8, giz013. [Google Scholar] [CrossRef] [Green Version]
- Gong, G.R.; Dan, C.; Xiao, S.J.; Guo, W.J.; Huang, P.P.; Xiong, Y.; Wu, J.J.; He, Y.; Zhang, J.C.; Li, X.H.; et al. Chromosomal-level assembly of yellow catfish genome using third-generation DNA sequencing and Hi-C analysis. Gigascience 2018, 7, giy120. [Google Scholar] [CrossRef]
- Sarropoulou, E.; Sundaram, A.Y.M.; Kaitetzidou, E.; Kotoulas, G.; Gilfillan, G.D.; Papandroulakis, N.; Mylonas, C.C.; Magoulas, A. Full genome survey and dynamics of gene expression in the greater amberjack Seriola dumerili. Gigascience. 2017, 6, gix108. [Google Scholar] [CrossRef] [Green Version]
- Li, Z.Y.; Tian, C.X.; Huang, Y.; Lin, X.H.; Wang, Y.R.; Jiang, D.N.; Zhu, C.H.; Chen, H.P.; Li, G.L. A First insight into a draft genome of silver sillago (Sillago sihama) via genome survey sequencing. Animals 2019, 9, 756. [Google Scholar] [CrossRef] [Green Version]
- Liu, H.F.; Li, S.Q.; Hu, P.; Zhang, Y.Y.; Zhang, J.B. Isolation and characterization of EST-based microsatellite markers for Scatophagus argus based on transcriptome analysis. Conserv. Genet. Resour. 2013, 5, 483–485. [Google Scholar] [CrossRef]
- Charlesworth, D.; Charlesworth, B.; Marais, G. Steps in the evolution of heteromorphic sex chromosomes. Heredity 2005, 95, 118–128. [Google Scholar] [CrossRef] [Green Version]
Figure 1.
Distribution of 17-mer depth and frequency of female and male S. argus. The x-axis indicates depth; the y-axis indicates the proportion representing the frequency at that depth divided by the total frequency of all depths.
Figure 1.
Distribution of 17-mer depth and frequency of female and male S. argus. The x-axis indicates depth; the y-axis indicates the proportion representing the frequency at that depth divided by the total frequency of all depths.
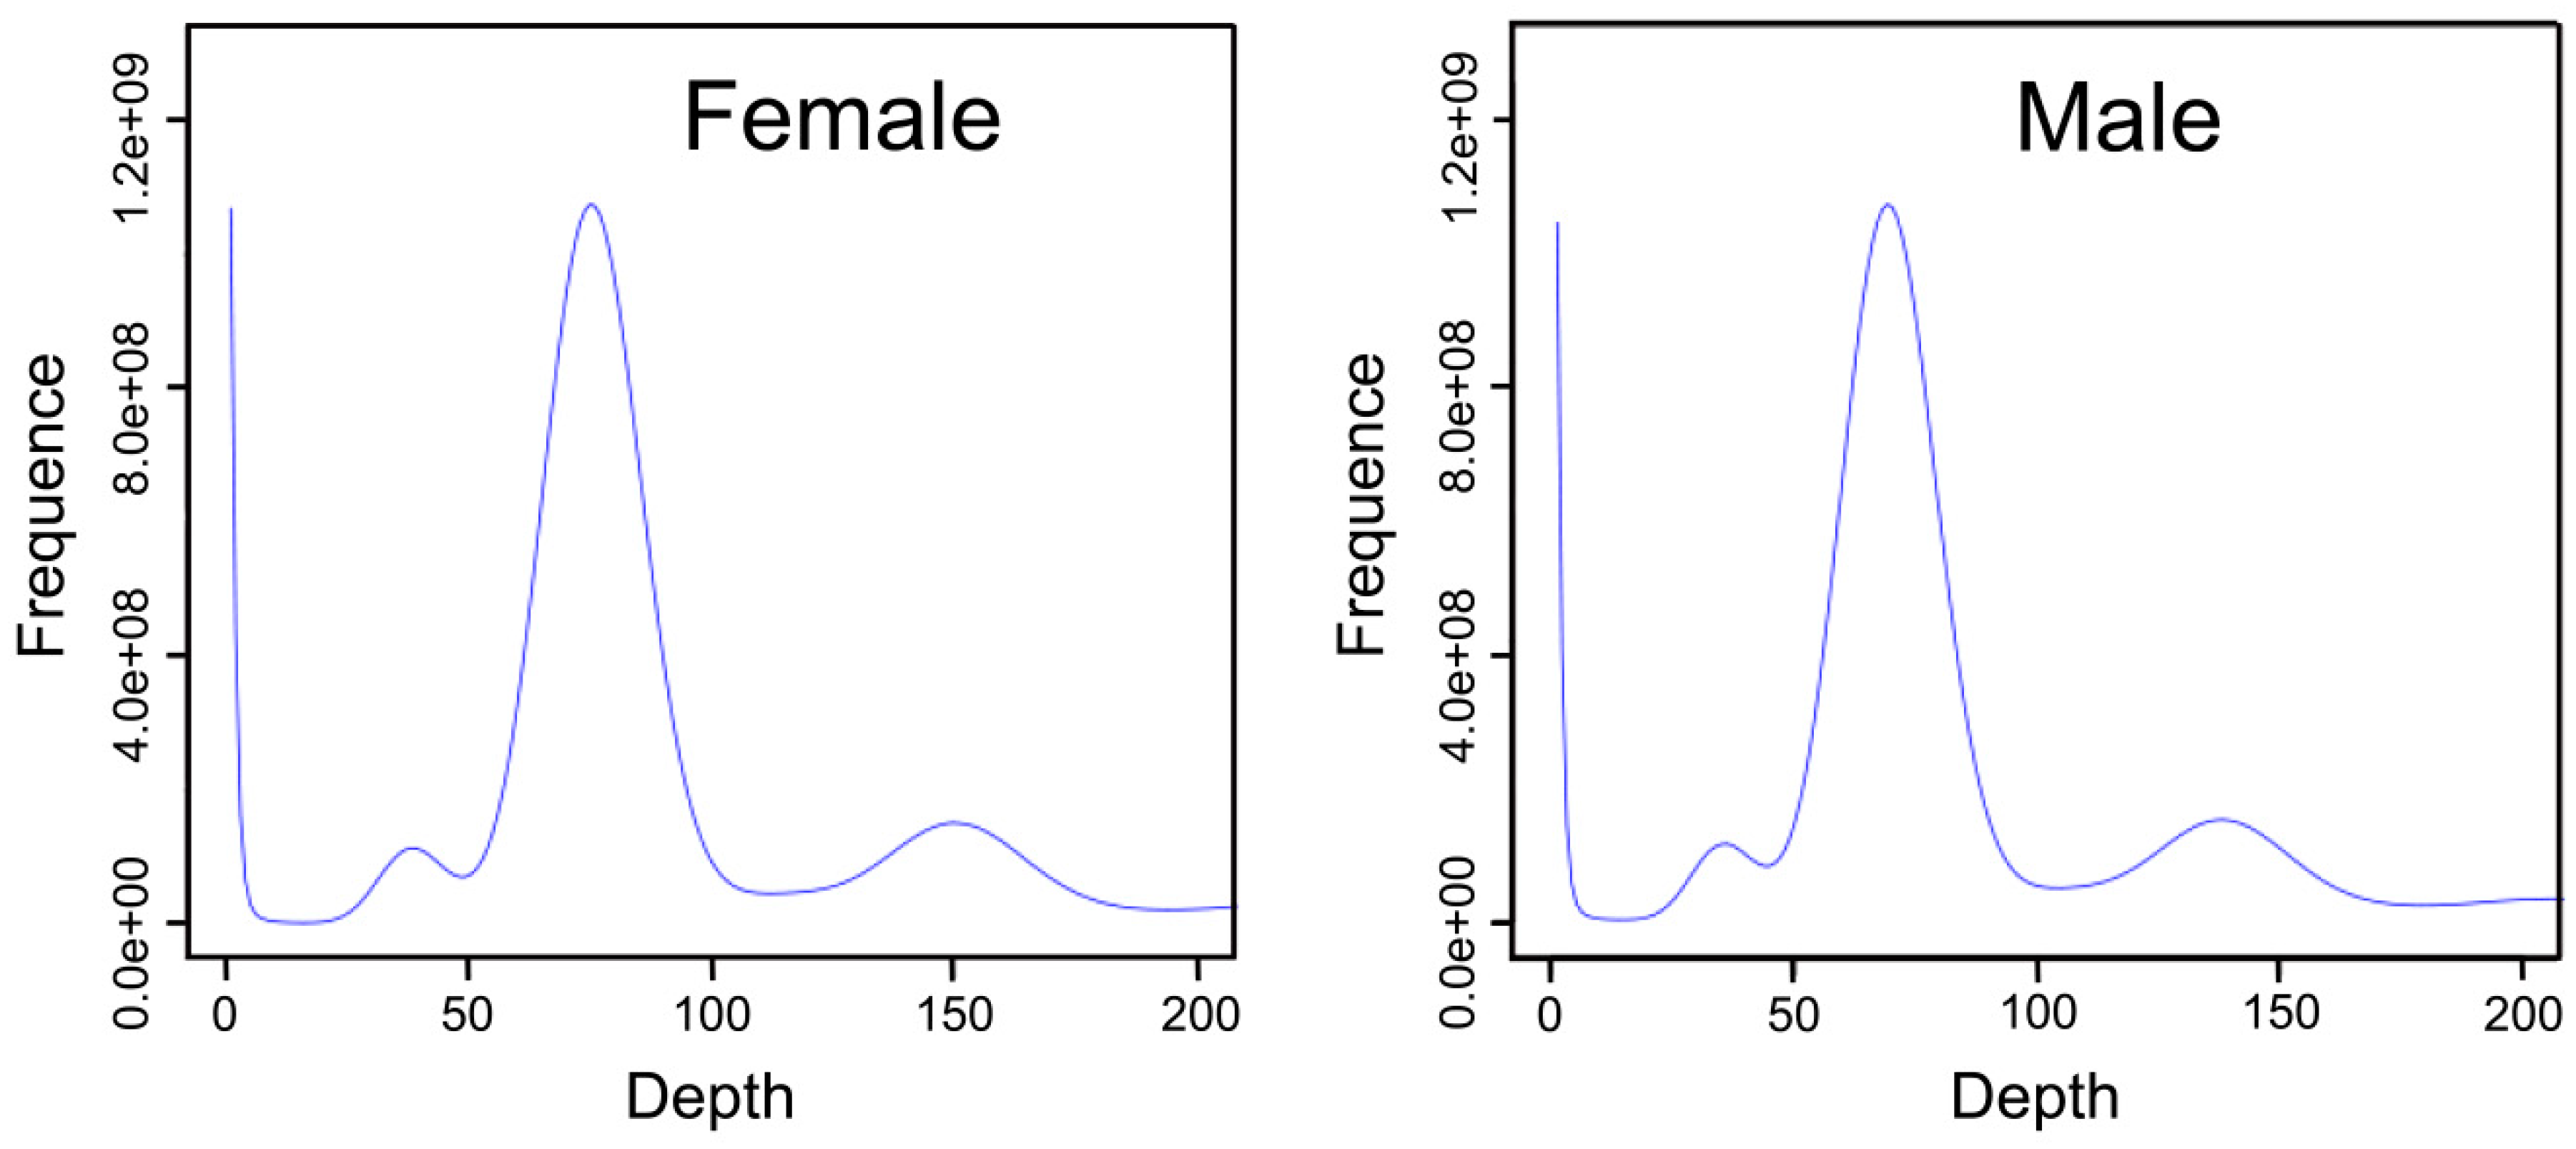
Figure 2.
GC content and depth correlation analysis of female and male S. argus. The x-axis is the percentage GC content and the y-axis represents sequencing depth. The distribution of sequence depth is on the right side, while the distribution of GC content is at the top.
Figure 2.
GC content and depth correlation analysis of female and male S. argus. The x-axis is the percentage GC content and the y-axis represents sequencing depth. The distribution of sequence depth is on the right side, while the distribution of GC content is at the top.
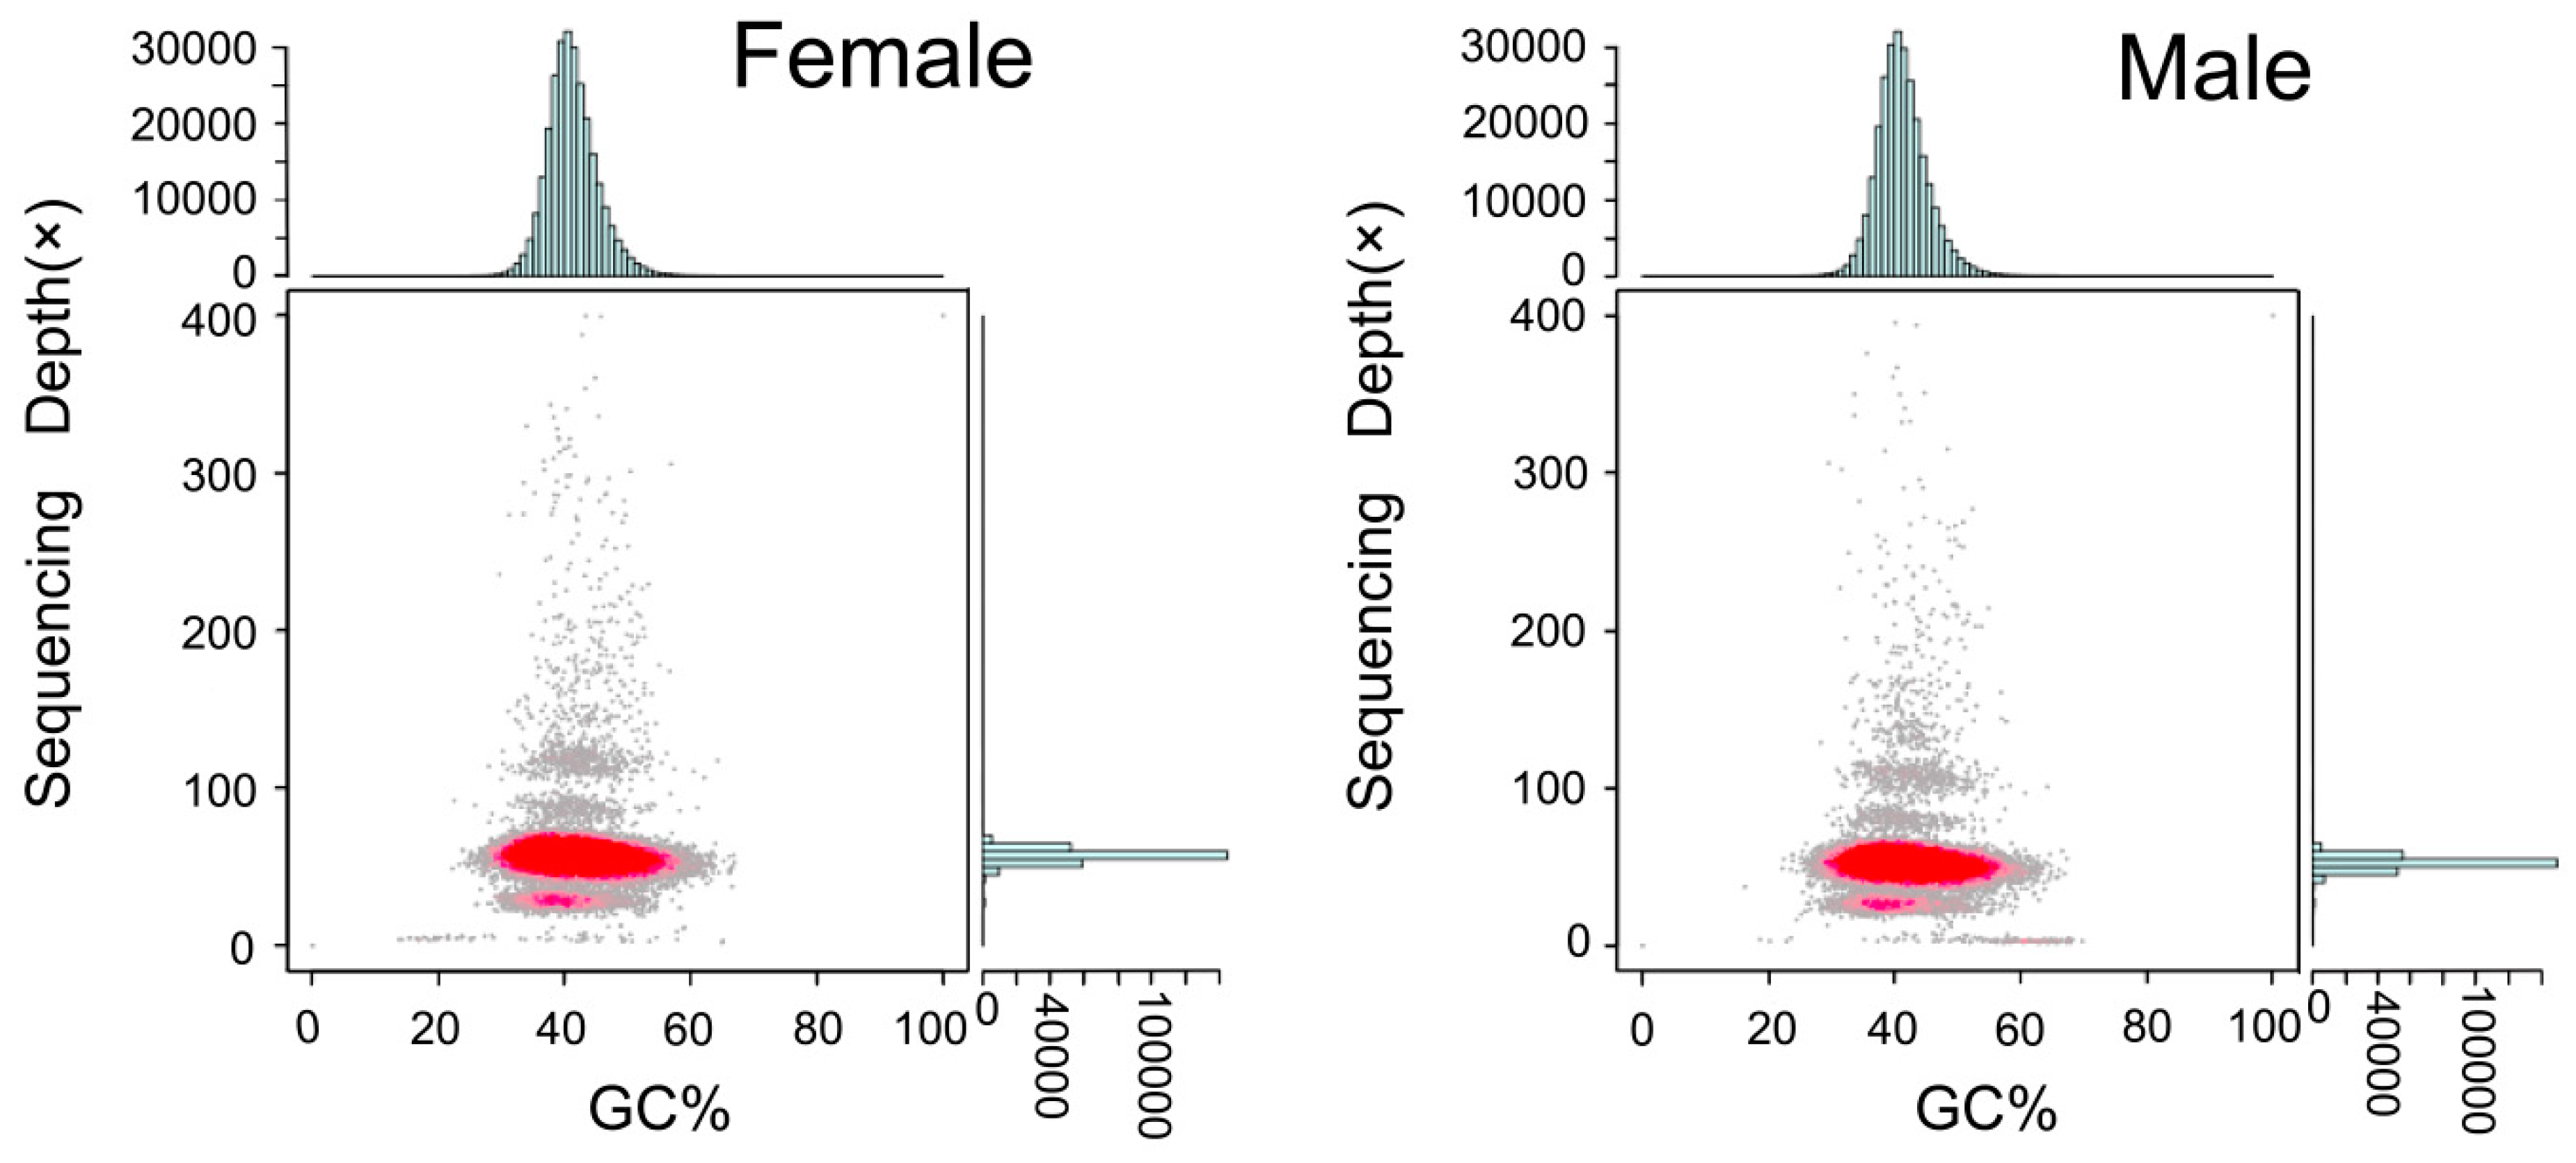
Figure 3.
Structure of the Dmrt1 and Dmrt1b genes. Dmrt1 and Dmrt1b are located on the male and female sex chromosomes, respectively. Numbers indicate base pairs (loci) of exon and intron sequences. Percentages indicate the similarity of Dmrt1 and Dmrt1b. Arrows indicate the start and stop codons. Different colored rectangles represent different exons.
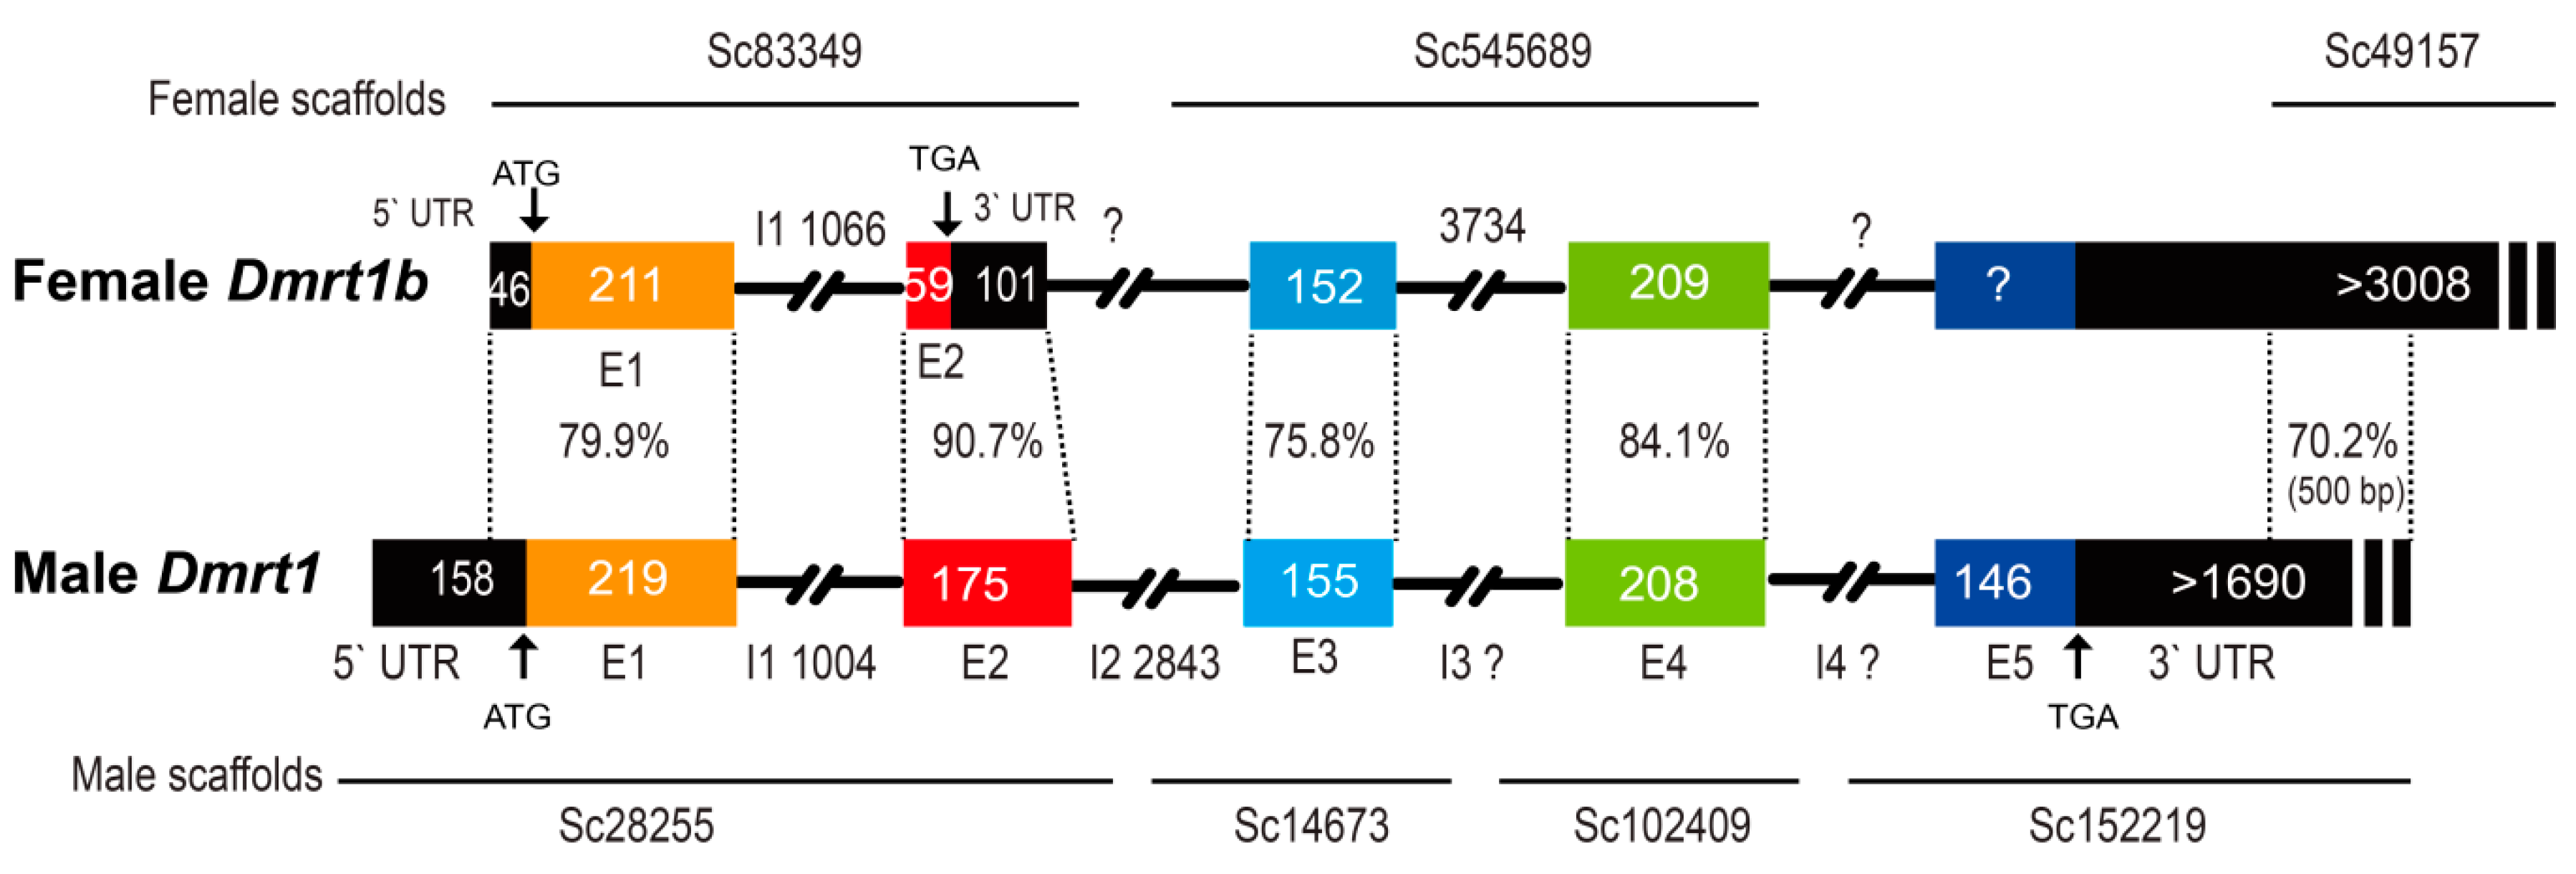
Figure 4.
Frequency of SSR types in the genomic survey of female and male S. argus.


Table 1.
Statistics of sequencing data of female and male S. argus.
| Library | Insert Size (bp) | Raw Base (bp) | Effective Rate (%) | Clean Base (bp) | Error Rate (%) | Q20 (%) | Q30 (%) | GC Content (%) |
|---|---|---|---|---|---|---|---|---|
| female | 350 | 55,808,601,300 | 99.80 | 55,699,379,400 | 0.03 | 96.60 | 91.94 | 41.50 |
| male | 350 | 51,153,870,900 | 99.79 | 51,047,381,700 | 0.03 | 96.63 | 92.03 | 41.52 |
Table 2.
Data statistics and analysis of 17-mer.
| Identity | K-Mer | K-Mer Depth | K-Mer Number | Genome Size (Mbp) | Revised Genome Size (Mbp) | Heterozygous Ratio (%) | Repeat (%) |
|---|---|---|---|---|---|---|---|
| female | 17 | 74 | 45,374,105,016 | 613.16 | 598.73 | 0.37 | 27.06 |
| male | 17 | 68 | 41,637,691,628 | 612.32 | 597.60 | 0.38 | 26.99 |
Table 3.
Statistics of the assembled S. argus genome sequences.
| Identity | Total Length (bp) | Total Number | Max Length (bp) | N50 Length (bp) | N90 Length (bp) | |
|---|---|---|---|---|---|---|
| contig | female | 580,837,740 | 444,961 | 123,323 | 5,747 | 590 |
| male | 582,143,644 | 453,459 | 110,347 | 5,745 | 576 | |
| scaffold | female | 585,986,615 | 335,162 | 231,008 | 13,556 | 821 |
| male | 588,188,524 | 340,134 | 196,230 | 13,591 | 824 |
Table 4.
Gene function annotation statistics of S. argus.
| Database | Number (Female/Male) | Percent (Female/Male) |
|---|---|---|
| NR | 42,825/43,238 | 45.14%/45.38% |
| Swissport | 33,093/33,359 | 34.89%/35.01% |
| KEGG | 40,854/41,245 | 43.07%/43.29% |
| KOG GO | 26,420/26,680 12,428/15,921 | 27.85%/28.00% 13.10%/16.71% |
| Annotated | 42,869/43,283 | 45.19%/45.43% |
| Unannotated | 51,993/51,990 | 54.81%/54.57% |
| Total | 94,862/95,273 | 100%/100% |
Table 5.
SSR (simple sequence repeat) types detected in female and male S. argus.
| SSR Mining | Total (Female/Male) |
|---|---|
| Total number of sequences examined | 335,162/340,134 |
| Total number of identified SSRs | 299,574/299,893 |
| Number of SSR containing sequences | 78,202/77,788 |
| Total number of identified SSRs | 299,574/299,893 |
| Number of sequences containing more than 1 SSR | 39,136/39,104 |
| Number of SSRs present in compound formation | 48,384/48,510 |
© 2019 by the authors. Licensee MDPI, Basel, Switzerland. This article is an open access article distributed under the terms and conditions of the Creative Commons Attribution (CC BY) license (http://creativecommons.org/licenses/by/4.0/).
Share and Cite
MDPI and ACS Style
Huang, Y.; Jiang, D.; Li, M.; Mustapha, U.F.; Tian, C.; Chen, H.; Huang, Y.; Deng, S.; Wu, T.; Zhu, C.; et al. Genome Survey of Male and Female Spotted Scat (Scatophagus argus). Animals 2019, 9, 1117. https://doi.org/10.3390/ani9121117
AMA Style
Huang Y, Jiang D, Li M, Mustapha UF, Tian C, Chen H, Huang Y, Deng S, Wu T, Zhu C, et al. Genome Survey of Male and Female Spotted Scat (Scatophagus argus). Animals. 2019; 9(12):1117. https://doi.org/10.3390/ani9121117
Chicago/Turabian StyleHuang, Yuanqing, Dongneng Jiang, Ming Li, Umar Farouk Mustapha, Changxu Tian, Huapu Chen, Yang Huang, Siping Deng, Tianli Wu, Chunhua Zhu, and et al. 2019. "Genome Survey of Male and Female Spotted Scat (Scatophagus argus)" Animals 9, no. 12: 1117. https://doi.org/10.3390/ani9121117
Note that from the first issue of 2016, this journal uses article numbers instead of page numbers. See further details here.