Greenhouse Gas Emissions in Dairy Goat Farming Systems: Abatement Potential and Cost


Agricultural Economics Research Institute (AGRERI), Hellenic Agricultural Organization (DEMETER), PC. 11528 Athens, Greece
*
Author to whom correspondence should be addressed.
Animals 2019, 9(11), 945; https://doi.org/10.3390/ani9110945
Submission received: 31 August 2019
/
Revised: 5 November 2019
/
Accepted: 5 November 2019
/
Published: 10 November 2019
(This article belongs to the Special Issue Quantification and Mitigation Strategies to Reduce Greenhouse Gas Emissions from Livestock Production Systems)
Abstract
:Simple Summary
Agriculture and particularly livestock farming is associated with the production of certain gases that contribute to global warming, commonly referred to as greenhouse gases. These gases are the result of the use of machinery and other inputs such as fertilizers and pesticides or are associated with the digestion process of animals. In this work, we have analyzed data from dairy goat farms in Greece to estimate the amount of greenhouse gases per kilogram of milk produced and identify farming practices that can result in their reduction. We found that greenhouse gases per kilogram of milk are fewer in farms that are characterized by higher milk production per goat. Furthermore, certain practices like the use of homegrown feed instead of purchased feed and the use of compound feedstuffs or oil-rich feedstuffs like cottonseed cake can result in lower greenhouse gases in goat farms. Also, the analysis suggests that the reduction of greenhouse gases can lead to a reduction of farm income, especially in the case of intensive farms. This finding has to be taken into consideration by policy makers and possible measures to compensate for this income loss have to be explored.
Abstract
Dairy goat farming is an important agricultural activity in the Mediterranean region. In Greece the activity offers occupation and income to thousands of families mainly located in mountainous and semi-mountainous areas of the country where it utilizes low productivity pastures and shrub lands. Furthermore, goats are more resilient to climate changes compared to other species, and are often characterized as ideal for keeping in drought areas. However, there is still limited evidence on total greenhouse gases (GHG) emitted from goat farms and their mitigation potential. In this context, this study aims to estimate GHG emissions of goat farms in Greece and explore their abatement options using an economic optimization model. Three case studies are explored i.e., an extensive, a semi-intensive and an intensive goat farm that correspond to the main goat production systems identified in Greece. The analysis aims to assess total GHGs as well as the impact of abatement on the structures, gross margins and labor inputs of the farms under investigation. The issue of the marginal abatement cost is also addressed. The results indicate that the extensive farm causes higher emissions/kg of milk produced (4.08 kg CO2-eq) compared to the semi-intensive and intensive farms (2.04 kg and 1.82 kg of CO2-equivelants, respectively). The results also emphasize the higher marginal abatement cost of the intensive farm. In all farm types, abatement is achieved primarily through the reduction of the livestock capital and secondarily by other appropriate farming practices, like substitution of purchased feed with homegrown feed.
1. Introduction
Goat farming is an important agricultural activity in Greece since it is mainly located in less favored areas of the country where it utilizes low-productivity pastureland and shrubland. It is estimated that goat farming yields income for 64,049 Greek farms that breed over 3.5 million goats [1]. The activity aims primarily at the production of milk and secondarily at the production of meat. According to Kitsopanidis [2], milk is on average responsible for over 70% of gross revenue of dairy goat farms, with the exception of very hardy, local breeds. It is estimated that 75% of the Greek goat milk is used for the production of cheeses, especially Feta. Furthermore, the activity contributes highly to regional development and helps maintain the population in depressed and marginal areas. Therefore, the preservation of the activity and the income it yields is important not only for farmers but also for policy makers.
The prevailing goat farming system in the country is the extensive one with or without transhumance, in which the nutrition of the livestock is based on grazing. The main characteristic of the extensive breeding farms is the low invested capital and the low-productivity livestock, consisting mainly of native races [3]. More modern and intensive farms that aim to increase their productivity through supplementary feeding, mainly from on-produced cereals and forage, are also present. Specifically, three commercial goat production systems are identified in Greece, namely the traditional extensive farming system, the semi-intensive farming system and the intensive farming system [2]. As mentioned above, in the extensive farming system feed requirements are met mainly through pasturing. In the semi-intensive farming system additional supplementary feed is provided, while in the intensive farming system no pasture is utilized. This heterogeneity among the alternative goat farming systems results in differences in their socioeconomic as well as their environmental sustainability.
One of the main environmental issues associated with livestock farming is the emission of greenhouse gases (GHGs). GHG emissions are particularly high in the case of ruminant livestock farming because of methane production through enteric fermentation [4,5]. The issue of GHG emissions in livestock farms has been addressed in a number of studies that focus mainly on cattle farms [6,7,8,9]. On the other hand, studies that focus on the emission of GHGs from sheep and goat farms refer mainly to meat and wool production farming systems that have different technical and economic characteristics from dairy farms (e.g., [10,11]). In the case of small ruminant dairy farming in Greece, limited studies on GHG emissions from sheep farms and their abatement potential are available (see [12]).
This study aims to address the issue of GHG emissions in dairy goat farms, using an economic optimization model, developed to capture and represent the structure and function of Greek goat farms. The use of such model in GHG studies has the advantage that it accounts for all possible sources of GHG emissions in goat farms and therefore reduced emissions from one source at the optimal solution does not result in increased emissions from other sources. Furthermore, since the model is an optimization model, abatement options are explored within the context of gross margin maximization. In other words, abatement practices and options that are proposed by the model are the least-cost options for the farms. Furthermore, this cost is precisely estimated and marginal abatement cost curves are derived. Thus, the analysis and the results it yields can be useful not only for agriculturalists but also for farmers, agricultural advisors and policy makers.
2. Materials and Methods
Optimization models, and specifically linear programming (LP) models are commonly used in agricultural studies (e.g., [13,14,15,16]). They yield the optimal amongst all feasible farm plans, taking into account technical and agronomic constraints of the farms. When the matter of GHG emissions in livestock and crop livestock farms is addressed, the complexity of the farm operation, the multiple sources of emissions, and the substitution possibilities between alternative activities require the use of a model that can capture all the interrelationships of these activities. That said, a number of studies use LP models to assess GHGs from various sources and identify cost-effective mitigation strategies (e.g., [9,10,17,18,19,20,21]).
The general expression of a linear programming model is as follows [22]:
Subject to the constraints:
where () are the decision variables of the model, they are unknown and determined by the model according to what maximizes gross margin (e.g., number of productive goats, hectares of cereals or forages etc.), are known economic parameters (e.g., gross margin per unit of activity ), () are known technical parameters (e.g., hours of labor or variable inputs per activity ) and are also known parameters that express the availability of inputs (e.g., maximum available labor, capital or land inputs).
The characteristics of the optimization model that was used in this analysis is described in more detail in the following paragraphs. The data used in the analysis is also presented in the same section.
2.1. Model Specification
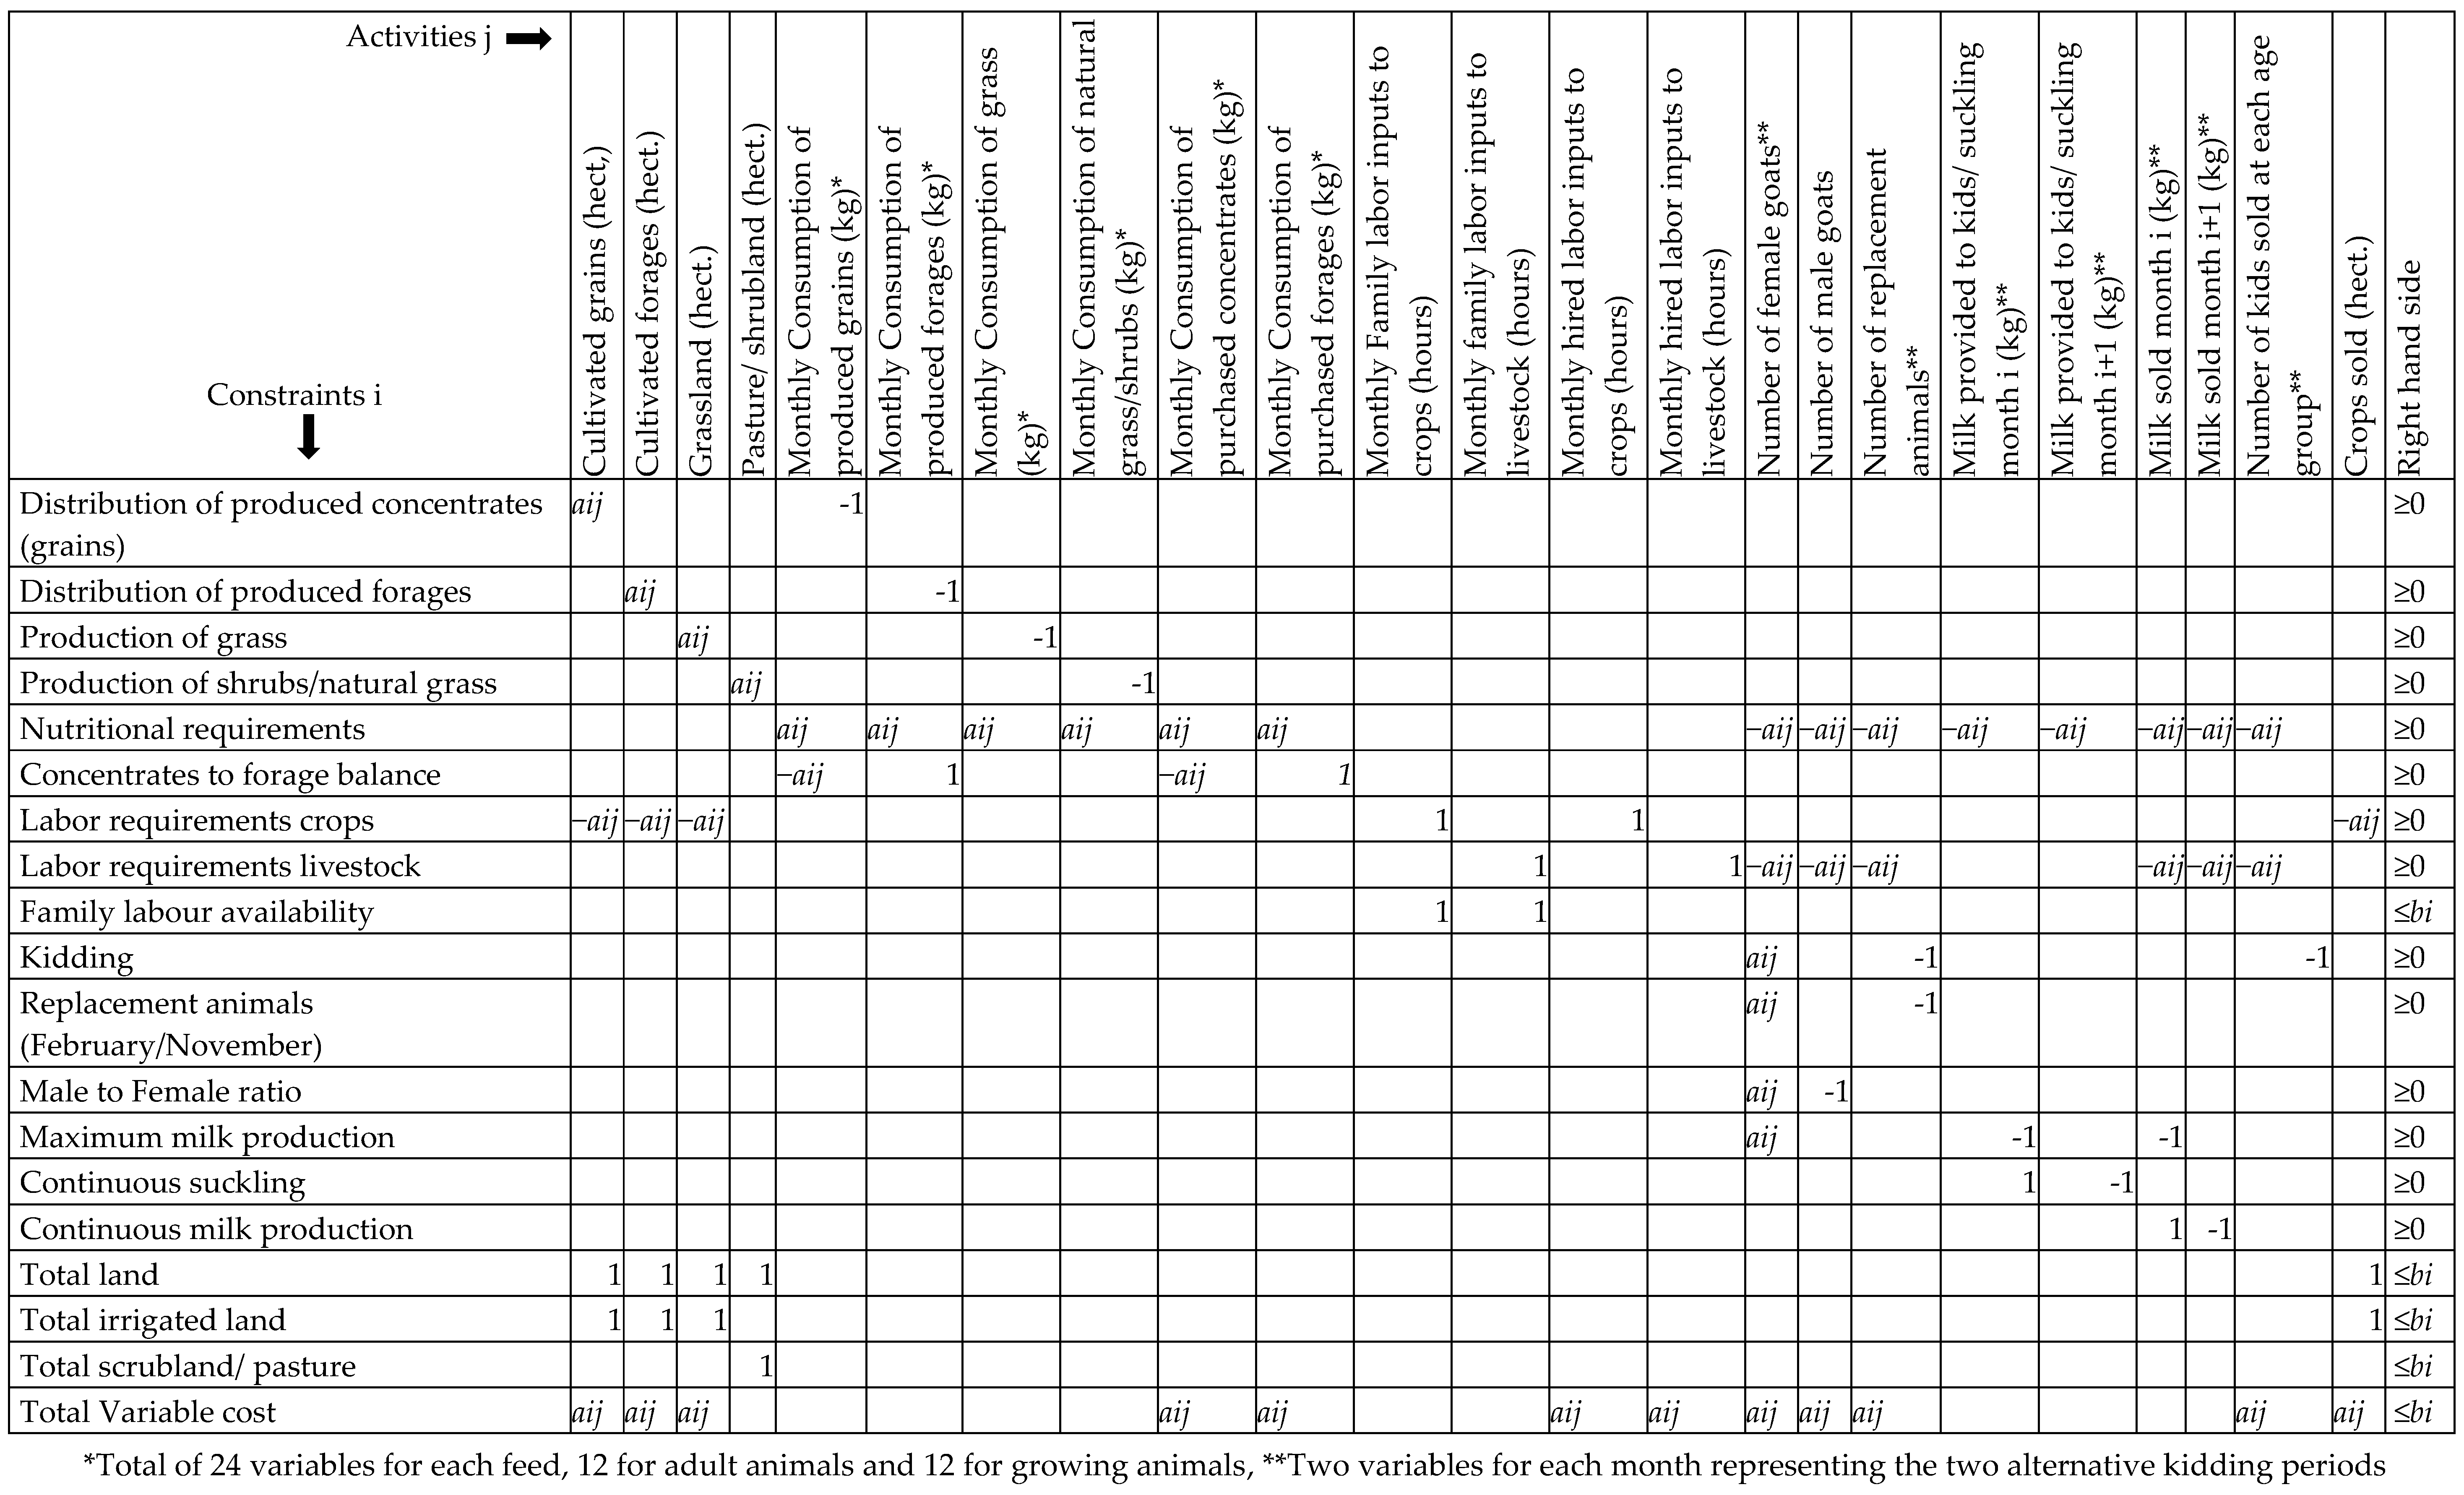
The model used in this analysis has 241 decision variables and 236 technical and economic constraints and it is presented in Figure 1 which represents the LP matrix. The decision variables of the model (Activities i in Figure 1) can be grouped in three main categories. The first one includes all the decision variables that refer to crops, pasture, grassland, shrubland and feeding i.e., to the distribution of produced and purchased feed. The second category refers to labor variables, and the final category to livestock and product variables. In addition to the non-negativity constraint of all decision variables, variables which refer to the livestock capital are restricted to receive only integer numbers and therefore the model is in fact a mixed-integer programming model. The constraints of the model (Constraints j in Figure 1) refer mainly to the feeding of the livestock but also to the availability of labor, land and other inputs. In Figure 1, the constraints of the model and their technical parameters (αij) as well as their right hand side parameters (bi) are presented in all lines except for the first line that presents the activities (xj).
The model is built to accurately reflect the structure and function of Greek goat farms and allocates all their available inputs and resources to the alternative economic activities and practices according to what maximizes their total gross margin (objective function). Therefore, the farm plan it suggests is in economic terms the optimal. It should be noted that the model is built according to the dairy sheep model described in detail in Sintori [23].
2.1.1. Crop, Pasture, Grassland and Feeding Variables
Crop activities of the goat farms involve forage and grain production for livestock feeding but also crop production for sale. The main crops cultivated in Greek goat farms are maize for grain and alfalfa for hay. Other crops may also be cultivated like maize for silage or barley for grain. For each crop, pasture and grassland used, one variable is included in the model that expresses the land in hectares allocated to the activity. The economic parameter of the specific variable is negative and expresses the cultivation cost per hectare excluding labor which is represented by a different set of variables. Feeding variables are defined according to month, type of feed and livestock category. In other words, the consumption of each feed (e.g., produced maize, purchased maize, produced alfalfa hay, purchased mixtures) is presented monthly and for two separate categories of livestock i.e., growing and adult animals. This structure allows the model to simulate farm decision making regarding the distribution of homegrown feed and purchase of additional feeds throughout the year. Furthermore, the use of such detailed data on feeding practices of the farms allows the model to be accurate and realistic regarding the predicted type and amount of feed required by the livestock, but also the methane emitted from enteric fermentation. Finally, it should be emphasized that the economic parameters of the variables that refer to purchased feed are negative and represent the price per kilo for each feed, while the economic parameter of each variable that refers to the consumption of homegrown feed is zero, since the cost of production is in fact the economic parameter of the related crop variable and, therefore, it has already been accounted for.
2.1.2. Labor Variables
In order for goat farms to operate one main required input is labor. In Greece, goat farms are in their majority traditional and family owned with very low mechanization degree, since extensive and semi-intensive farms rarely even use milking machines. The amount of labor inputs required in these farm types are also increased because of grazing. Labor variables incorporated in the model represent the amount of labor inputs required each month of the year in hours. The model allocates the available family labor between all crop and livestock activities of the farm. Variables representing the additional hired labor required each month in the above activities are also incorporated in the model. The economic parameters of these variables are negative and represent the wage per hour in livestock and crop activities.
2.1.3. Livestock and Product Variables
Livestock variables incorporated in the model refer to the number of female and male goats, replacement animals and kids that constitute the livestock of the farm. Two variables are used to represent the female goats that are kept in the livestock representing two different kidding periods. One variable refers to the goats that give birth in late November and the other to the goats that give birth in late February. These two kidding periods were chosen to reflect the practices of Greek goat farms, that aim to satisfy the increased demand for goat meat during Christmas and Easter. The economic parameters of these variables are negative and represent the annual variable cost of keeping and breeding one animal for one year, except for labor and feeding cost, since both labor and feeding are represented by the variables already described in previous paragraphs. As far as kids are concerned, they are represented in the model by a set of variables according to their age group in months. Specifically, 12 variables are used in the model to reflect the young kids between the ages of one and six months born during the alternative two kidding periods. The economic parameters of these variables are positive and express the gross margin per animal sold at each specific age. As mentioned above, all livestock variables are allowed to receive only integer numbers.
The final set of variables incorporated in the model represents milk production per month and per kidding period. Milk variables include variables that refer to suckling as well as variables that refer to milk production for sale. The economic parameter of the milk for sale variables is positive and expresses milk price.
2.1.4. Feeding Constraints
The main component of the model reflects the balance of the monthly feed requirements of the livestock. Minimum intake of dry matter, net energy of lactation, nitrogen and fiber matter is ensured through monthly constraints. The feed requirements of the livestock are estimated according to Zervas et al. [24] (see Table 1). For the female productive goats these feed requirements include requirements for preservation, activity and pregnancy. Extra requirements for lactation are estimated per kilogram of produced milk. For male productive goats, the requirements refer to their preservation, activity and reproduction. For the replacement animals, the feed requirements are estimated every month taking into account the live-weight increase. The weight increase is also taken into account in the case of the kids, for which feed requirements are estimated for the period that they remain in the farm.
On-produced feed crops, external feed inputs, available grassland and pastureland/shrubland are used for the balance of the feed requirements of the flock. The composition and the nutritional value per kilogram of feedstuff is taken from Kalaisakis [25], Jarrige [26], Zervas et al. [24] and Feedipedia [27] (Table 2). The nutritional value and the production of grassland and pasture are estimated taking into account Papachristou [28], Zervas et al. [24], F.R.I. [29], Platis and Papanastasis [30], Platis et al. [31]. Additional monthly constraints are incorporated in the model to ensure minimum and realistic intake of concentrate feeds, according to the feeding practices of the farms.
2.1.5. Additional Constraints
Another component of the model ensures that monthly labor requirements of all production activities are balanced, mainly with family labor inputs. Additional hired labor can be used, if necessary, in both livestock and crop activities.
Land constraints are also incorporated in the model to ensure that the total area utilized by the various crop activities, grassland and pastureland/shrubland is smaller than the available land of the farm. Moreover, one land constraint refers to total available irrigated land of each farm and another to total available pastureland/shrubland. A final set of constraints reflects the demography of the livestock and the maximum milk and meat production capabilities per goat.
2.1.6. Greenhouse Gas (GHG) Emissions
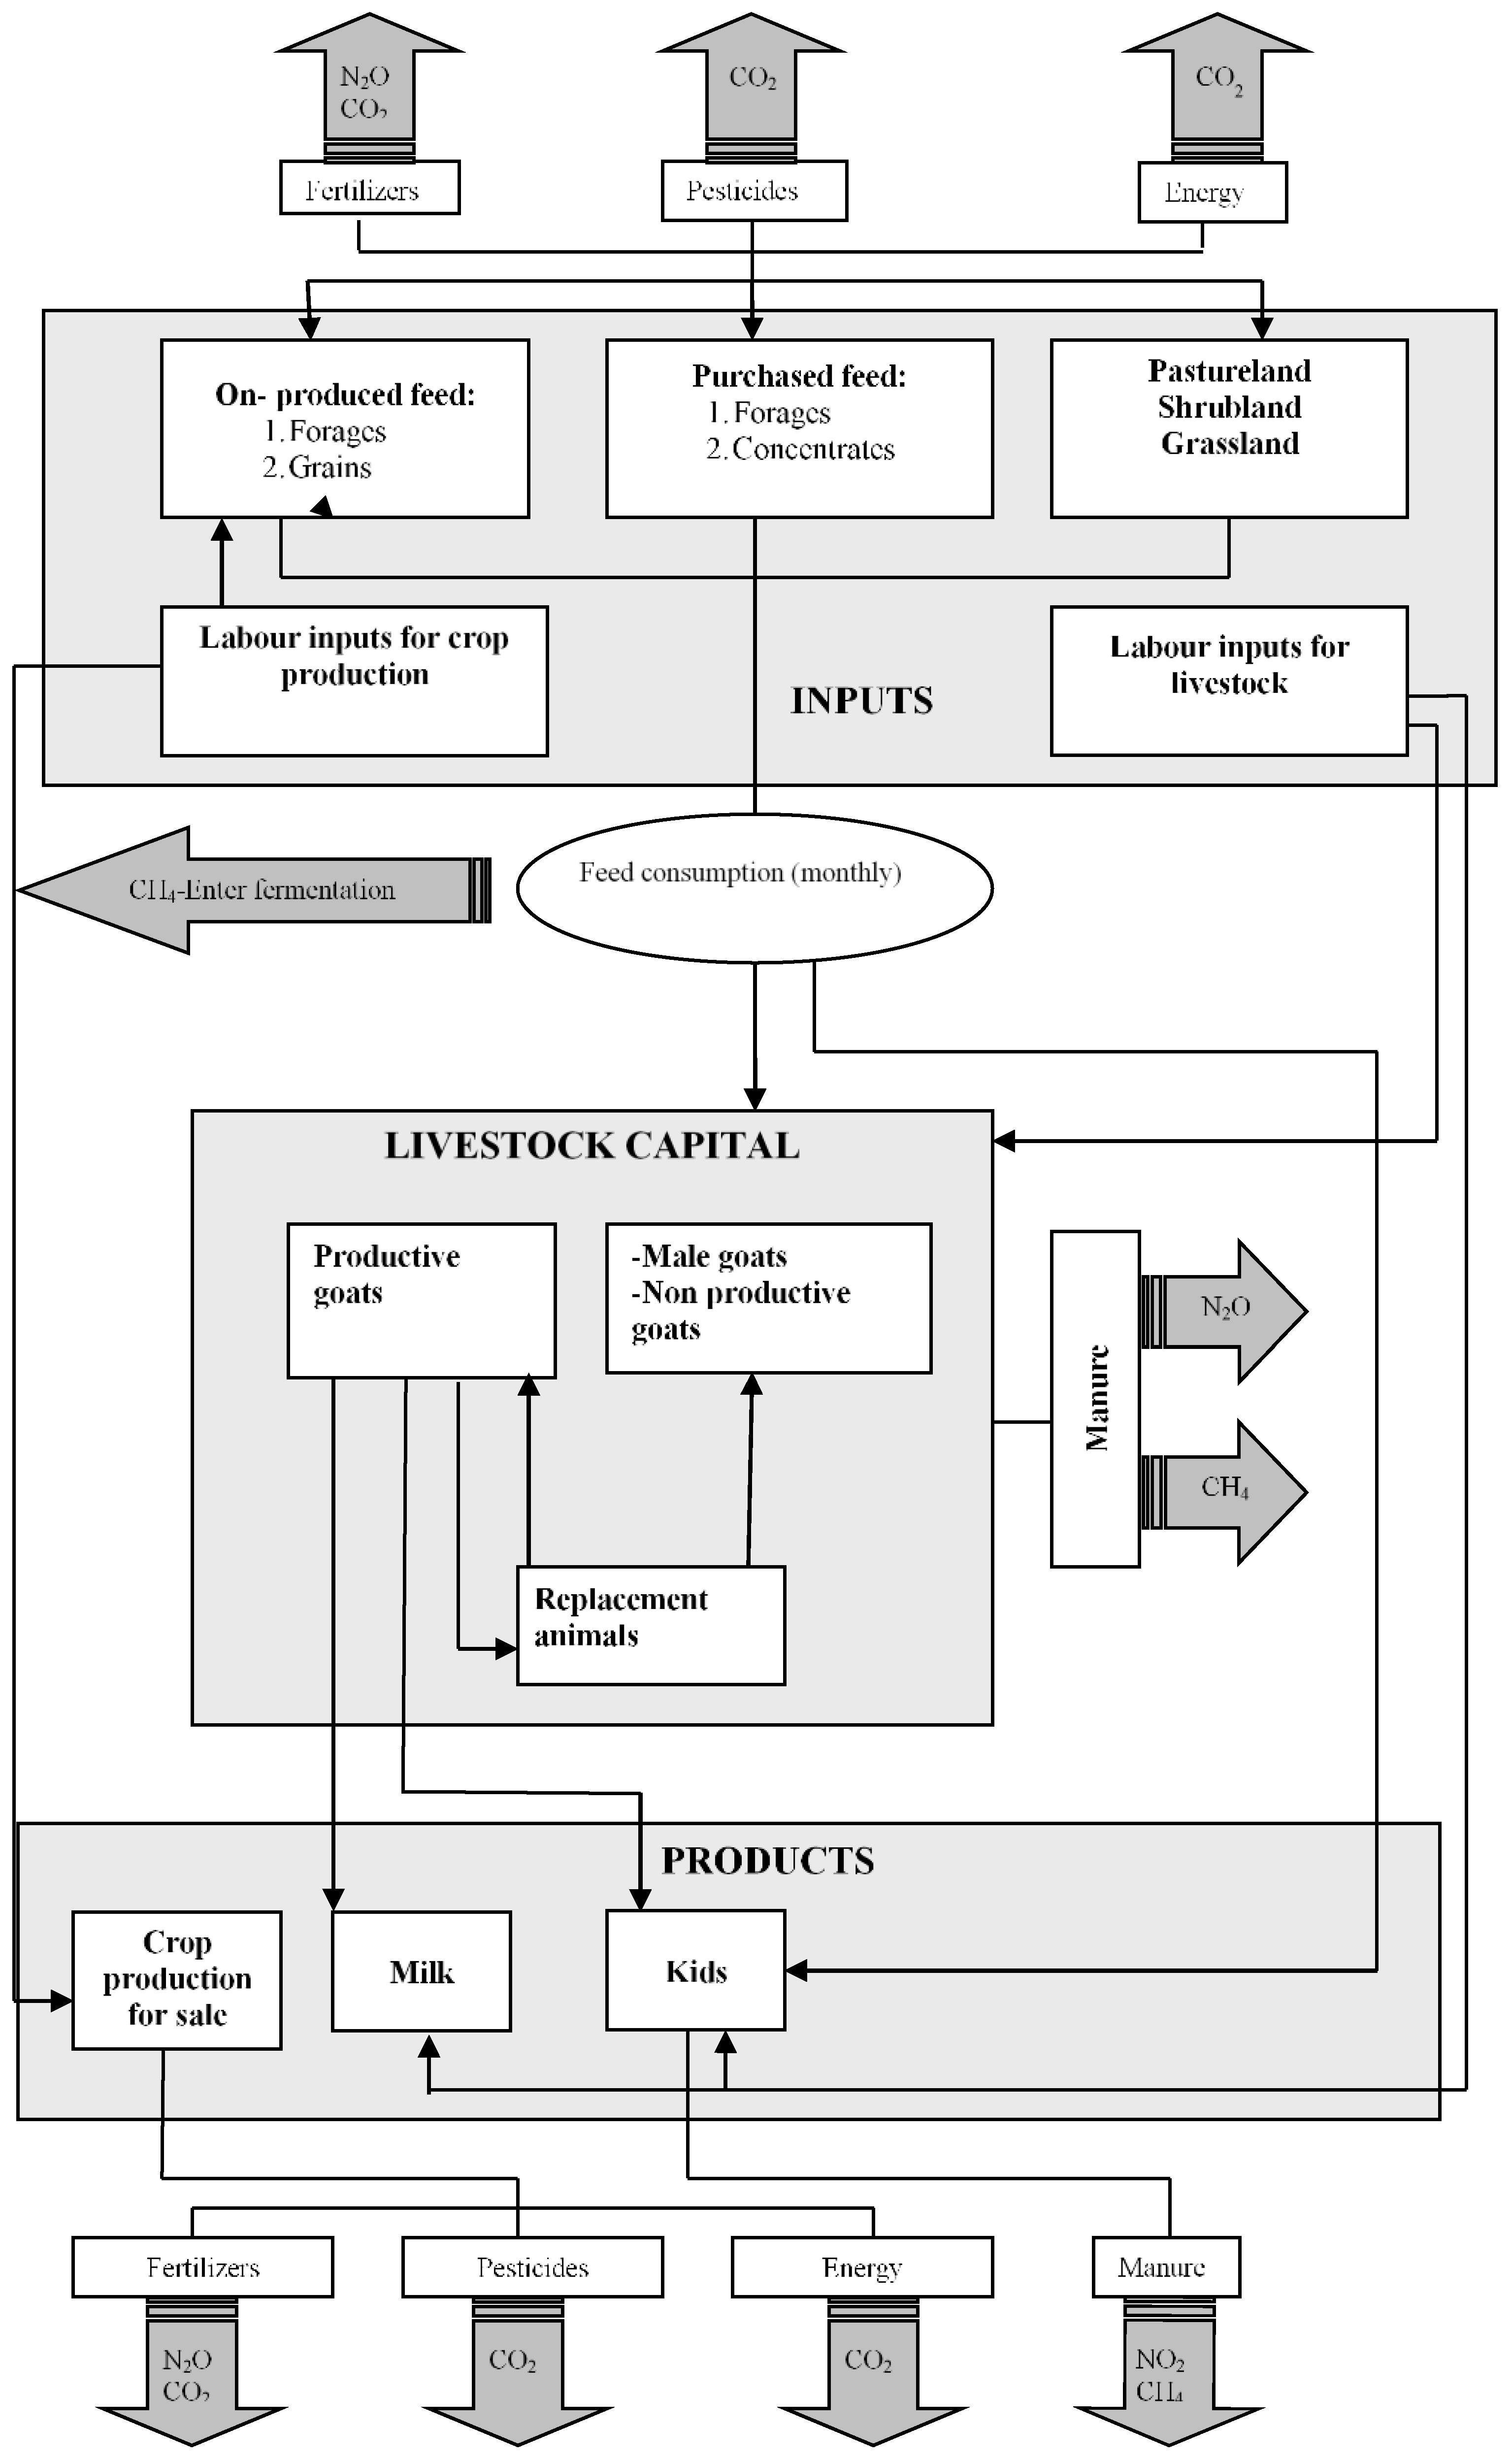
In order to accurately derive mitigation options for the goat farms, it is important to identify all potential sources of GHGs related to the activity, and include them in the model. The main GHGs, in livestock farms are methane (CH4) from enteric fermentation and methane and nitrous oxide (N2O) from manure. In addition, in a crop-livestock farm, nitrous oxide emissions (N2O) from nitrogen fertilizers should also be accounted for (see for example [10,32]). Carbon dioxide emissions (CO2) from the use of machinery are an additional source of GHGs. A graphical representation of the model used in the analysis and the emission sources it includes is presented in Figure 2. The emissions sources that the model takes into account are also summarized in Table 3.
It should be noted that CH4 and N2O have been converted to CO2-equivalents (CO2-eq) using the conversion factors proposed by the Intergovernmental Panel on Climate Change (IPCC) [4] i.e., 1 kg of N2O = 298 kg of CO2-eq and 1 kg of CH4 = 25 kg of CO2-eq. The method used to estimate emissions from various sources in the goat farms is described in more detail in the following paragraphs. Emissions from all sources estimated as CO2-equivalents are added together to estimate total GHG emissions of the goat farms.
Methane production from enteric fermentation is the most important source of GHGs in small ruminant livestock farms and it is associated with the feeding practices of each farm. Farmers choose to feed their livestock with on-produced feed and purchased feed taking into account their cost and their nutritional value. Linear programming models select the optimal combination of feedstuff and suggest the ration that helps maximize gross margin (least cost ration). For this reason, the ration used in this analysis is not fixed and methane emissions are predicted from intake, taking into account the requirements of the livestock estimated as previously described and the composition of feedstuff, that can be found in Table 2 (see also [33,34]). Specifically, for each of the variables that refer to feed consumption the methane emissions per kilogram have been estimated and included in the model as the technical parameter of this variable in a new constraint regarding GHG emissions. To estimate the percent of gross energy intake lost as methane from enteric fermentation (ECH4/EB) the following equation was used [33]:
where: ADL = g of lignin/kg of DM, EE = g of ether extract/kg of DM, St = g of starch/kg of DM and CP = g of protein/kg of DM.
Methane emissions from manure are estimated using the Tier 2 methodology proposed by the IPCC [4], which takes into account the management system of manure and the energy consumption of livestock (Equation (3)).
where: EF = annual methane emissions from manure (kg CH4/head/year), VS = daily volatile solid excreted (kg of dry matter/head/day), Bo = maximum methane producing capacity for manure produced (0.18 m3 CH4/kg VS for Greece), MCF(S,k) = methane conversion factors for each manure management system and climate region (1.5% for Greece), MS(S,k) = fraction of manure handled using manure management system S to climate region k (estimated for each farm according to their farming practices) and 365 are the days within the year.
VS is estimated from the gross energy intake (GE) expressed in MJ/head/day, the digestibility of the feed (DE/100) e.g., 65%,the ash content of manure (ASH/100) (8% for goats according to the IPCC) and the conversion factor for dietary GE per kg of dry matter (18.45 MJ/kg), using Equation (4):
The methodology to estimate the energy requirements per livestock category, which is necessary for the implementation of the Tier 2 methodology has already been presented.
Direct N2O emissions from manure management and pastureland are estimated according to the Tier 1 methodology [4], using the live weight of each livestock category (Equation (5)):
where: N2OD(mm) = direct Ν2Ο emissions from manure management kg/year/head, Nex = annual N excretion (kg of N/head/year), EF(s) = emission factor for direct Ν2Ο emissions from manure management system S (kg N2O-N/kg N). EF(s) equals 0.02 kg N2O-N/kg N when manure is managed in solid storage and 0.01 kg N2O-N/kg N when manure is deposited on pasture [4]. It should be noted that according to the IPCC guidelines Ν2Ο emissions generated by manure deposited on pastures is reported under Emissions from managed soils. In this analysis, however, these emissions have been considered, so that comparison between grazing and housed animals can be made.
Nex is estimated taking into account the typical animal mass (TAM) in kg/head and the N excretion rate using the equation (Nrate for goats = 1.28 kg of N/1000 kg of animal mass/day):
where 365 are the number of days within the year.
According to the IPCC (2006), for the estimation of indirect Ν2Ο emissions, first the fraction of Ν that volatilizes as ΝΗ3 and ΝΟx is estimated according to Equation (7) and then the amount of manure nitrogen that is lost due to volatilization of NH3 and NOx is estimated using Equation (8):
where: MMS stands for manure management system, FracGasMS(s) = is the Fraction Ν that volatilizes as ΝΗ3 and ΝΟx (0.12) and EF4 = emissions factor for Ν2Ο from Ν that volatilizes (0.010 N2O-N/kg ΝΗ3-N + ΝΟx –N volatilized).
In our analysis, we have also included direct and indirect N2O emissions from the use of nitrogen fertilizers. First, the total amount of nitrogen applied in fields has been calculated using the amount and the type of fertilizer (see also [17,34]). Then direct and indirect emissions from the applied N have been estimated according to the Tier 1 methodology and the emission factors proposed by the IPCC [4].
Carbon dioxide linked to energy use is another GHG of crop-livestock farms. The main sources of energy in these farms are fuel (mainly diesel) and electricity (see also [7]). To estimate the emissions from energy use, fuel or electricity requirements for every farm operation and type of machinery are accessed and multiplied by appropriate emission factors [10]. Specifically, as far as electricity is concerned and due to the fact that in Greece lignite is used for the production of electricity, the emission factor considered in the analysis is quite high (0.855 kg of CO2-eq per KWh). The emission factors per liter of petrol and diesel used in the analysis are 2.23 and 2.66 kg of CO2-eq, respectively.
Other inputs, like fertilizers and pesticides have also caused GHG emissions when they were manufactured. These emissions have been taken into account as well, using farm-level data to estimate the amount of inputs used and related literature to estimate the emissions caused by the manufacture of these inputs. Carbon dioxide emissions from the manufacture of fertilizers are assumed 0.3 kg of CO2 eq/kg of N, 0.9 kg of CO2 eq/kg of P and 0.6 kg of CO2 eq/kg of K. The energy requirements for the manufacture of herbicides, insecticides and fungicides are 287 MJ/kg, 263 MJ/kg and 195 MJ/kg, respectively [35,36,37,38,39]. Emissions are then calculated by multiplying the total energy requirements with 0.069, which is the amount of CO2 produced per MJ of energy consumed.
Other pre-chain emissions have also been estimated and included in the analysis, following the work of Olesen et al. [7]. As mentioned above, farmers choose whether to feed their livestock with on-produced or purchased feed. Therefore, N2O emissions from nitrogen fertilizers and CO2 emissions from energy requirements have also been estimated per kilogram of purchased feed, according to the methodology that has already been presented in the previous paragraph. However, to estimate the amount of inputs (e.g., fertilizers) required for the production of the purchased feed data from 150 farms producing these feeds and operating in Continental Greece have been used. The data is part of a larger data set obtained during the implementation of the program “Search for Innovative Occupations of Tobacco Producers in the Rural Sector (Measure 9, Reg (EU) 2182/02)” and involve detailed information regarding the practices used to produce feedstuff commonly purchased by goat farms.
The original optimization model presented in Figure 1 was used to obtain the optimal farm plan of the goat farms. GHG emissions from various sources and total GHG emissions were then estimated at this optimal solution and used as the basis of our estimations (0% abatement level). The second step of our methodology is to derive the optimal farm plan across increasing levels of abatement, and assess impact on farm structure and gross margin. Following a number of studies (e.g., [17,23,40]), this was achieved by inserting an additional constraint in the model. Specifically, if is the level of abatement ( < 1) and e0* the total emissions at the optimal farm plan, then a new constraint is inserted in the model which restricts total farm emissions below (1 − )e0*. The shadow price of this constraint is used to estimate GHG marginal abatement cost for each production system. Additionally, marginal abatement cost curves are derived for each farm type. In order to obtain the marginal abatement cost curves the right-hand side parameter of the emissions constraint was reduced marginally i.e., 1 tone, and the impact on gross margin was estimated. This procedure was performed a number of times to derive the cost curve. It should be emphasized that this kind of sensitivity analysis is usually performed automatically in LP models, but in this analysis some variables are restricted to receive only integer numbers. Therefore, sensitivity analysis could not be performed automatically and marginal costs were obtained manually.
2.2. Materials
To estimate the parameters of the model (cj, aij and bi) data from actual goat farms were used. Studies that implement the LP methodology commonly utilize data from representative or typical farms of the region under study (see for example [14]). LP models are not statistical models and, therefore, data from a large number of farms is not usually required. On the other hand, to increase the predictive ability of such models detailed data was used and the model was validated through the comparison of the predicted values (optimal solution) and the actual values of the representative farms. In this analysis, data from three goat farms were used. The goat farms were selected to represent the common production systems identified in Greece. Table 4, summarizes the main characteristics of these production systems as described in the literature. All of the above characteristics were taken under consideration during the selection of the goat farms, the characteristics of which are also presented in Table 4. All farms are located in Continental Greece, specifically the intensive and the extensive farms, were located in the region of Thessaly (Prefectures of Karditsa and Magnesia, respectively) and the semi-intensive farm in the region of Epirus (Prefecture of Preveza).
As can be seen in Table 4, the livestock of the extensive farm consists of hardy local breeds that are characterized by low productivity. More specifically, the farm breeds 350 reproductive female goats with an annual production of milk of 115 kg/goat. The average live-weight of the goat is 50 kg and the prolificacy index is 1.2.
The farm produces barley and uses only 2 hectares of grassland. Feeding of the livestock is based mainly in pasturing, since the farm uses 100 hectares of summer pasture and 50 hectares of winter pasture (mainly shrub cover). Additional feed is purchased, mainly maize, cotton seed and alfalfa. Additional parameters used in the model regarding the extensive farm can be found in Table 5.
The livestock of the semi-intensive farm consists of 300 female productive goats, with an annual milk production of 300 kg/goat and a prolificacy index of 1.5. The farm maintains maize cultivation for grain production and utilizes 50 hectares of pastureland (mainly shrub cover). Additional purchased feed is used, namely maize, barley, alfalfa and ready to buy feed mixes for goats. Table 5, summarizes the main technicoeconomic characteristics of the semi-intensive farm.
Finally, the intensive farm has a livestock of 300 female productive goats with an annual production of milk of about 520 kg/goat, an average live-weight of 70 kg and a prolificacy index of 1.8. For the feeding of the highly productive livestock, maize for grain and forage production, alfalfa and barley are cultivated. Additionally, special feed mixtures and alfalfa is purchased (see also Table 5).
The detailed technical and economic data required from the three farms were obtained in the summer of 2015 and refer to the year 2014.
3. Results
Carbon emissions at the optimal farm plan for the extensive, the semi-intensive and the intensive farms were first estimated and are presented in Table 6, Table 7 and Table 8, respectively. The constraint on total emissions was then inserted and the emissions at the new optimal farm plans were again obtained for various levels of abatement (α = 10%, 15% and 20%), through parametric optimization. Emissions per source at various levels of abatement are also presented in Table 6, Table 7 and Table 8. The values of certain variables of the model, that summarize the optimal farm plan at these abatement levels for the extensive, the semi-intensive and the intensive farm, are presented in Table 9, Table 10 and Table 11, respectively. This way, the best abatement strategy for each farm can be identified. Finally, the marginal abatement cost for each of the farms was estimated and the marginal abatement cost curve is built and presented in Figure 3, Figure 4 and Figure 5.
3.1. GHG Emissions
As can be seen in Table 6, Table 7 and Table 8, the results of the analysis emphasize the significance of CH4 in goat farms. Methane represents 75%, 65% and 52% of total emissions of the extensive, the semi-intensive and the intensive farms, respectively. Methane emissions refer mainly to CH4 from enteric fermentation, as the CH4 produced from manure management is negligible. Methane is particularly high in the extensive-farming system, where the feeding of livestock is based on grazing. On the other hand in the case of the intensive farm, methane from enteric fermentation is considered low, because of the high amount of compound feed used in the ration. Nitrous oxide emissions from manure management are also a significant source of GHGs in dairy goat farms, since it accounts for 20%, 25% and 34% of total emissions of the extensive, the semi-intensive and the intensive farming systems.
Emissions per kg of goat milk are estimated at 4.08, 2.04 and 1.82 kg of CO2-eq for the extensive, the semi-intensive and the intensive dairy goat production system respectively. The carbon footprint of goat milk is particularly high in the case of the extensive-farming system. On the other hand in the semi-intensive and the intensive farming system emissions per kg of milk are low and comparable to the emissions estimated for cow’s milk (see also [6,41,42]). The reasons for this variation of carbon footprint among the alternative farming systems are the high productivity of more intensive farms and the significant amount of compounds in the ration used in the semi-intensive and the intensive farms, compared to the low productivity of the extensive farms and the grazing/forage-based nutrition.
As can be seen in Table 6, Table 7 and Table 8, when emissions are restricted to various levels, the emissions per kg of produced milk were also reduced, in all farm types. In other words, lower levels of total farm emissions correspond not only to lower milk production levels but also to lower carbon footprint of milk. Specifically, emissions from enteric fermentation per kg of milk are reduced across various levels of abatement, as the result of adopting appropriate feeding practices. Carbon dioxide emissions from purchased feed are also reduced, which indicates that either farms purchase fewer feedstuffs or purchase feedstuffs that cause fewer emissions when they are produced. These results depict the optimal abatement plan for goat farms, as will be discussed in more detail in the next paragraph.
3.2. Abatement Cost and Strategies
Table 9, Table 10 and Table 11 summarize the optimal farm plan of the extensive, semi-intensive and intensive farm. The tables emphasize the fact that in all cases abatement has a negative impact on farm gross margin, particularly in the case of the intensive farm. Specifically, in the intensive farm 10% and 20% reduction in emissions result in 9% and 18% loss in farm gross margin, respectively. The reduction in farm gross margin in the case of the semi-intensive and the extensive farm, when emissions are reduced by 10% and 20%, is about 2% and 5%, respectively.
The impact of abatement in the case of the intensive farm can be explained by the high productivity and specialization of the farm in milk production. Over 85% of the gross production value of the farm comes from milk production, while milk yield/goat and price of milk/kg are very high (520 kg/goat and 0.73 €/kg of milk, respectively). The high productivity of the intensive farm is also emphasized by the high gross margin per goat in Table 11.
Furthermore, the analysis indicates that, in all farm types, the mitigation of GHGs is primarily achieved by the reduction of the herd size, especially when high levels of abatement are imposed. Specifically, in the extensive farm 10% and 20% abatement leads to 7% and 16% reduction in livestock size, respectively. In the case of the semi-intensive farm the reduction in livestock size is 8% and 17%, while in the intensive farm the reduction is even higher, 9% and 19%, respectively. These findings are in accordance with previous studies regarding mitigation of GHGs in livestock farms (see for example [17,23]).
However, adjustments in farming practices may also achieve some level of abatement. Specifically, as previously commented, the results indicate that the reduction of purchased feed and their substitution with on-produced feed is a strategy that can lead to lower emissions in all goat production systems. However, as can be observed in the case of the extensive farm, the use of purchased cottonseed cake is suggested as good practice to reduce emissions, since the amount consumed per goat either remains stable or increases across the various levels of abatement. The explanation for this finding lies in the fact that the inclusion of oil-rich feedstuffs in the ration of ruminants can lead to lower CH4 emissions from enteric fermentation [43].
Furthermore, in the case of the semi-intensive and the extensive farms, the use of pastureland/shrubland and grassland is also included in the optimal farm plans, when abatement is imposed. In these low productivity farms, the use of pasture and grassland and the switch to on-produced feed reduce the feeding cost and compensate at a great extent the loss in total gross margin caused by abatement.
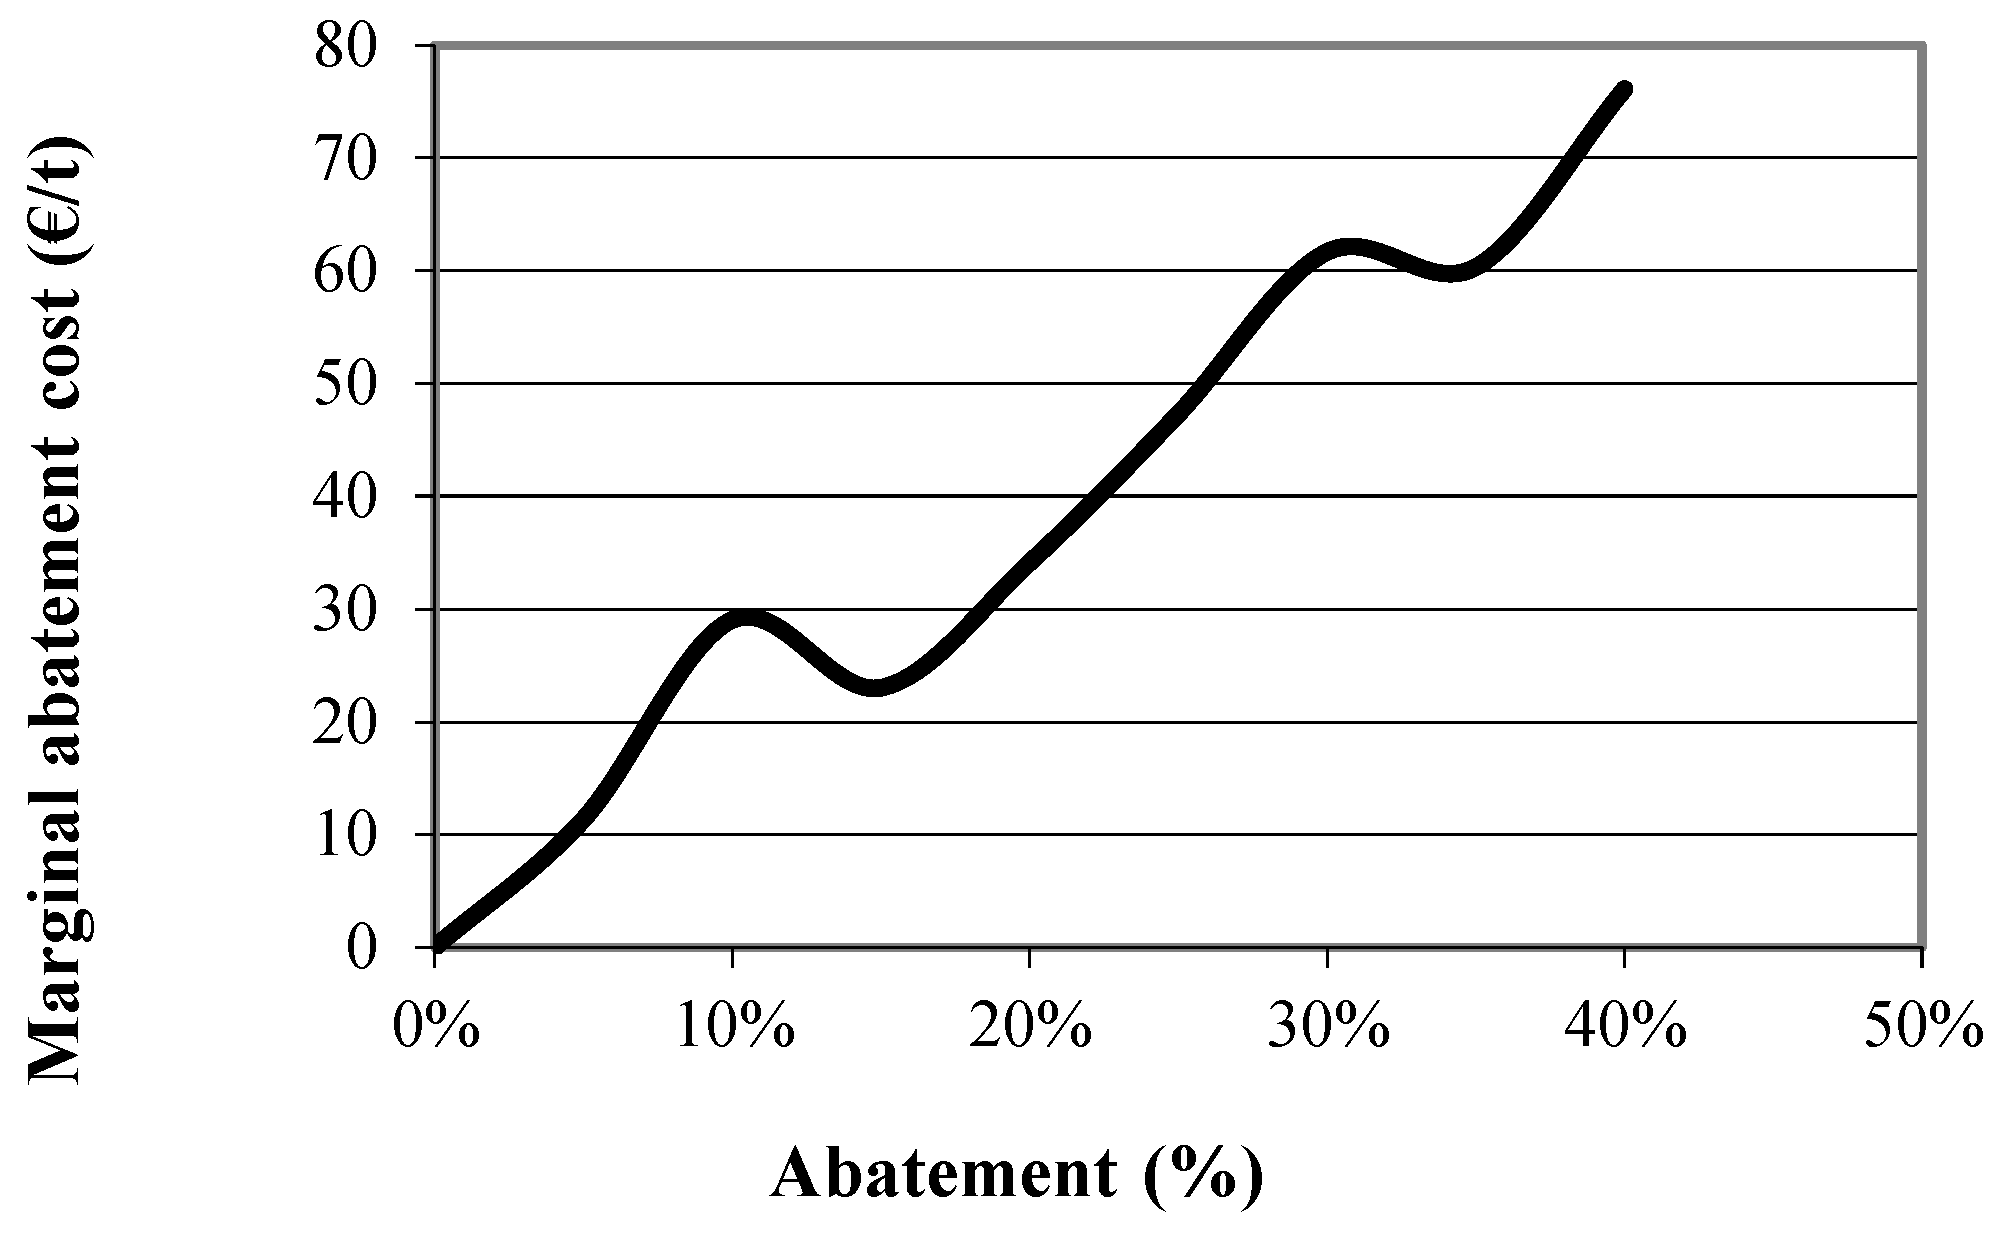
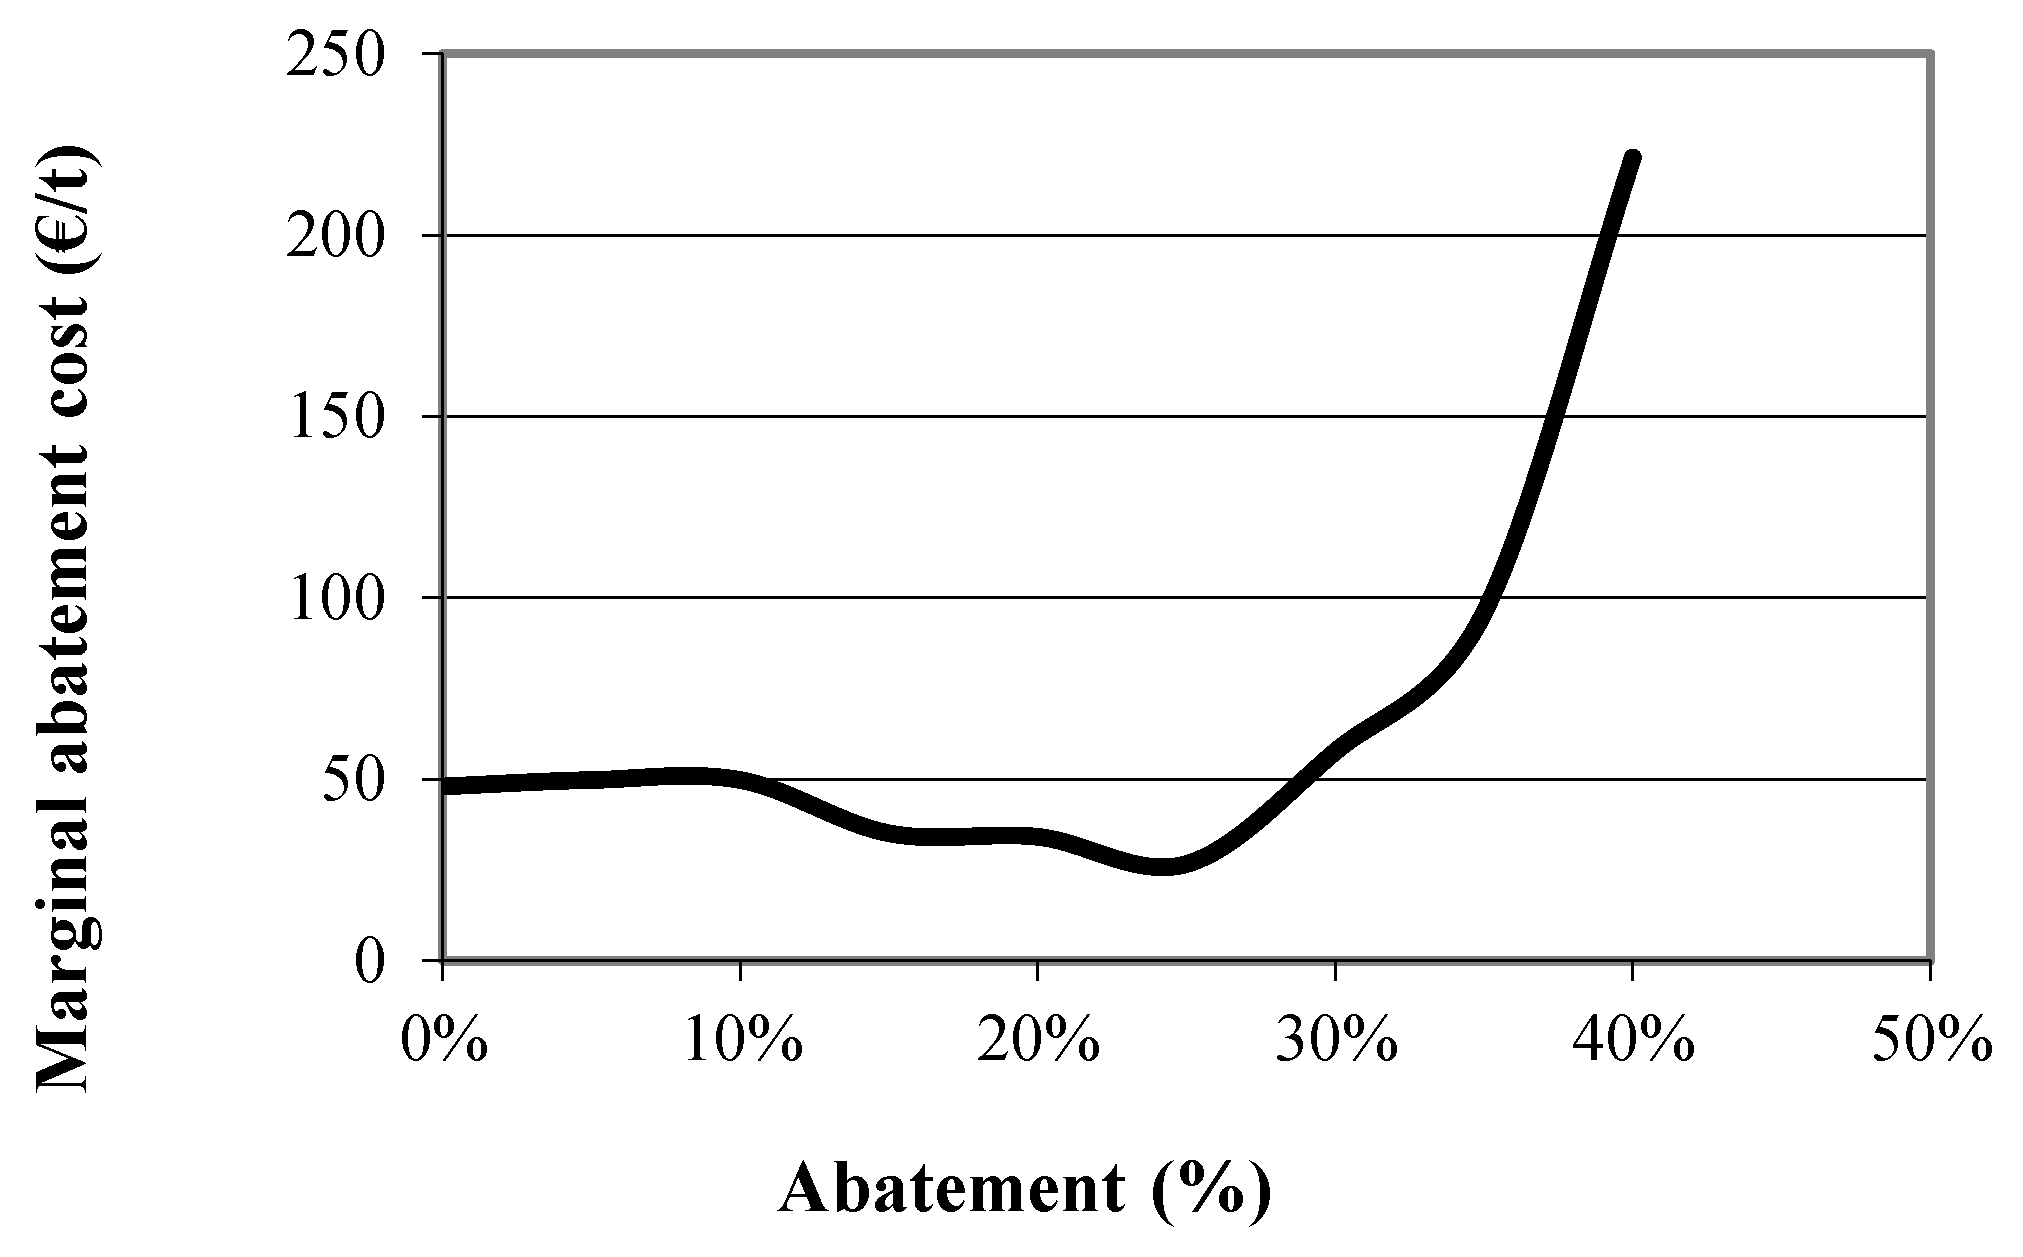
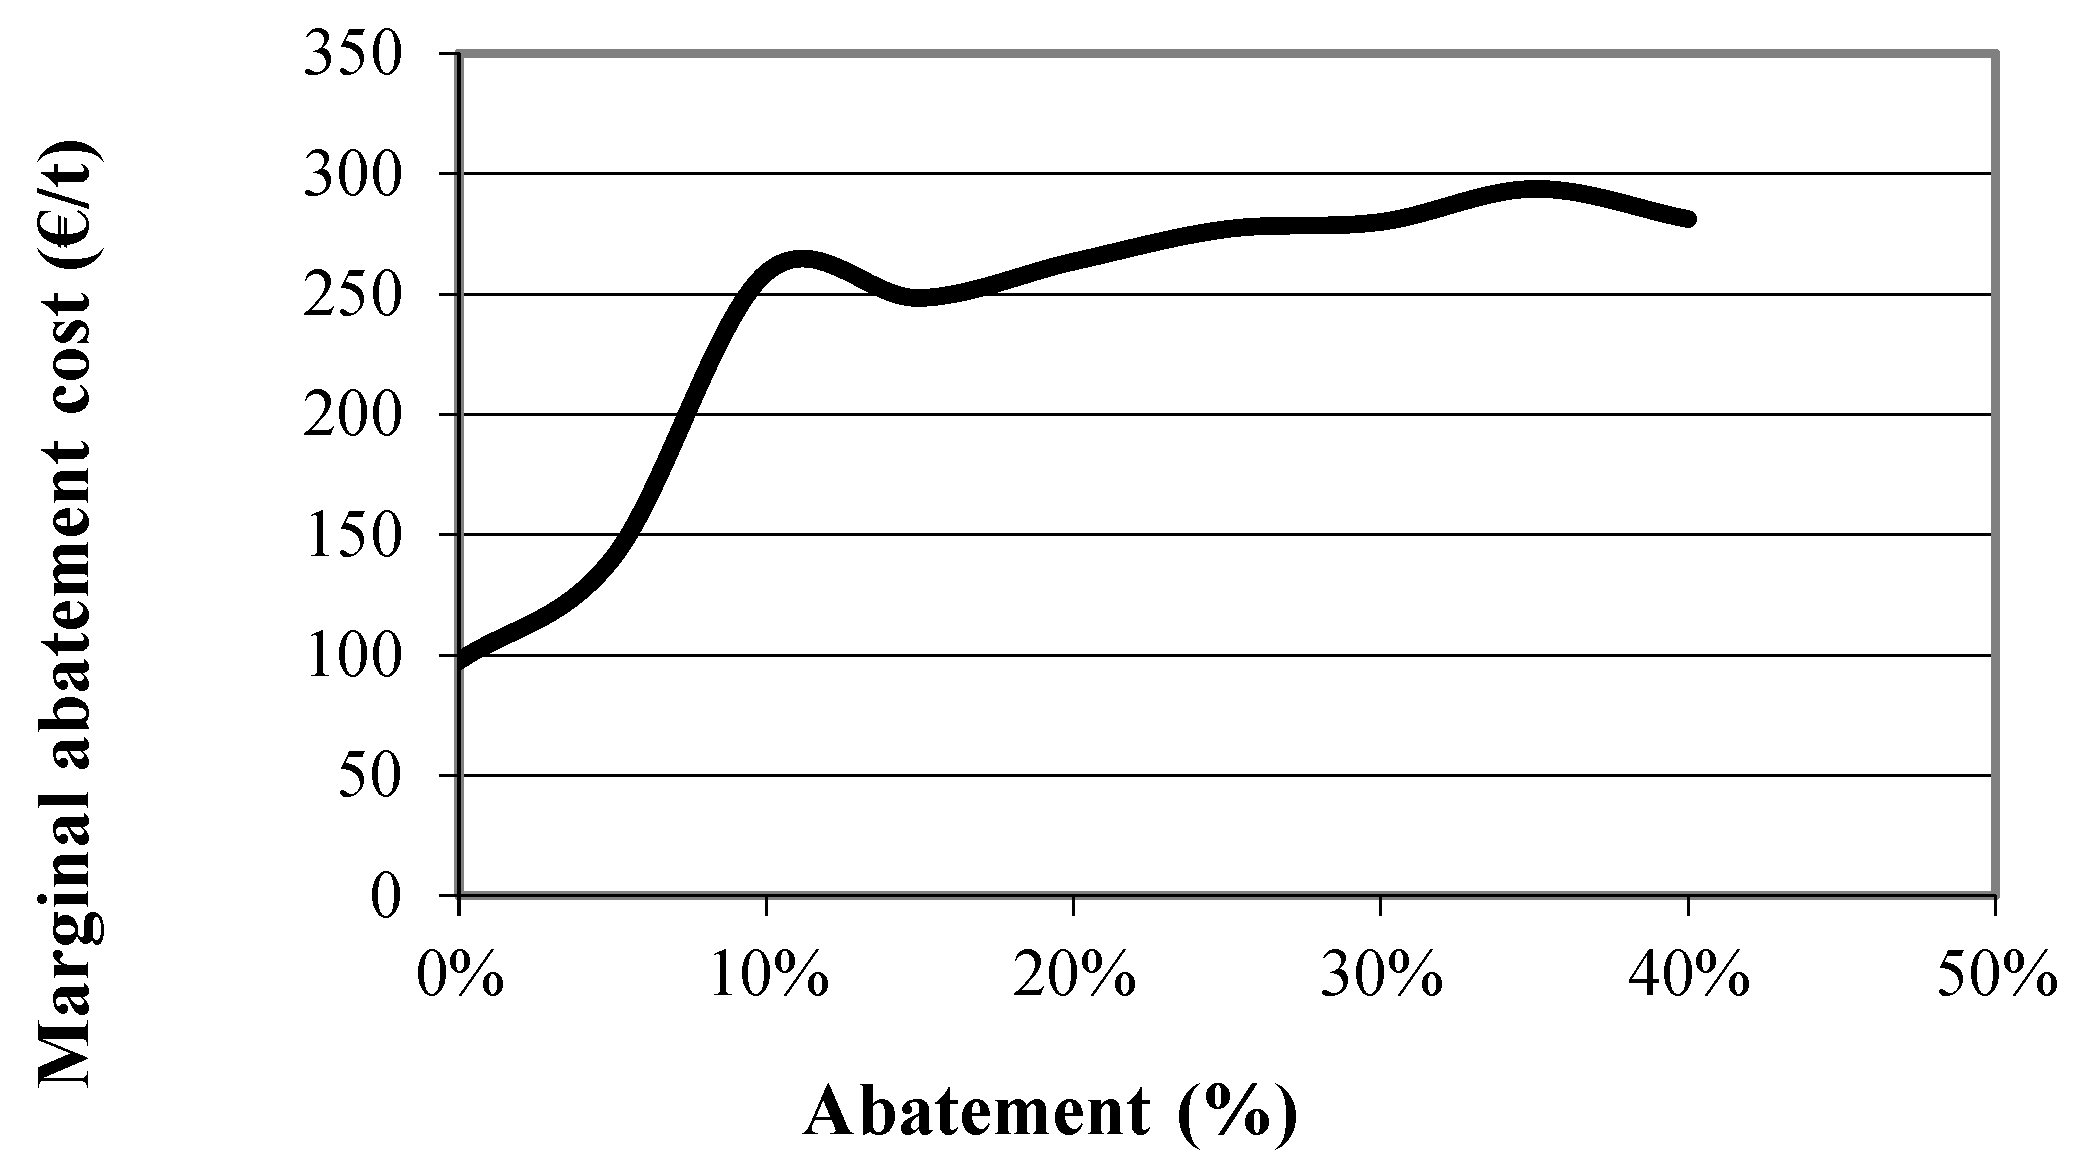
These results are also confirmed by the marginal abatement cost curve of the extensive, the semi-intensive and the intensive farm type which are presented in Figure 3, Figure 4 and Figure 5, respectively. As can be seen in the figures the marginal abatement costs of the extensive and the semi-intensive farms are very low compared to the intensive farm. Specifically, the marginal abatement cost of the extensive farm is 11 €/t at the 95% level of the original emissions, 35 €/t at 80% and 76 €/t at 60%. In the case of the semi-intensive farm the marginal abatement cost is about 50 €/t, until 30% of the original emissions are abated and reaches 220 €/t at 40% abatement level. On the other hand, in the case of the intensive farm the marginal abatement cost reaches 250 €/t at only 10% abatement, indicating that intensive farms, already achieve the production of low carbon footprint milk and further abatement comes at a higher cost.
Two scenarios are investigated in this analysis, regarding the potential to restore the gross margin of the goat farms that is reduced as the result of GHG abatement. First, the impact of milk price increase is investigated using parametric optimization. The results indicate that a small price increase of about 5%–6% allows the extensive and the semi-intensive farms to maintain their original gross margin and still abate 20% of their emissions. This price increase may for example come as the result of the labeling of milk as a low-carbon product. In the case of the intensive farm the price increase should be 14% in order for the farm to achieve its original gross margin level.
Alternatively, as far as policy measures are concerned, the loss in farm gross margin can be restored if farms are offered compensation/subsidy per productive goat. This compensation should be less than 6 €/goat in the cases of the extensive and the semi-intensive farming system but should reach 56 €/goat in the case of the intensive system, at 20% abatement level. It should be noted, however, that the majority of goat farms in Greece are extensive and semi-intensive farming systems, while only a few farms are characterized as intensive. Therefore, the cost of this policy measure may not be prohibitive, though this should be further investigated.
Finally, it should be mentioned that abatement has a significant impact on labor in all three production systems (see Table 9, Table 10 and Table 11). Specifically, 10% and 20% abatement results in 7%–9% and 16%–19% reduction in required labor inputs of the farms, respectively. This is an important finding, given the fact that the activity is mainly located in less favored areas of the country, where alternative occupations are scarce.
4. Discussion of Results and Conclusions
In this study a mixed-integer programming model was used to estimate GHG emissions in dairy goat farms in Greece and explore their abatement opportunities and cost. The analysis is undertaken in three goat farms that represent the extensive, semi-intensive and intensive production systems and takes into account all potential emission sources within the farm as well as pre-chain emissions.
The results of the analysis indicate that in all production systems, the main source of GHG emissions is enteric fermentation. Emissions per kg of milk are particularly high in the extensive farm, mainly because of its low productivity. The analysis also emphasizes that the intensive-farming system can produce milk with very low carbon footprint, while the carbon footprint of milk produced in semi-intensive farms is also relatively low.
Moreover, the analysis also suggests that imposing high levels of abatement unavoidably leads to the reduction of livestock size and, therefore, milk production. However, lower levels of abatement can be achieved by adjusting farming and especially feeding practices. These mitigation practices include the use of oil-rich feedstuffs, like cottonseed cake, in the ration of livestock and the substitution of purchased feed with on produced feed. These findings are important for farmers who are encouraged to adopt not only economically but also environmentally sound farming practices. The substitution of purchased feed with homegrown feed reduces emissions that are associated with their transportation to the farm, while at the same time reduces the feeding cost of farmers. However, such an adjustment in the feed would entail serious adjustments to the production system of farms, including new investments in land and machinery, as well as a different labor usage. Thus, further investigation is required concerning these implications.
As far as the marginal abatement cost is concerned, it is increasing across various levels of abatement and is significantly higher in the case of the intensive farm. The results reveal that the high productivity of the intensive farm causes a significant loss of gross margin when abatement is imposed. The abatement cost of the extensive farm is smaller, because of its smaller milk yield and, therefore, its smaller gross margin per goat. Abatement also results in a significant reduction of labor required in all farm types, which should also be taken into account when designing environmental policy measures.
Moreover, the results of the analysis indicate that the loss in gross margin caused by abatement may be restored by a small milk price increase in the case of extensive and semi-intensive farms. Further investigation is required to establish whether this price increase is possible from the promotion of milk labeled as a low-carbon footprint product. From the policy makers’ point of view, a small compensation offered to farmers per productive goat can also restore the original gross margin of extensive and semi-intensive farms, when abatement is imposed. Finally, it should be emphasized that even though the carbon footprint of milk is higher in extensive farms, other environmental benefits may emerge from these production systems that are beyond the scope of this study but have to be considered when estimating their overall sustainability.
Author Contributions
Conceptualization, A.S.; methodology, A.S., A.L.; software, A.S.; validation, A.S., A.L.; formal analysis, A.S., A.L., I.T.; investigation, A.S., A.L., I.T.; data curation, A.S.; writing—original draft preparation, A.S., A.L.; writing-review and editing, A.S., A.L., I.T.; visualization, A.S., A.L., I.T.; supervision, I.T.; project administration, A.S.; funding acquisition, A.S.
Funding
This study is a part of post-doctoral research, funded under the Project ‘Research & Technology Development Innovation Projects’-AgroETAK, MIS 453350, in the framework of the Operational Program ‘Human Resources Development’. This study is also co-funded by the European Social Fund through the National Strategic Reference Framework (Research Funding Program 2007–2013) coordinated by the Hellenic Agricultural Organization-DEMETER (Agricultural Economics and Policy Research Institute/Scientific supervisor: Dr Tzouramani).
Conflicts of Interest
The authors declare no conflict of interest. The funders had no role in the design of the study; in the collection, analyses, or interpretation of data; in the writing of the manuscript, or in the decision to publish the results.
References
- Hellenic Statistical Authority. Farm Structure Survey; Press Release: Athens, Greece, 2016; Available online: http://www.statistics.gr/documents/20181/76d51b89-18ed-426b-8227-01790d9c2a3d (accessed on 1 November 2019).
- Kitsopanides. Economics of Animal Production; ZITI Publishing: Thessaloniki, Greece, 2006. [Google Scholar]
- Hellenic Ministry of Rural Development and Food (HMRDF). Sheep and Goat Sector Development. Available online: http://www2.minagric.gr/images/stories/docs/ypoyrgeio/dimosieyseis-Arthra/meleti_gia_Nea_KAP/filadia_zoikis/aigoproboatotrofias.pdf (accessed on 1 November 2019).
- IPCC. Guidelines for National Greenhouse Gas Inventories; Institute for Global Environmental Strategies (IGES) for the IPCC: Kanagawa, Japan, 2006. [Google Scholar]
- Pitesky, M.E.; Stackhouse, K.R.; Mitloehner, F.M. Chapter 1—Clearing the Air: Livestock’s Contribution to Climate Change. In Advances in Agronomy; Sparks, D.L., Ed.; Academic Press: Burlington, MA, USA, 2009; Volume 103, pp. 1–40. ISBN 0065-2113. [Google Scholar]
- Weiske, A.; Vabitsch, A.; Olesen, J.E.; Schelde, K.; Michel, J.; Friedrich, R.; Kaltschmitt, M. Mitigation of greenhouse gas emissions in European conventional and organic dairy farming. Agric. Ecosyst. Environ. 2006, 112, 221–232. [Google Scholar] [CrossRef]
- Olesen, J.E.; Schelde, K.; Weiske, A.; Weisbjerg, M.R.; Asman, W.A.H.; Djurhuus, J. Modelling greenhouse gas emissions from European conventional and organic dairy farms. Agric. Ecosyst. Environ. 2006, 112, 207–220. [Google Scholar] [CrossRef]
- Veysset, P.; Lherm, M.; Bébin, D. Energy consumption, greenhouse gas emissions and economic performance assessments in French Charolais suckler cattle farms: Model-based analysis and forecasts. Agric. Syst. 2010, 103, 41–50. [Google Scholar] [CrossRef]
- de Oliveira Silva, R.; Barioni, L.G.; Hall, J.A.J.; Moretti, A.C.; Fonseca Veloso, R.; Alexander, P.; Crespolini, M.; Moran, D. Sustainable intensification of Brazilian livestock production through optimized pasture restoration. Agric. Syst. 2017, 153, 201–211. [Google Scholar] [CrossRef]
- Petersen, E.H.; Schilizzi, S.; Bennett, D. The Impacts of Greenhouse Gas Abatement Policies on the Predominantly Grazing Systems of South-Western Australia; International and Development Economics Working Paper 02-9; Asia Pacific School of Economics and Government, Australian National University: Canberra, Australia, 2002. [Google Scholar]
- Benoit, M.; Laignel, G. Sheep-for-meat farming systems in French semi-upland area. Adapting to new context: Increased concentrates and energy prices, and new agricultural policy. In Proceedings of the 8th European IFSA Symposium: Empowerment of the Rural Actors: A Renewal of Farming Systems Perspectives, Paris, France, 6–10 July 2008; pp. 6–10. [Google Scholar]
- Sintori, A.; Tsiboukas, K.; Zervas, G. Evaluating Socio-economic and Environmental Sustainability of the Sheep Farming Activity in Greece: A Whole-Farm Mathematical Programming Approach. In Methods and Procedures for Building Sustainable Farming Systems; Costa, M., Alexandra, A., da Silva, E.L.S., Eds.; Springer: Dordrecht, The Netherlands, 2013; pp. 219–235. [Google Scholar]
- Alford, A.; Griffith, G.; Cacho, O. A Northern Tablelands Whole-Farm Linear Program for Economic Evaluation of New Technologies at the Farm-Level; No. 1160-2016-93030; Economic Research Report No. 13; NSW Agriculture: Armidale, Australia, 2004.
- Veysset, P.; Bebin, D.; Lherm, M. Adaptation to Agenda 2000 (CAP reform) and optimisation of the farming system of French suckler cattle farms in the Charolais area: A model-based study. Agric. Syst. 2005, 83, 179–202. [Google Scholar] [CrossRef]
- Sofi, N.A.; Ahmed, A.; Ahmad, M.; Bhat, B.A. Decision making in agriculture: A linear programming approach. Int. J. Mod. Math. Sci. 2015, 13, 160–169. [Google Scholar]
- Crosson, P.; O’Kiely, P.; O’Mara, F.P.; Wallace, M. The development of a mathematical model to investigate Irish beef production systems. Agric. Syst. 2006, 89, 349–370. [Google Scholar] [CrossRef]
- De Cara, S.; Jayet, P.A. Emissions of greenhouse gases from agriculture: The heterogeneity of abatement costs in France. Eur. Rev. Agric. Econ. 2000, 27, 281–303. [Google Scholar] [CrossRef]
- Breen, J.P.; Donellan, T. Estimating the Marginal Costs of Greenhouse Gas Emissions Abatement using Irish Farm-Level Data. In Proceedings of the 83rd Annual Conference of Agricultural Economics Society, Dublin, Ireland, 30 March–1 April 2009; Agricultural Economics Society: Dublin, Ireland, 2009. [Google Scholar]
- Moraes, L.E.; Wilen, J.E.; Robinson, P.H.; Fadel, J.G. A linear programming model to optimize diets in environmental policy scenarios. J. Dairy Sci. 2012, 95, 1267–1282. [Google Scholar] [CrossRef] [PubMed]
- de Oliveira Silva, R.; Barioni, L.G.; Hall, J.A.J.; Folegatti Matsuura, M.; Zanett Albertini, T.; Fernandes, F.A.; Moran, D. Increasing beef production could lower greenhouse gas emissions in Brazil if decoupled from deforestation. Nat. Clim. Chang. 2016, 6, 493–497. [Google Scholar] [CrossRef]
- Smith, E.G.; Upadhyay, M. Others Greenhouse gas mitigation on diversified farms. In Proceedings of the Western Agricultural Economics Association-Western Economics Association International Joint Annual Meeting, San Francisco, CA, USA, 6–8 July 2005. [Google Scholar]
- Kaiser, H.M.; Messer, K.D. Mathematical Programming for Agricultural, Environmental and Resource Economics; John Wiley and Sons: New York, NY, USA, 2014; ISBN 9780874216561. [Google Scholar]
- Sintori, A. Analysis of the Decision Making Process with Multiple Goals: The Case of Dairy Sheep Farming in Continental Greece. Ph.D. Thesis, Agricutlural University of Athens, Athens, Greece, 2012; p. 365. [Google Scholar]
- Zervas, G.; Kalaisaikis, P.; Feggeros, K. Farm Animal Nutrition; Stamoulis Publishing: Athens, Greece, 2000. [Google Scholar]
- Kalaisakis, P.; Giourdas, M. Applied Animal Nutrition; Giourdas M. Publishing: Athens, Greece, 1965. [Google Scholar]
- Jarrige, R. [Alimentation des Ruminants]: Principes de la Nutrition et de L’alimentation des Ruminants: Besoins Alimentaires des Animaux: Valeur Nutritive des Aliments; INRA Pub.: Versailles, France, 1980; ISBN 2853402886. [Google Scholar]
- Feedipedia. An Online Encyclopedia of Animal Feeds. Available online: https://www.feedipedia.org/ (accessed on 1 February 2019).
- Papachristou, T.G. Utilization of available forage in shrublands from goats: Selection and nutritional value of forage. In Proceedings of the 1st Greek National Conference of the Hellenic Range and Pasture Society, Athens, Greece, 16 June 1996; The Hellenic Range and Pasture Society: Drama, Greece, 1997. [Google Scholar]
- FRI (Forest Reearch Institute). Final Report of the Program “Agrometeorological Models for the Prediction of the Production and Quality of Pastures”; NAGREF: Thessaloniki, Greece, 2000. [Google Scholar]
- Platis, P.D.; Papanastasis, V. Relationship between Shrub Cover and Available Forage in Mediterranean Shrublands. Agrofor. Syst. 2003, 57, 59–67. [Google Scholar] [CrossRef]
- Platis, P.D.; Papanastasis, V.P.; Papachristou, T.G.; Tsiontsis, A.G. Varation of quantity and quality of forage in grasslands of the lowland ecological zone in the Prefecture of Thessaly. In Proceedings of the 4th Greek National Conference of the Hellenic Range and Pasture Society, Volos, Greece, 10–12 November 2004; The Hellenic Range and Pasture Society: Athens, Greece, 2006. [Google Scholar]
- Schils, R.L.M.; de Haan, M.H.A.; Hemmer, J.G.A.; van den Pol-van Dasselaar, A.; de Boer, J.A.; Evers, A.G.; Holshof, G.; van Middelkoop, J.C.; Zom, R.L.G. DairyWise, A Whole-Farm Dairy Model. J. Dairy Sci. 2007, 90, 5334–5346. [Google Scholar] [CrossRef] [PubMed]
- Giger-Reverdin, S.; Sauvant, D. Methane Production in Sheep in Relation to Concentrate Feed Composition from Bibliographic Data. In Sheep and Goat Nutrition: Intake, Digestion, Quality of Products and Rangelands; Ledin, I., Morand-Fehr, P., Eds.; CIHEAM-IAMZ: Zaragoza, Spain, 2000; pp. 43–46. [Google Scholar]
- Petersen, E.; Schilizzi, S.; Bennett, D. The impacts of greenhouse gas abatement policies on the predominantly grazing systems of south-western Australia. Agric. Syst. 2003, 78, 369–386. [Google Scholar] [CrossRef] [Green Version]
- Wells, D. Total Energy Indicators of Agricultural Sustainability: Dairy Farming Case Study; Technical Paper; Ministry of Agriculture and Forestry: Wellington, New Zealand, 2001; ISBN 0-478-07968-0.
- Wood, S.; Cowie, A. A Review of Greenhouse Gas Emission Factors for Fertiliser Production. IEA bioenergy task 38. Available online: www.sciencetheearth.com/uploads/2/4/6/5/24658156/2004_wood_a_review_of_greenhouse_gas_emission_factors.pdf (accessed on 1 February 2019).
- Defra. Guidelines for Company Reporting on Greenhouse Gas Emissions Annexes Updated July 2005; Defra: London, UK, 2005. [Google Scholar]
- Helsel, Z.R. Energy in pesticide production and use. Encycl. Pest Manag. 2006, 1, 1–4. [Google Scholar]
- Kaltsas, A.M.; Mamolos, A.P.; Tsatsarelis, C.A.; Nanos, G.D.; Kalburtji, K.L. Energy budget in organic and conventional olive groves. Agric. Ecosyst. Environ. 2007, 122, 243–251. [Google Scholar] [CrossRef]
- Smith, E.G.; Upadhyay, B.M. Greenhouse Gas. Mitigation on Diversified Farms. In Proceedings of the Annual Meeting of the Canadian Agricultural Economics Society, San Francisco, CA, USA, July 2005. [Google Scholar]
- Lesschen, J.P.; van den Berg, M.; Westhoek, H.J.; Witzke, H.P.; Oenema, O. Greenhouse gas emission profiles of European livestock sectors. Anim. Feed Sci. Technol. 2011, 166–167, 16–28. [Google Scholar] [CrossRef]
- FAO. Livestock’s Long Shadow: Environmental Issues and Options; FAO: Rome, Italy, 2006. [Google Scholar]
- Ludemann, C.; Howden, S.; Eckard, R. What is the best use of oil from cotton (Gossypium spp.) and canola (Brassica spp.) for reducing net greenhouse gas emissions-biodiesel, or as a feed for cattle? Anim. Prod. Sci. 2016, 56, 3442–3450. [Google Scholar] [CrossRef]
Figure 1.
Representation of the original linear programming model.

Figure 2.
Graphical representation of the mathematical programming model and the emission sources considered in the analysis.
Figure 2.
Graphical representation of the mathematical programming model and the emission sources considered in the analysis.

Figure 3.
Marginal abatement cost curve of the extensive farm.

Figure 4.
Marginal abatement cost curve of the semi-intensive farm.

Figure 5.
Marginal abatement cost curve of the intensive farm.


Table 1.
Livestock feed requirements.
| Animal Characteristics | Dry Matter (kg/day) | Digestible Nitrogen (g/day) | Net Energy for Lactation (MJ/day) |
|---|---|---|---|
| Productive goats | |||
| Preservation | |||
| Live weight (kilos) | |||
| 50 | 1.6 | 40 | 5.2 |
| 60 | 1.8 | 46 | 5.8 |
| 70 | 2.0 | 52 | 6.6 |
| Pregnancy | |||
| Live weight (kilos) | |||
| 50 | 1.4 | 105 | 8.4 |
| 60 | 1.5 | 120 | 9.0 |
| 70 | 1.6 | 140 | 9.8 |
| Lactation (per kilo of milk) | |||
| Fat content | |||
| 3.0% | - | 50 | 2.8 |
| 3.5% | - | 55 | 3.0 |
| 4.0% | - | 60 | 3.2 |
| 4.5% | - | 65 | 3.4 |
| Male goats | |||
| Live weight (kilos) | |||
| 80 | 2.1 | 63 | 8.1 |
| 100 | 2.2 | 75 | 9.6 |
| Growing animals | |||
| Age (in months) | |||
| 0–1 | 80 | 3.2 | |
| 1–2 | 0.3–0.6 | 80 | 3.6 |
| 2–3 | 0.6–0.8 | 77 | 4.2 |
| 3–4 | 0.8–1.0 | 74 | 4.6 |
| 4–5 | 1.0–1.1 | 68 | 4.9 |
| 5–6 | 1.1–1.2 | 62 | 5.1 |
| 6–7 | 1.2–1.3 | 60 | 5.2 |
Source: Zervas et al., 2000 [24].
Table 2.
Nutritional value of feed.
| Type of Feed | Dry Matter (g/kg) | Digestible Nitrogen (g/kg) | Net energy for Lactation (Mj/kg) | Fiber Matter (g/kg) |
|---|---|---|---|---|
| Maize for grain | 0.880 | 0.073 | 8.40 | 0.022 |
| Barley for grain | 0.860 | 0.077 | 7.60 | 0.044 |
| Cotton seed | 0.922 | 0.195 | 7.99 | 0.211 |
| Alfalfa hay | 0.850 | 0.105 | 4.10 | 0.280 |
| Maize silage | 0.300 | 0.018 | 2.15 | 0.053 |
| Herbaceous material (pastures) | 0.202 | 0.019 | 1.13 | 0.038 |
| Shrubs | 0.472 | 0.021 | 1.64 | 0.280 |
| Oat for grazing (grassland) | 0.275 | 0.015 | 1.45 | 0.090 |
Table 3.
Emission sources considered in the analysis.
| Emission Sources | Included in the Analysis | Not Included in the Analysis |
|---|---|---|
| Livestock emissions | ||
| Enteric CH4 | X | |
| CH4 from manure deposited onto pasture | Χ | |
| CH4 from manure management | Χ | |
| Direct Ν2Ο emissions from manure deposited onto pasture | Χ | |
| Indirect Ν2Ο emissions from manure deposited onto pasture | Χ | |
| Ν2Ο emissions from leaching and run-off from manure deposited onto pasture | Χ | |
| Direct Ν2Ο emissions from manure management | Χ | |
| Indirect Ν2Ο emissions from manure management | Χ | |
| Ν2Ο emissions from leaching and run-off from manure management | Χ | |
| Crops | ||
| Direct Ν2Ο emissions from use of fertilizers | Χ | |
| Indirect Ν2Ο emissions from use of fertilizers | Χ | |
| Ν2Ο emissions from leaching and run-off | Χ | |
| CO2 pre-chain emissions associated with the use manufacture and transport of inputs (fertilizers and pesticides) | Χ | |
| CO2 from energy use within the farm | Χ | |
| Purchased feed | ||
| Direct Ν2Ο emissions from use of fertilizers | Χ | |
| Indirect Ν2Ο emissions from use of fertilizers | Χ | |
| Ν2Ο emissions from leaching and run-off | Χ | |
| CO2 pre-chain emissions associated with the use manufacture and transport of inputs (fertilizers and pesticides) | Χ | |
| CO2 from energy use required for the cultivation and transport of purchased feed | Χ | |
Table 4.
Main Characteristics of the production systems identified in Greece and of the representative farms used in the analysis.
Table 4.
Main Characteristics of the production systems identified in Greece and of the representative farms used in the analysis.
| Characteristics | Farming Systems [2] | Representative Farms | ||||
|---|---|---|---|---|---|---|
| Extensive | Semi-Intensive | Intensive | Extensive | Semi-Intensive | Intensive | |
| Farm size | No significant diversification (extensive usually larger) | 350 productive goats | 300 | 300 | ||
| Breeds | Hardy local breeds, | Improved local breeds | Highly productive breeds foreign breeds or local improved breeds | Local breeds | Improved local breeds | Highly productive local improved breeds |
| Use of pastures-shrublands | About 80% of feeding requirements, supplementary feeding during winter | 50% of the feeding requirements | 0% of the feeding requirements | 75% of the feeding requirements | 30% of the feeding requirements | 0% of the feeding requirements |
| Use of concentrates | About 15% of nutritional requirements | Higher than extensive, lower than intensive | Mainly used to satisfy livestock feeding requirements | 20% of the feeding requirements | 60% of the feeding requirements | 62% of the feeding requirements |
| Annual milk yield (kg/goat) | Estimated for Makedonitiki breed by Kitsopanides [2] at 134 | Estimated for Skopelou breed by Kitsopanides [2] at 292 | Estimated for Saanen and Alpine breeds by Kitsopanides [2] at 580–625 | 115 | 300 | 520 |
| Level of mechanization (level of usage of equipments (e.g., for preparation of feed, milking machines etc.) | Low | Moderate (usually no milking machine) | Very high | Low (no milking machine) | Moderate (no milking machine) | Very high |
| Invested capital/goat | Low-low productivity livestock | Moderate | Very high | Low | Moderate | Very high |
| Prolificacy index (number of kids per goat per birth) | Estimated for Makedonitiki breed by Kitsopanides [2] at 1.14 | Estimated for Skopelou breed by Kitsopanides [2] at 1.37 | Estimated for Saanen and Alpine breeds by Kitsopanides [2] at 1.72–1.74 | 1.2 | 1.5 | 1.80 |
| Percent of milk income to total farm income | Estimated for Makedonitiki breed by Kitsopanides [2] at 57% | Estimated for Skopelou breed by Kitsopanides [2] at 74% | Estimated for Saanen and Alpine breeds by Kitsopanides [2] at 80% | 60% | 75% | 86% |
Table 5.
Main parameters used in the linear programming (LP) model.
| Model Parameter | Extensive Farm | Semi-Intensive Farm | Intensive Farm |
|---|---|---|---|
| Variable costs of cultivated crops (€/hectare) | |||
| Maize for grain | - | 2142 | 1651 |
| Maize for forage | - | - | 734 |
| Alfalfa for hay | - | - | 1148 |
| Barley for grain | 591 | - | 1071 |
| Crop yield (tones/hectare) | |||
| Maize for grain | - | 15 | 11 |
| Maize for forage | - | - | 54 |
| Alfalfa for hay | - | - | 15 |
| Barley for grain | 3 | - | 3 |
| Price of purchased feedstuff (€/kg) | |||
| Maize for grain | 0.20 | 0.20 | - |
| Barley for grain | - | 0.30 | - |
| Alfalfa hay | 0.22 | 0.22 | 0.16 |
| Mixture | - | 0.40 | 0.40 |
| Cotton seed | 0.25 | - | - |
| Variable cost for livestock (except for feeding and labor) (€/adult goat) | 18.96 | 26,49 | 39.2 |
| Replacement rate | 22% | 7% | 16% |
| Average price of meat sold (€/kg) | 4.25 | 2.9 | 3.43 |
| Average price of milk sold (€/kilo) | 0.63 | 0.60 | 0.73 |
Table 6.
Annual greenhouse gas (GHG) emissions of the extensive farm (in kg of CO2-eq).
| Abatement (α) | 0% | 10% | 15% | 20% | ||||
|---|---|---|---|---|---|---|---|---|
| Total | Per kg of Milk * | Total | Per kg of Milk | Total | Per kg of Milk | Total | Per kg of Milk | |
| Total GHGs | 305,576 | 4.08 | 275,025 | 3.95 | 259,740 | 3.92 | 244,461 | 3.91 |
| CH4 enteric fermentation | 226,471 | 3.03 | 203,644 | 2.92 | 192,858 | 2.91 | 181,971 | 2.91 |
| CH4 manure | 3207 | 0.04 | 2997 | 0.04 | 2848 | 0.04 | 2690 | 0.04 |
| N2O manure | 59,771 | 0.80 | 55,901 | 0.80 | 53,103 | 0.80 | 50,158 | 0.80 |
| N2O fertilizer | 899 | 0.01 | 450 | 0.01 | 450 | 0.01 | 450 | 0.01 |
| N2O fertilizer-purchased feed | 3250 | 0.04 | 2914 | 0.04 | 2452 | 0.04 | 2050 | 0.03 |
| CO2 energy-purchased feed | 8435 | 0.11 | 7187 | 0.11 | 6371 | 0.10 | 5420 | 0.09 |
| CO2 energy-farm | 3543 | 0.04 | 1536 | 0.02 | 1536 | 0.02 | 1536 | 0.02 |
* These GHGs refer only to milk production. Meat production related GHGs are not presented separately since milk is the main product of the farms. For the allocation of the GHGs between milk and meat the share in the production value is used.
Table 7.
Annual GHG emissions of the semi-intensive farm (in kg of CO2-eq).
| Abatement (α) | 0% | 10% | 15% | 20% | ||||
|---|---|---|---|---|---|---|---|---|
| Total | Per kg of Milk | Total | Per kg of Milk | Total | Per kg of Milk | Total | Per kg of Milk | |
| Total GHGs | 284,120 | 2.04 | 255,708 | 2.00 | 238,268 | 1.98 | 227,296 | 1.96 |
| CH4 enteric fermentation | 182,281 | 1.31 | 163,790 | 1.28 | 154,348 | 1.27 | 146,580 | 1.27 |
| CH4 manure | 2767 | 0.02 | 2547 | 0.02 | 2379 | 0.02 | 2302 | 0.02 |
| N2O manure | 71,219 | 0.51 | 65,691 | 0.51 | 61,153 | 0.51 | 59,284 | 0.51 |
| N2O fertilizer | 1349 | 0.01 | 1349 | 0.01 | 1349 | 0.01 | 1349 | 0.01 |
| N2O fertilizer-purchased feed | 6178 | 0.04 | 4700 | 0.04 | 3961 | 0.03 | 3400 | 0.03 |
| CO2 energy-purchased feed | 14,662 | 0.11 | 11,967 | 0.09 | 9413 | 0.08 | 8716 | 0.08 |
| CO2 energy-farm | 5665 | 0.04 | 5665 | 0.04 | 5665 | 0.05 | 5665 | 0.05 |
Table 8.
Annual GHG emissions of the intensive farm (in kg of CO2-eq).
| Abatement (α) | 0% | 10% | 15% | 20% | ||||
|---|---|---|---|---|---|---|---|---|
| Total | Per kg of Milk | Total | Per kg of Milk | Total | Per kg of Milk | Total | Per kg of Milk | |
| Total GHGs | 332,797 | 1.82 | 299,518 | 1.81 | 282,878 | 1.80 | 266,238 | 1.79 |
| CH4 enteric fermentation | 169,926 | 0.93 | 152,886 | 0.92 | 144,684 | 0.92 | 136,352 | 0.92 |
| CH4 manure | 3151 | 0.02 | 2846 | 0.02 | 2700 | 0.02 | 2,549 | 0.02 |
| N2O manure | 111,501 | 0.61 | 100,615 | 0.61 | 95,638 | 0.61 | 90,150 | 0.61 |
| N2O fertilizer | 3609 | 0.02 | 3100 | 0.02 | 2637 | 0.02 | 2372 | 0.02 |
| N2O fertilizer-purchased feed | 7183 | 0.04 | 6206 | 0.04 | 5587 | 0.04 | 5075 | 0.03 |
| CO2 energy-purchased feed | 23,363 | 0.13 | 20,036 | 0.12 | 17,882 | 0.11 | 16,124 | 0.11 |
| CO2 energy-farm | 14,065 | 0.08 | 13,829 | 0.08 | 13,750 | 0.09 | 13,616 | 0.09 |
Table 9.
Optimal farm plan of the extensive farm.
| Abatement (α) | 0% | 10% | 15% | 20% | ||||
|---|---|---|---|---|---|---|---|---|
| Total | Per Female Goat | Total | Per Female Goat | Total | Per Female Goat | Total | Per Female Goat | |
| Gross margin (€) | 27,271 | 70 | 26,738 | 73 | 26,389 | 76 | 25,957 | 79 |
| Total labour (hours) | 5018 | 13 | 4672 | 13 | 4441 | 13 | 4197 | 13 |
| Female productive goats | 390 | 1 | 364 | 1 | 346 | 1 | 327 | 1 |
| Purchased cottonseed cake (kg) | 4312 | 11 | 4265 | 12 | 3746 | 11 | 4530 | 14 |
| Barley for consumption (hectares) | 1.5 | 0.00 | 0 | 0.00 | 0 | 0.00 | 0 | 0.00 |
| Purchased barley (kg) | 0 | 0.00 | 0 | 0.00 | 0 | 0.00 | 0 | 0.00 |
| Grassland (hectares) | 2 | 0.01 | 2 | 0.01 | 2 | 0.01 | 2 | 0.06 |
| Purchased alfalfa (kg) | 9748 | 25 | 7477 | 21 | 7586 | 22 | 5225 | 16 |
| Purchased maize (kg) | 45,849 | 118 | 41,271 | 113 | 34,082 | 99 | 27,740 | 85 |
| Fresh grass/shrub (kg) | 994,584 | 2550 | 902,372 | 2479 | 871,492 | 2519 | 838,790 | 2565 |
| Winter pasture (hectares) | 50 | 0.13 | 50 | 0.14 | 50 | 0.15 | 50 | 0.15 |
| Summer pasture (hectares) | 100 | 0.26 | 100 | 0.28 | 100 | 0.29 | 100 | 0.31 |
| Crop cultivation for sale (hectares) | 0.5 | 0 | 0 | 0 | ||||
Table 10.
Optimal farm plan of the semi-intensive farm.
| Abatement (α) | 0% | 10% | 15% | 20% | ||||
|---|---|---|---|---|---|---|---|---|
| Total | Per Female Goat | Total | Per Female Goat | Total | Per Female Goat | Total | Per female Goat | |
| Gross margin (€) | 47,275 | 136 | 46,440 | 146 | 46,000 | 151 | 45,296 | 157 |
| Total labour (hours) | 7140 | 21 | 6559 | 21 | 6270 | 21 | 5,946 | 21 |
| Female productive goats | 348 | 1 | 319 | 1 | 305 | 1 | 289 | 1 |
| Maize for consumption (hectares) | 2 | 0.006 | 2 | 0.006 | 2 | 0.007 | 2 | 0.007 |
| Pasture (hectares) | 50 | 0.144 | 50 | 0.157 | 50 | 0.164 | 50 | 0.173 |
| Purchased alfalfa (kg) | 17,781 | 51 | 12,930 | 41 | 10,935 | 36 | 8,699 | 30 |
| Purchased maize (kg) | 59,692 | 172 | 32,812 | 103 | 26,419 | 87 | 20,570 | 71 |
| Purchased barley (kg) | 0 | 0 | 11,334 | 36 | 10,010 | 33 | 8779 | 30 |
| Purchased mixture (kg) | 33,764 | 97 | 27,404 | 86 | 24,693 | 81 | 22,606 | 78 |
| Fresh grass/shrub (kg) | 294,134 | 845 | 293,482 | 920 | 294,134 | 964 | 291,166 | 1007 |
| Crop cultivation for sale (hectares) | 0 | 0 | 0 | 0 | ||||
Table 11.
Optimal farm plan of the intensive farm.
| Abatement (α) | 0% | 10% | 15% | 20% | ||||
|---|---|---|---|---|---|---|---|---|
| Total | Per Female Goat | Total | Per Female Goat | Total | Per Female Goat | Total | Per Female Goat | |
| Gross margin (€) | 78.870 | 259 | 72,169 | 261 | 68,194 | 261 | 64,929 | 263 |
| Total labour (hours) | 4071 | 13 | 3702 | 13 | 3524 | 14 | 3345 | 14 |
| Female productive goats | 305 | 1 | 276 | 1 | 261 | 1 | 247 | 1 |
| Maize for consumption (hectares) | 5.5 | 0.02 | 4.8 | 0.02 | 4.1 | 0.02 | 3.7 | 0.02 |
| Alfalfa for consumption (hectares) | 0.8 | 0.00 | 1.7 | 0.01 | 2.4 | 0.01 | 2.8 | 0.01 |
| Maize silage for consumption (hectares) | 0.1 | 0.00 | 0 | 0.00 | 0.0 | 0.00 | 0.0 | 0.00 |
| Purchased alfalfa (kg) | 183,609 | 602 | 154,085 | 558 | 133,911 | 513 | 118,012 | 478 |
| Purchased mixture (kg) | 44,546 | 146 | 40,215 | 146 | 38,040 | 146 | 35,929 | 145 |
| Barley for consumption (hectares) | 0 | 0.00 | 0.4 | 0.00 | 2.1 | 0.01 | 2.6 | 0.01 |
| Crop cultivation for sale (hectares) | 0 | 0 | 0 | 0 | ||||
© 2019 by the authors. Licensee MDPI, Basel, Switzerland. This article is an open access article distributed under the terms and conditions of the Creative Commons Attribution (CC BY) license (http://creativecommons.org/licenses/by/4.0/).
Share and Cite
MDPI and ACS Style
Sintori, A.; Tzouramani, I.; Liontakis, A. Greenhouse Gas Emissions in Dairy Goat Farming Systems: Abatement Potential and Cost. Animals 2019, 9, 945. https://doi.org/10.3390/ani9110945
AMA Style
Sintori A, Tzouramani I, Liontakis A. Greenhouse Gas Emissions in Dairy Goat Farming Systems: Abatement Potential and Cost. Animals. 2019; 9(11):945. https://doi.org/10.3390/ani9110945
Chicago/Turabian StyleSintori, Alexandra, Irene Tzouramani, and Angelos Liontakis. 2019. "Greenhouse Gas Emissions in Dairy Goat Farming Systems: Abatement Potential and Cost" Animals 9, no. 11: 945. https://doi.org/10.3390/ani9110945
Note that from the first issue of 2016, this journal uses article numbers instead of page numbers. See further details here.