1. Introduction
A small portion of the particulate matter (PM) released under commercial feedlot conditions is considered fine. However, particulate matter smaller than 2.5 μm in diameter (PM
2.5) is considered a health hazard to humans and animals because it can pass through the respiratory tract to the lung alveoli [
1,
2,
3] and therefore of major interest. These fine particles can carry gases and microbes into the lung [
4].
Exposure to fine PM causes increased respiratory and cardiovascular health issues [
5,
6,
7] and the biological response of the respiratory system varies based on particle size [
8]. Fine particulate matter such as PM
2.5, more likely enters the lungs and studies have shown that components of PM, such as endotoxin or pathogens, can lead to cellular inflammation [
9].
Particulate matter generation around cattle feedlots is greater in the evening compared with the morning because of increased cattle activity and is usually correlated with dry weather events [
10]. Behavioral patterns of feedlot cattle differ from those displayed on pastures. Cattle kept in a pasture setting show a crepuscular pattern of activity [
11,
12], expressing feeding behaviors that peak (i.e., show increase in feeding behavior) at dusk and dawn. They also express less feeding behavior mid-day. In commercial feedlots, cattle are often fed during the first half of the daylight hours to maximize labor utilization and lower production costs. However, this method of feeding does not follow the natural behavior that cattle show in the pasture setting. Feed may not be available at dusk when pastured cattle naturally graze [
12].
We hypothesized that by changing the feeding times of feedlot cattle from morning feeding to a more crepuscular feeding rhythm (i.e., feeding at dusk and dawn), PM2.5-generating behaviors could be redirected into feeding and thereby decrease aerial particulate matter concentrations. The objectives of this study were to (1) determine cattle behaviors associated with PM2.5 generation; and (2) determine if feeding in the evening can alter cattle behaviors during periods of PM2.5 generation and lower generated particulate matter.
2. Materials and Methods
2.1. General
An experiment was conducted in a large-scale (>60,000 cattle) commercial feedlot in west Texas in order to examine the effect of altering feeding patterns on cattle behavior and resulting particulate matter generation. The experiment was conducted from April through May 2000, and was approved by the Texas Tech University Animal Care and Use Committee (IACUC#2000-02).
This experiment compared 2 feeding regimens: normal-scheduled feeding (CON) at 0700, 1000, and 1200 and alternative-scheduled feeding (ALT) at 0700, 1000 and 1830. Alternative-scheduled feeding was developed to mimic crepuscular feeding times that are normally found in grazing cattle. For CON, daily ration was fed in 3 equal portions at each scheduled time. For ALT, 30%, 20%, and 50% of the daily ration was fed at 0700, 1000, and 1830, respectively. Drinking water was provided for ad libitum intake.
The cattle in both treatments were fed using a clean bunk management system. In this system, the goal was to have no feed remaining in the feed bunk for a few hours before the first feeding in the morning. To ensure that cattle are eating at approximately ad libitum rates, feed deliveries were typically held constant for a 3-day period, after which the cattle were “challenged” to consume more feed by increasing the feed delivery by approximately 0.1 kg/animal daily (as-fed basis). If the feed bunk was empty at the desired time before the morning feeding for a period of 3 days after the “challenge,” the challenge was repeated; if not, the intake was decreased to the level before the challenge.
2.2. Pens and Cattle
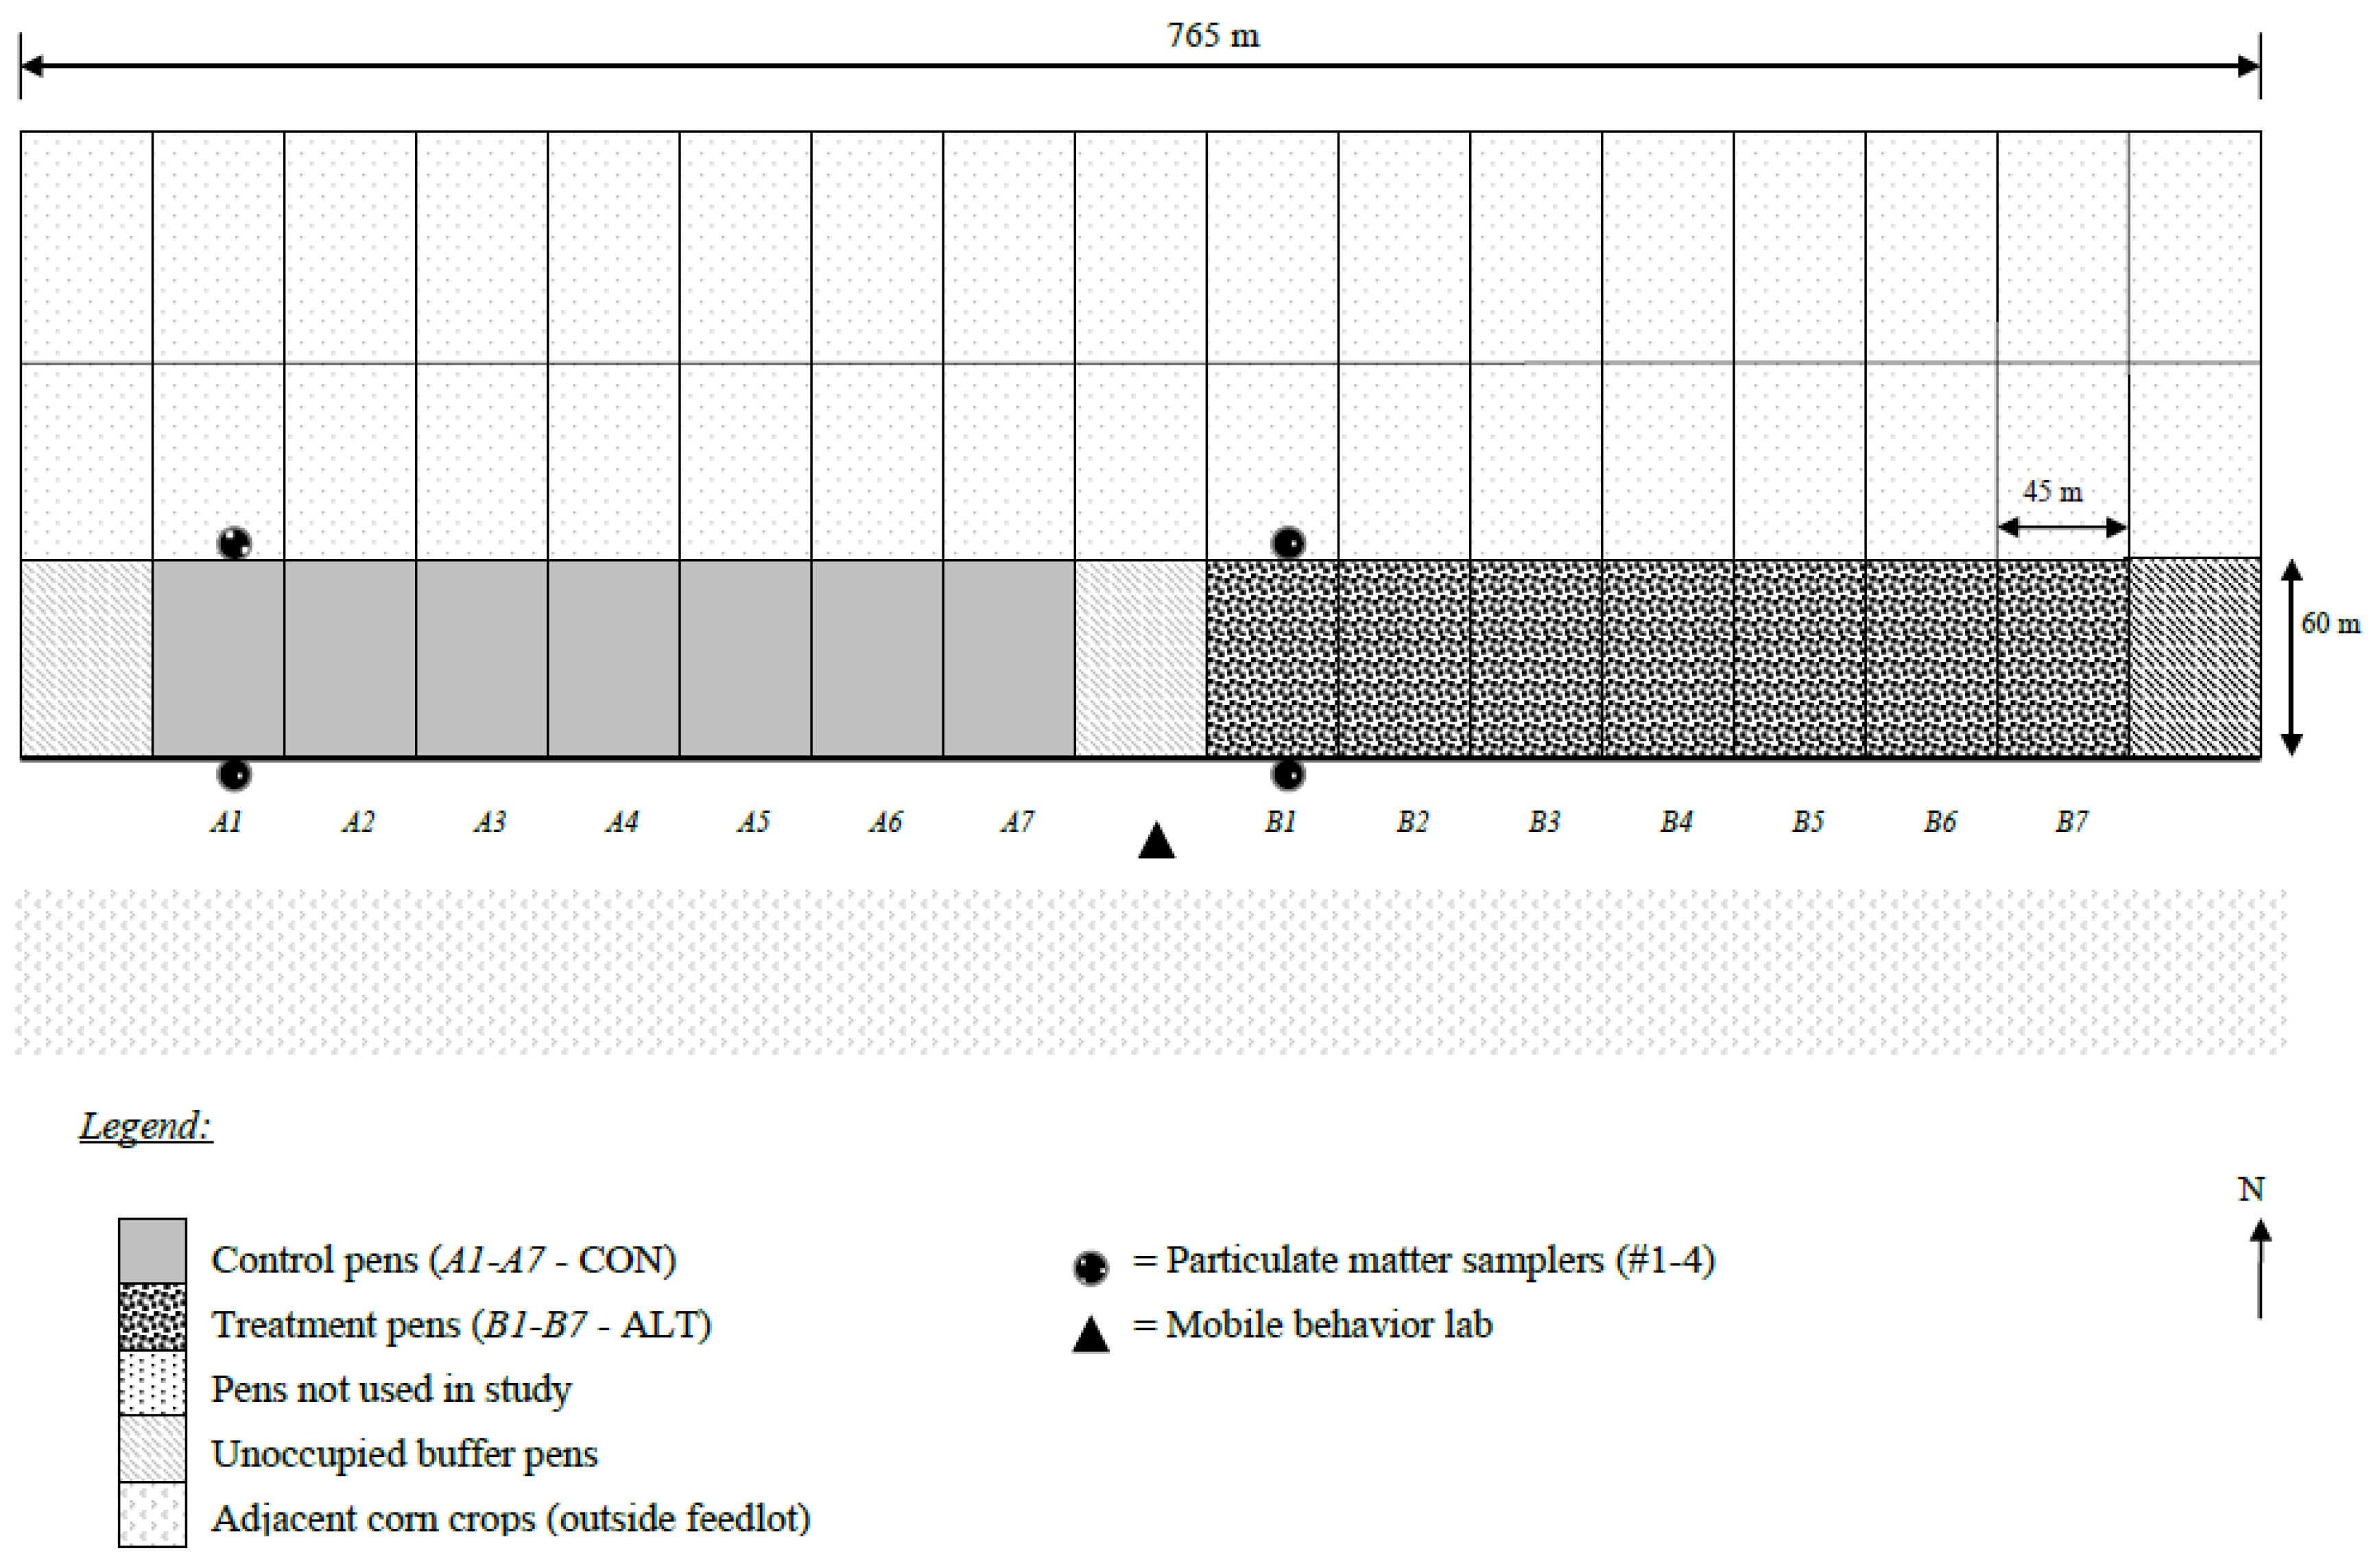
Figure 1 shows a schematic of 14 experimental pens (7 CON, 7 ALT, separated by one unoccupied buffer pen) with east-west orientation located at the south end of the feedlot (adjacent to a crop field). Because south winds predominated, this orientation minimized cross contamination of PM
2.5 between experimental corrals and the other corrals in the feedlot that were not part of the study. It was a practical necessity to apply the treatments in groups of pens (7 ALT and 7 CON) because animal behaviors are affected by cattle in adjacent pens. Feeding schedule (i.e., delivery times) had be grouped in spatially adjacent pens because otherwise, behavior of cattle in CON pens would have been affected by the cattle feeding activity in the ALT cattle and vice versa.
One pen on each side of the ALT and CON corrals was left unoccupied to avoid cross-contamination of PM2.5 and to limit the above mentioned possible crossover effects of feeding times on behavior.
Pen surfaces (dirt lot) were not shaded and manure was removed from all 14 experimental pens before the trial began.
A total of 2813 crossbred steers, housed in 14 corral pens, were included in the study. The average number of steers per pen was 176 (15.2 m
2/steer) and with 24 cm of bunk space per steer. Before trial initiation, cattle were implanted with Synovex-S (Fort Dodge Animal Health, Overland Park, KS, USA) or Ralgro (Shering Plough, Kenilworth, NJ, USA). After receiving, cattle were weighed, blocked by arrival time, and randomly assignment to pens within blocks (paired pens) (see
Figure 1).
Cattle were weighed at the onset and the conclusion of the experiment to assess BW changes. Average initial BW of steers in ALT vs. CON pens were similar (354.4 vs. 355.2 kg, SE = 8.4 kg). Both delivered and refused feed were recorded and DM assessed to allow for determination of DMI.
Steers in both treatments were adjusted to a finishing diet (
Table 1) after approximately 14 days using four adaptation diets (i.e., stepped up in concentrate feed until reaching finishing feedlot ration. Measurements began 1 month after the cattle arrived at the feedlot to allow for adaptation to the environment and feeding schedules.
2.3. Equipment
Automated DustTrak PM2.5 samplers (Particulate Matter DustTrak, Model 8520, TSI, St. Paul, MN, USA) were used to measure PM2.5 concentration. DustTrak samplers are not considered compliant with the Federal Reference Method for measuring PM2.5, thus, the results may not accurately present absolute values usable for e.g., regulatory purposes, but rather data are useful to discover relative differences between treatments.
Before use, PM2.5 samplers were factory calibrated and cleaned following the manufacturer’s recommended schedule. Additionally, prior to sampling in the field, PM2.5 samplers were compared site-by-site to rule out instrument differences as well as any kind of malfunctioning.
PM2.5 samplers were automated and based on light scattering technology, which remotely measure PM concentration every minute and log at 15 min intervals. PM2.5 samplers measured respirable particles with a mass median diameter ≤2.5 μm (PM2.5) every 15 min over a period of 7 days in April and May. In short, the sampler draws air into a sensing chamber, which then is illuminated by a laser beam. The particles scatter light in all directions and a lens concentrates that light on a photodetector, which converts it into voltage. The scattered light is proportional to the voltage and the mass concentration of the aerosol.
A total of 4 samplers were used to measure PM2.5 concentrations upwind and downwind in the south and southwest pens of the feedlot, in 1 pen per treatment per day. The 4 PM2.5 samplers were moved daily from 1 of the 7 pens (per treatment) to the next. The measured particulate matter size was ≤2.5 μm. PM2.5 data were collected on days when the wind was entirely from the south, southeast, or southwest wind direction to prevent cross contamination between treatments.
In addition, there was an unoccupied pen between the seven treatment and seven control pens. The instruments were housed in factory provided weatherproof environmental enclosures, which were placed inside steel cages to protect them from weather and the animals. Cages were attached to the middle of the upwind and downwind corral fence line. PM2.5-sampler inlets were placed about 1.50 m above the ground (approximate height of steer heads when standing).
A weather station (Metos, Weiz, Austria) co-located by the mobile behavior lab, measured weather parameters (precipitation, temperature, humidity, wind speed/-direction, air pressure and light intensity) in 10 min periods over the entire study period. All weather sensors were operated at a 2 m height.
2.4. Behavior
Behaviors were measured during the periods in which PM
2.5 was generated (from 1600 until 2100) using a mobile behavior lab. Behavioral measures were recorded by live observation using a camera that was mounted to a 10 m high rotating tripod on top of a mobile behavior lab from 1600 until 2100 over 7 days. After 2100 h, during darkness, observers could not accurately record cattle behaviors. Behavioral data were measured using a 15-min scan sampling technique, in which the total number of cattle (per pen) performing a given behavior, was directly entered into a computer spreadsheet [
13]. Data were expressed as a percentage of time of total observations during the period of particulate matter generation. Thus, behavioral measures are not indicative of an average of 24 h/day, but of the targeted period of PM
2.5 generation (in the evening). Percentage data were analyzed as Least Squares Means (LSM), Standard Error Means (SEM), and
p-values determined by arcsine square root transforming percent data (to achieve normalized distribution).
The measured behaviors were: (a) PM
2.5-generating behaviors including locomotion (walk/run), agonistic and bulling behavior; and (b) behaviors with little effect on PM
2.5 like feeding, waiting for feed, lying and standing behavior. Behaviors were defined as described earlier [
13], but in short: Locomotion was any change of body location within the pen. Agonistic behaviors were those indicative of social conflict such as threat, attack, fight, or escape. Bulling behavior was defined as mounting of a steer by its peer(s). Feeding was defined to be head over or in the bunk. Waiting for feed was an upright body posture near the bunk without actually having access to feed. Steers waiting for feed were normally waiting in the second or third row until their feeding peers were finished. Drinking was defined as the head over or in the water trough. Lying was defined as body contact with the ground and standing was considered to be an inactive upright posture (no locomotion).
2.5. Experimental Design and Analysis
Behavioral measures were collected during the period of PM2.5 generation (1600 to 2100 h) and represent the percentage of time cattle were engaged in these behaviors during that period. Particulate matter measures were collected over 24 h and averaged for each hour of the day. The pen was the experimental unit (cattle had been randomly assigned to experimental units). Treatment pens selected were determined by location in the feedlot.
The experimental design for behavioral and PM2.5 measures was a randomized complete block with paired pens on a given arrival date as the blocks (the assignment to treatments within blocks was random). As mentioned earlier, a total of 14 pens were used (7 pens/treatment). For measures of performance and behavior, the statistical model included treatment, block, and treatment by block interaction effects. The treatment by block effect was the error term. The effects of behaviors on the variation in PM2.5 were analyzed with the stepwise multiple regression procedure and correlations of behaviors with PM2.5 calculated using SAS (SAS Inst, Inc., Cary, NC, USA) in an attempt to predict aerial dust based on behavior. For PM2.5 measures, a repeated measures analysis was employed with 24 time periods per day. The PM2.5 model was the same as above, but also included effects of time, and treatment by time, and residual error. Performance data were analyzed as a completely randomized design with 2 treatment groups and 7 pen replications per treatment. Because treatments were determined by physical location of the pens and the predominant wind direction, pens could not be randomly assigned treatments (see earlier discussion). However, cattle were randomly assigned to pen experimental units. Means separation using the predicted difference test was governed by protected levels of significance at the alpha level reported. All analysis was conducted using PROC MIXED in SAS (SAS Inst, Inc., Cary, NC, USA).
Finally, correlation coefficients were calculated to examine relationships between cattle behaviors and the variation in aerial PM2.5 using SAS.
4. Discussion
It is generally accepted that hot and dry weather is conducive to detachment of particles from the feedlot pen surface [
14]. The problem of high particulate matter concentrations are most severe during the late afternoon and early evening hours, when the ambient temperatures are highest and the relative humidity lowest. The moisture level of the manure pad in the feedlot pen, vapor pressure in the air, and precipitation undoubtedly affect particulate matter concentrations [
14,
15]. The cohesion between particles is lowest during dry periods and during those times, detachment of particles from the ground is easiest [
16]. However, additional work is needed to clarify these potential relationships.
Other PM work indicated that the high downwind PM concentrations which occur in feedlots in the evening are affected by a strong increase in cattle activity [
16,
17]. We hypothesized in the present study that the common feeding practice of only feeding cattle in the morning impacts this problem. A change from conventional to more crepuscular feeding times (dusk, noon, and dawn) was proposed to change PM-generating behavior into those that are less active, and therefore generate less particulate matter. Particulate matter-generating behaviors (like agonistic and bulling behaviors) were much lower in the alternative feeding time regime than in the conventional control. Cattle have a strong feeding motivation around dawn and dusk [
17], and if feed is unavailable, we hypothesized that cattle will replace feeding with locomotion, agonistic, or bulling behavior.
Correlations between behavior and PM
2.5 generation do not indicate cause and effect. However, one can see from our data that two behaviors (agonistic behaviors and standing) had a significant (though not perfect) correlation with PM
2.5 generation (
Table 3). These correlations between behavior and fine particle generation support the hypothesis that active behaviors stir up PM
2.5 while less-active behaviors (e.g., feeding) do not. Lying down is negatively correlated with dust levels because when animals lay down, less PM
2.5 is generated and when they are not lying down, they may be active fighting or standing which do generate PM
2.5. A key finding of this work is the concept that cattle behavior contributes to PM
2.5 generation in a meaningful way. Furthermore, when cattle management/feeding practices are changed to reduce active behaviors, PM
2.5 generation was being reduced.
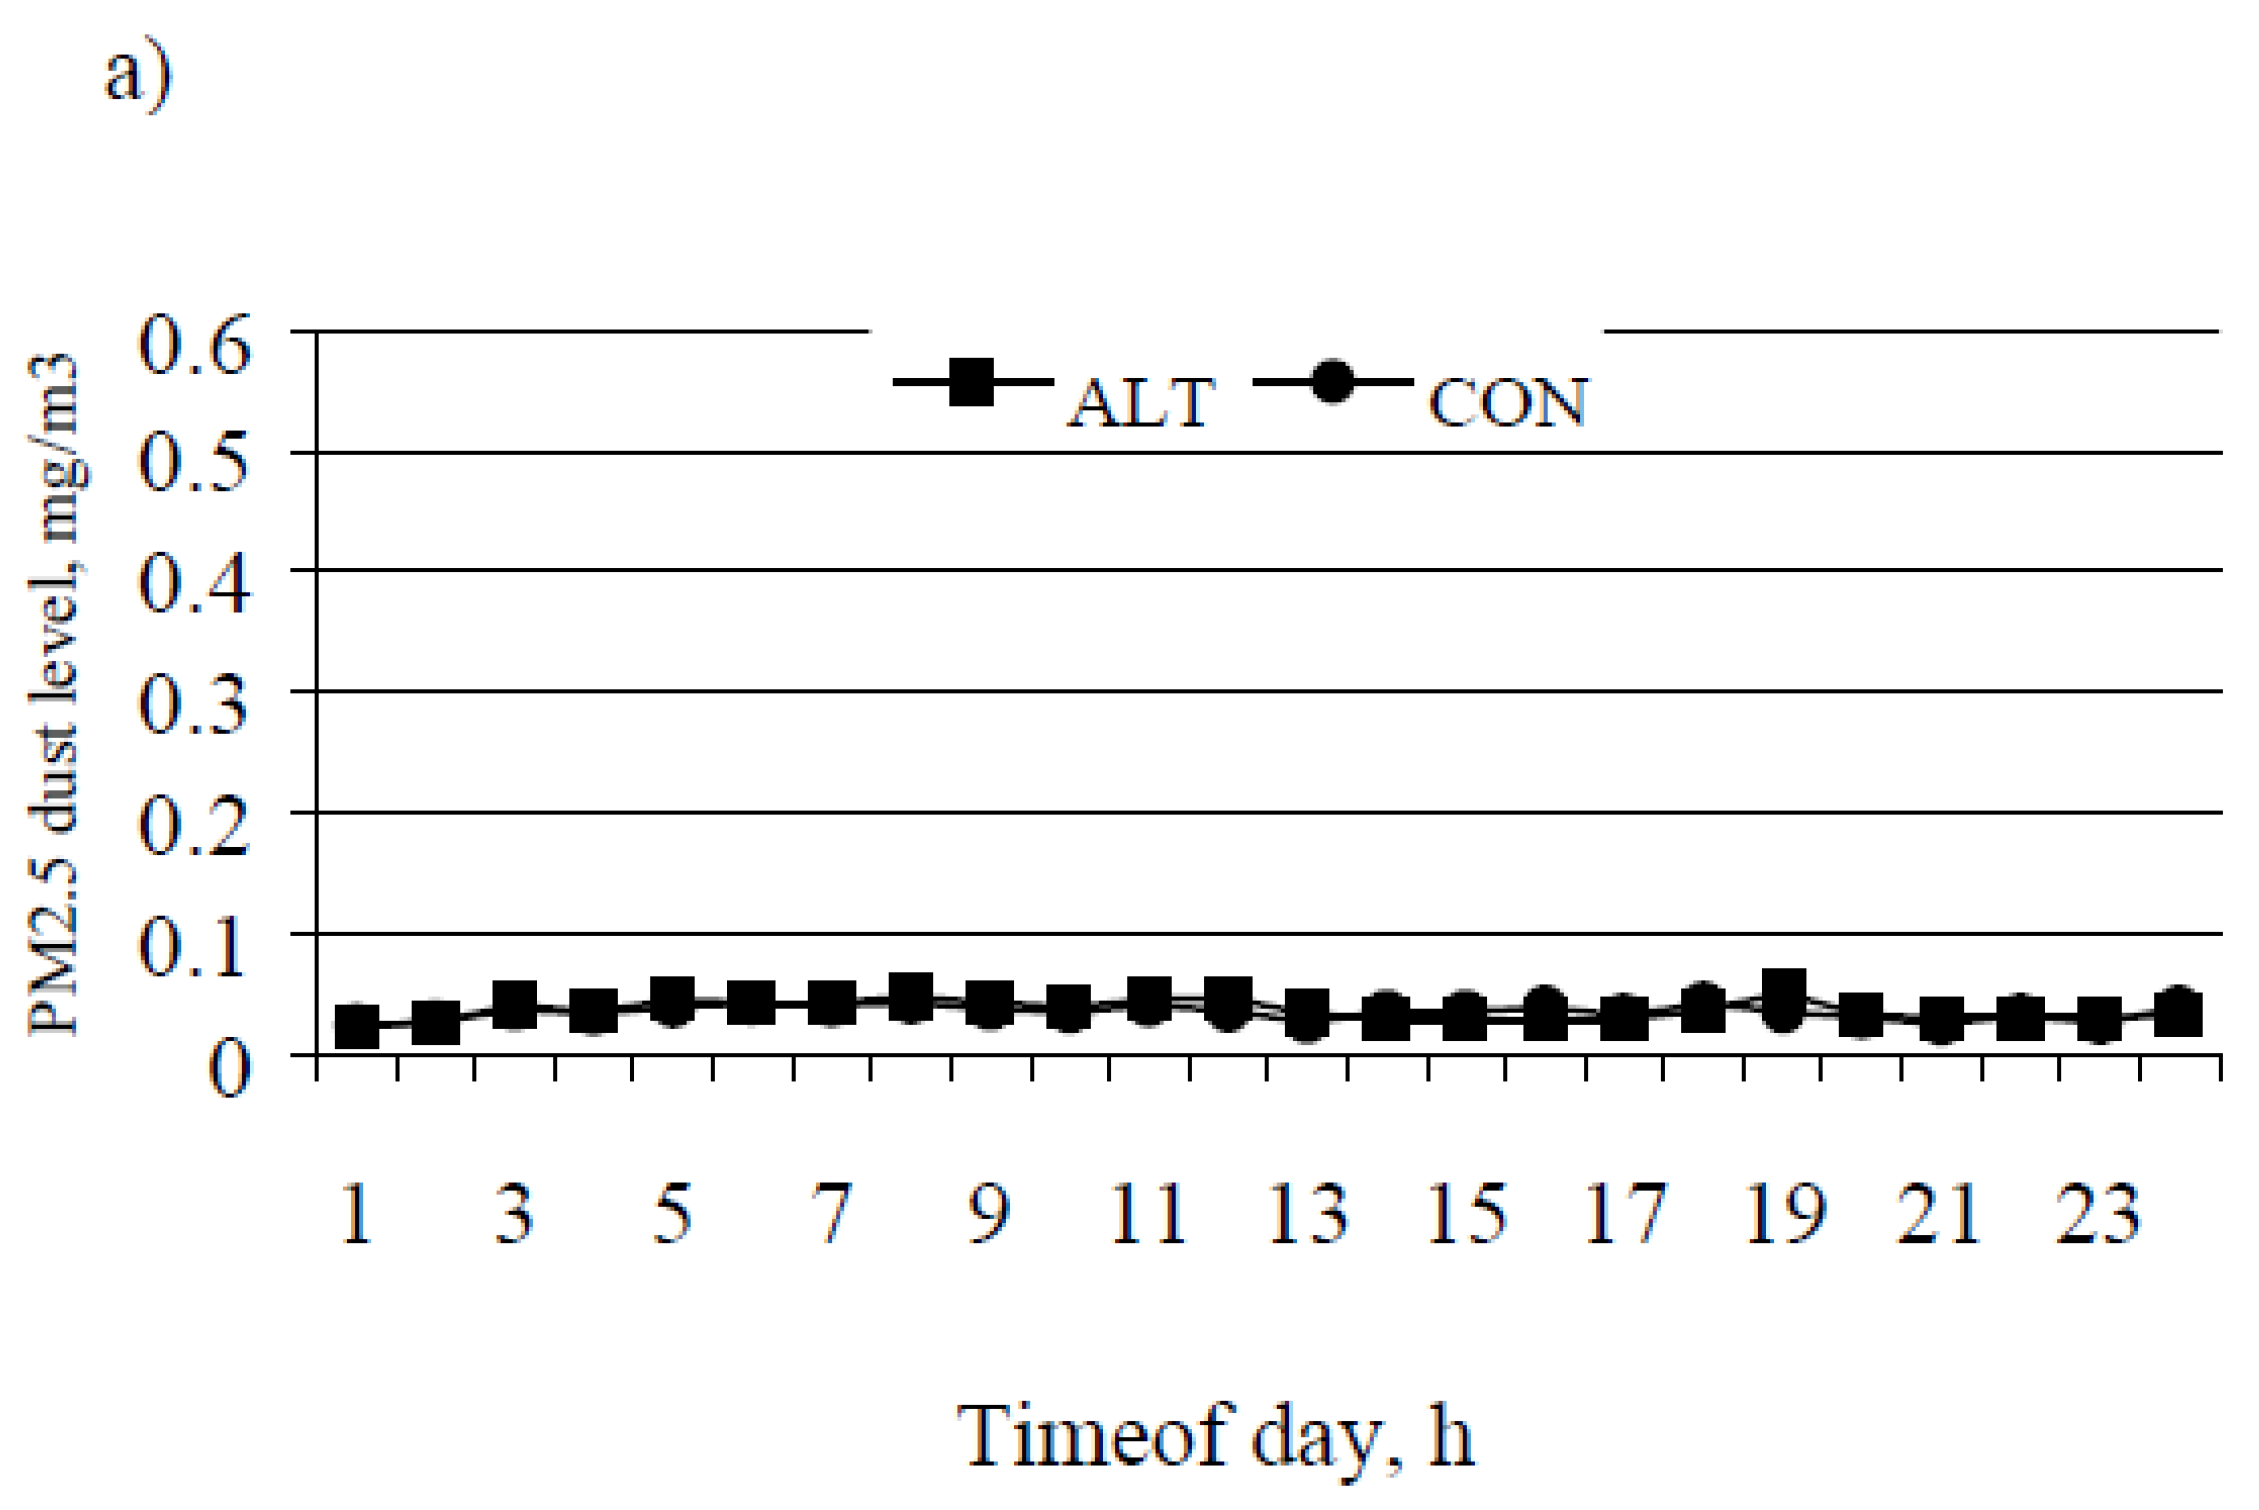
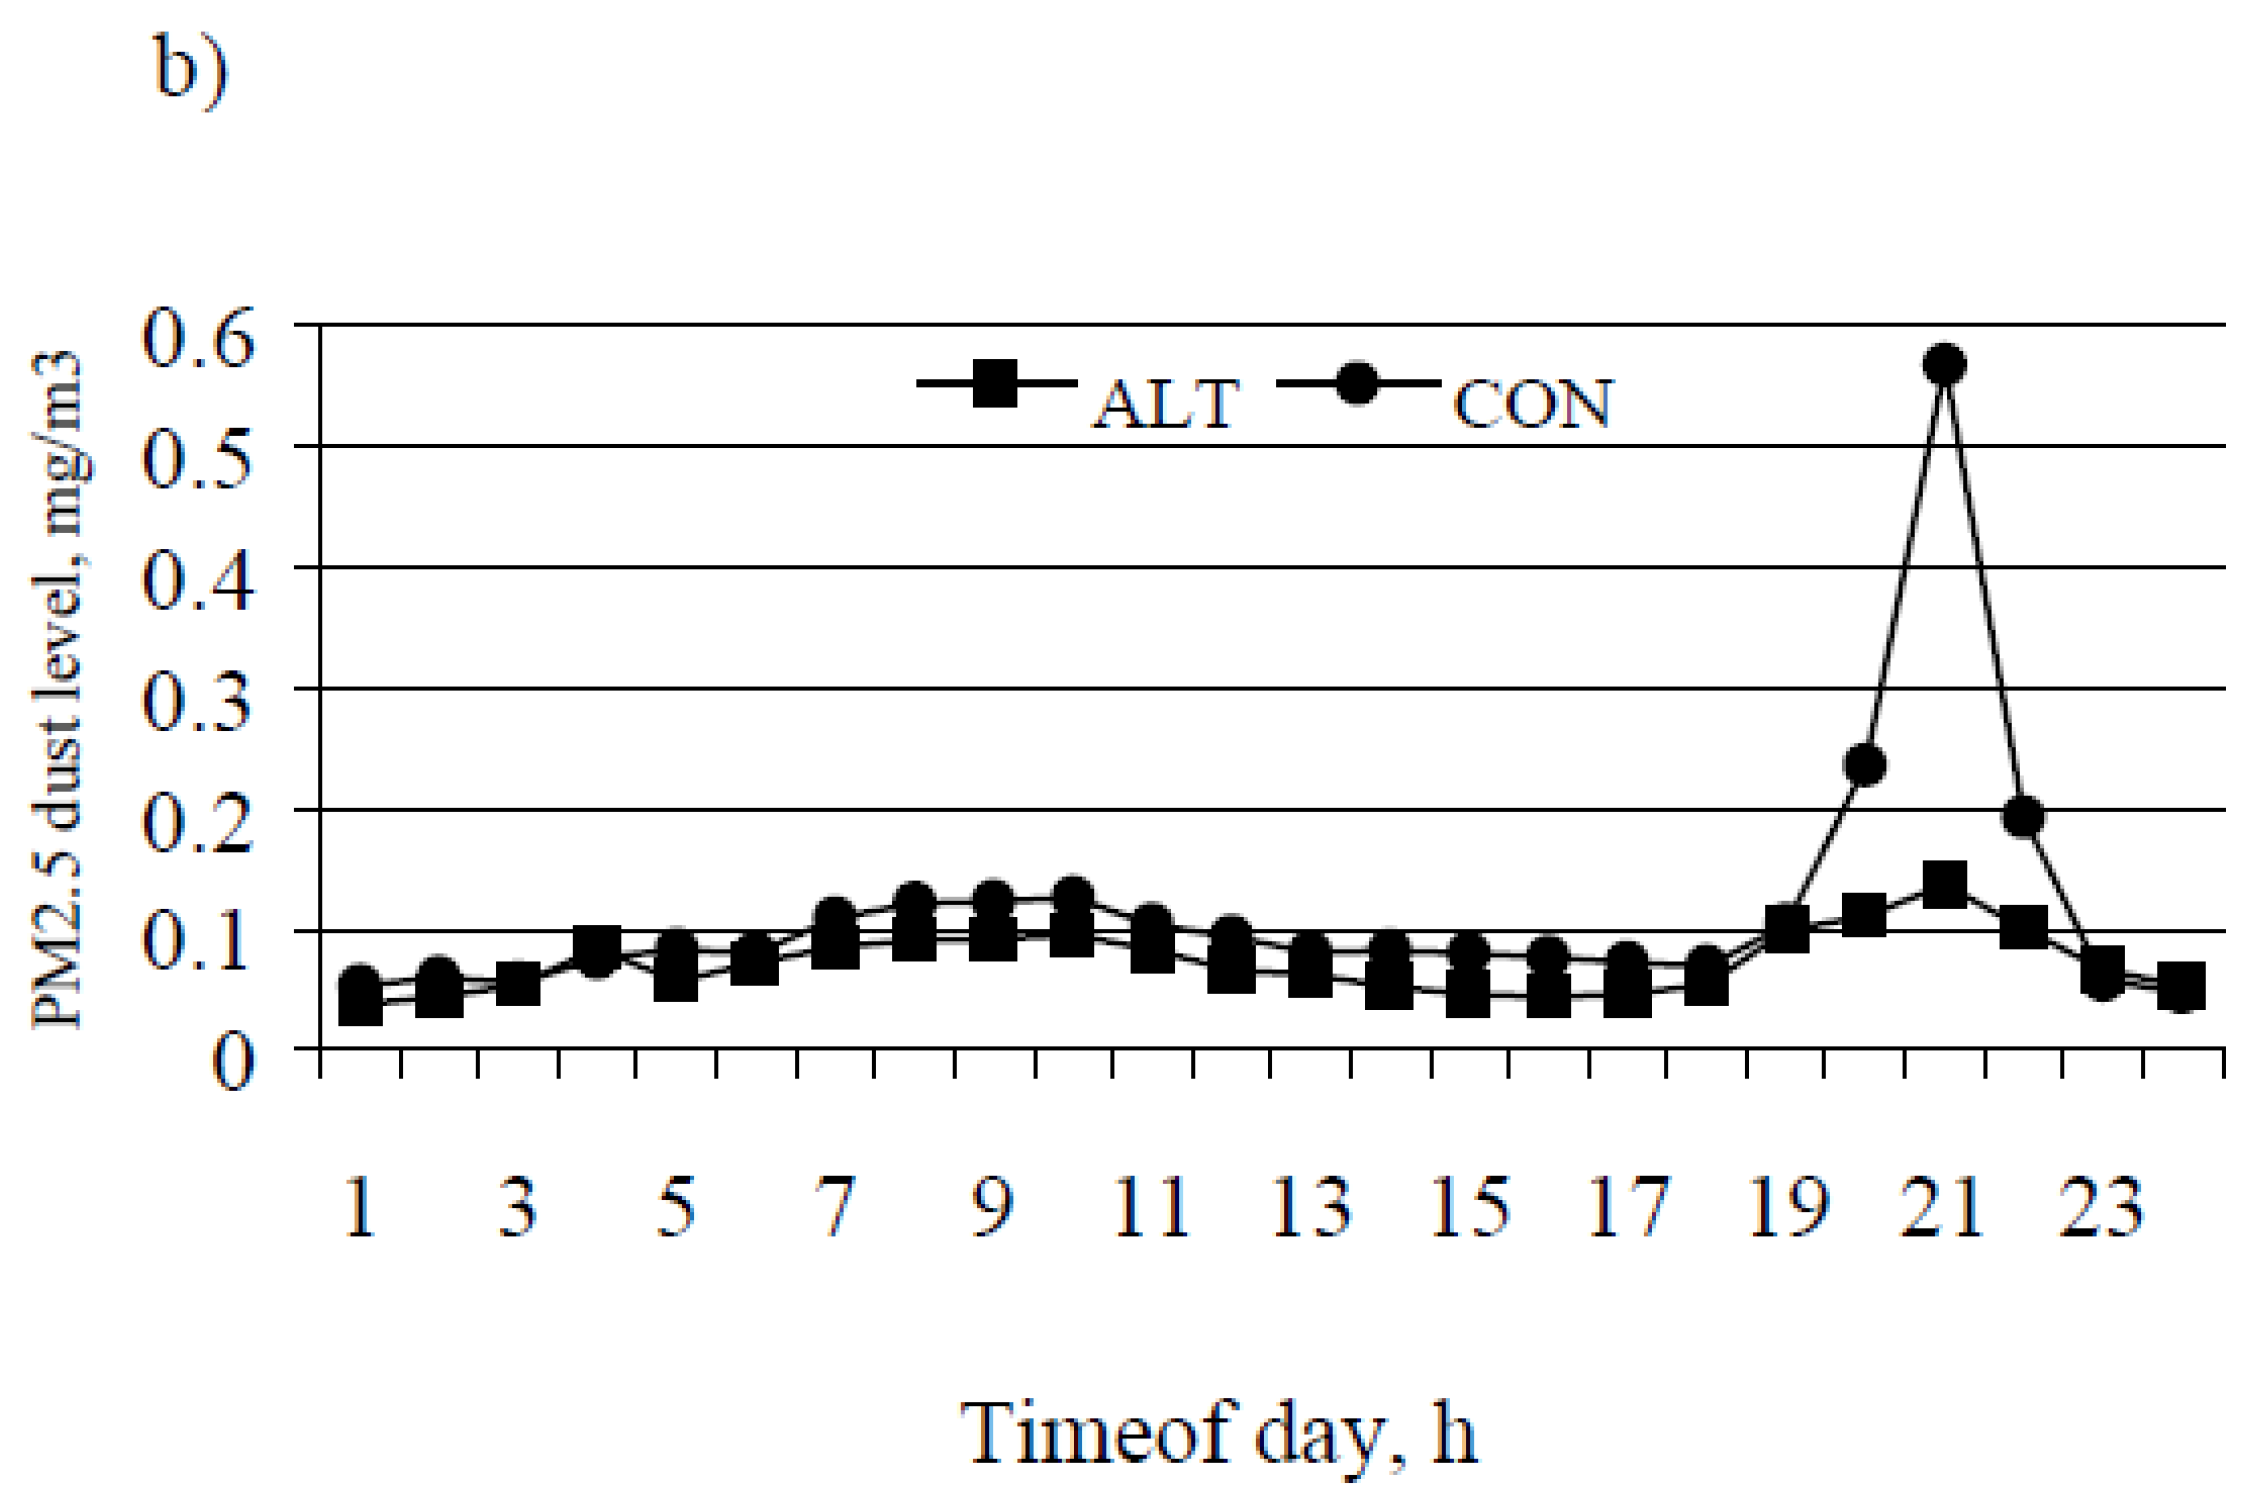
The findings of this study were consistent with the hypothesis that active behaviors are associated with PM2.5 generation. At dusk, when the majority of agonistic and locomotive behaviors occur, PM2.5 concentrations peaked. By altering feeding times, the agonistic behaviors were reduced and consequently PM2.5 concentrations were also reduced. Altered feeding schedule clearly caused reduced PM2.5 concentrations. Behavioral data supports the hypothesis that increasing feeding behaviors and reducing agonistic behaviors in the evening will reduce PM2.5 generation. Further work is needed to quantify the PM distribution generated by cattle feedlots. It would be interesting to know PM5 and PM10 concentrations in this production system and to see if our new management practice might change the distribution of particles of various sizes.
Conducting in-field management studies on PM2.5 movement necessitates accounting for wind direction and has the limitations of the physical location of pens within the feedlot. Adjoining pens/experimental units can influence each other and thus, the experimental units cannot be totally independent. However, because behaviors were different between treatments, it was clear that our management change (altered feeding times) caused changes in cattle behavior and dust generation that were larger than any effects that adjoining pens may have caused.
Future studies should determine the relationships between feeding levels and PM2.5 generation. Feeding a high proportion of the daily ration in the early evening might alter the feeding behavior of cattle the next morning, which might affect management decisions on allotment of feed to each pen.
In the USA, PM2.5 is regulated by the federal and state agencies and cattle feedlots can run the risk of exceeding the thresholds. Approaches are needed to reduce PM2.5 emissions from confined cattle feeding operations. The present research may suggest a management practice that may reduce PM2.5 emissions from confined animal feeding operations. While this work was conducted in a commercial environment, more research is needed to refine this approach, independently confirm its efficacy, and understand how this approach may impact labor efficiency and profitability.


