Effects of Transfer from Breeding to Research Facility on the Welfare of Rats

Abstract
:Simple Summary
Abstract
1. Introduction
2. Materials and Methods
2.1. Animals and Housing
2.2. Experimental Setup
2.3. Implantation Temperature Logger
2.4. Transfer
2.5. Water and Food Intake
2.6. Blood Collection and Analysis
2.7. Behavioral Observations
- (1)
- Activity/Locomotion (LOC): consisting of the behaviors explore, rear, walk, shake, scratch, scan, and hop/jump.
- (2)
- Social interactions (SI): consisting of social exploration, social groom, follow/chase, push and pin.
- (3)
- Self grooming (GRO), consisting of six behavioral elements which together compose the cephalo-caudal-sequence that animals perform in an undisturbed situation: fore-paw licking, face/nose wash, head wash, body wash/fur licking, hind leg licking, tail/genitals licking [32].
2.8. Statistical Analysis
3. Results
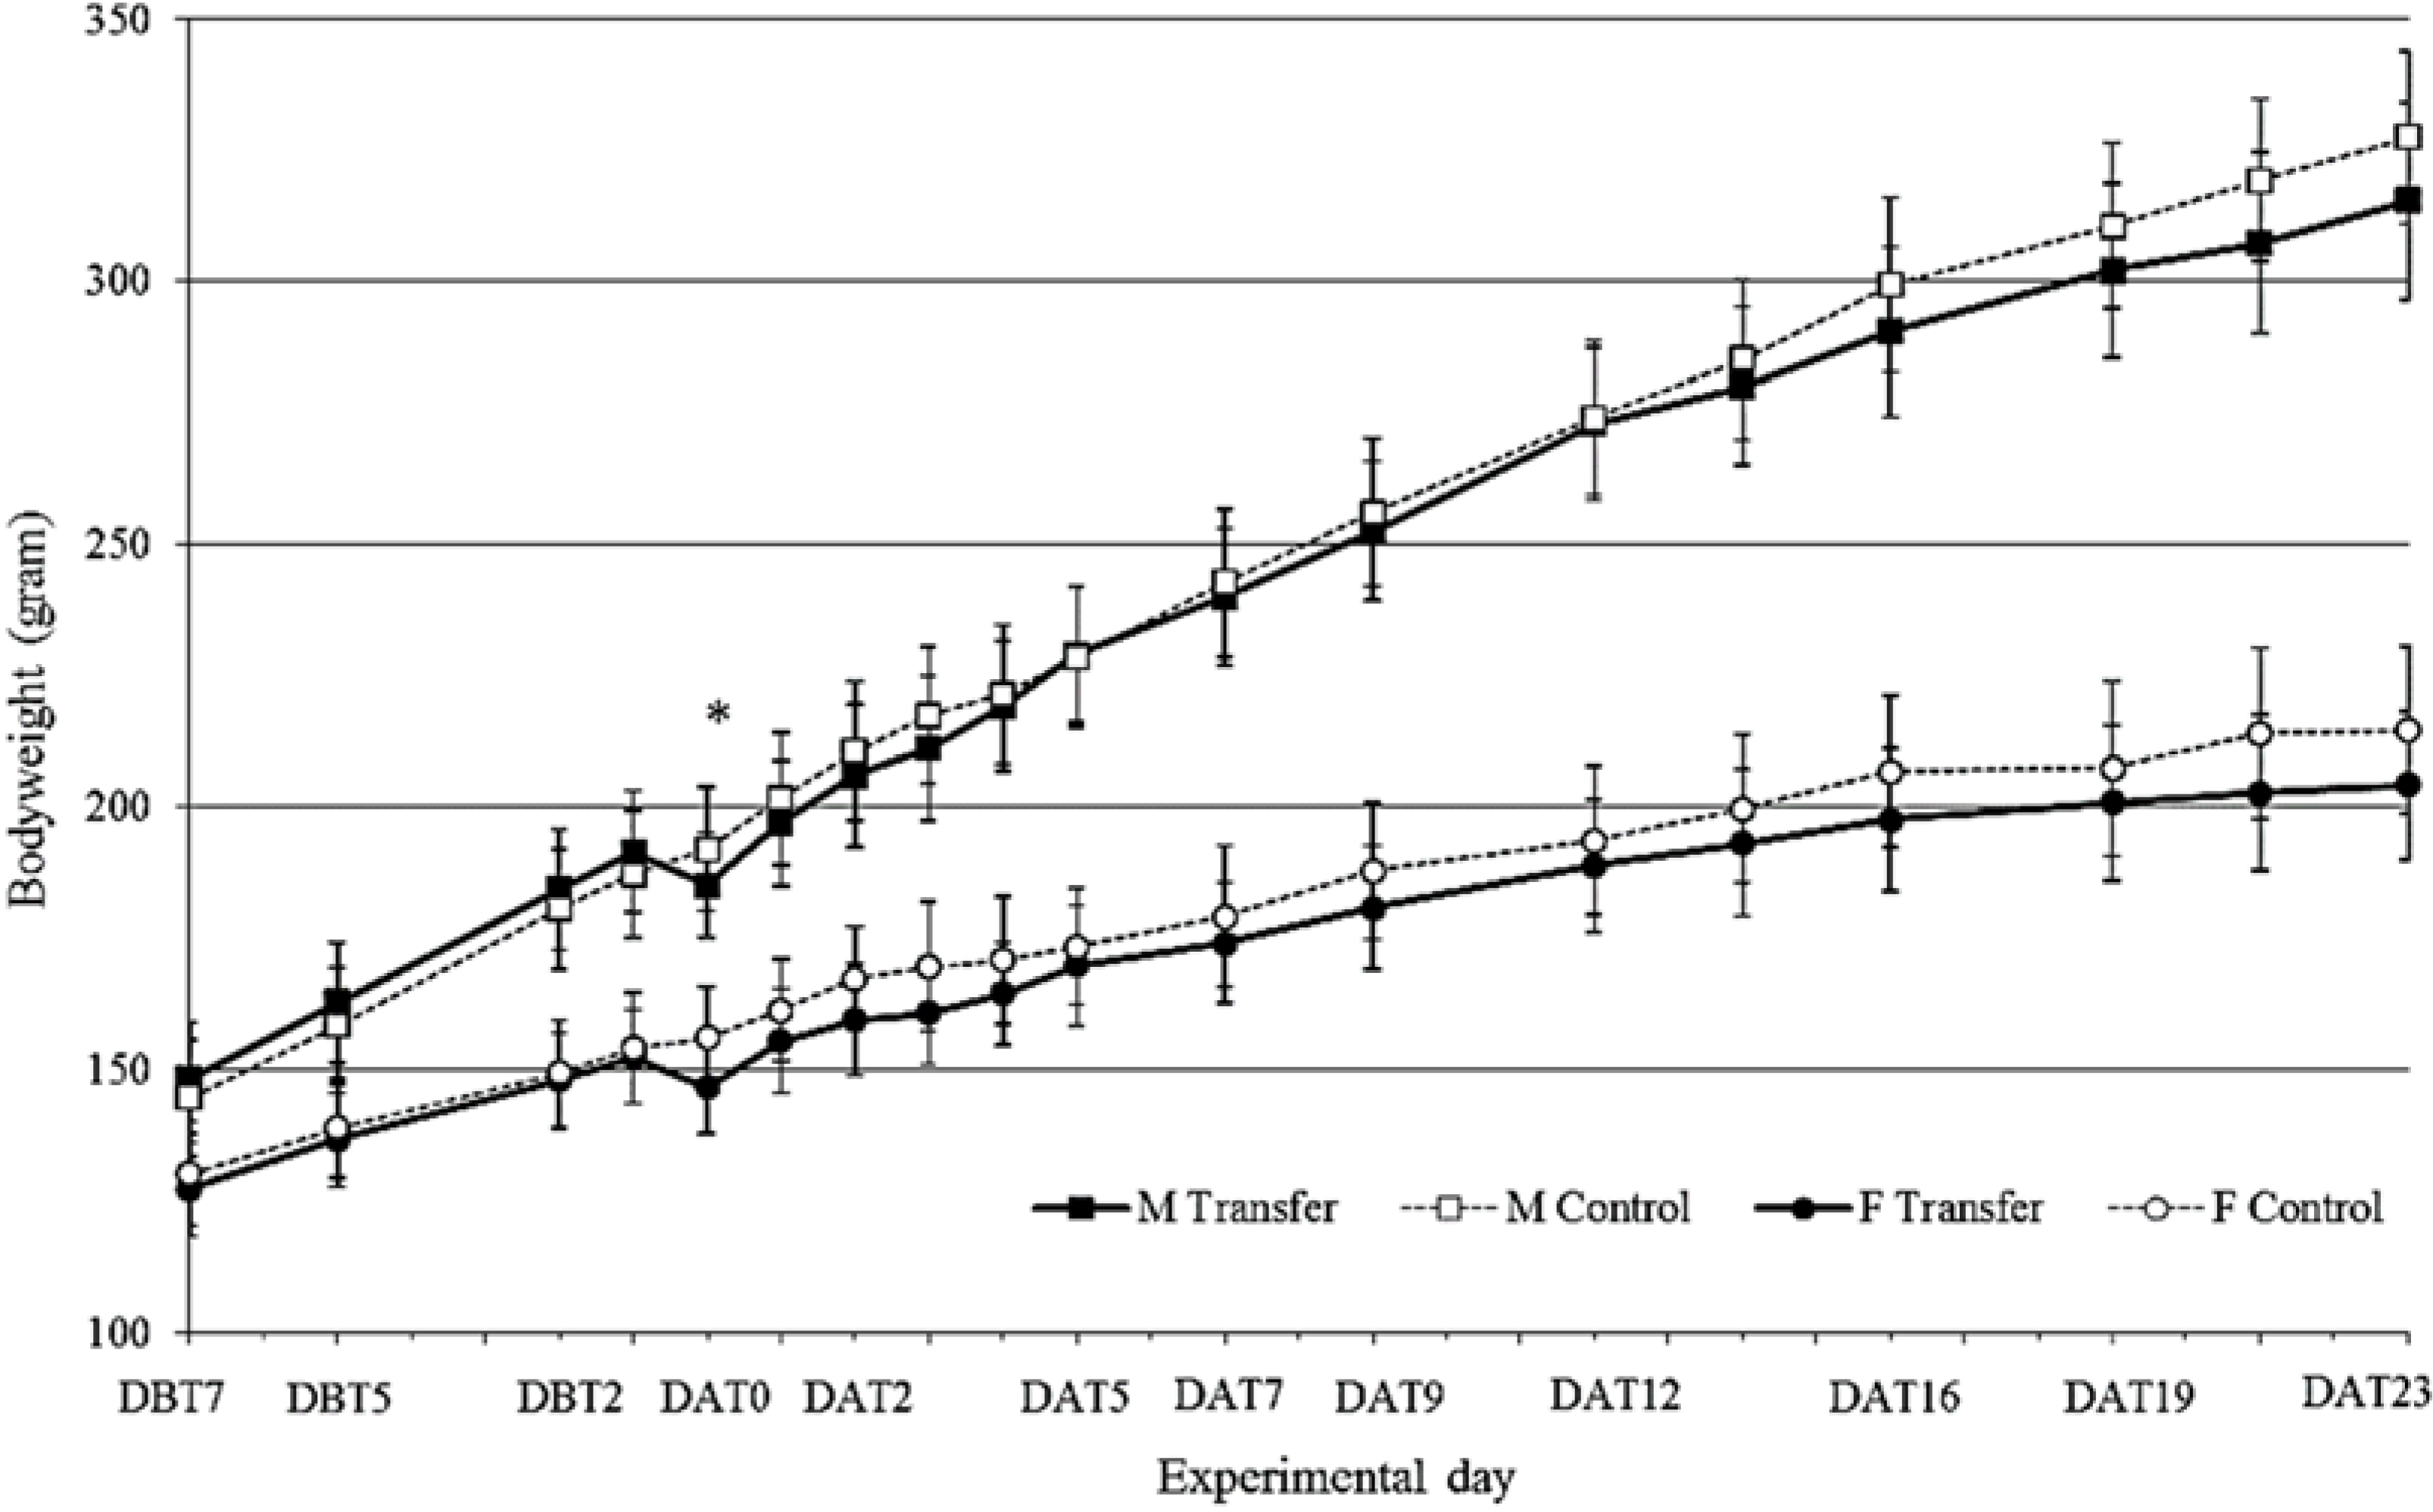
3.1. Body Weight
3.2. Water and Food Intake

| Water (g) | Day 0 | Day 1 | Day 2 | Day 3 | Day 4 |
| M Transfer | 42.13 ± 11.10 * | 80.75 ± 18.43 | 66.38 ± 10.18 | 71.50 ± 10.54 * | 71.38 ± 5.07 * |
| M Control | 86.63 ± 7.31 | 73.63 ± 6.61 | 76.13 ± 7.62 | 85.63 ± 8.48 | 91.38 ± 5.01 |
| F Transfer | 26.63 ± 6.07 * | 66.75 ± 5.63 * | 50.13 ± 3.83 | 52.38 ± 4.60 | 52.38 ± 5.45 * |
| F Control | 64.13 ± 6.13 | 55.13 ± 6.58 | 56.63 ± 6.80 | 61.63 ± 10.49 | 68.38 ± 9.81 |
| Food (g) | Day 0 | Day 1 | Day 2 | Day 3 | Day 4 |
| M Transfer | 40.63 ± 6.02 * | 65.25 ± 7.57 * | 60.63 ± 5.29 * | 61.88 ± 6.31 | 61.00 ± 3.96 |
| M Control | 69.50 ± 3.38 | 44.13 ± 2.59 | 54.00 ± 3.42 | 56.75 ± 2.76 | 60.50 ± 2.88 |
| F Transfer | 31.25 ± 3.28 * | 53.50 ± 3.16 * | 45.75 ± 3.49 * | 45.75 ± 3.54 * | 44.63 ± 3.70 |
| F Control | 50.75 ± 4.83 | 33.13 ± 3.64 | 39.75 ± 4.06 | 39.13 ± 4.09 | 47.00 ± 3.30 |
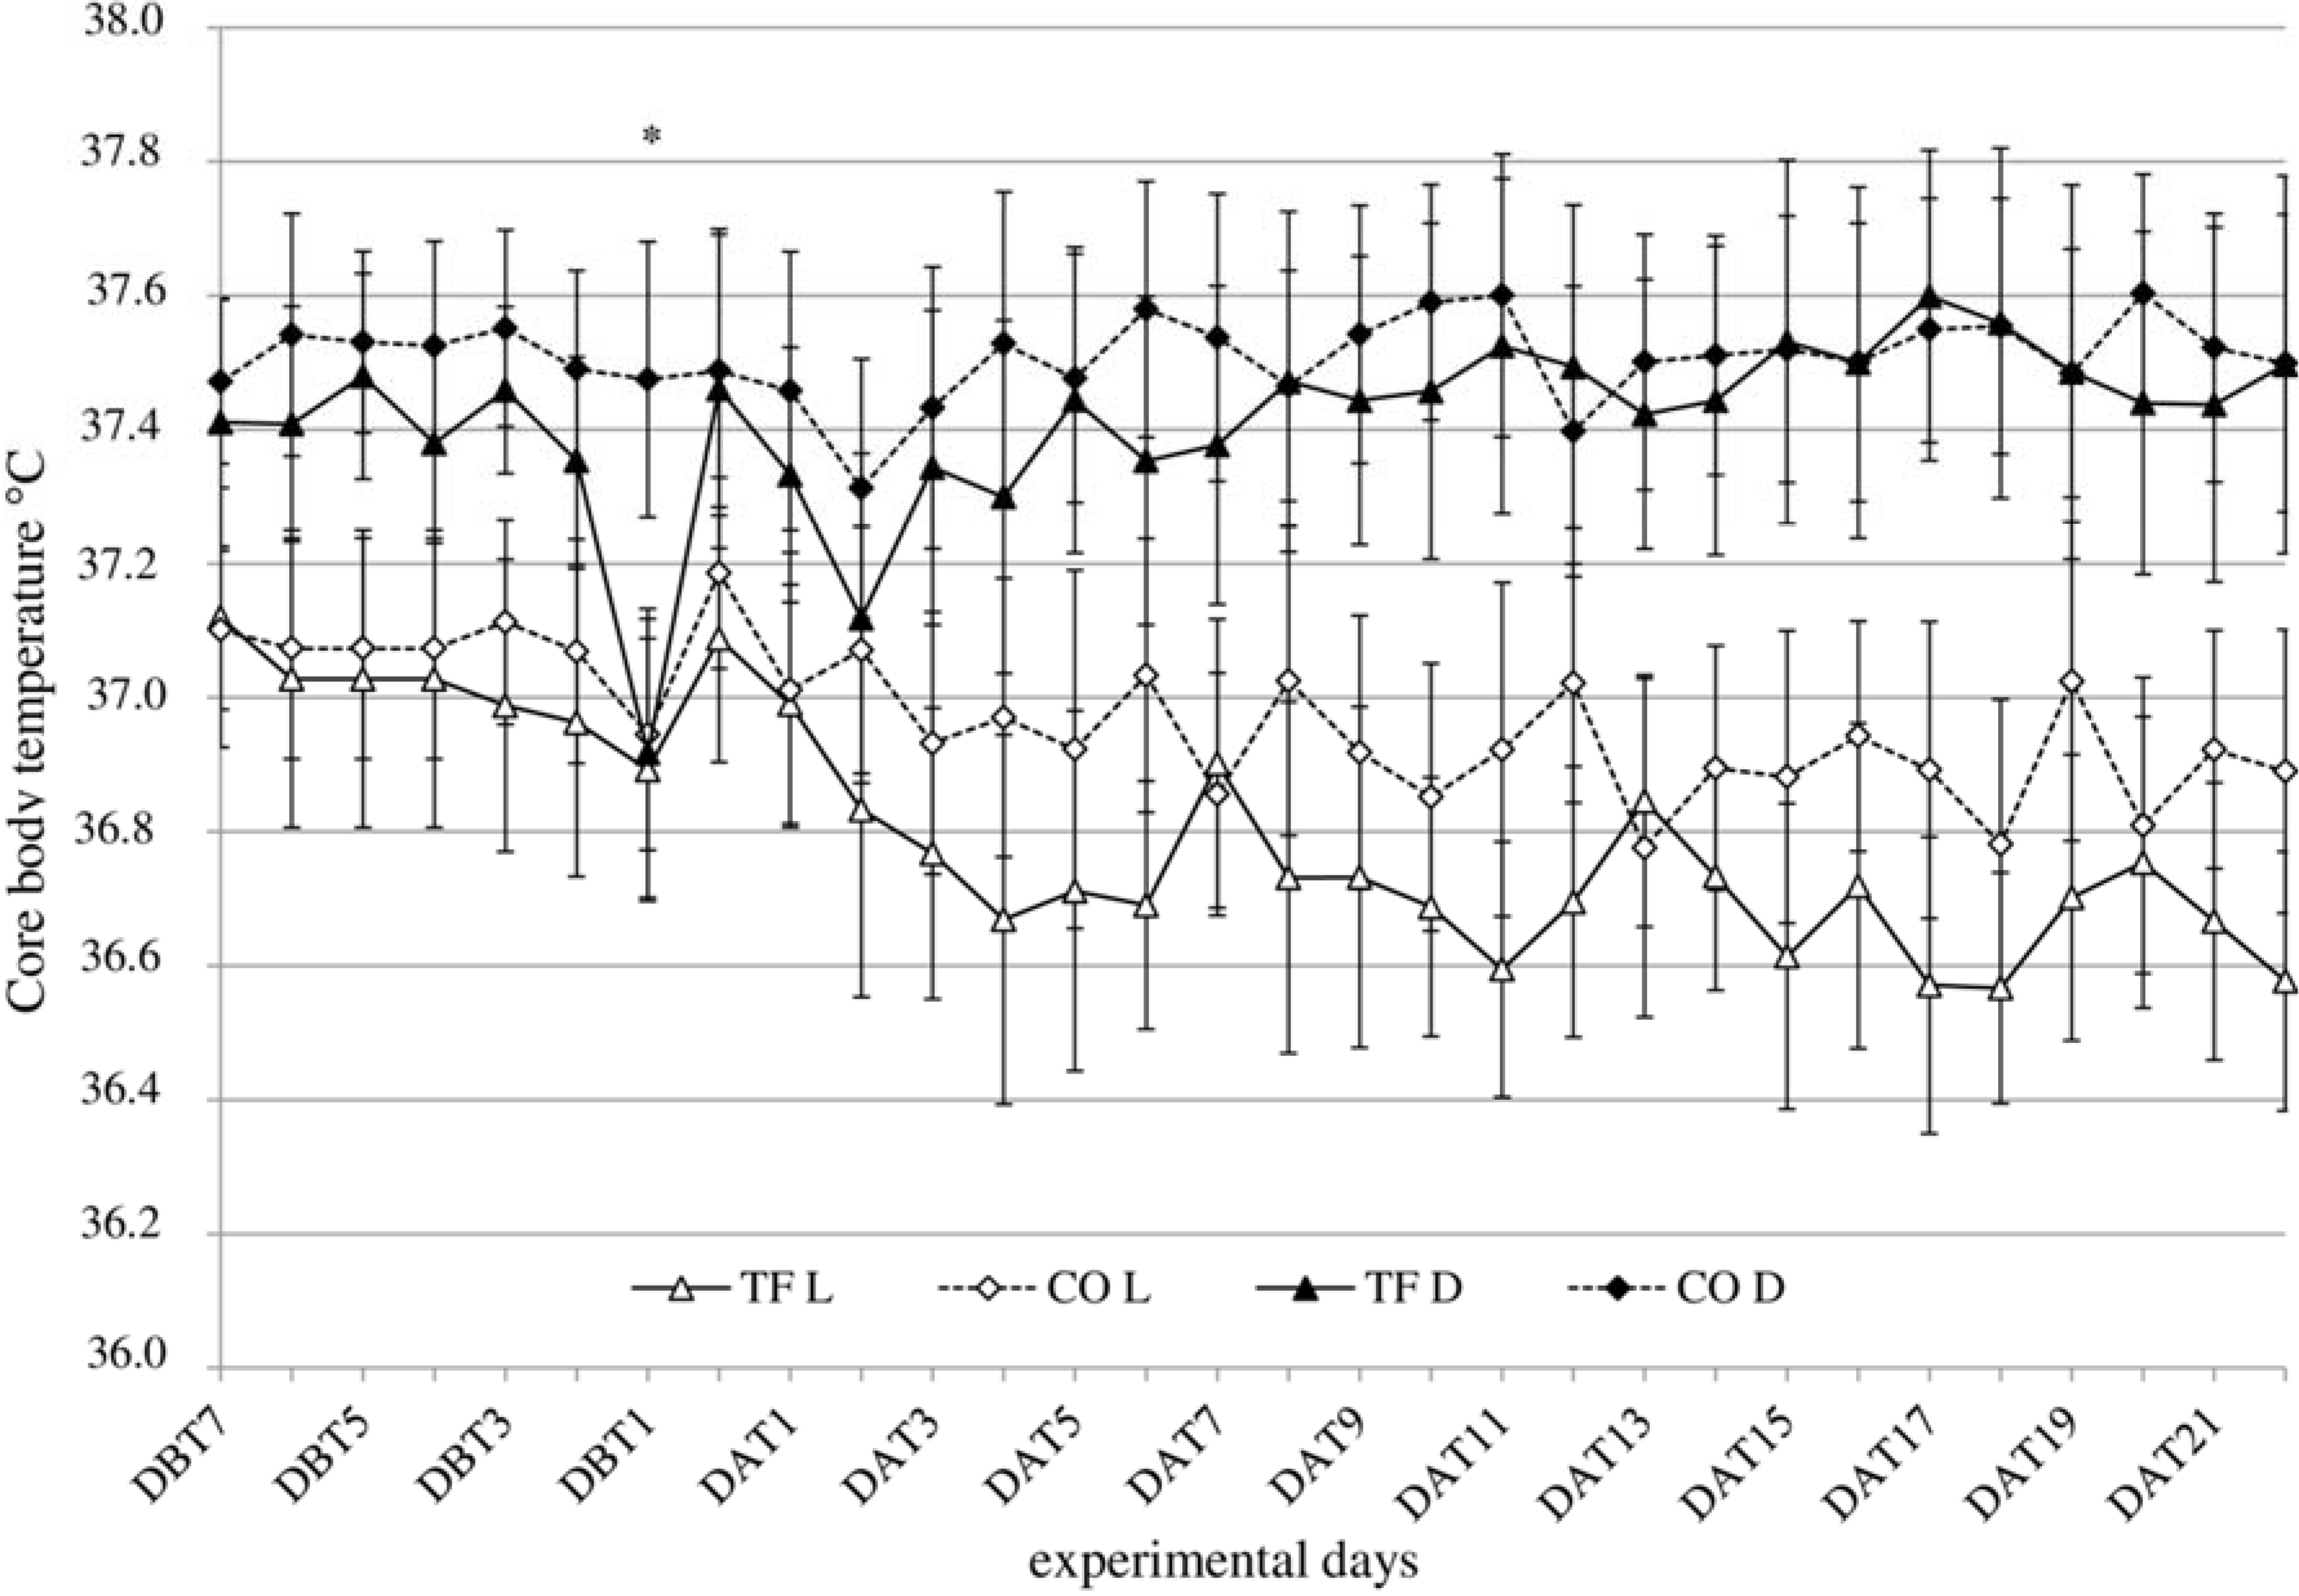
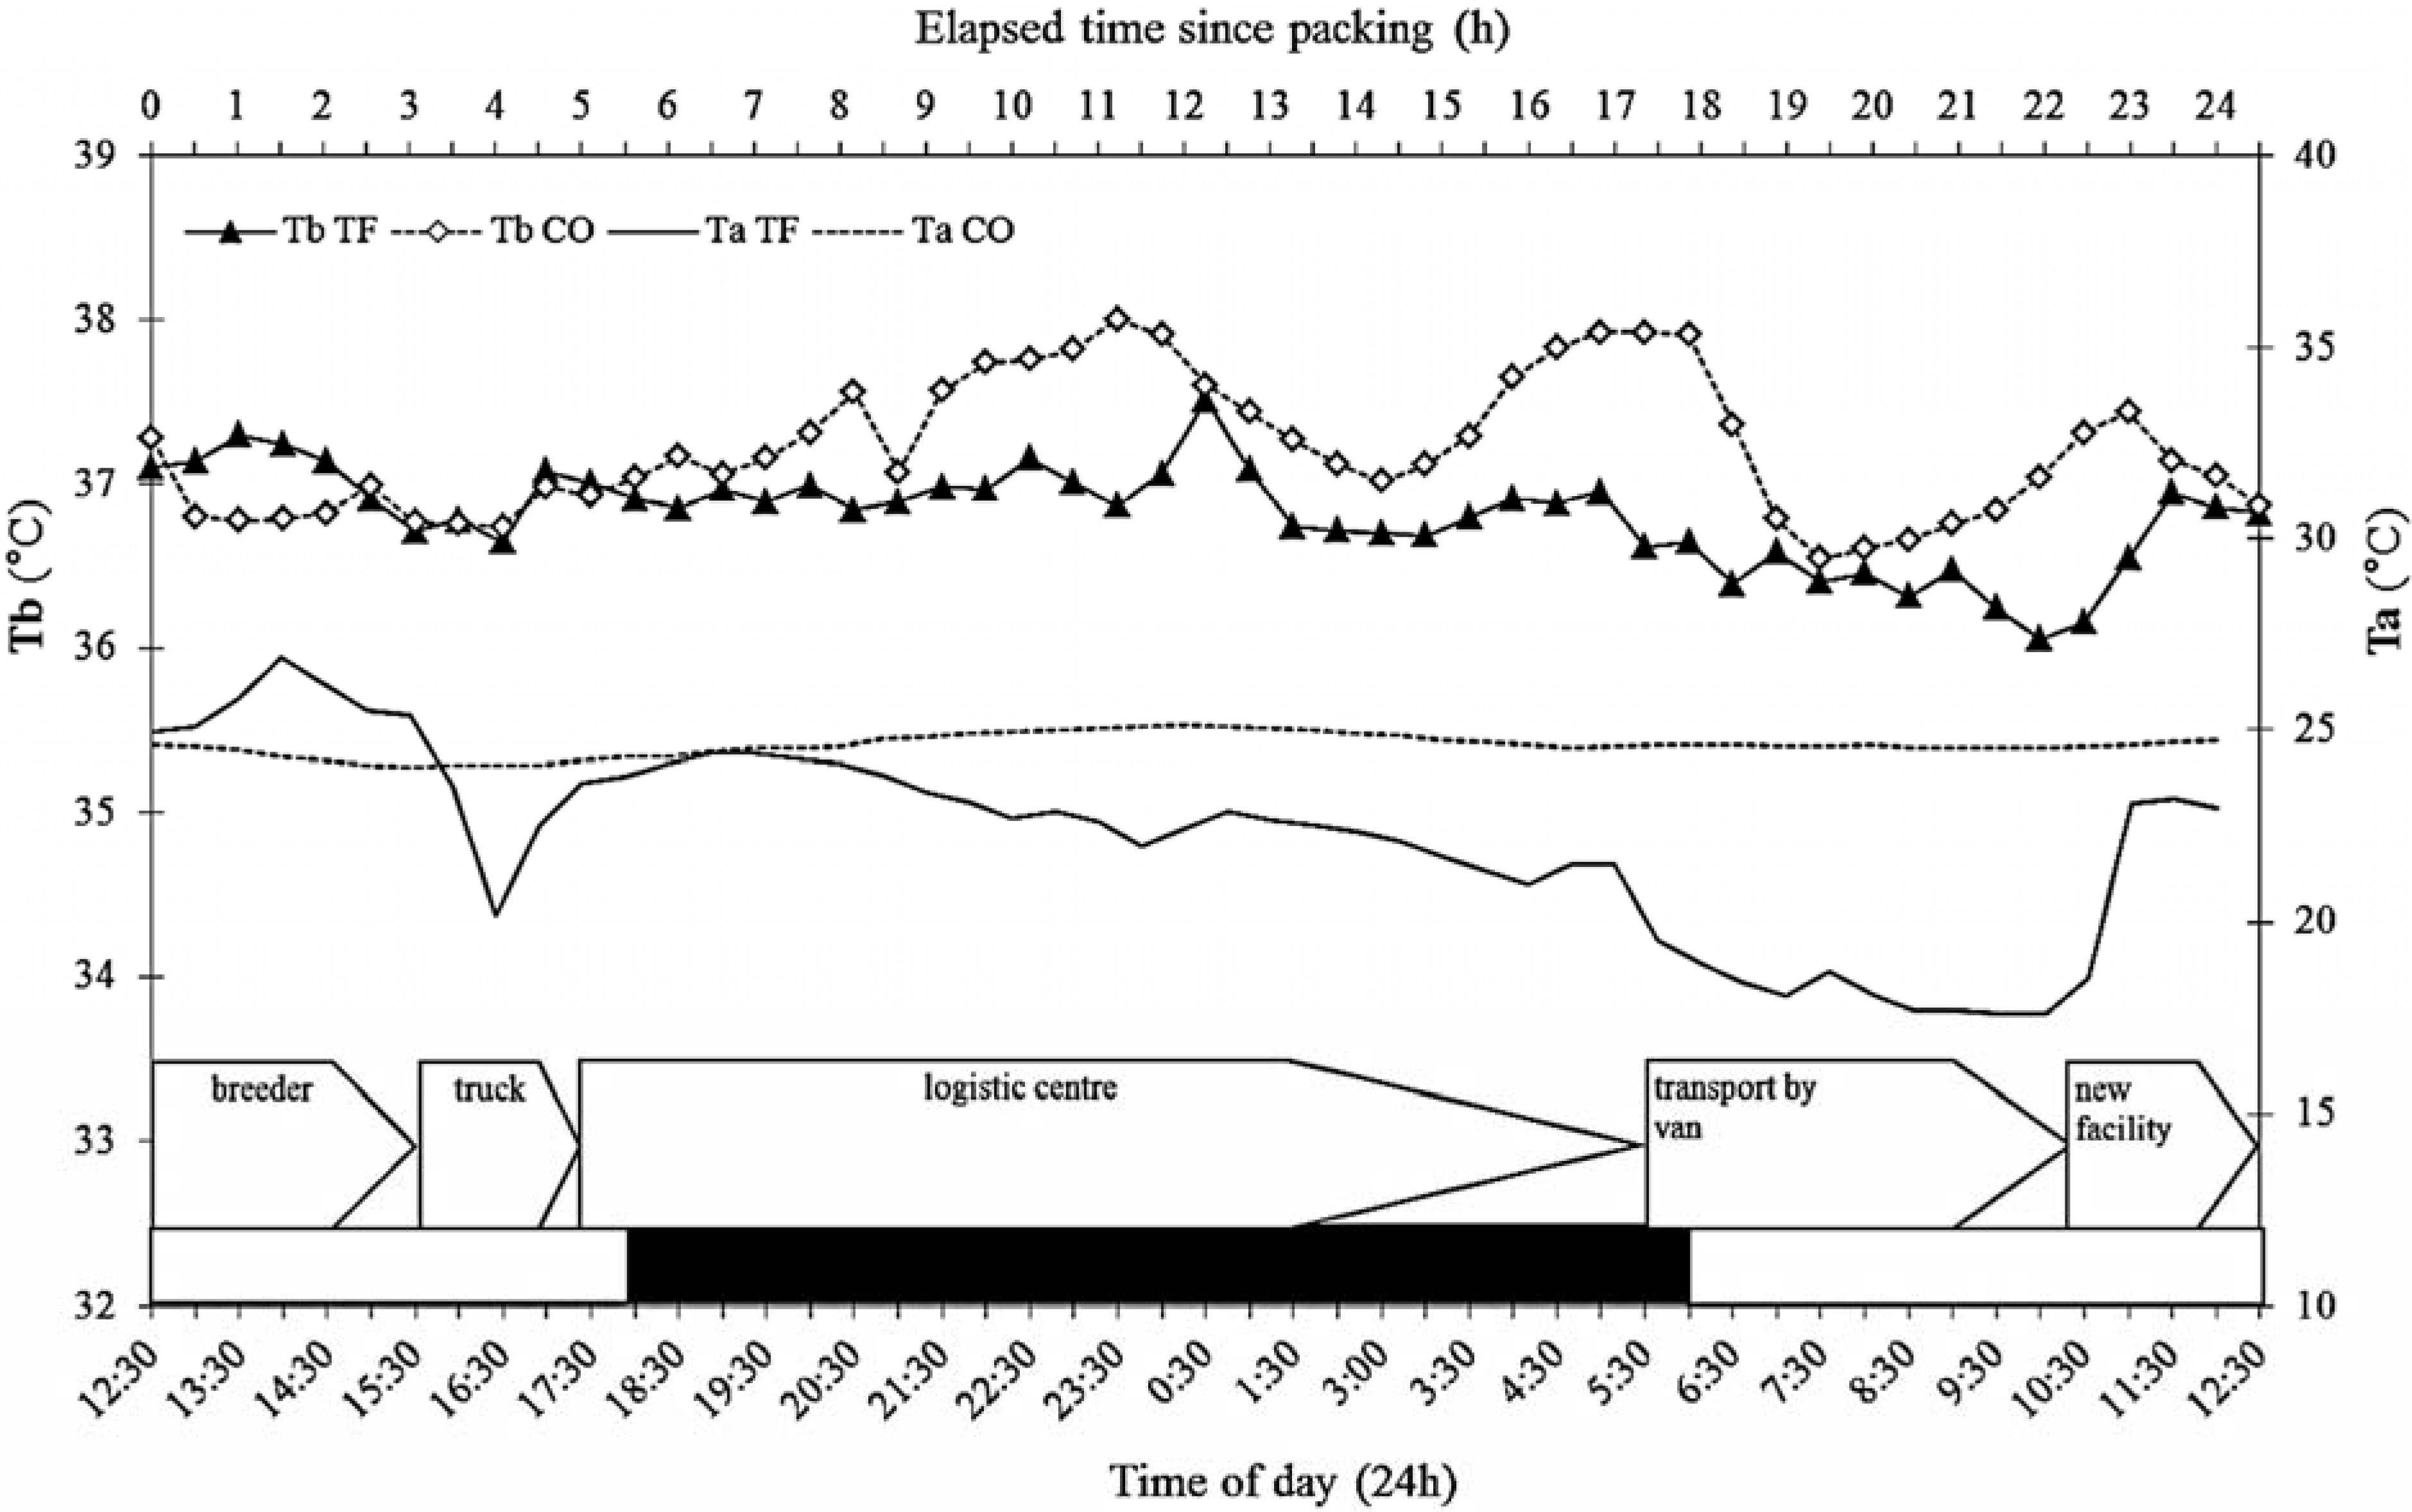
3.3. Body Temperature

3.4. Ambient Temperature

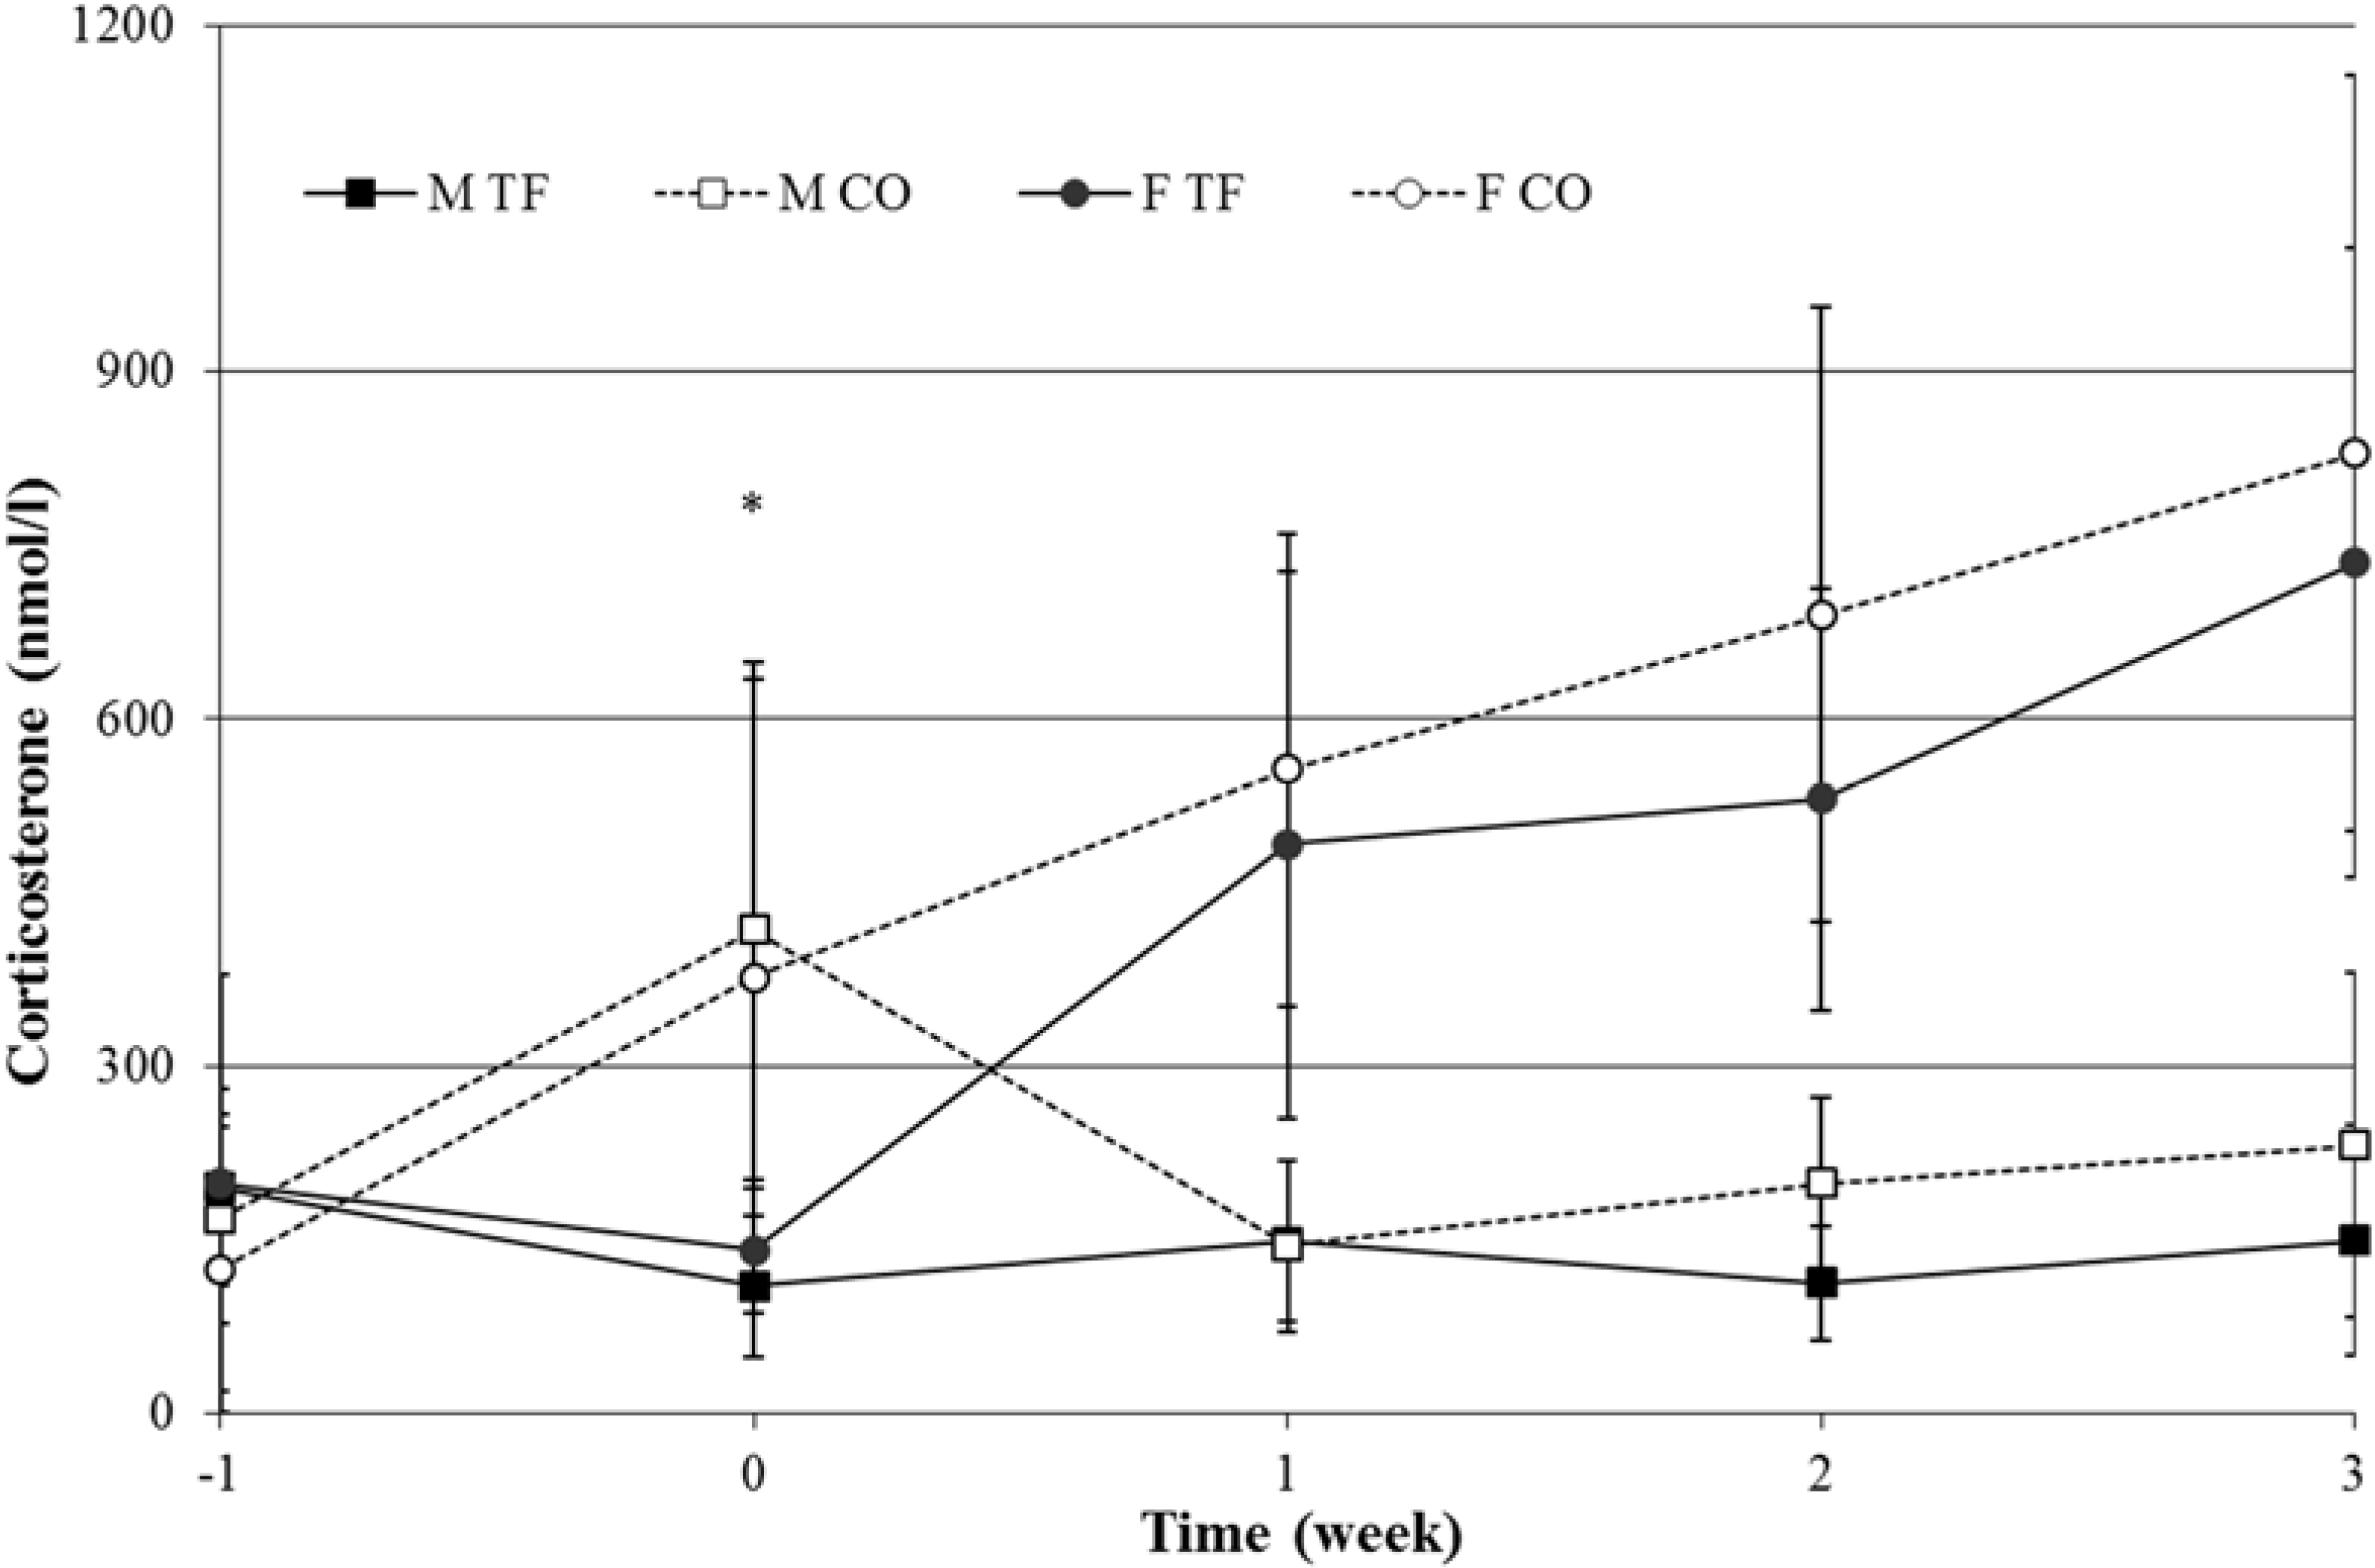
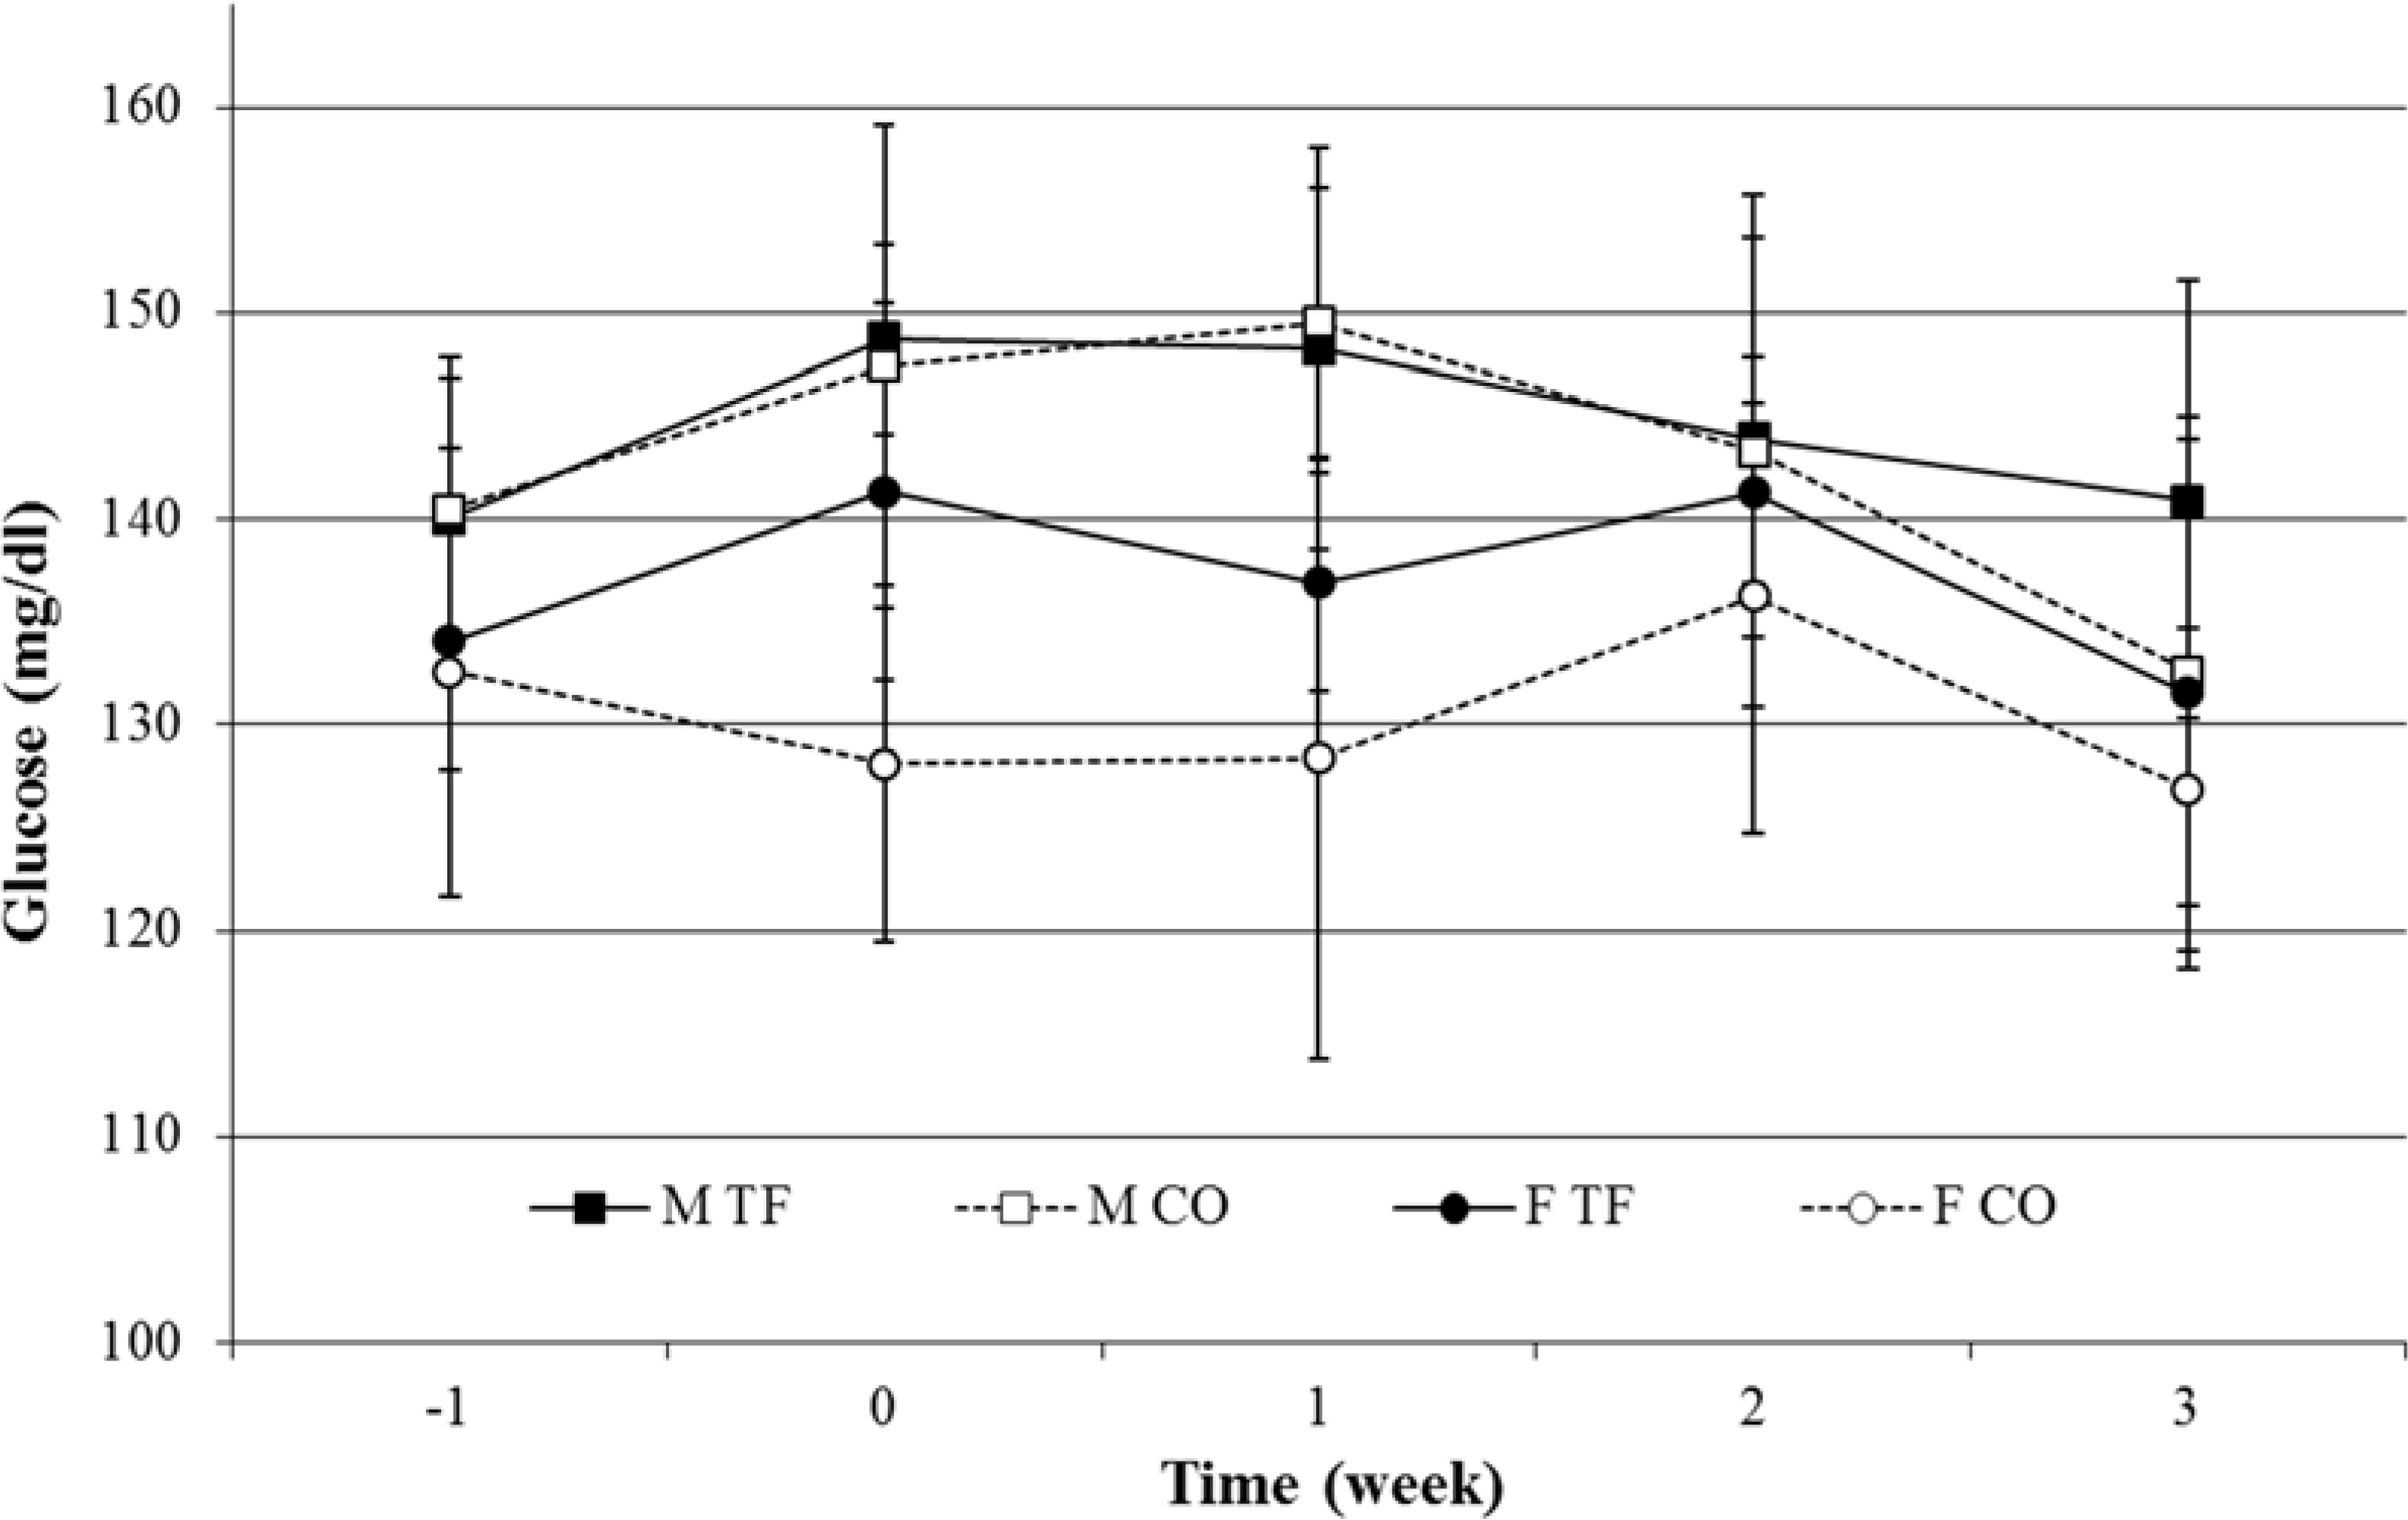
3.5. Blood Parameters
3.6. Behavior


| Effect | ACT | SOC | GROtot |
|---|---|---|---|
| Sex | F(32,32) = 5.73, p = 0.023 | NS | NS |
| Treatment | NS | NS | NS |
| Observation (time) | F(88,32) = 12.29, p < 0.001 | F(110,30) = 9.00, p < 0.001 | F(103,104) = 4.49, p = 0.005 |
| Sex x Treatment | NS | NS | NS |
| Sex x time | F(88,32) = 4.00, p = 0.005 | F(110,30) = 3.08, p = 0.019 | F(94,104) = 4.70, p = 0.002 |
| Treatment x time | NS | NS | NS |
| Sex x Treatment x time | F(90,32) = 2.35, p = 0.077 | F(110,30) = 2.46, p = 0.066 | NS |
| Obs | −1 | 0 | 1 | 2 | |||||||||
|---|---|---|---|---|---|---|---|---|---|---|---|---|---|
| sex | ACT | SOC | GRO | ACT | SOC | GRO | ACT | SOC | GRO | ACT | SOC | GRO | |
| 0 | F | NS | ↓0.003 | ↑<0.001 | |||||||||
| M | ↑0.043 | ↓0.052 | NS | ||||||||||
| 1 | F | NS | NS | NS | NS | ↑0.007 | ↓<0.001 | ||||||
| M | ↑<0.001 | ↓0.002 | ↑0.017 | NS | NS | NS | |||||||
| 2 | F | ↑0.002 | ↓0.011 | NS | ↑0.004 | NS | ↓<0.001 | ↑0.003 | ↓0.024 | NS | |||
| M | ↑<0.001 | ↓0.003 | ↑0.013 | NS | NS | NS | NS | NS | NS | ||||
| 3 | F | ↑<0.001 | ↓<0.001 | NS | ↑<0.001 | NS | ↓<0.001 | ↑<0.001 | ↓0.001 | NS | NS | NS | NS |
| M | ↑<0.001 | ↓0.001 | ↑0.004 | NS | NS | ↓0.056 | NS | NS | NS | NS | NS | NS | |
4. Discussion
5. Conclusions
Acknowledgments
Author Contributions
Appendix
| Behavior | Description | |
|---|---|---|
| Exploration | Animal is sniffing air, the sawdust or cage wall. Collection of behaviors like mobile exploration, sniffing, root/dig and gnaw/nibble, manipulating shelter. | state |
| Rearing during exploration is scored as rearing | ||
| Walk | Obvious forward movement of the animal, with as goal to bridge a distance. Is scored when more than two steps are made with the hind legs | state |
| Rest (lie&sit) | Resting behavior, lying, and sitting without sniffing or looking around in an alert state. | state |
| Eat | Taking in food | state |
| Shake | Shaking of the head or shaking the whole body | event |
| Scan | Horizontal rocking movement of the head, with the rest of the body still. If performed in a rearing posture this is scored as scan | state |
| Rear | Animal is exploring (sniffing, watching) with its fore paws lifted off the ground. Only standing on its hind legs, or supported by putting the forepaws on the cage wall. If an animal sits sniffing and lifts its forepaws off the ground, this is a rear (also if the animal does not stretch its body) | state |
| Hop/Jump | Hop: horizontal movement of the animal by little jumps | state |
| Jump: the animal jumps on the spot | event | |
| Freeze | Animal freezes and stops all movements | state |
| In shelter | Animal is (partially) in the shelter. If not visible in the shelter, this is still scored as shelter | state |
| Social exploration | Animal is sniffing/exploring cage mate | state |
| Follow/Chase | Animal is following/chasing a cage mate | state |
| Animal is being followed by a cage mate | state | |
| Push | Animal is pushing a cage mate with its nose or paw | event |
| Animal is being pushed by a cage mate | event | |
| Pin | Animal is pinning a cage mate on its back or side | state |
| Animal is being pinned by a cage mate | ||
| Often followed by social groom | state | |
| Social groom | Animal is licking a cage mate or nibbling the fur of a cage mate | state |
| Animal is being licked-nibbled by a cage mate | state | |
Conflicts of Interest
References
- Obernier, J.A.; Baldwin, R.L. Establishing an appropriate period of acclimatization following transportation of laboratory animals. ILAR J. 2006, 47, 364–369. [Google Scholar] [CrossRef] [PubMed]
- Arts, J.W.M.; Kramer, K.; Arndt, S.S.; Ohl, F. The impact of transportation on physiological and behavioral parameters in Wistar rats—Implications for acclimatization periods. ILAR J. 2012, 53, E82–E98. [Google Scholar] [CrossRef] [PubMed]
- McEwen, B.S. The neurobiology of stress: From serendipity to clinical relevance. Brain Res. 2000, 886, 172–189. [Google Scholar] [CrossRef] [PubMed]
- Olfe, J.; Domanska, G.; Schuett, C.; Kiank, C. Different stress-related phenotypes of BALB/c mice from in-house or vendor: Alterations of the sympathetic and HPA axis responsiveness. BMC Physiol. 2010, 10. [Google Scholar] [CrossRef] [PubMed]
- Conour, L.A.; Murray, K.A.; Brown, M.J. Preparation of animals for research—Issues to consider for rodents and rabbits. ILAR J. 2006, 47, 283–293. [Google Scholar] [CrossRef] [PubMed]
- Tuli, J.S.; Smith, J.A.; Morton, D.B. Stress measurements in mice after transportation. Lab. Anim. 1995, 29, 132–138. [Google Scholar] [CrossRef] [PubMed]
- Shim, S.; Lee, S.; Kim, C.; Kim, B.; Jee, S.; Lee, S.; Hwang, D. Effects of air transportation cause physiological and biochemical changes indicative of stress leading to regulation of chaperone expression levels and corticosterone concentration. Exp. Anim. Jpn. Assoc. Lab. Anim. Sci. 2009, 58, 11–17. [Google Scholar] [CrossRef]
- Tabata, H.; Kitamura, T.; Nagamatsu, N. Comparison of effects of restraint, cage transportation, anaesthesia and repeated bleeding on plasma glucose levels between mice and rats. Lab. Anim. 1998, 32, 143–148. [Google Scholar] [CrossRef] [PubMed]
- Stemkens-Sevens, S.; Berkel, K.V.; de Greeuw, I.; Snoeijer, B.; Kramer, K. The use of radiotelemetry to assess the time needed to acclimatize guinea pigs following several hours of ground transport. Lab. Anim. 2009, 43, 78–84. [Google Scholar] [CrossRef] [PubMed]
- Ruiven, R.V.; Meijer, G.W.; Wiersma, A.; Baumans, V.; van Zutphen, L.F.M.; Ritskes-Hoitinga, J. The influence of transportation stress on selected nutritional parameters to establish the necessary minimum period for adaptation in rat feeding studies. Lab. Anim. 1998, 32, 446–456. [Google Scholar] [CrossRef] [PubMed]
- Capdevila, S.; Giral, M.; Ruiz de la Torre, J.L.; Russell, R.J.; Kramer, K. Acclimatization of rats after ground transportation to a new animal facility. Lab. Anim. 2007, 41, 255–261. [Google Scholar] [CrossRef] [PubMed]
- Liste, M.G.; María, G.A.; García-Belenguer, S.; Chacón, G.; Gazzola, P.; Villarroel, M. The effect of transport time, season and position on the truck on stress response in rabbits. World Rabbit Sci. 2008, 16, 229–235. [Google Scholar]
- Baldwin, R.L.; Bhat, C.R.; Bouyer, D.H.; Dhabhar, F.S.; Leary, S.L.; McGlone, J.J.; Raemdonck, E.; Smith, J.L.; Swanson, J.C. Guidelines for the Humane Transportation of Research Animals; National Academies Press (US): Washington, DC, USA, 2006. [Google Scholar]
- Arts, J.W.M.; Kramer, K.; Arndt, S.S.; Ohl, F. Sex differences in physiological acclimatization after transfer in Wistar rats. Animals 2014, 4, 693–711. [Google Scholar] [CrossRef]
- Arts, J.W.M. Temperature Measurements during Transfer of BALB/c Mice; Internal Report; Harlan Laboratories B.V.: Venray, The Netherlands, 2009. [Google Scholar]
- Syversen, E.; Pineda, F.J.; Watson, J. Temperature variations recorded during interinstitutional air shipment of laboratory mice. J. Am. Assoc. Lab. Anim. Sci. 2008, 47, 31–36. [Google Scholar] [PubMed]
- Doi, K.; Kuroshima, A. Sexual difference in thermoregulatory ability of rats exposed to cold and heat. J. Therm. Biol. 1982, 7, 99–105. [Google Scholar]
- Gautier, H. Body temperature regulation in the rat. J. Therm. Biol. 2000, 25, 273–279. [Google Scholar] [CrossRef] [PubMed]
- Gordon, C.J. Thermal biology of the laboratory rat. Physiol. Behav. 1990, 47, 963–991. [Google Scholar] [CrossRef] [PubMed]
- Poole, S.; Stephenson, J.D. Body temperature regulation and thermoneutrality in rats. Q. J. Exp. Physiol. 1977, 62, 143–149. [Google Scholar] [PubMed]
- McGivern, R.F.; Zuloaga, D.G.; Handra, R.J. Sex differences in stress-induced hyperthermia in rats: Restraint versus confinement. Physiol. Behav. 2009, 98, 416–420. [Google Scholar] [CrossRef] [PubMed]
- Kramer, K.; van de Weerd, H.; Mulder, A.; Heijningen, C.V.; Baumans, V.; Remie, R.; van Zutphen, L.F.M. Effect of conditioning on the increase of heart rate and body temperature provoked by handling in the mouse. ATLA Altern. Lab. Anim. 2004, 32, S177–S181. [Google Scholar]
- Dallmann, R.; Steinlechner, S.; Horsten, S.V.; Karl, T. Stress-induced hyperthermia in the rat: Comparison of classical and novel recording methods. Lab. Anim. 2006, 40, 186–193. [Google Scholar] [CrossRef] [PubMed]
- Nakamori, T.; Morimoto, A.; Murakami, N. Effect of a central CRF antagonist on cardiovascular and thermoregulatory responses induced by stress or IL-1 beta. Am. J. Physiol. Regul. Integr. Comp. Physiol. 1993, 265, R834–R839. [Google Scholar]
- Guilhamou, R.; Boulamery, A.; DeLuca, B.; deTurmeny, E.; Bruguerolle, B. Effects of induced hyperthermia on pharmacokinetics of ropivacaine in rats. Fundam. Clin. Pharmacol. 2010, 24, 463–468. [Google Scholar] [CrossRef] [PubMed]
- Crandall, C.G.; González-Alonso, J. Cardiovascular function in the heat-stressed human. Acta Physiol. 2010, 199, 407–423. [Google Scholar] [CrossRef]
- Groenink, L.; van der Gugten, J.; Zethof, T.; van der Heyden, J.; Olivier, B. Stress-induced hyperthermia in mice: Hormonal correlates. Physiol. Behav. 1994, 56, 747–749. [Google Scholar] [CrossRef] [PubMed]
- Fluttert, M.; Dalm, S.; Oitzl, M.S. A refined method for sequential blood sampling by tail incision in rats. Lab. Anim. 2000, 34, 372–378. [Google Scholar] [CrossRef] [PubMed]
- Dubowski, K.M. An o-Toluidine method for body-fluid glucose determination. Clin. Chem. 1962, 8, 215–235. [Google Scholar] [PubMed]
- Burn, C.C.; Peters, A.G.; Mason, G.J. Acute effects of cage cleaning at different frequencies on laboratory rat behaviour and welfare. Anim. Welf. 2006, 15, 161–171. [Google Scholar]
- Saibaba, P.; Sales, G.D.; Stodulski, G.; Hau, J. Behaviour of rats in their home cages: Daytime variations and effects of routine husbandry procedures analysed by time sampling techniques. Lab. Anim. 1996, 30, 13–21. [Google Scholar] [CrossRef] [PubMed]
- Kalueff, A.V.; Tuohimaa, P. The grooming analysis algorithm discriminates between different levels of anxiety in rats: Potential utility for neurobehavioural stress research. J. Neurosci. Methods 2005, 143, 169–177. [Google Scholar] [CrossRef] [PubMed]
- Festing, M.F.W.; Altman, G.D. Guidelines for the design and statistical analysis of experiments using laboratory animals. ILAR J. 2002, 43, 244–258. [Google Scholar] [CrossRef] [PubMed]
- Fekedulegn, D.B.; Andrew, M.E.; Burchfiel, C.M.; Violanti, J.M.; Hartley, T.A.; Charles, L.E.; Miller, D.B. Area under the curve and other summary indicators of repeated waking cortisol measurements. Psychosom. Med. 2007, 69, 651–659. [Google Scholar] [CrossRef] [PubMed]
- Van der Heyden, J.A.M.; Zethof, T.J.J.; Olivier, B. Stress-induced hyperthermia in singly housed mice. Physiol. Behav. 1997, 62, 463–470. [Google Scholar] [CrossRef] [PubMed]
- Buttner, D.; Wollnik, F. Spontaneous short-term fluctuations in the daily pattern of heart rate, body temperature and locomotor activity in the laboratory rat. Lab. Anim. 1982, 16, 319–326. [Google Scholar] [CrossRef] [PubMed]
- Benstaali, C.; Mailloux, A.; Bogdan, A.; Auzeby, A.; Touitou, Y. Circadian rhythms of body temperature and motor activity in rodents—Their relationships with the light-dark cycle. Life Sci. 2001, 68, 2645–2656. [Google Scholar] [CrossRef] [PubMed]
- Refinetti, R.; Menaker, M. The circadian rhythm of body temperature. Physiol. Behav. 1992, 51, 613–637. [Google Scholar] [CrossRef] [PubMed]
- Verwer, C.M.; van Amerongen, G.; van den Bos, R.; Hendriksen, C.F.M. Handling effects on body weight and behaviour of group-housed male rabbits in a laboratory setting. Appl. Anim. Behav. Sci. 2009, 117, 93–102. [Google Scholar] [CrossRef]
- Mashoodh, R.; Wright, L.D.; Hébert, K.; Perrot-Sinal, T.S. Investigation of sex differences in behavioural, endocrine, and neural measures following repeated psychological stressor exposure. Behav. Brain Res. 2008, 188, 368–379. [Google Scholar] [PubMed]
- Goel, N.; Bale, T.L. Sex differences in the serotonergic influence on the hypothalamic-pituitary-adrenal stress axis. Endocrinology 2010, 151, 1784–1794. [Google Scholar] [CrossRef] [PubMed]
- Atkinson, H.; Waddell, B. Circadian variation in basal plasma corticosterone and adrenocorticotropin in the rat: Sexual dimorphism and changes across the estrous cycle. Endocrinology 1997, 138, 3842–3848. [Google Scholar] [PubMed]
- Windle, R.J.; Wood, S.A.; Shanks, N.; Lightman, S.L.; Ingram, C.D. Ultradian rhythm of basal corticosterone release in the female rat: Dynamic interaction with the response to acute stress. Endocrinology 1998, 139, 443–450. [Google Scholar] [PubMed]
- Figueiredo, H.; Dolgas, C.; Herman, J. Stress activation of cortex and hippocampus is modulated by sex and stage of estrus. Endocrinology 2002, 143, 2534–2540. [Google Scholar] [CrossRef] [PubMed]
- Sherwood, L.; Klandorf, H.; Yancey, P.H. Animal Physiology: From Genes to Organisms, Brooks/Cole; Cengage Learning: South Melbourne, Australia, 2005. [Google Scholar]
- De Boer, S.F.; Koopmans, S.J.; Slangen, J.L.; Gugten, J.V.D. Plasma catecholamine, corticosterone and glucose responses to repeated stress in rats: Effect of interstressor interval length. Physiol. Behav. 1990, 47, 1117–1124. [Google Scholar] [CrossRef] [PubMed]
- Van Zutphen, L.F.; Baumans, V.; Beynen, A.C. Principles of Laboratory Animal Science, revised ed.; Elsevier: Amsterdam, The Netherlands, 2001. [Google Scholar]
© 2014 by the authors; licensee MDPI, Basel, Switzerland. This article is an open access article distributed under the terms and conditions of the Creative Commons Attribution license (http://creativecommons.org/licenses/by/4.0/).
Share and Cite
Arts, J.W.M.; Oosterhuis, N.R.; Kramer, K.; Ohl, F. Effects of Transfer from Breeding to Research Facility on the Welfare of Rats. Animals 2014, 4, 712-728. https://doi.org/10.3390/ani4040712
Arts JWM, Oosterhuis NR, Kramer K, Ohl F. Effects of Transfer from Breeding to Research Facility on the Welfare of Rats. Animals. 2014; 4(4):712-728. https://doi.org/10.3390/ani4040712
Chicago/Turabian StyleArts, Johanna W. M., Nynke R. Oosterhuis, Klaas Kramer, and Frauke Ohl. 2014. "Effects of Transfer from Breeding to Research Facility on the Welfare of Rats" Animals 4, no. 4: 712-728. https://doi.org/10.3390/ani4040712