Article

Transcriptomics in Rare Minnow (Gobiocypris rarus) towards Attenuated and Virulent Grass Carp Reovirus Genotype II Infection

1
Yangtze River Fisheries Research Institute, Chinese Academy of Fishery Sciences, Wuhan 430223, China
2
National Demonstration Center for Experimental Fisheries Science Education, Shanghai Ocean University, Shanghai 201306, China
*
Author to whom correspondence should be addressed.
Animals 2023, 13(11), 1870; https://doi.org/10.3390/ani13111870
Submission received: 21 April 2023 / Revised: 31 May 2023 / Accepted: 2 June 2023 / Published: 4 June 2023
(This article belongs to the Special Issue Aquatic Animal Virus, Disease and Immunity)

Abstract

:

Simple Summary

Grass carp reovirus genotype Ⅱ (GCRV Ⅱ) is the leading cause of death in grass carp. To investigate the involved molecular responses against the GCRV Ⅱ infection, we performed comparative transcriptomic analysis in the spleen and liver of rare minnow injected with virulent and attenuated strains. Results showed that the virulent strain infection especially induced tissue-specific alteration and caused severe suppression of hemorrhage related pathways in spleen. Our finding provides new insights on the interactions between host and GCRV Ⅱ.

Abstract

Grass carp reovirus genotype Ⅱ (GCRV Ⅱ) causes a variety of fish hemorrhagic disease, which seriously affects the sustainable development of grass carp aquaculture in China. Rare minnow (Gobiocypris rarus) is an ideal model fish to study the pathogenesis of GCRV Ⅱ. To investigate the involved molecular responses against the GCRV Ⅱ infection, we performed comparative transcriptomic analysis in the spleen and liver of rare minnow injected with virulent strain DY197 and attenuated strain QJ205. Results showed that the virulent DY197 strain induced more differently expressed genes (DEGs) than the attenuated QJ205 strain, and tissue-specific responses were induced. In the spleen, the attenuated and virulent strains induced different DEGs; the attenuated QJ205 infection activated steroid synthesis pathway that involved in membrane formation; however, virulent DY197 infection activated innate immunity and apoptosis related pathways while suppressing cell proliferation and migration related pathways that are important for damage tissue repair, as well as hemorrhage related pathways. In the liver, the attenuated and virulent strains infection induced similar DEGs; both strains infection activated immunity and apoptosis related pathways but suppressed metabolism-related pathways; virulent DY197 infection especially activated protein digestion and absorption-related pathways and suppressed steroid synthesis pathway. To conclude, virulent strain infection especially induced tissue-specific alterations and caused severe suppression of hemorrhage-related pathways in spleen. Our findings will contribute to better understanding of the interactions between host and GCRV II.

1. Introduction

Grass carp reovirus (GCRV) is a double-stranded RNA (dsRNA) virus belonging to the genus Aquareovirus of the family Reoviridae [1]. GCRV infects a variety of fish and caused serious hemorrhage disease, resulting in huge economic losses to the aquaculture industry in China [2,3]. According to the VP6 protein sequence of GCRV, the known GCRV isolates were classified into three genotypes (Ⅰ–Ⅲ), and the sequence similarity between different genotypes was less than 20% [4,5]. A preliminary epidemiological analysis and detection of grass carp hemorrhagic disease fish collected from 2015 to 2017 in China showed that the positive rate of GCRV Ⅱ was as high as 89.8% [6], indicating that GCRV Ⅱ was the most common etiological agent of grass carp hemorrhagic disease. The mortality rates of grass carp caused by different GCRV Ⅱ strains were different. For example, the mortality rates of grass carp infected with HZ08, 109, and HuNan1307 strains were 30%, 80%, and 100%, respectively [7,8]. Investigating the pathogenic mechanism of GCRV Ⅱ is of great significance to improve the prevention and control of grass carp hemorrhagic diseases.
The rare minnow (Gobiocypris rarus) is a small cyprinid species endemic to China, with a total length of 3–6 cm and a short reproductive cycle. It is widely used in studies of ecotoxicology fields as a model fish [9]. In addition, rare minnow has been demonstrated to be sensitive to GCRV Ⅱ, making it an ideal model fish for research of GCRV Ⅱ pathogenesis [10,11]. In teleosts, the spleen is a primary hematopoietic and peripheral lymphoid organ [12] and is mainly responsible for microorganism defense, antigen presentation, and the start of adaptive immune responses [13,14]. The liver of teleosts serves as an important immune organ by housing numerous immune cell populations in addition to its functions in metabolism and the storing of nutrients [15]. Moreover, previous studies have shown that the liver and spleen are among the most severely infected tissues of grass carp and rare minnow [11,16,17,18].
Transcriptomic analysis can provide a comprehensive understanding of the intricate biological processes of fish response against infection at the transcriptome level [19,20]. With the rapid development of next-generation sequencing technology, a growing number of fish infectious diseases studies have been conducted using transcriptomics technology. For example, studies of Atlantic salmon infected with viruses [21], crucian carp and tilapia infected with bacteria [22,23], and large yellow croaker infected with parasites [24] have been reported. There are also several transcriptome studies conducted on GCRV-infected grass carp and rare minnow. He et al. [3] analyzed the kidney transcriptome of grass carp infected with GCRV Ⅰ and GCRV Ⅱ and found that mRNA expression of metabolism-related genes was downregulated and mRNA expression of immune-related genes was upregulated on the 5th day after GCRV Ⅱ infection, and the complement and coagulation cascade was the most enriched pathway. Chen et al. [25] studied the transcriptome of grass carp kidney cells (Ctenopharyngodon idellus kidney, CIK) infected with GCRV. It was found that there were three stages of infection: in the early stage (0–8 h), differentially expressed genes (DEGs) were mainly related to viral adhesion; in the middle stage (8–24 h), DEGs were mainly related to viral phagocytosis and transmission; in the late stage (24–72 h), DEGs were mainly concentrated in steroid metabolism that is important for membrane formation and apoptosis that involved in cell lysis. Lin et al. [26] studied the transcriptome of rare minnow infected with genotype Ⅱ virus GCRV-HZ08; when they compared it with the transcriptome of grass carp infected with GCRV-HZ08, they found that the responses of the two species were similar. Based on the above research results, GCRV Ⅱ infection may lead to host innate immune activation, metabolic dysfunction, and coagulation system disorders. However, the transcriptomic responses to virulent and attenuated GCRV Ⅱ infection have not been reported, as well as the difference in response between tissues has not been paid much attention in previous studies.
In the previous study, the experiments of mortality statistics, viral load measurement, and histological examination were conducted on rare minnow after attenuated GCRV Ⅱ isolate QJ205 and virulent GCRV Ⅱ isolate DY197 infection. The infection of QJ205 caused slightly muscular hemorrhage symptoms and 5% mortality in rare minnow, associated with low virus copy numbers and no obvious pathological changes in the spleen and liver. In contrast, DY197 infection led to severe muscular hemorrhage symptoms and 95% mortality in rare minnow, as well as approximately 100-fold virus copy numbers of those infected with attenuated QJ205 and severe cell necrosis in the spleen and liver [27]. To further dissect the virulence-specific and tissue-specific molecular mechanism, in the present study, we performed comparative transcriptome analysis in the spleen and liver of rare minnow after virulent and attenuated isolate infection. These results would undoubtedly help us to better understand the pathogenesis and host–pathogen interaction of GCRV Ⅱ infection.

2. Materials and Methods

2.1. Experimental Fish

Approximately 1500 healthy rare minnows weighing 1–1.5 g and measuring 4–4.5 cm were acquired from the Institute of Hydrobiology, Chinese Academy of Sciences (Wuhan, China). The fish were raised in a 500 L tank with a flow-through system and plenty of aeration at 28 °C prior to the experiment. The water was replaced every day, and the fish were fed twice daily. After ten days, if there were no abnormal symptoms, the virus challenge experiment was carried out.

2.2. Virus

The attenuated strain (GCRV-QJ205) and the virulent strain (GCRV-DY197) of GCRV Ⅱ were isolated from diseased grass carp that had been collected from the cities of Qianjiang in Hubei province and Deyang in Sichuan province, respectively. The spleens and livers of diseased grass carp were homogenized with a 5-fold amount of phosphate-buffered saline (PBS), and three freeze–thaw cycles at −80 °C were performed to isolate the virus. The tissue homogenate was then centrifuged for 30 min at 2880× g. The filtrate from the supernatant was diluted to a titer of 1 × 10⁶ RNA copies/L for the subsequent viral challenge experiment after being filtered through a 0.22 μm Millipore filter (Millipore, Billerica, MA, USA).

2.3. Virus Infection and Sample Collecting

Rare minnows were divided into three groups at random and given intraperitoneal injections of PBS (as a control group), QJ205, and DY197 at doses of 10 μL (1 × 10⁶ RNA copies/μL) for each fish. The samples (livers and spleens) of 480 and 9 fish from each group were collected at 5 days post-infection (dpi) and split into three parts as biological replicates for transcriptome sequencing and quantitative real-time PCR (qPCR) validation, respectively. The spleens and livers of the control, QJ205, and DY197 groups were designated as control-spleen (C-S), attenuated-spleen (A-S), virulent-spleen (V-S), control-liver (C-L), attenuated-liver (A-L), and virulent-liver (V-L), respectively.

2.4. RNA Extraction, cDNA Library Construction, and Sequencing

Using the Trizol reagent kit (Invitrogen, Carlsbad, CA, USA), the total RNAs were extracted from the spleen and liver samples in accordance with the manufacturer’s instructions. After the total RNA was isolated, Oligo(dT) beads were used to enrich mRNA. The short fragments created by using fragmentation buffer to break up the enriched mRNA were then reverse transcribed into complementary DNA (cDNA) using random primers. The second-strand cDNA fragments were then repaired at the terminal, A base was added and connected to the Illumina sequencing adapters. Agarose gel electrophoresis was used to size-select the ligation products, followed by PCR amplification and Illumina NovaSeq 6000 sequencing.

2.5. De Novo Assembly and Annotation

To get high-quality clean reads, the raw reads were further filtered by fastp (version 0.18.0). The parameters were as follows:
(1)
removing reads containing adapters;
(2)
removing reads containing more than 10% of unknown nucleotides (N);
(3)
removing low-quality reads containing more than 50% of low-quality (Q-value ≤ 20) bases.
Subsequently, using the default settings in Trinity software [28], clean reads were de novo assembled and then were mapped back to the National Center for Biotechnology Information (NCBI) to remove GCRV Ⅱ contamination using the program Blast. Each cluster’s longest RNA was designated as a unigene. To annotate the unigenes, we used BLASTx software (http://www.ncbi.nlm.nih.gov/BLAST/, accessed on 1 June 2022) with an E-value threshold of 1 × 10⁻⁵ to NCBI non-redundant protein (Nr) database (http://www.ncbi.nlm.nih.gov, accessed on 1 June 2022), the COG/KOG database (http://www.ncbi.nlm.nih.gov/COG, accessed on 1 June 2022), the Kyoto Encyclopedia of Genes and Genomes (KEGG) database (http://www.genome.jp/kegg, accessed on 1 June 2022), and the Swiss-Prot protein database (http://www.expasy.ch/sprot, accessed on 1 June 2022).

2.6. Gene Expression Analysis and Enrichment Analysis

Gene expression levels were firstly estimated by mapping clean reads from each library back to the transcriptome assembly using Bowtie2 software [29] and then calculated read counts and normalized as FPKM (Fragments Per Kilobase of transcript per Millions mapped reads) values for each sample using RSEM software [30]. The DESeq R package [31] was used to carry out the differential analysis, and p-values were modified using Benjamini-Hochberg’s method. Finally, DEGs were designated as genes with an absolute value of log2 (Fold change) greater than 1 and an adjusted p-value less than 0.05. Then DEGs were enriched and analyzed with Gene Ontology (GO) term and KEGG pathway.

2.7. Validation of DEGs by RT-qPCR

Eight DEGs that were significantly differentially expressed in at least one isolate-infected group in each tissue were selected for the quantitative reverse transcript PCR (RT-qPCR) validation. As mentioned above, total RNA was extracted from spleen and liver tissue samples. The manufacturer’s instructions were followed to produce cDNA from the total RNA using a PrimeScript RT reagent Perfect Real Time Kit (TaKaRa, Dalian, China). Then, the reaction of qPCR was performed and analysed using a Rotor-Gene Q Series Software 1.7 supplied with the instrument (QIAGEN, Hilden, German). An amount of 10 μL of TB Green Premix Ex Taq Ⅱ (TaKaRa, Dalian, China), 2 μL of the cDNA sample, 0.8 μL (10 μM) of each primer, and ddH2O in a total volume of 20 μL made up the reaction mixtures. The reactions were amplified for 30 s at 95 °C, followed by 40 cycles of 95 °C for 10 s, 60 °C for 15 s, and 72 °C for 20 s.
Primer sequences of eight DEGs were listed in Table 1. For normalization of gene expression, β-actin gene was used as an internal control. Primers had a Tm of roughly 60 °C, and PCR products ranged in length from 100 to 200 bp. qPCR was conducted three times for each sample as technique replicates.

3. Results

3.1. Transcriptome Sequencing, De Novo Assembly, and Annotation

Transcriptomic sequencing generated totally 783 million raw reads from 18 libraries, which were deposited in the Sequence Read Archive (SRA) at the NCBI repository (accession number: PRJNA954066). After quality-filter analysis, 780 million clean reads were produced and de novo assembled into a total of 62,638 unigenes with an N50 length of 2385 bp (Table S1). All libraries gave Q20 ≥ 97%, Q30 ≥ 92%, and mapped percent ≥ 85% (Table S2). All unigenes were functionally annotated using four public databases, including Nr, Swiss-Prot, GO, and KEGG, for the assembled reference transcriptome. The results showed that 48.27% of unigenes were annotated by at least one of public database (Table S3). The Nr annotation demonstrated that 51.67% of unigenes in rare minnow liver and spleen could be annotated in the database of Pimephales promelas and Anabarilius grahami (Figure S1).

3.2. Identification and Enrichment of Differentially Expressed Genes

The PCA score plots showed good repeatability of the data, as the liver and spleen data sets were separated, while the same data set was clustered together (Figure 1A). These results demonstrated the sequencing data had high quality and was suitable for further investigation. To determine DEGs involved in response to GCRV Ⅱ infection in liver and spleen tissues of rare minnow, pairwise comparison for differential expression analysis was performed. In the spleen, compared with the control group, 145 DEGs (135 upregulated and 10 downregulated) were identified in the attenuated QJ205 infection group and 1461 DEGs (614 upregulated and 847 downregulated) in the virulent DY197 infection group (Figure 1B). In the liver, 227 DEGs (134 upregulated and 93 downregulated) were identified in the QJ205 infection group and 1461 DEGs (976 upregulated and 249 downregulated) in the DY197 infection group compared with the control group (Figure 1B). In both tissues, the virulent DY197 induced more DEGs than the attenuated QJ205, indicating the response to the infection of rare minnow was positively correlated with the virulence of GCRV Ⅱ. In the spleen, only six upregulated genes and seven downregulated genes were shared between the virulent and attenuated groups, indicating that the virulent and attenuated strain infection induced different responses (Figure 1C). In the liver, a total of 103 upregulated genes and 46 downregulated genes were shared in the virulent and attenuated strain infection groups, indicating that the virulent and attenuated strain infection induced similar responses in the liver (Figure 1C).

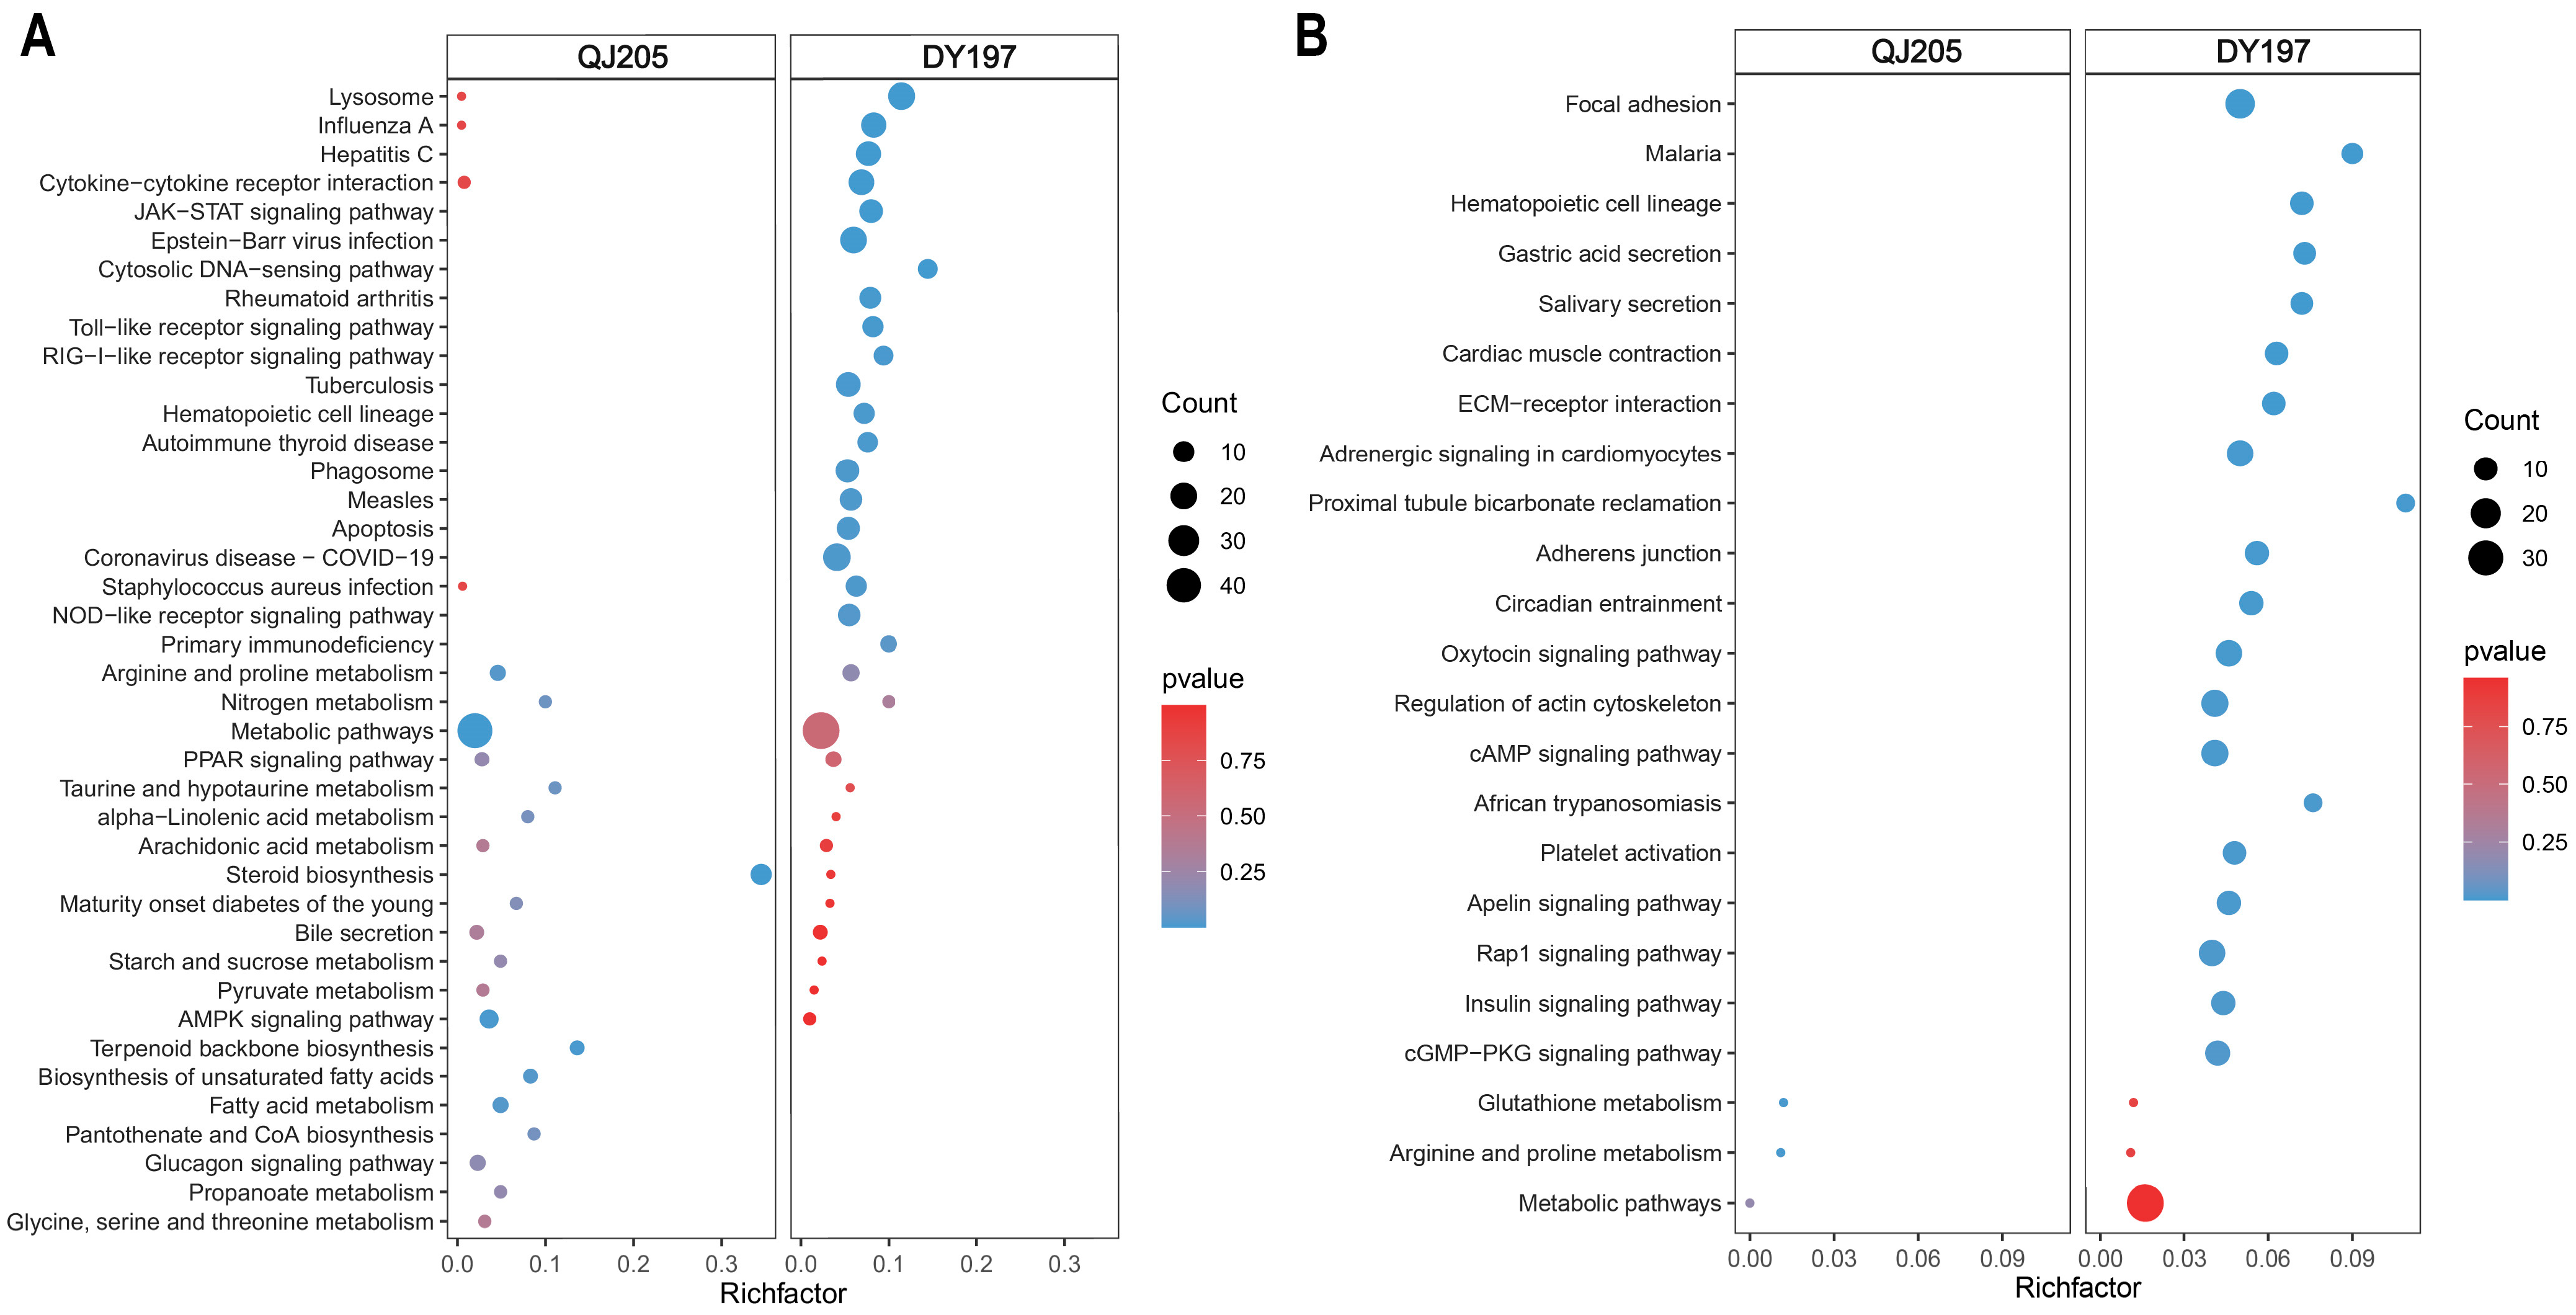
3.3. Enrichment Analysis of Differentially Expressed Genes in Spleen

In the spleen, KEGG enrichment analysis (Figure 2) showed different pathways were induced in both infected groups. Among the upregulated pathways, innate immunity-related pathways, such as RIG-Ⅰ, TOLL, Nod-like receptor signaling pathways, JAK-STAT signaling pathway, lysosome, phagosome, and apoptosis, were significantly enriched in the virulent DY197 infection group. Lipid metabolic pathways, such as steroid metabolism, biosynthesis of unsaturated fatty acid, and fatty acid metabolism, were significantly enriched in the attenuated QJ205 infection group. In the downregulated pathways, cell migration and proliferation-related pathways such as focal adhesion, extracellular matrix receptor interaction (ECM-receptor interaction), regulation of actin cytoskeleton pathways, adaptive immunity-related pathways such as hematopoietic cell lineage, T cell receptor signaling pathway, and hemorrhage-related pathways such as malaria and platelet activation were significantly enriched in the DY197 infection group. In addition, as shown in Table 2, the expression levels of DEGs in these pathways changed more significantly in the virulent DY197 infection group.

3.4. Enrichment Analysis of Differentially Expressed Genes in Liver

In the liver, KEGG enrichment analysis (Figure 3) showed that similar pathways were induced in both infected groups. Immunity pathways and protein digestion and absorption pathway were significantly activated after both strains of infection; the proteasome pathway was only significantly enriched in the virulent DY197 infection group; while metabolic pathways were inhibited, and the steroid synthesis pathway was only enriched in the virulent DY197 infection group. As shown in Table 3, virulent DY197 infection not only induced more DEGs but also induced greater changes in the expression level of DEGs.

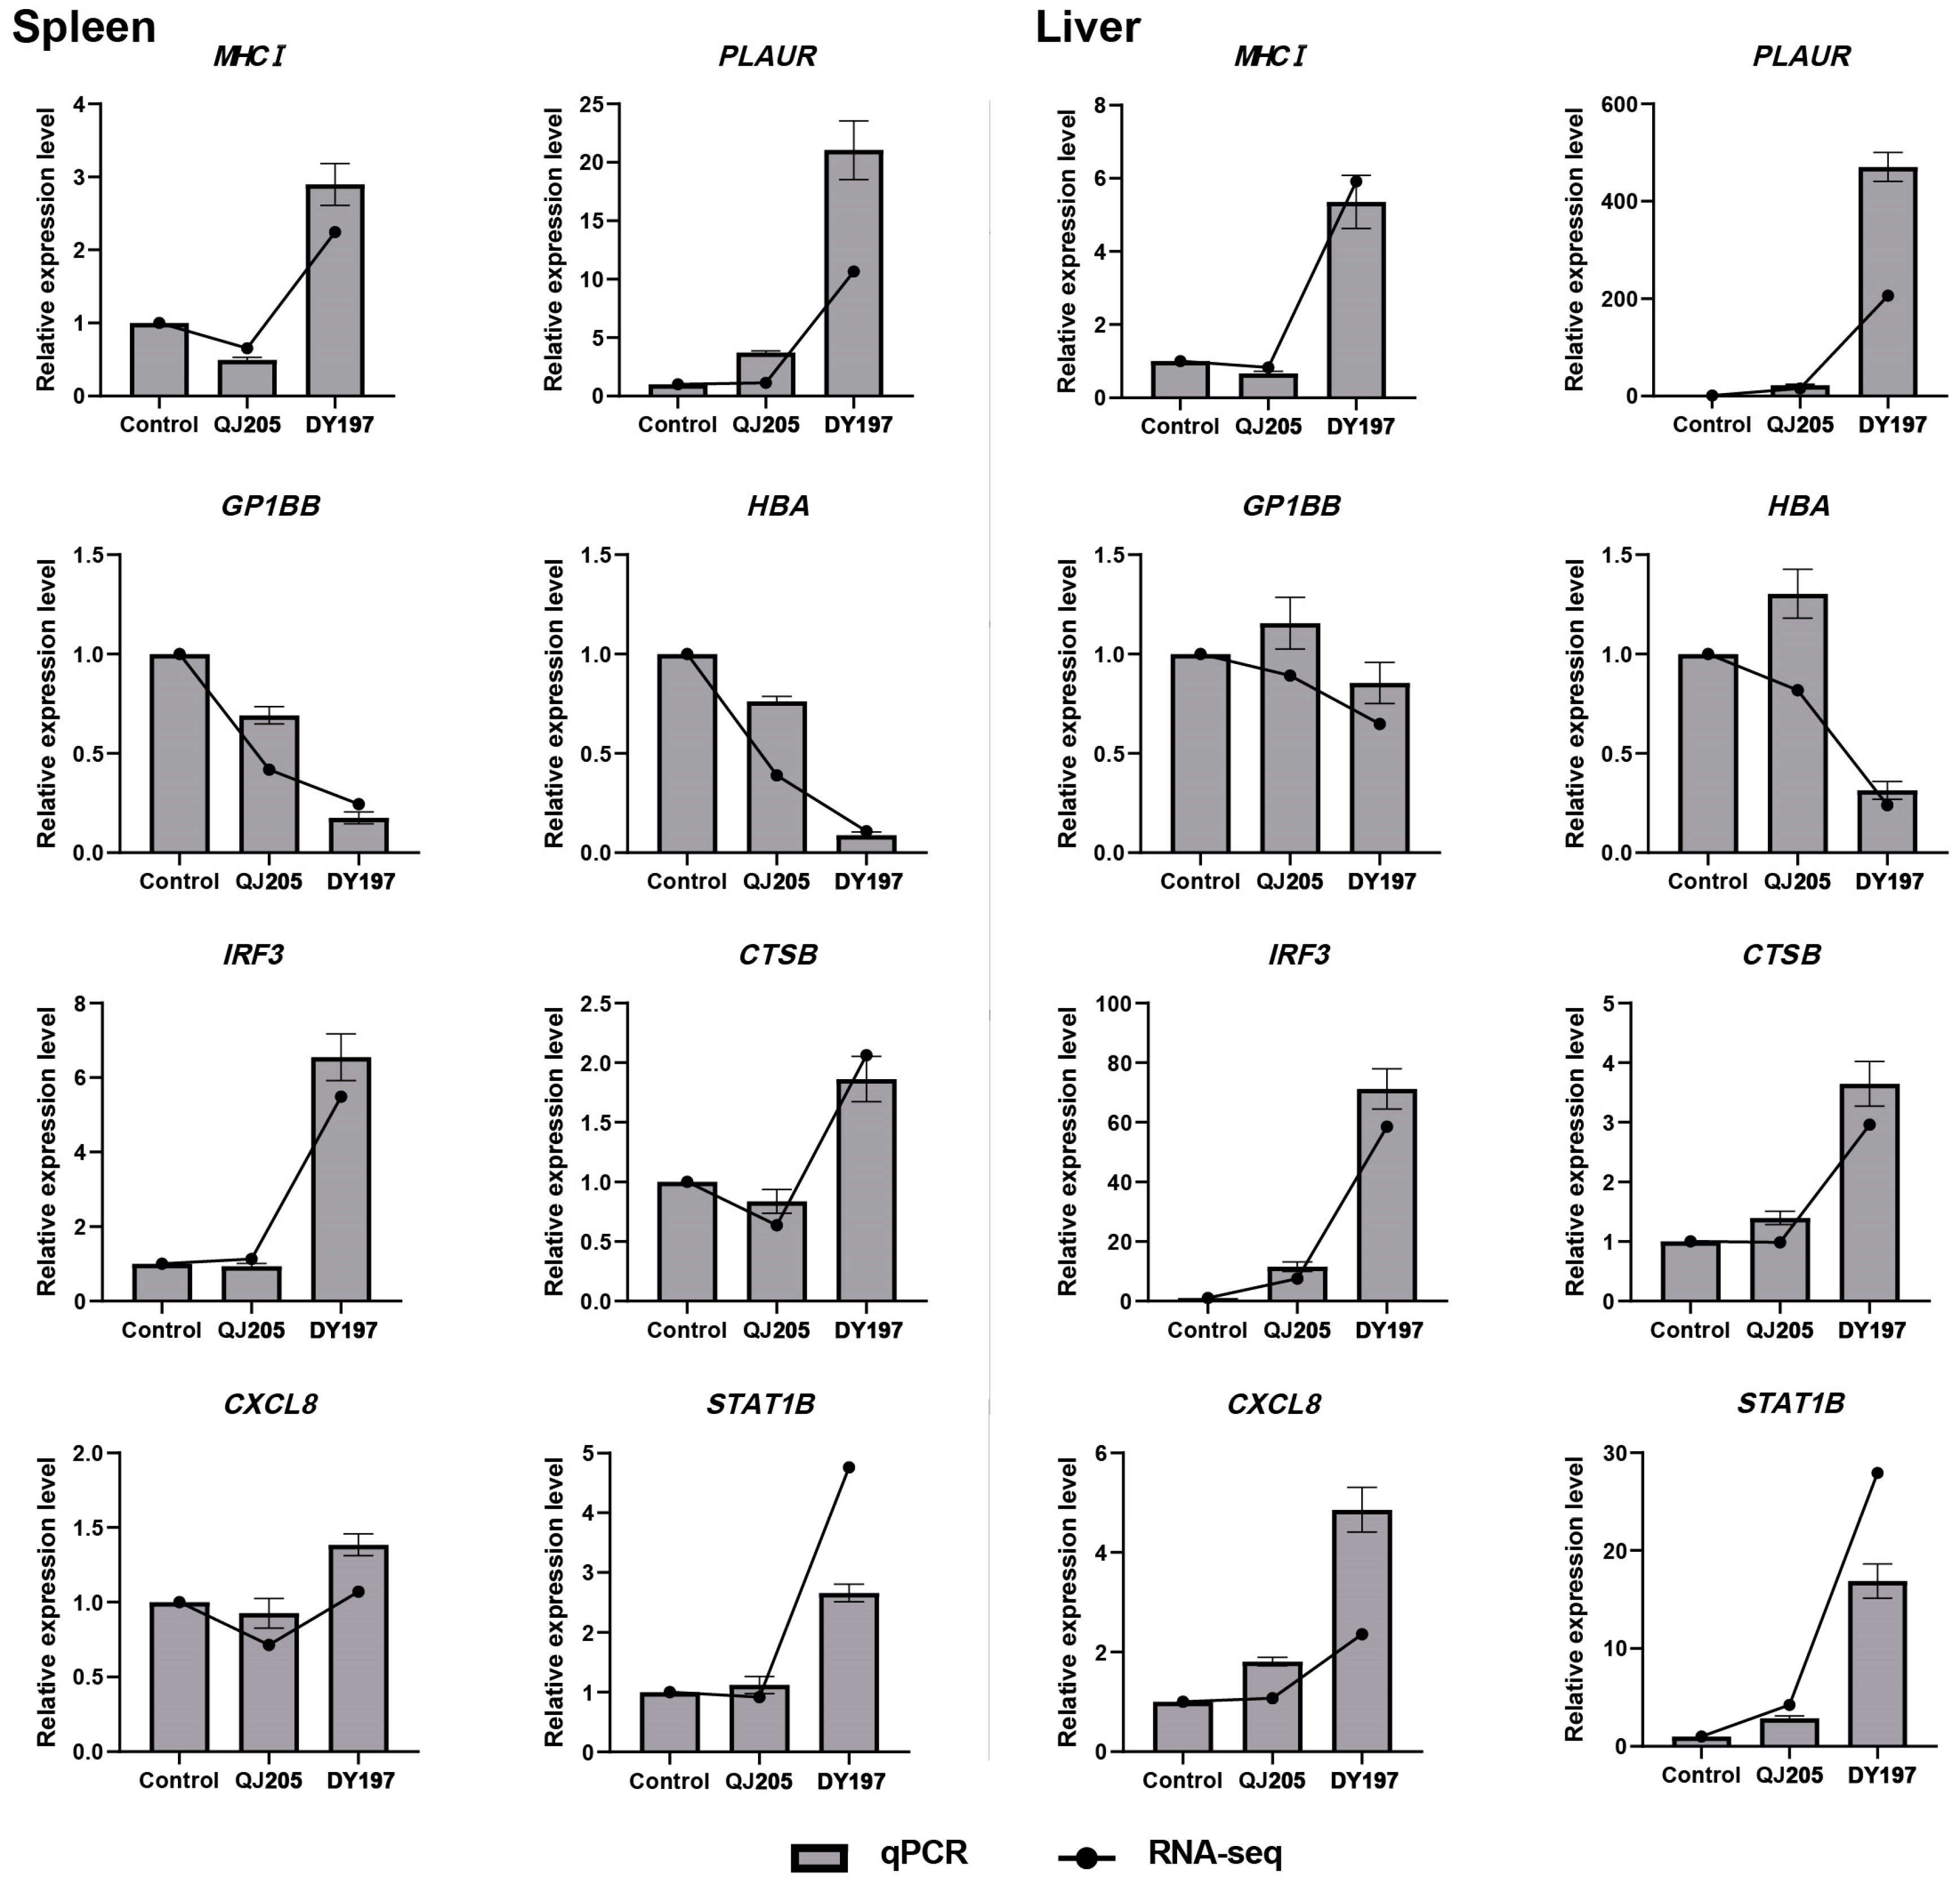
3.5. Validation of Differentially Expressed Genes by qPCR

Eight DEGs involved in the immune-related pathways, lysosome pathway, and hemorrhage-related pathways were selected for qPCR validation. These eight DEGs included MHC class I antigen (MHCI), interferon regulatory factor 3 (IRF3), C-X-C motif chemokine 8 (CXCL8), signal transducer and activator of transcription 1b (STAT1B), cathepsin B (CTSB), urokinase plasminogen activator surface receptor (PLAUR), hemoglobin subunit alpha (HBA), and platelet glycoprotein Ib beta chain (GP1BB). As shown in Figure 4, qPCR expression trends of these eight DEGs were consistent with transcriptome results, which confirmed the accuracy and reliability of RNA-seq results.

4. Discussion

GCRV Ⅱ causes severe hemorrhagic disease in grass carp and affects the aquaculture industry in China. Previous studies have demonstrated that GCRV Ⅱ infection induced innate immunity activation, metabolic dysfunction, and coagulation disorder. However, the underlying virulence-specific and tissue-specific pathogenesis of GCRV Ⅱ infection remains to be further studied. For this reason, we performed a comparative transcriptomic analysis in the spleen and liver of rare minnow injected with virulent isolate DY197 and attenuated isolate QJ205 to investigate the possible involved molecular responses against the GCRV Ⅱ infection. The results showed the number of DEGs was positively correlated with the virulence of GCRV Ⅱ. In the spleen, compared with attenuated QJ205 infection, virulent DY197 infection activated innate immunity and apoptosis-related pathways but suppressed adaptive immunity, cell proliferation and migration, and hemorrhage-related pathways. In the liver, except innate immunity and apoptosis-related pathways, virulent DY197 infection especially activated protein digestion and absorption-related pathways, both innate and adaptive immunity-related pathways, and cell migration and proliferation-related pathways and caused slight suppression of hemorrhage-related pathways. The different regulatory mechanisms in the spleen and liver after GCRV Ⅱ infection were shown in Figure 5.

4.1. Immune Response

As pattern recognition receptors (PRRs), RIG-I, Toll, and Nod-like receptors can recognize the unique pathogen-associated molecular pattern (PAMPs) or damage-associated molecular pattern (DAMPs) components of the organism and initiate downstream inflammatory responses in response to infection when the host is infected with a pathogen [32]. Extracellular cytokines can be recognized by corresponding receptors, stimulate the JAK-STAT pathway, regulate transmembrane receptor communication to the nucleus, and promote the expression of related antiviral genes [33]. However, the activation of STAT also causes tissue damage and leads to hemorrhage [34,35]. Members of the cytokine signal transduction inhibitors (SOCS) family are key regulators of immune balance [36,37]. In this study, in the spleen of virulent DY197-infected group, the mRNA expression levels of Toll-like receptor 3 (TLR3) and Toll-like receptor 8 (TLR8) in the Toll-like receptor signaling pathway; interferon regulatory factor 3 (IRF3), interferon regulatory factor 7 (IRF7), interferon (IFN-α and IFN-β), Retinoic acid-inducible protein I (RIG-I) in RIG-I receptor pathway; melanoma differentiation associated gene 5 (MDA5), DEXH-box polypeptide 58 (LGP2), JAK1 and STAT1B in JAK-STAT signaling pathway were significantly upregulated, enhancing inflammation to restrict viral infection, while mRNA expression levels of SOCS1, SOCS3 and SOCS6 were upregulated, controlling inflammation and avoid excessive damage. This regulatory mode was also observed in the liver of the virulent DY197 infection group. In comparison, the mRNA expression levels of related genes were slightly upregulated or even downregulated in the spleen and liver of the attenuated QJ205-infected group.
Phagocytosis of macrophages and degradation of lysosomes are the last step of phagocytosis and elimination of microorganisms [38]. For example, as a protease of lysosomes, cathepsin L (CTSL) is involved in a variety of immune responses, including apoptosis, antigen presentation, and inflammation [39,40]. In this study, as important effecting genes and antigen presentation genes in the lysosome and phagosome pathways, mRNA expression levels of cathepsins (CTSL, CTSS, CTSZ, CTSA, CTSK, and CTSB) and major histocompatibility complex class Ⅰ antigen (MHC Ⅰ) were significantly upregulated in both virulent DY197 infected liver and spleen and slightly upregulated or even downregulated in attenuated QJ205 infected liver and spleen, indicating that the virulent DY197 infection activated phagocytosis of macrophages. Similar to our study, the activation of phagosome and lysosome pathways was also found in the spleen and kidney of GCRV Ⅱ-infected grass carp [3,41].
However, in terms of adaptive immunity, the B cell receptor signaling pathway was activated in both liver and spleen, while the T cell receptor signaling pathway behaved differently in the liver and spleen. CD8 cell surface receptors CD8A and CD3Z genes were downregulated in the spleen, while CD3Z genes were upregulated in the liver. Previous studies in human viruses, such as herpes simplex virus (HSV) and SARS coronavirus 2 (SAR-COV-2), have demonstrated that activation of the kynurenine pathway of tryptophan metabolism can enhance antioxidant to alleviate inflammation in innate immune cells, but depletion of tryptophan will lead to suppression of T cell [42,43]. In this study, kynurenine-oxoglutarate transaminase 1 (KYAT1), the kynurenine pathway gene of tryptophan metabolism, was significantly upregulated in both spleen and liver after the virulent DY197 infection (Table 2 and Table 3). T cell was suppressed in the spleen and activated in the liver, which may be related to a sufficient supply of tryptophan because of liver-specific protein synthesis and metabolism function as discussed below. Tissue-specific inhibition of T cells provides us new insight into further investigation of the pathogenesis of GCRV Ⅱ infection.

4.2. Apoptosis and Necroptosis-Related Pathways

Apoptosis and necroptosis can be activated through stimulation of IFN and tumor necrosis factor (TNF), DNA damage, depletion of cellular NAD+, production of iron-dependent ROS, mitochondrial permeability change, etc. [44]. IFN transcription activates RNA reactive protein kinase, triggering necrosis through JAK1–STAT1-dependent transcription [45]. TNF stimulates the production of caspase-7/8, which plays an important role in the pathogen clearance and apoptosis of damaged cells [46]. DNA damage causes mitochondrial apoptosis induced by BAX (Bcl-2-associated X protein) [47]. Transcriptomic studies of GCRV-infected CIK [25] showed that necroptosis and apoptosis pathways were activated, and the steroid synthesis pathway that involved cell membrane formation [48] was suppressed in the later stage of infection. In this study, after virulent DY197 infection, the mRNA expression levels of tumor necrosis factor receptor superfamily member 1A (TNFRSF1A), tumor necrosis factor superfamily member 10 (TNFSF10), caspase-7, caspase-8, BAX genes were significantly upregulated in the liver, and the mRNA expression levels of caspase7 and BAX genes were significantly upregulated in the spleen; while the mRNA expression levels of these genes were slightly upregulated after attenuated QJ205 infection in both liver and spleen. In addition, the steroid synthesis pathway associated with membrane formation was suppressed in both spleen and liver after the virulent DY197 infection, which was consistent with the virulent DY197 infection that caused severe cell necrosis and tissue damage observed by histological examination [27]. Interestingly, the steroid synthesis pathway was activated in the spleen of attenuated QJ205 infected rare minnow, which may indicate that the spleen had passed the peak of antiviral response and began to synthesize steroids to restore membrane formation at 5 dpi. Previous studies have shown that hemorrhage symptoms gradually appeared on the 5th to 7th day in the head kidney of grass carp after a virulent strain of GCRV Ⅱ infection, and the upregulation of immune gene expression and downregulation of metabolic gene expression caused by viral infection would be reversed on the 7th day [3]. This reversal may be a regulatory mechanism for recovery after viral infection. Another study on viral load of GCRV Ⅱ-infected grass carp showed spleen and kidney were the tissues with the first increase in viral load and reached the peak of viral load on the 5th day, which may be due to the accumulation of virus caused by immune, hematopoietic, or glomerular filtration in these two tissues [16,17]. In studies of rare minnow infected with a virulent isolate of GCRV Ⅱ, the spleen was also the tissue that reached the viral load peak relatively quickly [11]. Considering GCRV Ⅱ tends to replicate faster and cause higher mortality in rare minnow than in grass carp after GCRV Ⅱ infection [11,16], it is possible that the spleen has passed the peak of disease and started to recover in rare minnow on the 5th day after attenuated QJ205 infection.

4.3. Protein Digestion and Absorption

The protein digestion and absorption pathway was activated only in the liver after both strain infections. Solute carrier family 15 member 1 (SLC15A1) chiefly mediates di/tripeptides absorption from protein digestion [49]. Meprin alpha, a zinc metalloprotease, was previously reported to be capable of cleaving a variety of substrates (e.g., protein kinases, basement membrane proteins, cytokines), and participate in the regulation of fibroblast activation and production of extracellular matrix [50]. In this study, the mRNA expression of meprin alpha subunit A/B (MEP1A, MEP1B) and SLC15A1 genes was significantly upregulated after both strain infections in the liver. The proteasome can degrade a large number of damaged and misfolded proteins, and then the production can be used to synthesize new proteins required by the organism. Thus, the proteasome controls many biological processes, including cell cycle, cell survival, and apoptosis [51,52]. In this study, in the liver, the proteasome pathway was the most significantly different pathway between the virulent DY197 and attenuated QJ205 infection group. In contrast, in the spleen, only two proteasome genes were significantly upregulated after virulent DY197 infection, and no related genes were upregulated after attenuated QJ205 infection.
The activation of protein digestion and absorption and proteasome pathways induced by GCRV Ⅱ infection may lead to an increase in oligopeptides and amino acids of proteolytic products, which was consistent with protein synthesis and metabolism for liver-specific function. The tissue-specific activation of protein digestion and absorption and proteasome pathways may be responsible for T cell activation in the liver but suppression in the spleen after virulent DY197 infection as described above. In addition, the lack of protein digestion and absorption and proteasome activation may result in the inhibition of many biological processes controlled by these two pathways in the spleen after virulent DY197 infection, including cell cycle, cell survival, and apoptosis [51,52].

4.4. Cell Proliferation and Migration

Focal adhesion is a subcellular structure that regulates the adhesion response of cells to the extracellular matrix [53]. Focal adhesion kinase is the core of the focal adhesion pathway; it can communicate with integrin, vascular endothelial growth factor receptor (VEGFR), platelet-derived growth factor receptor (PDGFR), insulin-like growth factor receptor (IGFR) and actin-related proteins that interact with each other to regulate cell proliferation, migration, and survival [54,55]. The regulation of the actin cytoskeleton pathway is downstream of the focal adhesion pathway and is involved in the regulation of cell movement. Previous studies have shown that focal adhesion kinase can interact with phosphoproteins of rabies virus and participate in viral infection [56]; during infection of shrimp, white spot syndrome virus was also found to interact with integrin proteins of the focal adhesion pathway [57]. Studies of GCRV-infected CIK, kidney, and spleen of grass carp showed that the focal adhesion and regulation of actin cytoskeleton pathways were activated at the initial stage of infection, suggesting these two pathways may be involved in the binding of the virus to the receptor; while these two pathways were suppressed at the later stage of infection, suggesting that the host translation mechanism was hijacked or shut down to promote virus replication and transmission [3,25,41]. In this study, after virulent DY197 infection, the mRNA expression of platelet-derived growth factor C (VEGFC), platelet-derived growth factor receptor subunit B (PDGFB), integrin alpha-2 (ITGA2), myosin regulatory light polypeptide 9b (MYL9), myosin light chain kinase (MYLK) genes involved in focal adhesion and regulation of actin cytoskeleton pathways were significantly downregulated in the spleen, which may cause cell proliferation and migration disorders that are important for repairing of tissue damage. The damage to vascular endothelial cells can lead to hemorrhage. In comparison, attenuated QJ205 infection induced only slight downregulation of mRNA expression of related genes in the spleen. Our spleen results were similar to previous transcriptome studies on the spleen of grass carp infected with GCRV Ⅱ [41]. However, our data suggested that the focal adhesion and regulation of actin cytoskeleton pathways were activated in the liver after GCRV Ⅱ infection, which had not been reported. Such tissue-specific regulatory mode of these two pathways may be controlled by metabolite abundance, as activation of protein digestion and absorption and proteasome pathways was liver-specific function.

4.5. Hemorrhage-Related Pathways

The complement and coagulation cascade pathway was activated in the spleen and liver after the virulent DY197 infection. In comparison, attenuated QJ205 infection induced only slight changes in the expression of genes involved in this pathway. The complement and coagulation cascade system has been reported to play an important role in innate immunity [58,59]. Overactivity of the complement cascade, however, can lead to endothelial damage, platelet activation and aggregation, hemolysis, and thrombosis [60,61]. Thus, significant activation of the complement and coagulation cascade pathway may account for the hemorrhagic symptoms after virulent DY197 infection. Malaria is an infectious disease caused by plasmodium, which causes a decrease in hemoglobin in human blood [62]. In this study, the mRNA expression of hemoglobin subunit alpha (HBA), hemoglobin subunit beta (HBB), thrombospondin-1 (THBS1), platelet glycoprotein Ib beta chain (GP1BB) genes involved in malaria and platelet activation pathways were significantly downregulated in the spleen after the virulent DY197 infection. In comparison, the mRNA expression of these genes was relatively slightly downregulated in the liver after the virulent DY197 infection. Obviously, although GCRV Ⅱ infection in the liver activated the complement and coagulation cascade system, due to the activation of proteasome, focal adhesion, and regulation of actin cytoskeleton pathways, vascular endothelial cells in the liver may be actively repaired after damage, alleviating hemorrhage symptoms.

5. Conclusions

In this study, a comparative transcriptomic analysis in the spleen and liver of rare minnow injected with virulent strain DY197 and attenuated strain QJ205 was conducted to investigate the possible involved molecular responses against the GCRV Ⅱ infection. The results showed the virulent DY197 strain induced more DEGs than the attenuated QJ205 strain, and tissue-specific responses were induced. In the spleen, virulent DY197 infection activated innate immunity and apoptosis-related pathways but suppressed adaptive immunity, cell migration and proliferation, and hemorrhage-related pathways. In the liver, except innate immunity and apoptosis-related pathways, virulent DY197 infection especially activated protein digestion and absorption-related pathways, both innate and adaptive immunity-related pathways, cell proliferation and migration-related pathways and caused slight suppression of hemorrhage-related pathways. These results would help us to better understand the interactions between the host and GCRV II.

Supplementary Materials

The following supporting information can be downloaded at: https://www.mdpi.com/article/10.3390/ani13111870/s1, Table S1: The summary of de novo assembly of transcriptomic profiles of rare minnow; Table S2: Summary statistics of sequencing data in the transcriptomes of rare minnow; Table S3: Summary of unigenes annotation of the spleen and liver of rare minnow. Figure S1: The Nr annotation summary of the de novo assembled transcriptome of rare minnow spleen and liver.

Author Contributions

Conceptualization, J.M., C.X. and Y.F.; methodology, J.M., C.X., N.J., Y.M., Y.Z., M.X., W.L. and Y.L.; software, J.M.; formal analysis, N.J., Y.M., Y.Z., M.X. and Y.F.; investigation, J.M., C.X. and Y.F.; resources, Y.M., Y.Z., M.X., W.L. and Y.L.; data curation, J.M., C.X. and Y.F.; writing-original draft preparation, J.M.; writing-review and editing, J.M., C.X. and Y.F.; visualization, J.M. and C.X.; supervision, Y.F.; project administration, Y.F.; funding acquisition, Y.F., C.X. and Y.Z. All authors have read and agreed to the published version of the manuscript.

Funding

This research was supported by the National Natural Science Foundation of China (No. 31772894), the Central Public-interest Scientific Institution Basal Research Fund, CAFS (No. 2020TD44, YFI202214), and the Earmarked Fund for China Agriculture Research System (No. CARS-45).

Institutional Review Board Statement

This study has been reviewed and approved (internal protocol no. YFI2022-fanyuding−01) by the Committee on the Ethics of Animal Experiments at the Yangtze River Fisheries Research Institute, Chinese Academy of Fishery Sciences (Approval Date: 21 March 2022).

Data Availability Statement

The data presented in this study are available in the article or supplementary material.

Conflicts of Interest

The authors have declared no conflict of interest.

References

  1. Cheng, L.; Fang, Q.; Shah, S.; Atanasov, I.; Zhou, Z. Subnanometer-resolution structures of the grass carp reovirus core and virion. J. Mol. Biol. 2008, 382, 213–222. [Google Scholar] [CrossRef] [PubMed] [Green Version]
  2. Rao, Y.; Su, J. Insights into the antiviral immunity against grass carp (Ctenopharyngodon idella) reovirus (GCRV) in grass carp. J. Immunol. Res. 2015, 2015, 670437. [Google Scholar] [CrossRef] [Green Version]
  3. He, L.; Zhang, A.; Pei, Y.; Chu, P.; Li, Y.; Huang, R.; Liao, L.; Zhu, Z.; Wang, Y. Differences in responses of grass carp to different types of grass carp reovirus (GCRV) and the mechanism of hemorrhage revealed by transcriptome sequencing. BMC Genom. 2017, 18, 452. [Google Scholar] [CrossRef] [Green Version]
  4. Wang, Q.; Zeng, W.; Liu, C.; Zhang, C.; Wang, Y.; Shi, C.; Wu, S. Complete Genome Sequence of a Reovirus Isolated from Grass Carp, Indicating Different Genotypes of GCRV in China. J. Virol. 2012, 86, 12466. [Google Scholar] [CrossRef] [Green Version]
  5. Zhang, K.; Liu, W.; Li, Y.; Zhou, Y.; Meng, Y.; Zeng, L.; Vakharia, V.N.; Fan, Y. Isolation, Identification, and Genomic Analysis of a Novel Reovirus from Healthy Grass Carp and Its Dynamic Proliferation In Vitro and In Vivo. Viruses 2021, 13, 690. [Google Scholar] [CrossRef]
  6. Fan, Y.; Ma, J.; Zhou, Y.; Jiang, N.; Liu, W.; Zeng, L. Establishment and application of a universal RT-PCR assay for detection of different genotype grass carp reovirus. Freshw. Fish. 2018, 48, 8. [Google Scholar]
  7. Zeng, W.; Wang, Q.; Wang, Y.; Zhao, C.; Li, Y.; Shi, C.; Wu, S.; Song, X.; Huang, Q.; Li, S. Immunogenicity of a cell culture-derived inactivated vaccine against a common virulent isolate of grass carp reovirus. Fish Shellfish. Immunol. 2016, 54, 473–480. [Google Scholar] [CrossRef]
  8. Xing, Y.; Tian, Y.; Deng, G.; Chi, Y.; Jiang, X. Complete genomic sequence of a reovirus isolated from grass carp in China. Virus Res. 2012, 163, 275–283. [Google Scholar] [CrossRef]
  9. Wu, S.; Zhang, S.; Ji, G.; Liu, J.; Shi, L.; Zhou, B. Research and Discussion of Rare Minnow as an Aquatic Model Organism. Asian J. Ecotoxicol. 2017, 12, 38–46. [Google Scholar]
  10. Wang, T.; Yi, Y.; Chen, H.; Liu, H.; Wen, G. Histopathological observation on hemorrhagic rare minnow (gobiocypris rarus) infected artificially with hemorrhagic virus of grass carp. Acta Hydrobiol. Sin. 1995, 19, 350–353. [Google Scholar]
  11. Chen, J.; Chang, O.; Li, Y.; Wang, Y.; Liu, C.; Yin, J.; Bergmann, S.M.; Zeng, W.; Wang, Q. Establishment of a rare minnow (Gobiocypris rarus) disease model for grass carp reovirus genotype II. Aquaculture 2020, 533, 736133. [Google Scholar] [CrossRef]
  12. Zapata, A.; Díez, B.; Cejalvo, T.; Frías, C.; Cortés, A. Ontogeny of the immune system of fish. Fish Shellfish. Immunol. 2006, 20, 126–136. [Google Scholar] [CrossRef]
  13. Chaves-Pozo, E.; Muñoz, P.; López-Muñoz, A.; Pelegrín, P.; Ayala, A.G.; Mulero, V.; Meseguer, J. Early innate immune response and redistribution of inflammatory cells in the bony fish gilthead seabream experimentally infected with Vibrio anguillarum. Cell Tissue Res. 2005, 320, 61–68. [Google Scholar] [CrossRef]
  14. Whyte, S.K. The innate immune response of finfish—A review of current knowledge. Fish Shellfish. Immunol. 2007, 23, 1127–1151. [Google Scholar] [CrossRef]
  15. Freitas-Lopes, M.A.; Mafra, K.; David, B.A.; Carvalho-Gontijo, R.; Menezes, G.B. Differential Location and Distribution of Hepatic Immune Cells. Cells 2017, 6, 48. [Google Scholar] [CrossRef] [Green Version]
  16. Liang, H.; Zeng, W.; Wang, Y.; Wang, Q.; Wu, S. Pathogenicity and tissue distribution of grass carp reovirus after intraperitoneal administration. Virol. J. 2014, 11, 178. [Google Scholar] [CrossRef] [Green Version]
  17. Liang, H.; Fu, X.; Li, N.; Liu, L.; Lin, Q.; Li, Y.; Peng, Y.; Huang, Z.; Wu, S. The distribution of different virulence grass carp reovirus strains in some neglected tissues. Pol. J. Vet. Sci. 2016, 19, 763–770. [Google Scholar] [CrossRef] [Green Version]
  18. Tang, Y.; Zeng, W.; Wang, Y.; Wang, Q.; Yin, J.; Li, Y.; Wang, C.; Bergmann, S.M.; Gao, C.; Hu, H. Comparison of the blood parameters and histopathology between grass carp infected with a virulent and avirulent isolates of genotype Ⅱ grass carp reovirus. Microb. Pathog. 2019, 139, 103859. [Google Scholar] [CrossRef]
  19. Ye, H.; Lin, Q.; Luo, H. Applications of transcriptomics and proteomics in understanding fish immunity. Fish Shellfish. Immunol. 2018, 77, 319–327. [Google Scholar] [CrossRef]
  20. Bersanelli, M.; Mosca, E.; Remondini, D.; Giampieri, E.; Sala, C.; Castellani, G.; Milanesi, L. Methods for the integration of multi-omics data: Mathematical aspects. BMC Bioinform. 2016, 17 (Suppl. 2), 15. [Google Scholar] [CrossRef] [Green Version]
  21. Dettleff, P.; Moen, T.; Santi, N.; Martinez, V. Transcriptomic analysis of spleen infected with infectious salmon anemia virus reveals distinct pattern of viral replication on resistant and susceptible Atlantic salmon (Salmo salar). Fish Shellfish. Immunol. 2017, 61, 187–193. [Google Scholar] [CrossRef]
  22. Ling, X.; Dong, W.; Zhang, Y.; Qian, X.; Zhang, W.; He, W.; Zhao, X.; Liu, J. Comparative transcriptomics and histopathological analysis of crucian carp infection by atypical Aeromonas salmonicida. Fish Shellfish. Immunol. 2019, 94, 294–307. [Google Scholar] [CrossRef]
  23. Zhu, J.; Li, C.; Ao, Q.; Tan, Y.; Luo, Y.; Guo, Y.; Lan, G.; Jiang, H.; Gan, X. Trancriptomic profiling revealed the signatures of acute immune response in tilapia (Oreochromis niloticus) following Streptococcus iniae challenge. Fish Shellfish. Immunol. 2015, 46, 346–353. [Google Scholar] [CrossRef]
  24. Wang, P.; Wang, J.; Su, Y.; Mao, Y.; Zhang, J.; Wu, C.; Ke, Q.; Han, K.; Zheng, W.; Xu, N. Transcriptome analysis of the Larimichthys crocea liver in response to Cryptocaryon irritans. Fish Shellfish. Immunol. 2016, 48, 1–11. [Google Scholar] [CrossRef]
  25. Chen, G.; He, L.; Luo, L.; Huang, R.; Liao, L.; Li, Y.; Zhu, Z.; Wang, Y. Transcriptomics Sequencing Provides Insights into Understanding the Mechanism of Grass Carp Reovirus Infection. Int. J. Mol. Sci. 2018, 19, 488. [Google Scholar] [CrossRef]
  26. Lin, Y.; Wang, B.; Wang, N.; Ouyang, G.; Cao, H. Transcriptome analysis of rare minnow (Gobiocypris rarus) infected by the grass carp reovirus. Fish Shellfish. Immunol. 2019, 89, 337–344. [Google Scholar] [CrossRef]
  27. Ma, J.; Xu, C.; Zhou, Y.; Jiang, N.; Xue, M.; Cao, J.; Li, S.; Fan, Y. Metabolomics in rare minnow (Gobiocypris rarus) after infection by attenuated and virulent grass carp reovirus genotype II. Fish Shellfish. Immunol. 2023, 138, 108840. [Google Scholar] [CrossRef]
  28. Grabherr, M.G.; Haas, B.J.; Yassour, M.; Levin, J.Z.; Thompson, D.A.; Amit, I.; Adiconis, X.; Fan, L.; Raychowdhury, R.; Zeng, Q.; et al. Full-length transcriptome assembly from RNA-Seq data without a reference genome. Nat. Biotechnol. 2011, 29, 644–652. [Google Scholar] [CrossRef] [Green Version]
  29. Langmead, B.; Salzberg, S.L. Fast gapped-read alignment with Bowtie 2. Nat. Methods 2012, 9, 357–359. [Google Scholar] [CrossRef] [Green Version]
  30. Li, B.; Dewey, C.N. RSEM: Accurate transcript quantification from RNA-Seq data with or without a reference genome. BMC Bioinform. 2011, 12, 323. [Google Scholar] [CrossRef] [Green Version]
  31. Love, M.I.; Huber, W.; Anders, S. Moderated estimation of fold change and dispersion for RNA-seq data with DESeq2. Genome Biol. 2014, 15, 550. [Google Scholar] [CrossRef] [Green Version]
  32. Paoletti, A.; Raza, S.Q.; Voisin, L.; Law, F.; Pipoli da Fonseca, J.; Caillet, M.; Kroemer, G.; Perfettini, J.L. Multifaceted roles of purinergic receptors in viral infection. Microbes Infect. 2012, 14, 1278–1283. [Google Scholar] [CrossRef]
  33. Xin, P.; Xu, X.; Deng, C.; Liu, S.; Wang, Y.; Zhou, X.; Ma, H.; Wei, D.; Sun, S. The role of JAK/STAT signaling pathway and its inhibitors in diseases. Int. Immunopharmacol. 2020, 80, 106210. [Google Scholar] [CrossRef] [PubMed]
  34. Siebler, J.; Wirtz, S.; Klein, S.; Protschka, M.; Blessing, M.; Galle, P.R.; Neurath, M.F. A key pathogenic role for the STAT1/T-bet signaling pathway in T-cell-mediated liver inflammation. Hepatology 2003, 38, 1573–1580. [Google Scholar] [CrossRef] [PubMed]
  35. Goerge, T.; Ho-Tin-Noe, B.; Carbo, C.; Benarafa, C.; Remold-O’Donnell, E.; Zhao, B.; Cifuni, S.M.; Wagner, D.D. Inflammation induces hemorrhage in thrombocytopenia. Blood 2008, 111, 4958–4964. [Google Scholar] [CrossRef] [PubMed] [Green Version]
  36. Li, J.; Zhang, Y.; Zhang, Y.; Liu, Y.; Xiang, Z.; Qu, F.; Yu, Z. Cloning and characterization of three suppressors of cytokine signaling (SOCS) genes from the Pacific oyster, Crassostrea gigas. Fish Shellfish. Immunol. 2015, 44, 525–532. [Google Scholar] [CrossRef] [PubMed]
  37. Hao, L.; Sun, L. Comparative analysis of the expression patterns of eight suppressors of cytokine signaling in tongue sole, Cynoglossus semilaevis. Fish Shellfish. Immunol. 2016, 55, 595–601. [Google Scholar] [CrossRef]
  38. Schwake, M.; Schröder, B.; Saftig, P. Lysosomal membrane proteins and their central role in physiology. Traffic 2013, 14, 739–748. [Google Scholar] [CrossRef]
  39. Wang, R.; Song, L.; Su, B.; Zhao, H.; Zhang, D.; Peatman, E.; Li, C. Mucosal expression signatures of two Cathepsin L in channel catfish (Ictalurus punctatus) following bacterial challenge. Fish Shellfish. Immunol. 2015, 47, 582–589. [Google Scholar] [CrossRef]
  40. Gao, C.; Fu, Q.; Su, B.; Zhou, S.; Liu, F.; Song, L.; Zhang, M.; Ren, Y.; Dong, X.; Tan, F.; et al. Transcriptomic profiling revealed the signatures of intestinal barrier alteration and pathogen entry in turbot (Scophthalmus maximus) following Vibrio anguillarum challenge. Dev. Comp. Immunol. 2016, 65, 159–168. [Google Scholar] [CrossRef]
  41. He, L.; Zhu, D.; Liang, X.; Li, Y.; Liao, L.; Yang, C.; Huang, R.; Zhu, Z.; Wang, Y. Multi-Omics Sequencing Provides Insights Into Age-Dependent Susceptibility of Grass Carp (Ctenopharyngodon idellus) to Reovirus. Front. Immunol. 2021, 12, 694965. [Google Scholar] [CrossRef]
  42. Adams, O.; Besken, K.E.; Oberdörfer, C.; MacKenzie, C.R.; Rüssing, D.; Däubener, W. Inhibition of human herpes simplex virus type 2 by interferon gamma and tumor necrosis factor alpha is mediated by indoleamine 2,3-dioxygenase. Microbes Infect. 2004, 6, 806–812. [Google Scholar] [CrossRef] [PubMed]
  43. Shen, B.; Yi, X.; Sun, Y.; Bi, X.; Du, J.; Zhang, C.; Quan, S.; Zhang, F.; Sun, R.; Qian, L.; et al. Proteomic and Metabolomic Characterization of COVID-19 Patient Sera. Cell 2020, 182, 59–72.e15. [Google Scholar] [CrossRef] [PubMed]
  44. Pasparakis, M.; Vandenabeele, P. Necroptosis and its role in inflammation. Nature 2015, 517, 311–320. [Google Scholar] [CrossRef] [PubMed]
  45. Thapa, R.J.; Nogusa, S.; Chen, P.; Maki, J.L.; Lerro, A.; Andrake, M.; Rall, G.F.; Degterev, A.; Balachandran, S. Interferon-induced RIP1/RIP3-mediated necrosis requires PKR and is licensed by FADD and caspases. Proc. Natl. Acad. Sci. USA 2013, 110, E3109–E3118. [Google Scholar] [CrossRef] [Green Version]
  46. Varfolomeev, E.E.; Schuchmann, M.; Luria, V.; Chiannilkulchai, N.; Beckmann, J.S.; Mett, I.L.; Rebrikov, D.; Brodianski, V.M.; Kemper, O.C.; Kollet, O.; et al. Targeted disruption of the mouse Caspase 8 gene ablates cell death induction by the TNF receptors, Fas/Apo1, and DR3 and is lethal prenatally. Immunity 1998, 9, 267–276. [Google Scholar] [CrossRef] [PubMed] [Green Version]
  47. Baritaud, M.; Cabon, L.; Delavallée, L.; Galán-Malo, P.; Gilles, M.E.; Brunelle-Navas, M.N.; Susin, S.A. AIF-mediated caspase-independent necroptosis requires ATM and DNA-PK-induced histone H2AX Ser139 phosphorylation. Cell Death Dis. 2012, 3, e390. [Google Scholar] [CrossRef] [Green Version]
  48. Abe, F.; Usui, K.; Hiraki, T. Fluconazole modulates membrane rigidity, heterogeneity, and water penetration into the plasma membrane in Saccharomyces cerevisiae. Biochemistry 2009, 48, 8494–8504. [Google Scholar] [CrossRef]
  49. Verri, T.; Barca, A.; Pisani, P.; Piccinni, B.; Storelli, C.; Romano, A. Di- and tripeptide transport in vertebrates: The contribution of teleost fish models. J. Comp. Physiol. B 2017, 187, 395–462. [Google Scholar] [CrossRef]
  50. Ge, W.; Hou, C.; Zhang, W.; Guo, X.; Gao, P.; Song, X.; Gao, R.; Liu, Y.; Guo, W.; Li, B.; et al. Mep1a contributes to Ang II-induced cardiac remodeling by promoting cardiac hypertrophy, fibrosis and inflammation. J. Mol. Cell. Cardiol. 2021, 152, 52–68. [Google Scholar] [CrossRef]
  51. Meyer-Schwesinger, C. The ubiquitin-proteasome system in kidney physiology and disease. Nat. Rev. Nephrol. 2019, 15, 393–411. [Google Scholar] [CrossRef] [PubMed]
  52. Rousseau, A.; Bertolotti, A. Regulation of proteasome assembly and activity in health and disease. Nat. Rev. Mol. Cell Biol. 2018, 19, 697–712. [Google Scholar] [CrossRef] [Green Version]
  53. Chen, C.; Alonso, J.L.; Ostuni, E.; Whitesides, G.M.; Ingber, D.E. Cell shape provides global control of focal adhesion assembly. Biochem. Biophys. Res. Commun. 2003, 307, 355–361. [Google Scholar] [CrossRef] [PubMed]
  54. Frame, M.C.; Patel, H.; Serrels, B.; Lietha, D.; Eck, M.J. The FERM domain: Organizing the structure and function of FAK. Nat. Rev. Mol. Cell Biol. 2010, 11, 802–814. [Google Scholar] [CrossRef]
  55. Hsia, D.A.; Mitra, S.K.; Hauck, C.R.; Streblow, D.N.; Nelson, J.A.; Ilic, D.; Huang, S.; Li, E.; Nemerow, G.R.; Leng, J.; et al. Differential regulation of cell motility and invasion by FAK. J. Cell Biol. 2003, 160, 753–767. [Google Scholar] [CrossRef]
  56. Fouquet, B.; Nikolic, J.; Larrous, F.; Bourhy, H.; Wirblich, C.; Lagaudrière-Gesbert, C.; Blondel, D. Focal adhesion kinase is involved in rabies virus infection through its interaction with viral phosphoprotein P. J. Virol. 2015, 89, 1640–1651. [Google Scholar] [CrossRef] [PubMed] [Green Version]
  57. Lu, H.; Ruan, L.; Xu, X. An immediate-early protein of white spot syndrome virus modulates the phosphorylation of focal adhesion kinase of shrimp. Virology 2011, 419, 84–89. [Google Scholar] [CrossRef] [Green Version]
  58. Foley, J.H. Examining coagulation-complement crosstalk: Complement activation and thrombosis. Thromb. Res. 2016, 141 (Suppl. 2), S50–S54. [Google Scholar] [CrossRef]
  59. Calame, D.G.; Mueller-Ortiz, S.L.; Wetsel, R.A. Innate and adaptive immunologic functions of complement in the host response to Listeria monocytogenes infection. Immunobiology 2016, 221, 1407–1417. [Google Scholar] [CrossRef] [PubMed] [Green Version]
  60. Hamad, O.A.; Bäck, J.; Nilsson, P.H.; Nilsson, B.; Ekdahl, K.N. Platelets, complement, and contact activation: Partners in inflammation and thrombosis. Adv. Exp. Med. Biol. 2012, 946, 185–205. [Google Scholar] [CrossRef]
  61. Meri, S. Complement activation in diseases presenting with thrombotic microangiopathy. Eur. J. Intern. Med. 2013, 24, 496–502. [Google Scholar] [CrossRef] [PubMed]
  62. World Health Organization. WHO Guidelines for Malaria, 13 July 2021; World Health Organization: Geneva, Switzerland, 2021. [Google Scholar]
Figure 1. DEGs in rare minnow spleen and liver response to attenuated and virulent GCRV Ⅱ infection. (A) PCA score plot showing the difference in mRNA expression among the groups. (B) Barplot showing the summary of DEGs. (C) Venn diagrams showing the overlap of upregulated and downregulated DEGs in the attenuated and virulent GCRV Ⅱ infection groups. DEGs, differentially expressed genes; GCRV Ⅱ, grass carp reovirus genotype Ⅱ; PCA, principal component analysis; C–S, control–spleen; C–L, control–liver; A–S, attenuated–spleen; A–L, attenuated–liver; V–S, virulent–spleen; V–L, virulent–liver.
Animals 13 01870 g001
Figure 2. The top20 enrichment KEGG pathways of upregulated (A) and downregulated (B) differentially expressed genes in the spleen after infection with virulent and attenuated GCRV Ⅱ. GCRV Ⅱ, grass carp reovirus genotype Ⅱ; QJ205, attenuated strain of GCRV Ⅱ; DY197, virulent strain of GCRV Ⅱ. The comparisons were between the infected group versus the control group.
Animals 13 01870 g002
Figure 3. The top 20 enrichment KEGG pathways of upregulated (A) and downregulated (B) differentially expressed genes in the liver after infection with virulent and attenuated GCRV Ⅱ. GCRV Ⅱ, grass carp reovirus genotype Ⅱ; QJ205, attenuated strain of GCRV Ⅱ; DY197, virulent strain of GCRV Ⅱ. The comparisons were between the infected group versus the control group.
Animals 13 01870 g003
Figure 4. Validation of differentially expressed genes in RNA-seq data by using qPCR.
Animals 13 01870 g004
Figure 5. Schematic diagram showing the different regulatory mechanisms in the spleen and liver of rare minnow after GCRV Ⅱ infection from the results of this study. (By Figdraw.). When rare minnow was infected with GCRV Ⅱ, immune response and apoptosis-related pathways were activated in the spleen and liver because GCRV Ⅱ infection especially activated protein digestion and absorption-related pathways in the liver only, cell migration and proliferation-related pathways that are important for tissue repair were activated by sufficient protein supply in the liver but suppressed in the spleen; eventually, hemorrhage was relatively mild in the liver but severe in the spleen.
Animals 13 01870 g005
Table 1. The primers of differentially expressed genes.
Gene NameForward Primer (5′-3′)Reverse Primer (5′-3′)
β-actin ATGGATGATGAAATTGCCGC CTGTCCCATACCAACCATGA
GP1BBGAACTCCACCTGAACGACAATCAGATAAAGGATGCCGCAG
MHC CCTATGCTGGACAACACTCT TTTGGCACAGCTTTCATTGC
PLAURTAACGTGCCCAATGGAAAGATACAACCAAAGACTGGCCTC
IRF3TCAGTGGGAAGATCAACGAGTGAGGACGGATAATGCGAAA
CTSBCTGGCTACAGCCCTTCTTACAGGAAGTCCTCATACACGGT
CXCL8CAGTCTTTGTTATCGCTGGCATGTGTTTACCAATGCGTCG
HBAAGACCTATTTCGCTCACTGGGAATGCATGAAGTTCGCTCA
STAT1BAGCACTACAGCCGTCTCAATCTCCTGTGATGAGTTACCGCTACCTT
Table 2. Representative differentially expressed genes in the spleen of attenuated QJ205 and virulent DY197 infected groups. The log2 (Fold change) was calculated using the formula log2 (infected group/control group).
PathwayGene NameLog2 (Fold Change)
QJ205DY197
Representative upregulated differentially expressed genes
RIG-Ⅰ/TOLL/NOD-like receptor signaling pathway, JAK-STAT signaling pathwayRetinoic acid-inducible protein I0.112.01
DEXH (Asp-Glu-X-His) box polypeptide 580.282.47
Melanoma differentiation associated gene 5−0.071.72
Toll-like receptor 3−0.171.03
Toll-like receptor 8−0.971.02
Interferon regulatory factor 30.091.06
Interferon regulatory factor 70.162.44
Interferon alpha−0.811.60
Interferon beta−0.563.85
Signal transducer and activator of transcription 1b−0.132.24
Signal transducer and activator of transcription 2−0.341.09
Tyrosine-protein kinase JAK1−0.611.27
Chemokine (C-X-C motif) ligand 11−0.371.79
Chemokine (C-X-C motif) ligand 20−0.112.23
Suppressor of cytokine signaling 10.082.06
Suppressor of cytokine signaling 3−0.441.18
Suppressor of cytokine signaling 6−0.841.38
B cell receptor signaling pathwayImmunoglobulin omega chain−0.701.96
B-cell receptor CD22−1.031.05
Secreted immunoglobulin heavy chain IgM−0.731.16
Immunoglobulin heavy variable 1–3−0.591.81
Tryptophan metabolismkynurenine-oxoglutarate transaminase 1−0.621.34
Lysosome and phagosomeCathepsin A−0.691.10
Cathepsin B−0.651.05
Cathepsin D−0.821.17
Cathepsin K−0.302.33
Cathepsin L0.161.83
Cathepsin S−0.711.06
Cathepsin Z−0.641.08
MHC class I antigen−0.611.17
Apoptosis and necroptosisBcl-2 associated X protein−0.191.64
Caspase-7−0.661.81
Interferon-induced, double-stranded RNA-activated protein kinase0.101.56
Complement and coagulation cascadesCoagulation factor IXa1.050.21
Urokinase plasminogen activator surface receptor0.183.41
Complement factor H0.581.48
Representative downregulated differentially expressed genes
T cell receptor signaling pathwayT-cell surface glycoprotein CD3 zeta chain−1.26−1.62
CD8 alpha chain−0.93−2.17
Tyrosine-protein kinase ZAP-70−0.63−1.45
Steroid biosynthesisSqualene synthase1.12−0.48
Lanosterol synthase1.39−1.50
Delta(24)-sterol reductase1.37−0.77
Squalene monooxygenase1.86−2.10
MalariaHemoglobin subunit alpha−1.36−3.21
Hemoglobin subunit beta-2−0.33−1.98
Thrombospondin-1−1.08−1.79
Platelet activationPlatelet glycoprotein V−1.15−1.96
Platelet glycoprotein Ib alpha chain−0.95−1.80
Platelet glycoprotein Ib beta chain−1.26−2.04
Focal adhesion and regulation of actin cytoskeletonMyosin regulatory light polypeptide 9b−1.31−1.67
Myosin light chain kinase−0.92−1.62
Integrin alpha-2−1.09−1.66
Platelet-derived growth factor subunit B−1.42−2.06
Laminin subunit beta-1b−0.69−1.67
Vascular endothelial growth factor C−1.07−1.48
Table 3. Representative differentially expressed genes in the liver of attenuated QJ205 and virulent DY197 infected groups. The log2 (Fold change) was calculated using the formula log2 (infected group/control group).
PathwayGene NameLog2 (Fold Change)
QJ205DY197
Representative upregulated differentially expressed genes
RIG-Ⅰ/TOLL/NOD-like receptor singaling pathway, JAK-STAT singaling pathwayRetinoic acid-inducible protein I1.953.99
DEXH (Asp-Glu-X-His) box polypeptide 582.294.70
Melanoma differentiation associated gene 50.933.13
Nucleotide-binding oligomerization domain-containing protein0.021.67
Nicotinamide phosphoribosyltransferase-like protein1.053.54
Toll-like receptor 80.523.10
TNF receptor-associated factor 50.162.47
Interferon regulatory factor 72.855.77
Interferon regulatory factor 90.562.49
Interferon a0.713.86
Signal transducer and activator of transcription 1b2.084.79
Tyrosine-protein kinase JAK1−0.041.74
Cytokine receptor family member b4−0.031.96
C-X-C motif chemokine 91.103.90
Chemokine (C-X-C motif) ligand 200.564.47
Suppressor of cytokine signaling 10.872.52
Suppressor of cytokine signaling 30.211.79
B cell receptor signaling pathwayImmunoglobulin omega chain0.008.06
B-cell receptor CD220.582.81
Secreted immunoglobulin heavy chain IgM0.732.08
Tryptophan metabolismkynurenine-oxoglutarate transaminase 10.611.81
Lysosome and phagosomeCathepsin A−0.051.15
Cathepsin B−0.021.56
Cathepsin H0.271.81
Cathepsin K1.193.87
Cathepsin L0.071.53
Cathepsin Z−0.121.82
MHC class I antigen0.203.28
Apoptosis and necroptosisBcl-2 associated X protein−0.191.64
Caspase-70.292.69
Caspase-81.653.75
Interferon-induced, double-stranded RNA-activated protein kinase1.162.80
Tumor necrosis factor receptor superfamily member 1A0.241.98
Tumor necrosis factor (ligand) superfamily, member 101.943.00
ProteasomeProteasome subunit alpha type-30.101.50
Proteasome subunit alpha type-5−0.061.27
Proteasome subunit alpha type-60.512.25
Proteasome subunit beta type-2−0.331.36
Proteasome subunit beta type-70.992.97
Proteasome subunit beta type-80.542.97
Proteasome activator complex subunit 10.382.33
Proteasome activator complex subunit 20.462.81
Protein digestion and absorptionMeprin A subunit alpha2.143.49
Meprin A subunit beta2.803.19
Solute carrier family 15 member 13.263.05
Complement and coagulation cascadesComplement C1q subcomponent subunit A0.512.49
Proteinase-activated receptor 1−0.081.79
Urokinase plasminogen activator surface receptor3.967.69
Complement factor H−0.191.44
Representative downregulated differentially expressed genes
Steroid biosynthesisSqualene synthase−0.24−1.52
Lanosterol synthase-like isoform X2−0.75−2.02
Delta(24)-sterol reductase−0.02−1.14
Squalene monooxygenase−0.98−2.59
Disclaimer/Publisher’s Note: The statements, opinions and data contained in all publications are solely those of the individual author(s) and contributor(s) and not of MDPI and/or the editor(s). MDPI and/or the editor(s) disclaim responsibility for any injury to people or property resulting from any ideas, methods, instructions or products referred to in the content.

