Article

Inoculation with Azospirillum sp. and Herbaspirillum sp. Bacteria Increases the Tolerance of Maize to Drought Stress

by
José Alfredo Curá
*,
Diego Reinaldo Franz
,
Julián Ezequiel Filosofía
,
Karina Beatríz Balestrasse
and
Lautaro Exequiel Burgueño
Facultad de Agronomía, Cátedra de Bioquímica, Universidad de Buenos Aires, Avenida San Martín 4453, Ciudad Autónoma de Buenos Aires C1417DSE, Argentina
*
Author to whom correspondence should be addressed.
Microorganisms 2017, 5(3), 41; https://doi.org/10.3390/microorganisms5030041
Submission received: 28 April 2017 / Revised: 10 July 2017 / Accepted: 24 July 2017 / Published: 26 July 2017
(This article belongs to the Special Issue Symbiotic Plant-Bacterial Endospheric Interactions)

Abstract

:
Stress drought is an important abiotic factor that leads to immense losses in crop yields around the world. Strategies are urgently needed to help plants adapt to drought in order to mitigate crop losses. Here we investigated the bioprotective effects of inoculating corn grown under drought conditions with two types of plant growth-promoting rhizobacteria (PGPR), A. brasilense, strain SP-7, and H. seropedicae, strain Z-152. Plants inoculated with the bacteria were grown in a greenhouse with perlite as a substrate. Two hydric conditions were tested: normal well-watered conditions and drought conditions. Compared to control non-inoculated plants, those that were inoculated with PGPR bacteria showed a higher tolerance to the negative effects of water stress in drought conditions, with higher biomass production; higher carbon, nitrogen, and chlorophyll levels; and lower levels of abscisic acid and ethylene, which are plant hormones that affect the stress response. The oxidative stress levels of these plants were similar to those of non-inoculated plants grown in well-watered conditions, showing fewer injuries to the cell membrane. We also noted higher relative water content in the vegetal tissue and better osmoregulation in drought conditions in inoculated plants, as reflected by significantly lower proline content. Finally, we observed lower gene expression of ZmVP14 in the inoculated plants; notably, ZmVP14 is involved in the biosynthesis of abscisic acid. Taken together, these results demonstrate that these bacteria could be used to help plants cope with the negative effects of drought stress conditions.

1. Introduction

Corn (Zea mays L.) farming is one of the most important and extensive farming systems in the world because of the myriad products derived from this plant. In 2013, a total of 1,018,111,958 tons of corn were produced globally [1]. Drought is a major abiotic stress factor that affects crop yield. Daryanto et al. [2] collected data from peer-reviewed publications between 1980 and 2015 that examined maize and wheat yield responses to drought using field experiments and concluded that the maize yield reduction was 39.3%. The loss in crop yield during drought depends on the phenological stage of the crops and on the severity of the hydric deficit [3]. In coming years, global warming is predicted to increase the severity and the frequency of drought. According to Food and Agriculture Organization of the United Nations (FAO), the Food and Agriculture Organization of the United Nations, agriculture must adapt to the effects of global warming and improve crop resilience in order for food production to meet the food needs of our increasing population. Accordingly, the production of major crops will have to shift to marginal areas, some with hydric deficits [4].
The reactions of plants to drought stress are complex. Factors that affect the response include the environment, plant genotype, plant development stage, and the severity and duration of the stress [5]. Morpho-physiological and biochemical characteristics related to drought stress include leaf senescence, decreases in the foliar area and the chlorophyll content, root elongation, decreases in the relative water content (RWC), increases in reactive oxygen species (ROS) production [6] and nitrate assimilation [7]. In addition to the many physiological and cellular changes, there are also changes in many genes and gene products in response to drought stress that occur at the transcriptional, post-transcriptional, and translational levels [5]. Some responses to water stress are related to changes in ion flux, stomatal closing, the production of osmoprotectant metabolites, and alterations in plant growth patterns [8]. Plants regulate their hydric state via stomatal closing, a process that is influenced by the hormone abscisic acid (ABA), which is synthesized mainly in the leaves. ABA synthesis is stimulated by dehydration conditions, and ABA plays an important role in the response to drought stress [9,10,11]. Hydric deficit also decreases photosynthesis, leading to stomatal closing and to decreases in the intercellular CO2 concentration [12].
The enzyme 9-cis-epoxycarotenoid dioxygenase (NCED), which is found in chloroplasts, acts to produce xanthoxin, and this reaction is considered the first step in ABA synthesis. NCED belongs to a multigene family in Zea mays L., and the VP14 gene in corn was the first cloned NCED gene [13,14]. NCED is the most important regulating enzyme in ABA syntheses because its expression correlates with endogenous ABA content and its overexpression leads to important ABA accumulation [15]. Tan et al. [16] revealed the role of the VP14 gene in ABA synthesis, and reported that the VP14 protein is expressed as a response to drought stress and concluded that VP14 encodes a dioxygenase that is responsible for the oxidative conversion of neoxanthin to xanthoxin. This is one step in the ABA synthesis chain; xanthoxin is subsequently converted into an ABA aldehyde by a short-chain alcohol dehydrogenase (ABA2 in Arabidopsis).
In addition to ABA, ethylene is another hormone that is associated with the response of plants to stress. Ethylene levels regulate many processes involved in the growth and development of plants, and ethylene biosynthesis is regulated by both biotic and abiotic stress [17]. During stress conditions, endogenous ethylene in the plant reduces the growth of roots and stems. 1-Aminocyclopropane-1-carboxylic (ACC) is a precursor of ethylene synthesis in plants. Glick [18] showed that plant ACC is broken down by the bacterial enzyme ACC deaminase, which converts ACC into a source of nitrogen and energy. Under stressful conditions, plants produce reactive oxygen species (ROS) such as hydrogen peroxide, superoxide anion, and hydroxyl radicals [19]. Oxidative stress is caused by an imbalance between ROS productivity and the ability of a biological system to detoxify the reactive intermediates or to repair the resulting damage [20]. The damage caused by ROS can be assessed by studying the lipid peroxidation of cellular membranes, with malondialdehyde (MDA) used as a marker of this process [21].
Osmotic regulation refers to the ability of a plant to accumulate solutes as a response to a hydric deficit, a phenomenon that can totally or partially preserve turgor pressure [22]. Importantly, ABA induces the synthesis of several solutes called osmolytes. These small, uncharged, soluble molecules, which include proline, glycine betaine, polyamines, and melatonin, do not affect cellular function directly. These solutes decrease the hydric potential of cells by trapping water molecules or by retaining the water molecules they are already associated with. Compatible solutes can increase the stability and integrity of membranes and proteins, preventing or lessening cellular damage. During hydric deficit conditions, it was observed that the proline concentration could increase to double its normal level, showing clear osmoregulation [23].
Changes in factors that affect plant growth and development can lead to losses in crop yields, highlighting the importance of developing new and alternative technologies to achieve sustainable farming conditions. One such technology is the use of plant growth-promoting rhizobacteria (PGPR) that reduce the harmful effects of abiotic stress.
There is a large group of PGPR bacteria that colonize the rhizosphere and interact with plants, helping them to grow in both direct and indirect ways [24,25,26,27]. For example, PGPR produce some metabolites that can be used by plants as growth regulators, such as auxins, gibberellins, and cytokinins [28,29,30,31]. PGPR also influence the biological fixation of nitrogen [28,31,32] and nitrate assimilation [32,33,34], and they can increase the availability of nutrients such as phosphorus by solubilizing insoluble phosphates [35]. PGPR also produce some antagonistic metabolites that negatively affect microorganisms that are detrimental to the plant; such metabolites include antibiotics [36,37], siderophores [38], and chitinolytic enzymes and glucanases [39,40].
Azospirillum sp. are among the most studied PGPR [41,42,43,44]. These bacteria have been used successfully as inoculants in different crop and agro-ecological conditions, and they help increase crop production efficiency [45]. Many groups have reported that Herbaspirillum sp. bacteria can help the growth and productivity of some economically important crops, such as rice, corn, and sugar cane [46,47,48,49]. Some studies have shown that using PGPR can lead to a higher tolerance to abiotic stress conditions, including drought and salinity [50,51,52,53,54,55,56,57,58]. However, little is known about the molecular processes involved in the interaction of plants and bacteria in drought conditions.

2. Materials and Methods

2.1. Experimental Design and Statistical Analysis

We designed a factorial experiment with two factors. The first factor, bacteria, had three levels: (1) control seeds treated with sterile NFb medium [59]; (2) seeds inoculated with Azospirillum brasilense, strain SP-7 (ATCC 29729™); and (3) seeds inoculated with Herbaspirillum seropedicae, strain Z-152 (ATCC 35894™). The second factor, watering, had two levels: (1) watering once every 24 h, called the well-watered (WW) condition; (2) watering once every 96 h, called the drought (D) condition. The experiment involved six treatments, each composed of three replicates. Each experimental unit or replicate had 36 samples. The data were analyzed using analysis of variance (ANOVA), including the interaction between the bacteria and watering factors as a source of variation. We also performed the Tukey test of multiple comparisons using the statistical software InfoStat [60].

2.2. Bacterial Growth and Inoculation

We used NFb medium [59] to grow strain A. brasilense, and JNFb medium [61] to grow strain H. seropedicae. To inoculate the seeds, we used a concentration of 1.6 × 10⁹ CFU mL−1 (colony-forming units per milliliter) of A. brasilense and 1.8 × 10⁹ CFU mL−1 of H. seropedicae in a volume of 50 mL of the appropriate medium. Before inoculation, the seeds were rinsed for 15 min in a solution of 30% v/v of commercial bleach, 70% sterile distilled water, and 100 μL/L of Triton X-100. The seeds were then rinsed three times for 10 min/rinse in sterile water. For inoculation, the seeds were placed in bacterial medium for 24 h.

2.3. Plant Growth Conditions

This experiment was conducted in a greenhouse with temperatures between 25 °C and 30 °C, a 16 h/8 h light/dark cycle, and 50–70% humidity. We used a 36-well tray (Speedling Incorporated, Nipomo, CA, USA). Each well had a volume of 250 mL, and sterile perlite was used as the substrate. Each tray was treated the same way in order to establish the experimental unit. After the seeds were inoculated, we placed one seed in each well. We watered each well with 40 mL of Murashige & Skoog Salt Mixture medium [62] at a concentration of 0.20 in distilled water. During the first 8 days of the test, all plants were watered once every 48 h for every treatment condition. Starting on day 8, the plants were watered once every 48 h in the WW condition and once every 96 h in the D condition. The experiment was complete 20 days after sowing (DAS).

2.4. Measures

2.4.1. Symbiotic Development

Once the experiment was complete, we took samples of the roots of plants that were inoculated with the bacterial strains. We then cleaned the root surface with 25 mL of the solution 30% v/v of commercial bleach, 70% sterile distilled water, and 100 μL/L of Triton X-100. Using a mortar, we extracted a homogenate from which we prepared serial dilutions. The CFU of each strain was determined after 5 days of incubation at 30 °C in plates with solid Congo red medium [63], using colony shape and color as a way to confirm the identities of each strain.

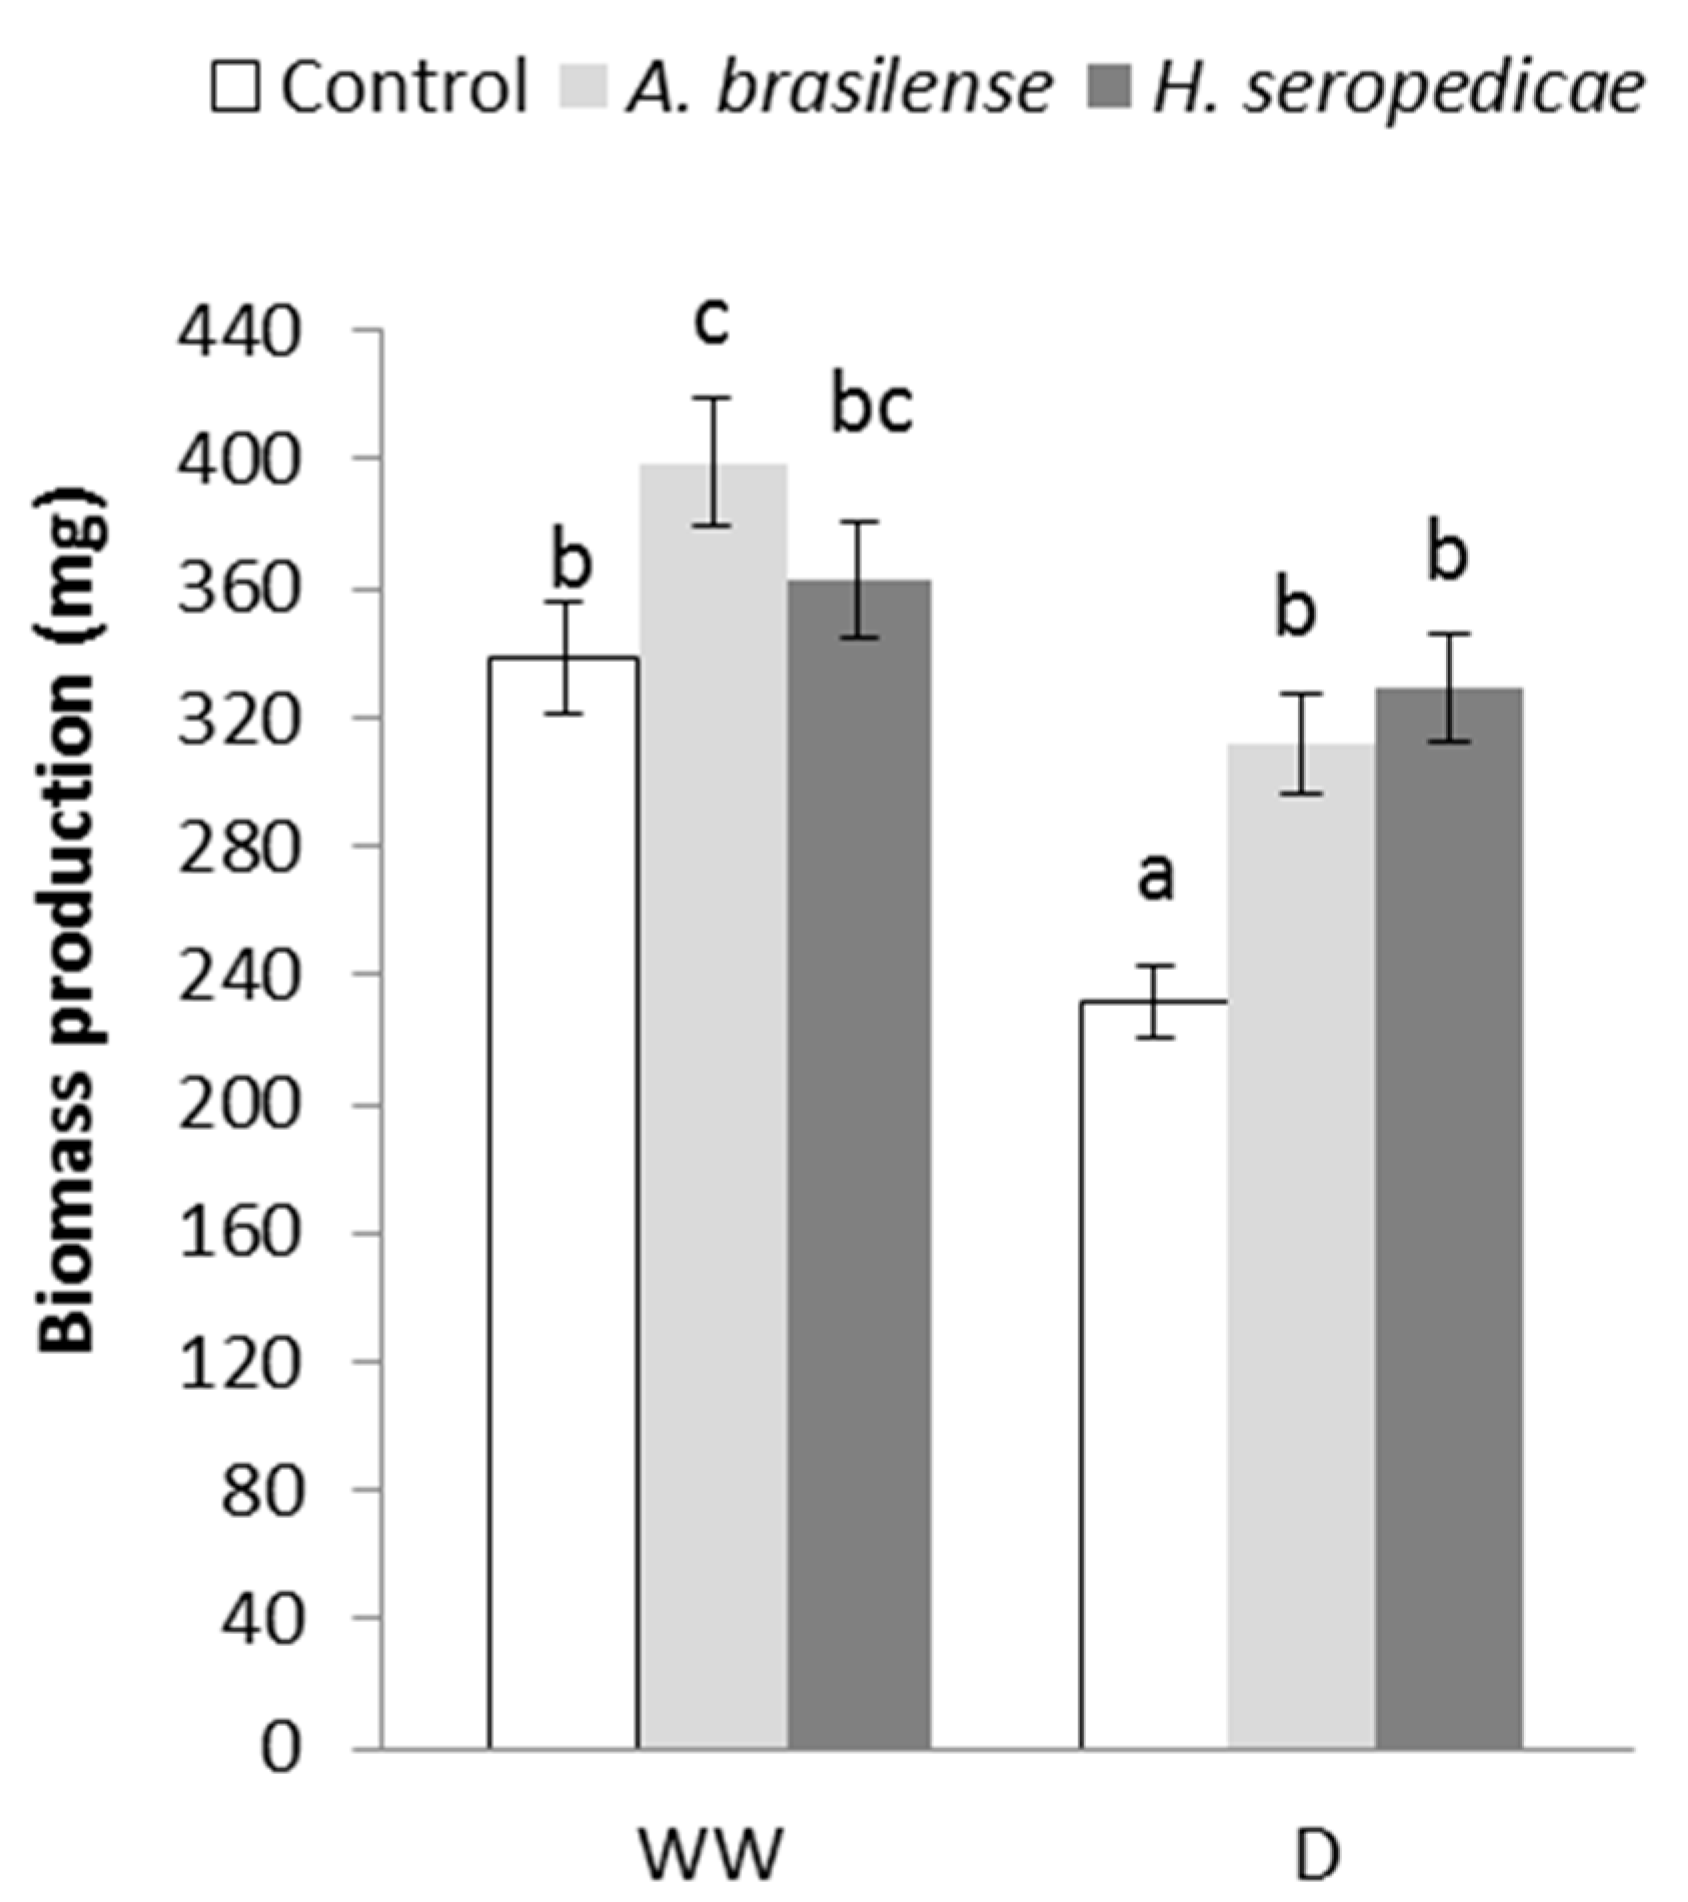
2.4.2. Total Biomass (TB) Production

In order to determine the dry weight of the TB, we collected six random samples (entire plants) from each treatment condition 20 DAS. The samples were placed in an 80 °C oven for 48 h. When the sample was dry, we determined its weight.

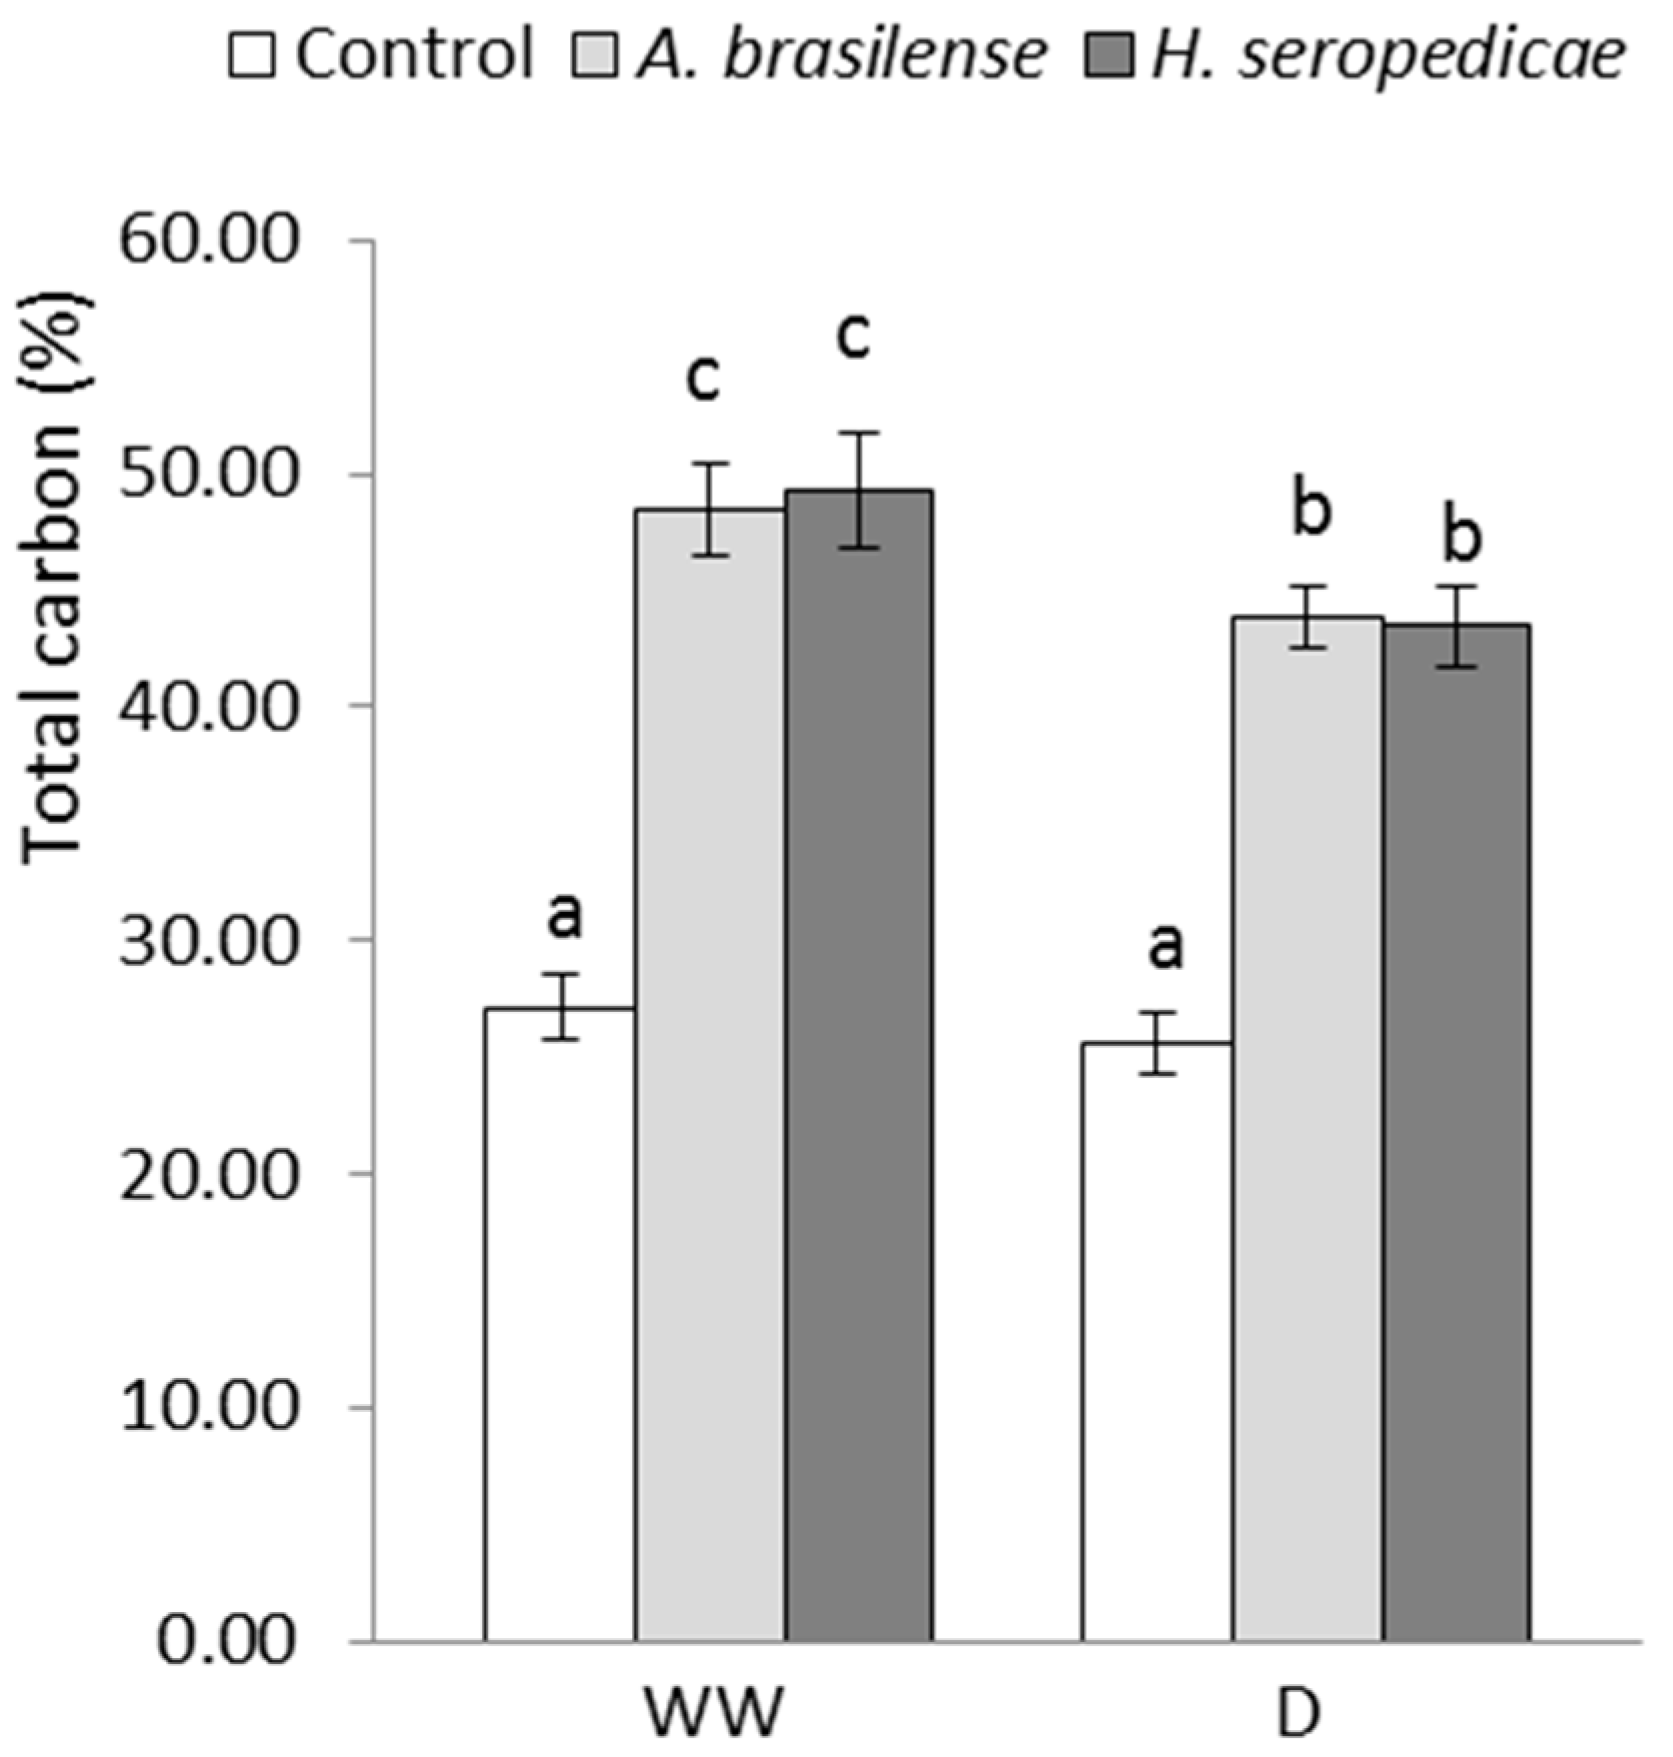
2.4.3. Total Carbon (TC) and Total Nitrogen (TN) Content

In order to analyze the TC and the TN, we collected three random samples (entire plants) from each treatment condition 20 DAS. We used a modified Walkley-Black method [64] for TC determination, and we used the Kjeldahl method [65] for TN determination.

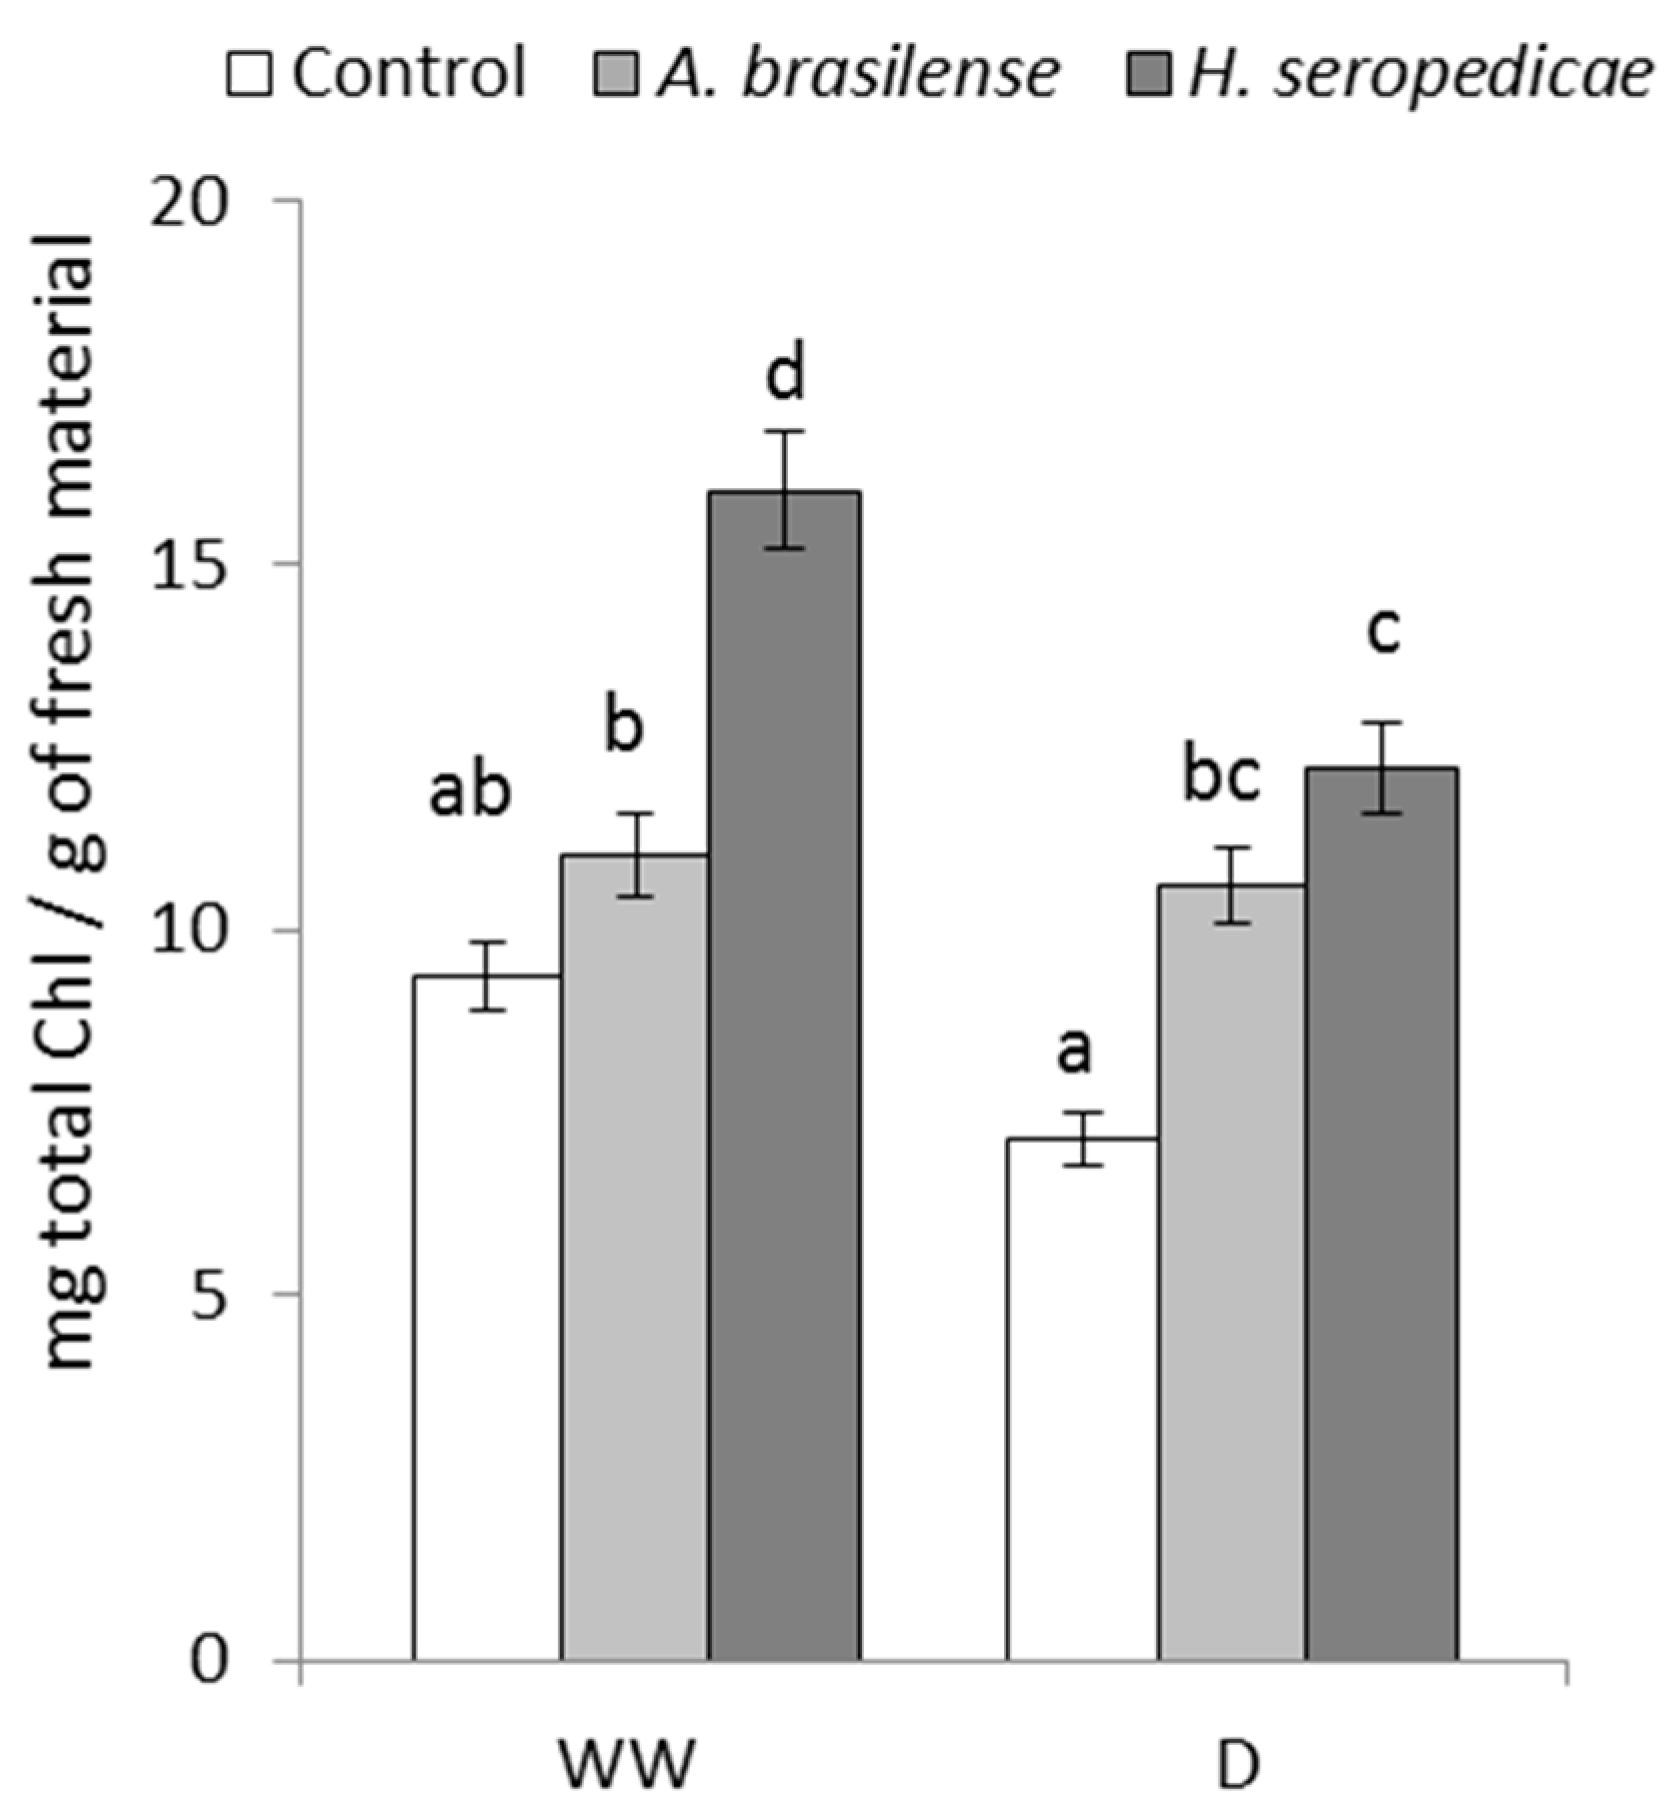
2.4.4. Total Chlorophyll (TChl) Content

The TChl content was determined using the method described by Inskeep and Bloom [66]. We collected three random samples (leaves from three plants) from each treatment condition 20 DAS. Disc-shaped samples (1-cm in diameter) were taken from the leaves, avoiding the central nervation. The weight of four discs per sample was taken. Then the four discs were placed in Eppendorf tubes containing 2 mL of dimethylformamide (DMF). The tubes were covered with aluminum foil and stored in a refrigerator at 4 °C for 4 days. The absorbance of each sample was then read at 647, 652, and 664 nm using a spectrophotometer. Chlorophyll content in mg total chlorophyll per g fresh weight was expressed.

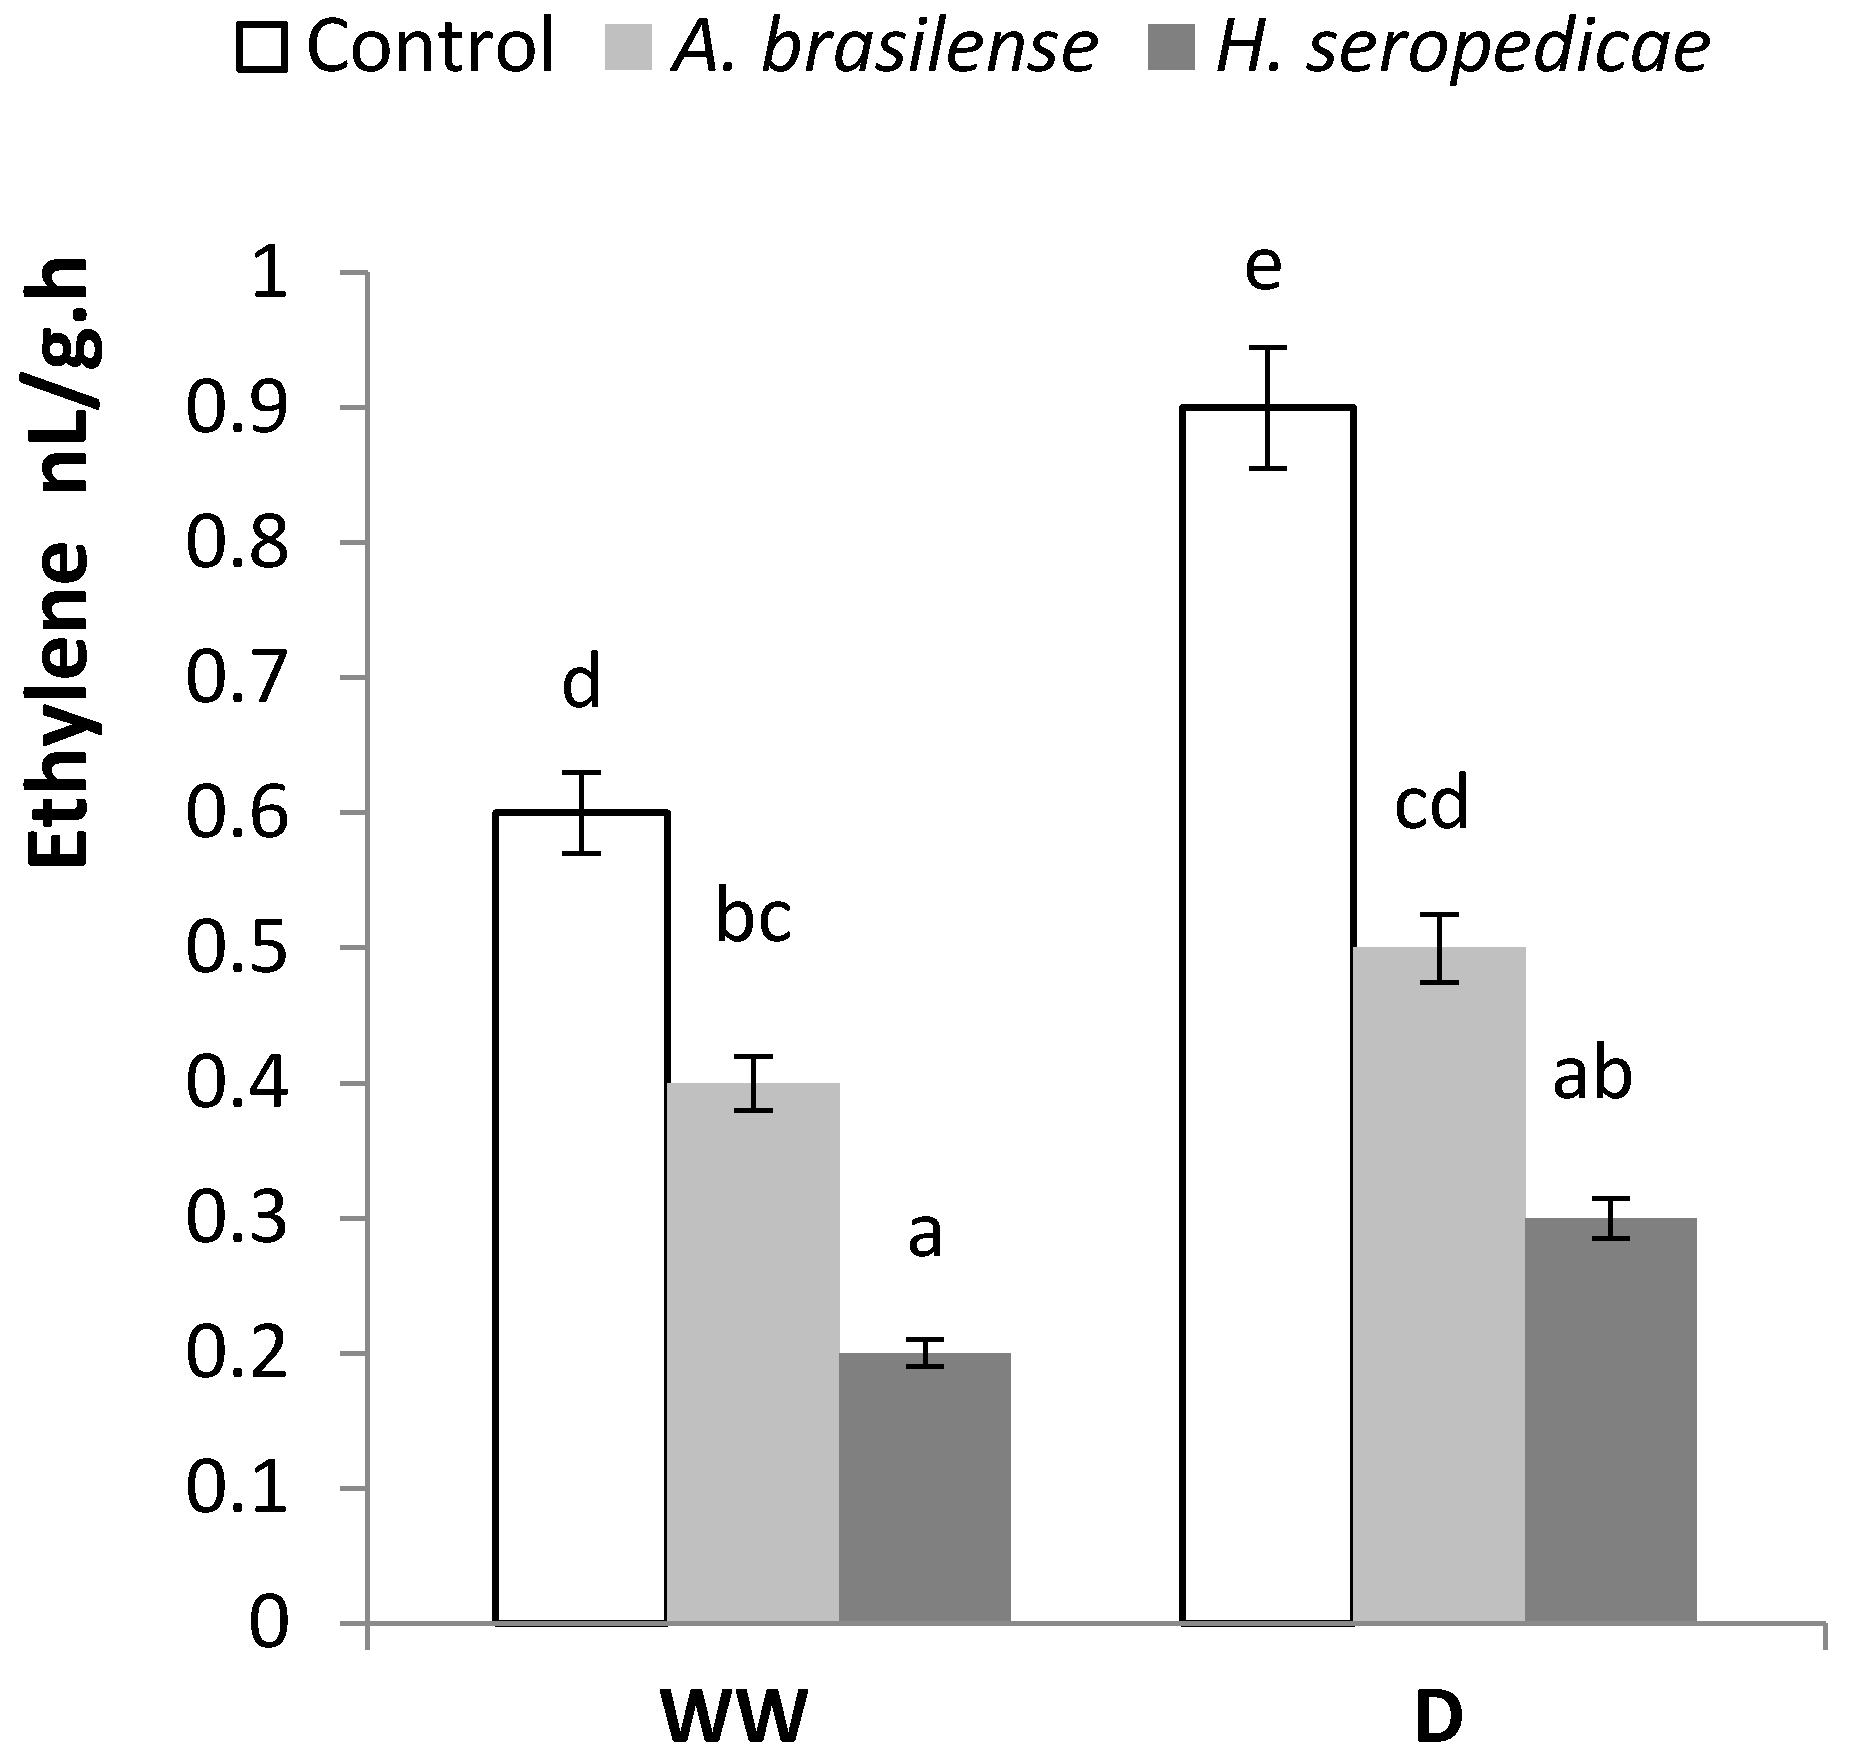
2.4.5. ABA and Ethylene Content

In order to determine the ABA content, we collected three random samples (entire plants) from each treatment condition 20 DAS. Then we performed an extraction using the methods of Kelen et al. [67] and Iriti et al. [68]. For analysis, we used an Agilent 1100 Series HPLC with a Zorbax Eclipse XDB C18 column (150 × 4.6 mm; 5 μm particle size). The mobile phase was MeOH:H2O 70:30, pH 4.0; flux was 0.5 mL/min; and UV detection was at 265 nm. The injection volume was 20 μL, and the ABA retention time was 3.9 min.
In order to determine the ethylene content, we randomly collected three leaves per treatment condition 20 DAS. These leaves were placed in 10-mL jars with 1 mL of the regulator solution (50 mM Na2HPO4/NaH2PO4, pH 6.8). The jars were sealed with a rubber septum and incubated for 24 h at 25 °C in the dark. Ethylene production was measured using gas chromatography [34].

2.4.6. Relative Water Content (RWC)

In order to determine the RWC, we collected six random samples (the last leaf completely enlarged) from each treatment condition 20 DAS, to assess the fresh weight. We determined the weight of the completely turgid sample and the dry weight according to the methods of Naveed et al. [55]. To evaluate the RWC we used the following equation [69]:
RWC   ( % )   = Fresh   weight     Dry   weight Completely   turgid   weight     Dry   weight ×   100

2.4.7. Malondialdehyde (MDA) Content

To determine the MDA content, we collected four random samples (entire plants) from each treatment condition 20 DAS. These fresh samples were homogenized in a 20% p/v trichloroacetic acid (TCA) solution and centrifuged at 3500× g for 20 min. A 1-mL aliquot of the supernatant was added to 1 mL of 20% TCA solution plus 0.5% (p/v) thiobarbituric acid and 100 μL of butylated hydroxytoluene (from a 4% solution in ethanol). This mixture was heated at 95 °C for 30 min, cooled on ice, and centrifuged at 10,000× g for 15 min. We determined the absorbance of an aliquot of the supernatant at 532 nm and subtracted the value for non-specific absorption at 600 nm. The concentration of thiobarbituric acid reactive substances (TBARS) was calculated using an extinction coefficient of 155 mM−1 cm−1 as described by Heath and Packer [70].

2.4.8. Proline Content

To determine the proline content, we collected four random samples (entire plants) from each treatment condition 20 DAS. With a cold (4 °C) mortar, we ground 0.5 g of fresh tissue and homogenized it in 5 mL of 3% (p/v) sulfosalicylic acid to precipitate the proteins. The homogenized sample was filtered through Whatman grade 2 filter paper, and 2 mL of the filtered sample or the proline standard was placed in a test tube and was mixed with 2 mL of glacial acetic acid and 2 mL of acid ninhydrin. The solution was shaken and incubated at 100 °C for 1 h, creating a colored complex. The reaction was stopped by placing the sample in an ice bath, then 4 mL of toluene was added to each test tube and each sample was mixed using a vortex mixer for 15–20 s. Finally, the two phases were allowed to separate. The organic (toluene) phase was recovered, and measurements were performed at 520 nm using a spectrophotometer [71].

2.4.9. Differential Expression of the ZmVP14 Gene

The ZmVP14 gene was amplified and quantified using real time PCR and SYBR® Green to detect the product. Random samples were collected 20 DAS. The primers used to amplify the ZmVP14 gene were as follows: forward 5′-TCCACGACTTCGCCATCACC-3′ and reverse 5′-CGTCTTCTCCTTGTCCAGCACC-3′. The products were quantified relative to the control treatment (WW) using the 2−ΔΔCT method [72]. Expression of the endogenous actin gene served as a control using the following primers: forward 5′-TCCTGACACTGAAGTACCCGATTG-3′ and reverse 5′-CGTTGTAGAAGGTGTGATGCCAGTT-3′. We used the following amplification conditions: 50 °C for 2 min; 95 °C for 10 min; (95 °C for 15 s and 54 °C for 1 min) × 45 cycles. We used a dissociation curve (melting) to make sure there was no nonspecific amplification.

3. Results

3.1. Symbiotic Development

In the WW condition, the A. brasilense concentration was 9.2 × 10⁵ CFU mL−1 and the H. seropedicae concentration was 6.3 × 10⁵ CFU mL−1. In the D condition, the A. brasilense concentration was 2.5 × 10⁴ CFU mL−1 and the H. seropedicae concentration was 4.2 × 10⁴ CFU mL−1.

3.2. TB Production

Figure 1 shows the TB production results. In the D condition, plants inoculated with H. seropedicae showed 29.5% greater TB production than control plants, and plants inoculated with A. brasilense showed 26% greater TB production than control plants. In the WW condition, plants inoculated with A. brasilense showed 15% greater TB production than control plants.

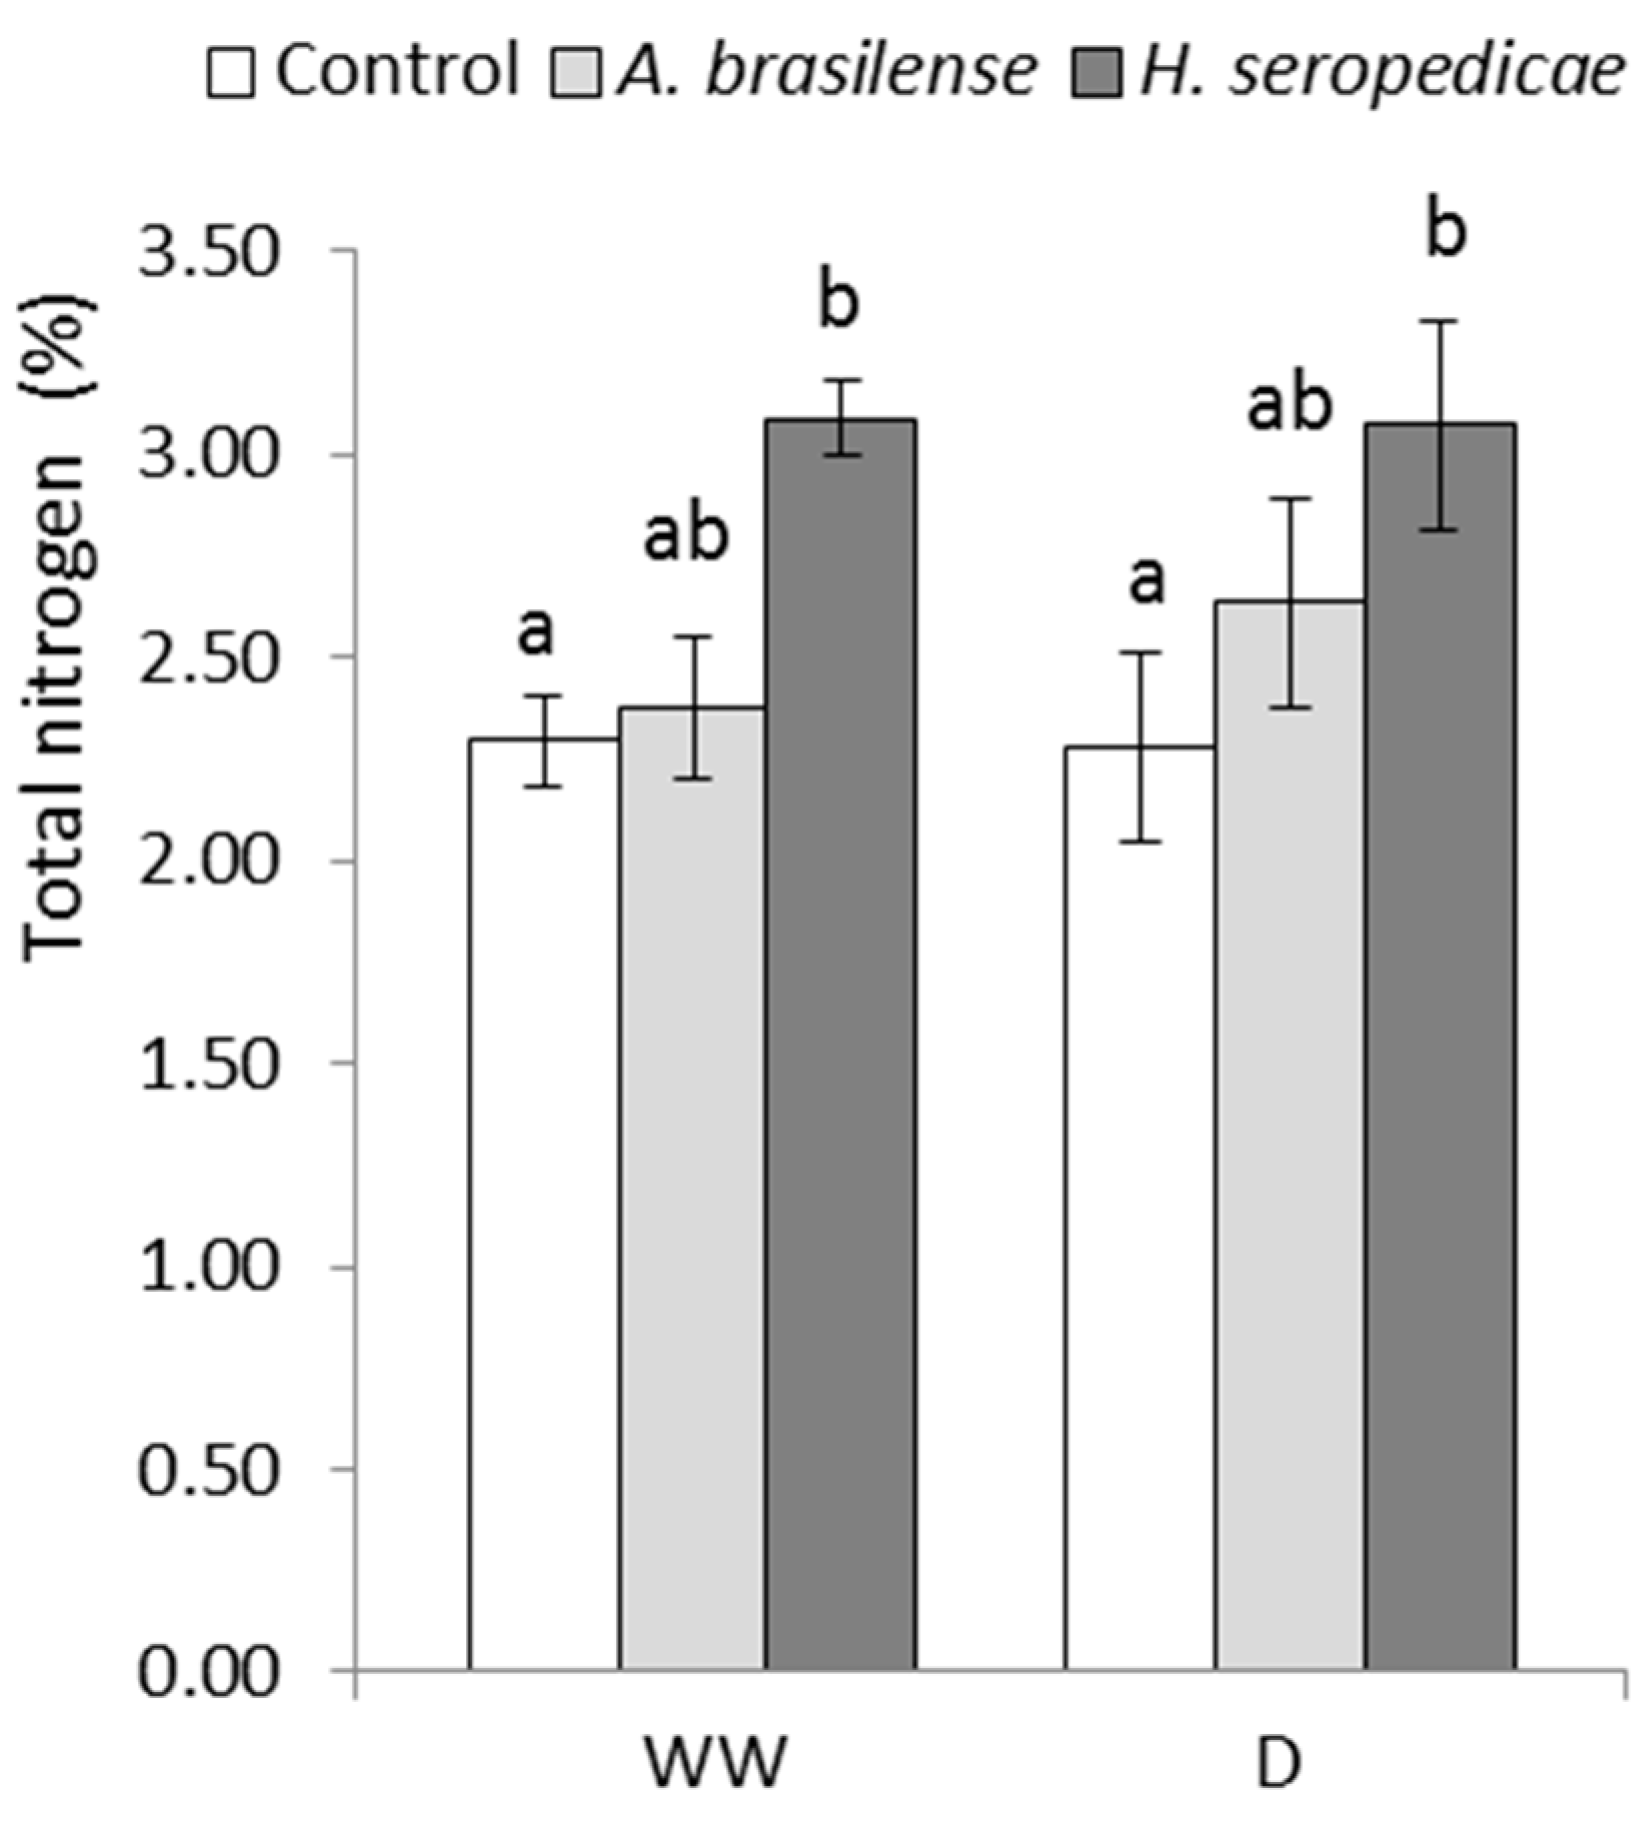
3.3. TC and TN Content

Figure 2 shows the TC content results. In the D condition, plants inoculated with either PGPR had significantly (41%) more TC than control plants (p ≤ 0.05). In the WW condition, plants inoculated with either PGPR produced approximately 45% more TC than the control plants. There were significant differences in the TN content according to the inoculated bacterial strain, as shown in Figure 3. In both the D and the WW conditions, plants inoculated with H. seropedicae produced 26% more TN than the controls (p ≤ 0.05).

3.4. TChl Content

Figure 4 shows the TChl content results. In the D condition, plants inoculated with either PGPR had significantly more TChl than control plants (p ≤ 0.05). Specifically, plants inoculated with H. seropedicae produced 41.4% more TChl than controls, and plants inoculated with A. brasilense produced 33% more. In the WW condition, plants inoculated with H. seropedicae produced 41% more TChl than control plants (p ≤ 0.05).

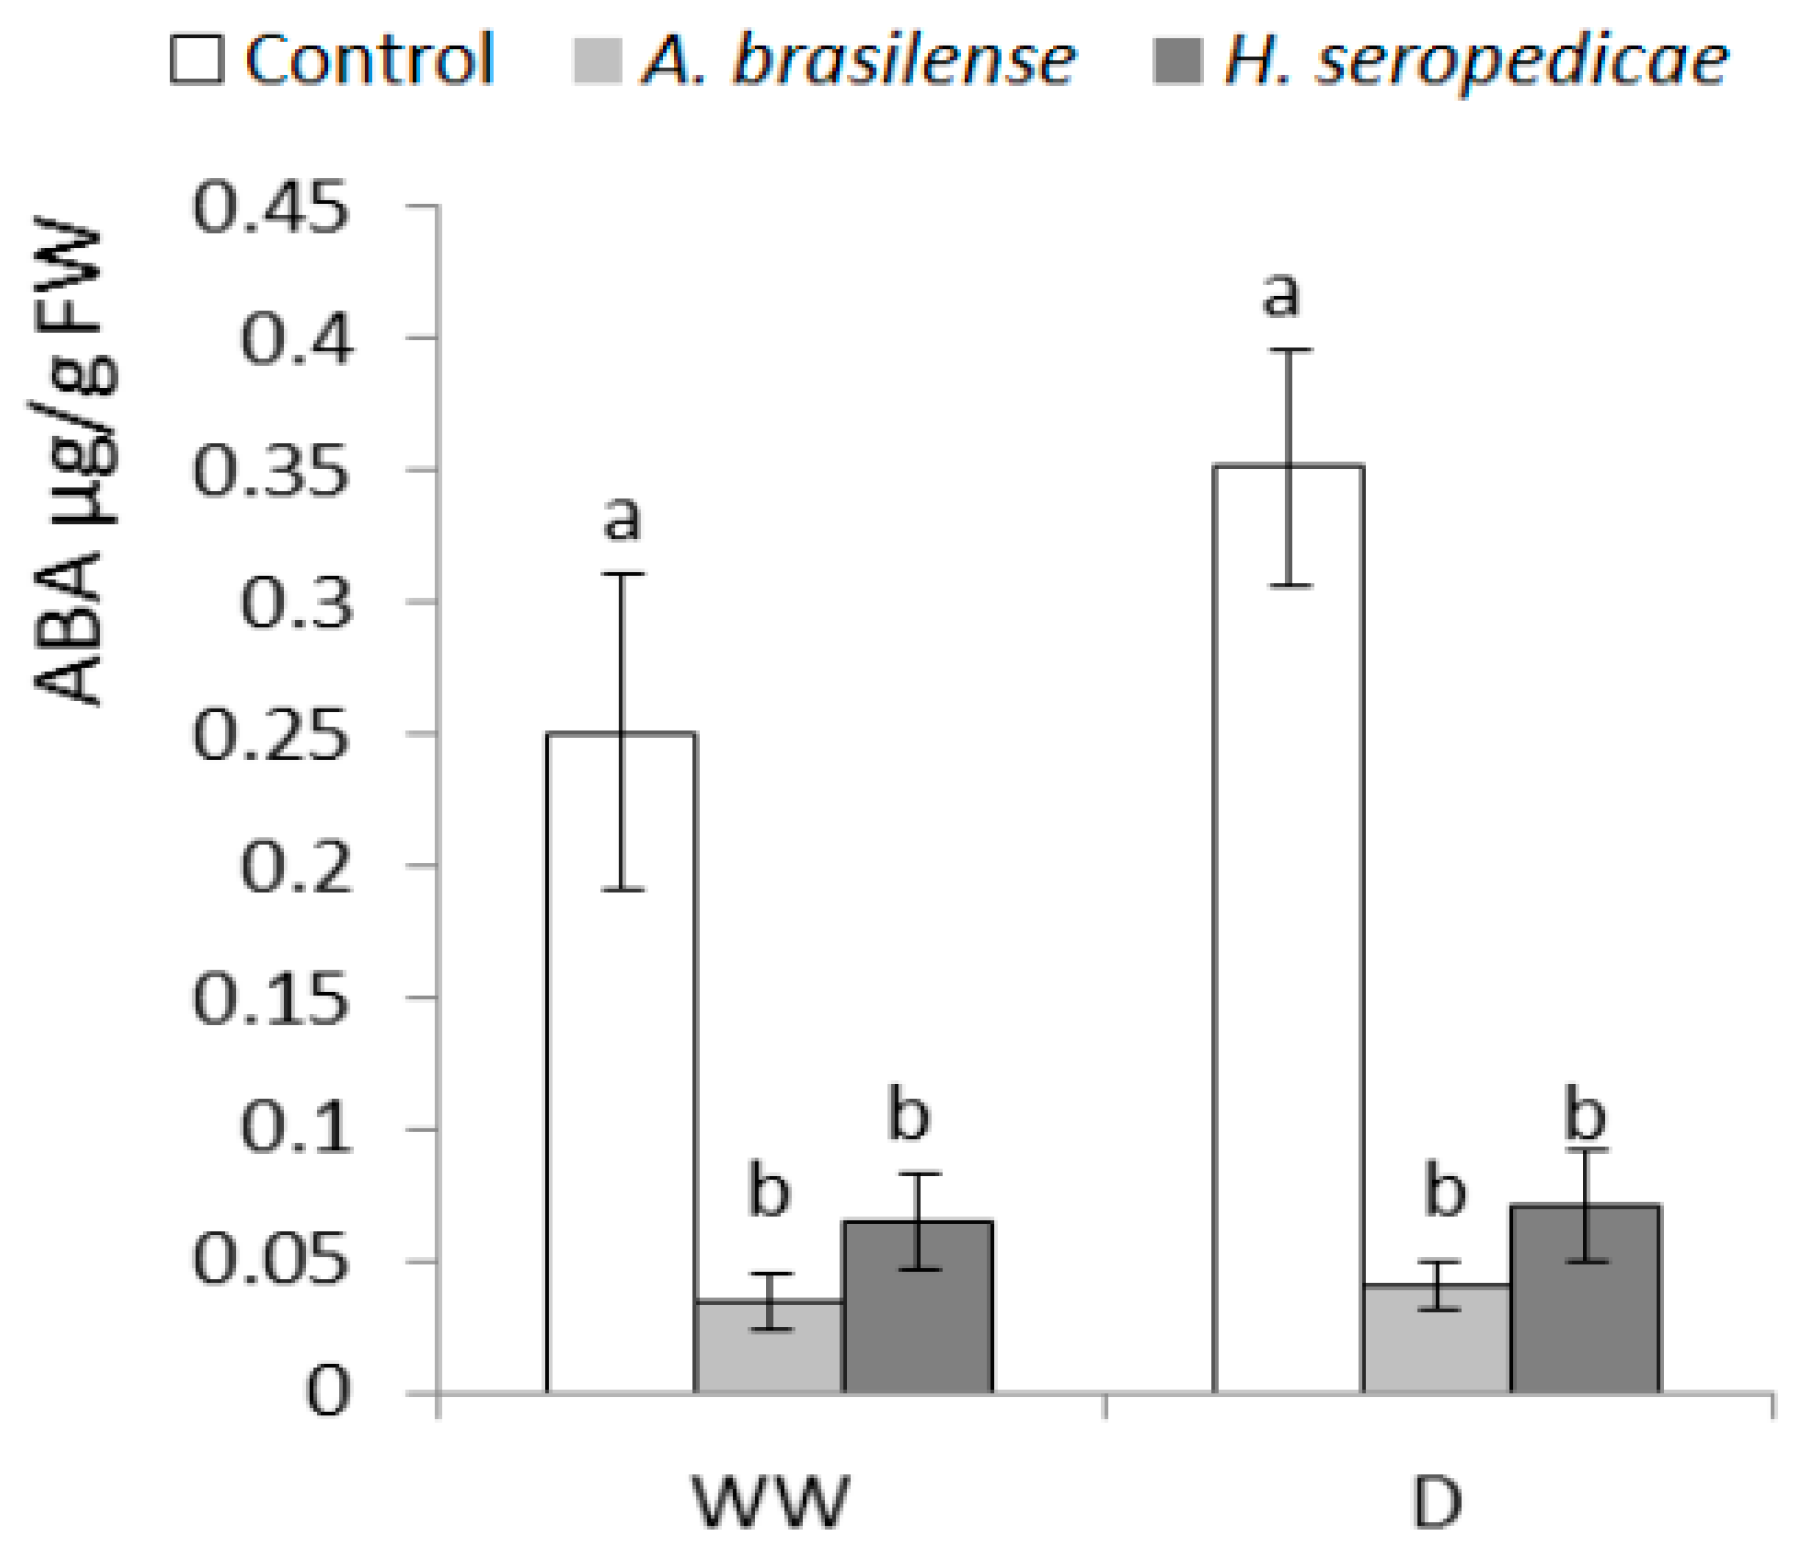
3.5. ABA and Ethylene Content

Figure 5 shows the ABA content results. In both the WW and D conditions, control plants had significantly higher ABA content than the PGPR-inoculated plants (p ≤ 0.05). In the inoculated plants, the ABA content did not differ significantly in D versus WW conditions. In control plants, the ABA content was 30% higher in plants in D conditions versus WW conditions, but this difference was not significant. Figure 6 shows the ethylene content results. In both the WW and D conditions, control plants showed higher ethylene content than inoculated plants, and the ethylene content was not significantly different in the inoculated plants in D versus WW conditions (inoculation * drought interaction p = 0.0297).
As can be seen in Figure 6, the ethylene production is increased in non-inoculated plants under drought conditions.

3.6. RWC

Table 1 shows the RWC (%) of the plants according to inoculation status and hydric conditions. The RWC was higher in plants inoculated with either PGPR in both WW and D conditions. In the WW condition, plants inoculated with A. brasilense had the highest RWC (10% higher) versus control plants. In the D condition, plants inoculated with H. seropedicae had the highest RWC (5.5% higher) versus control plants.

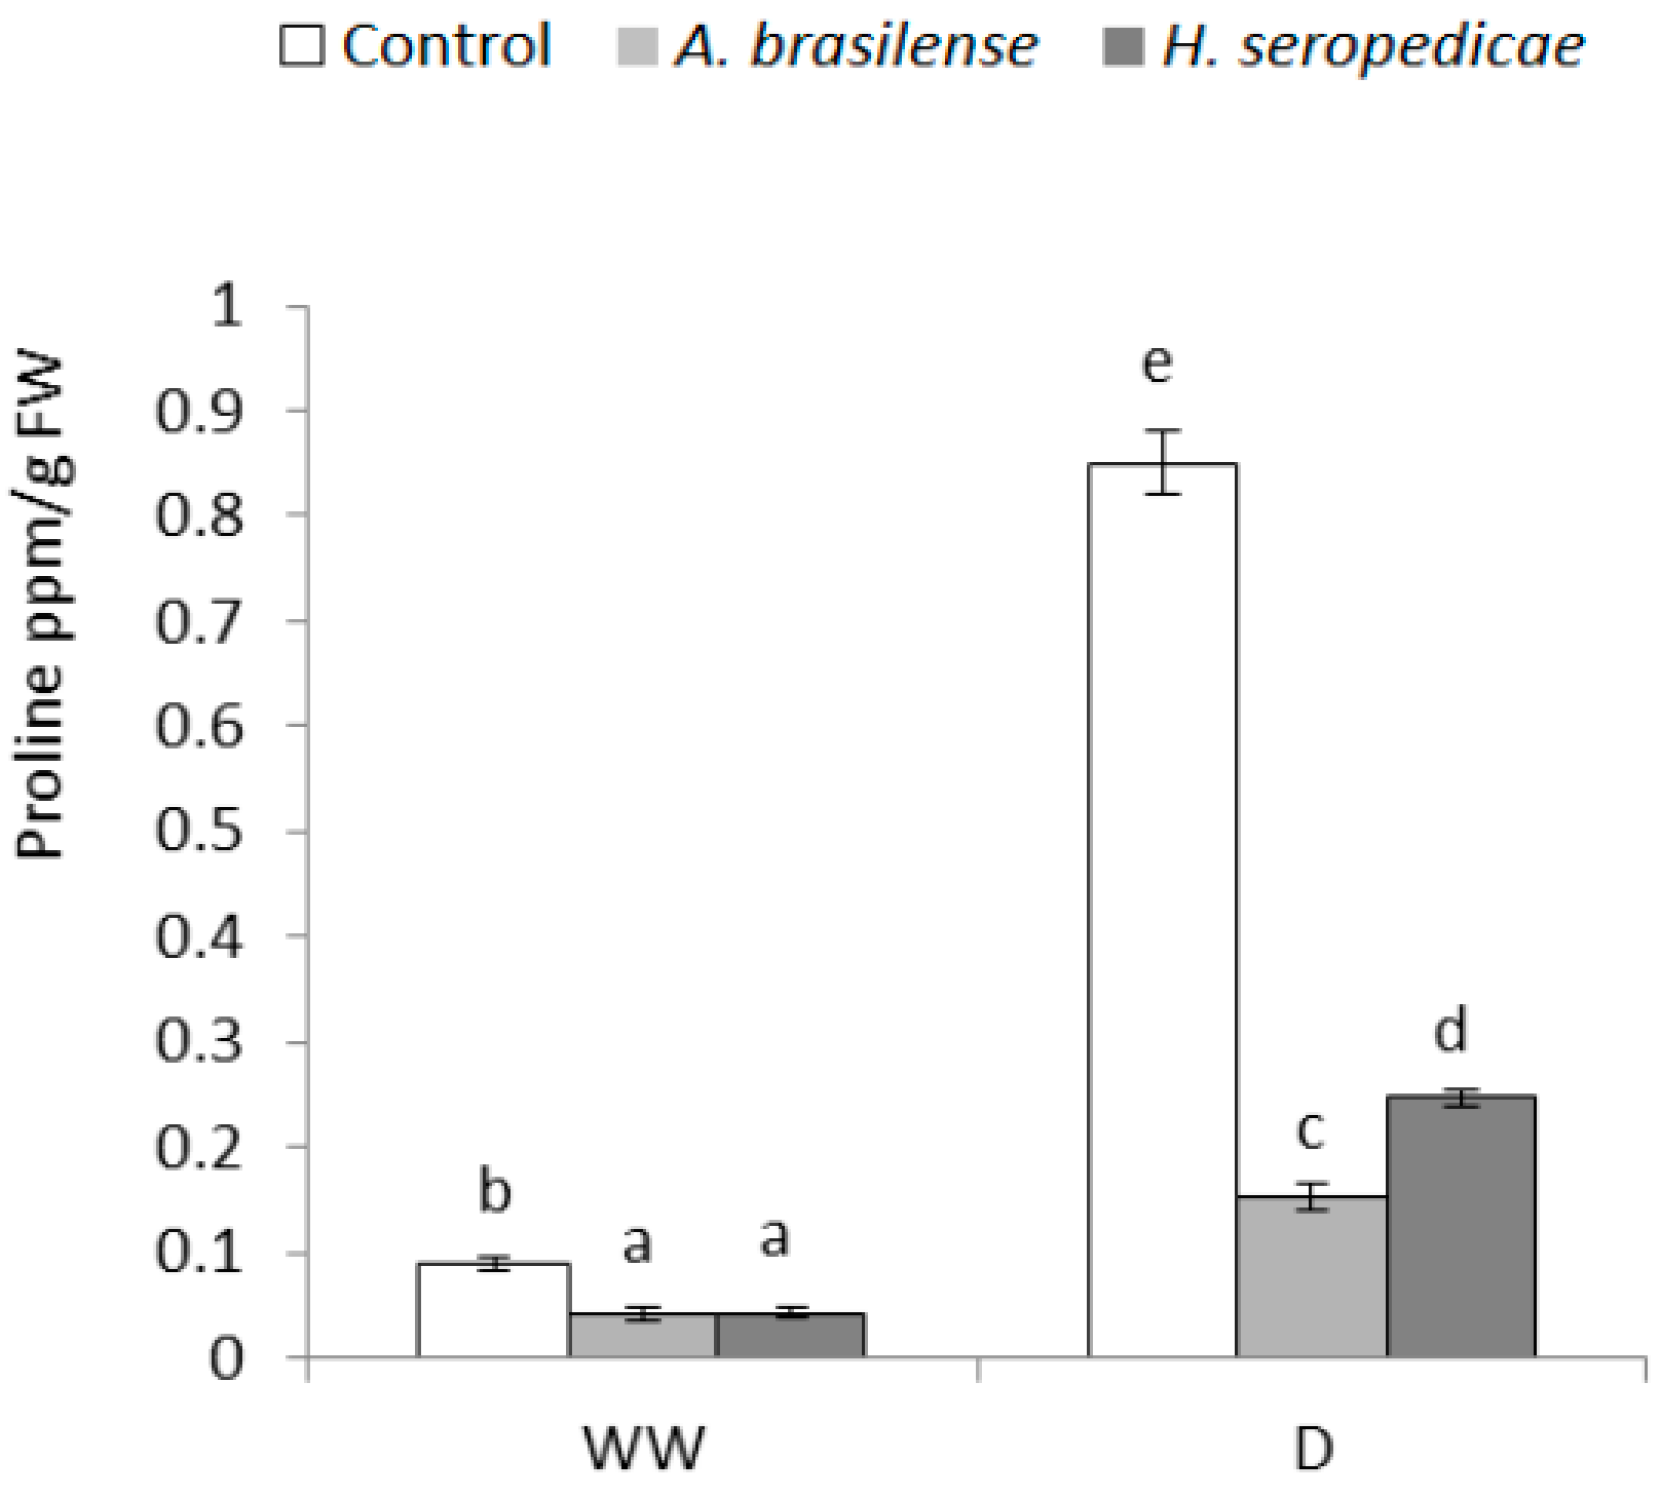
3.7. Proline Content
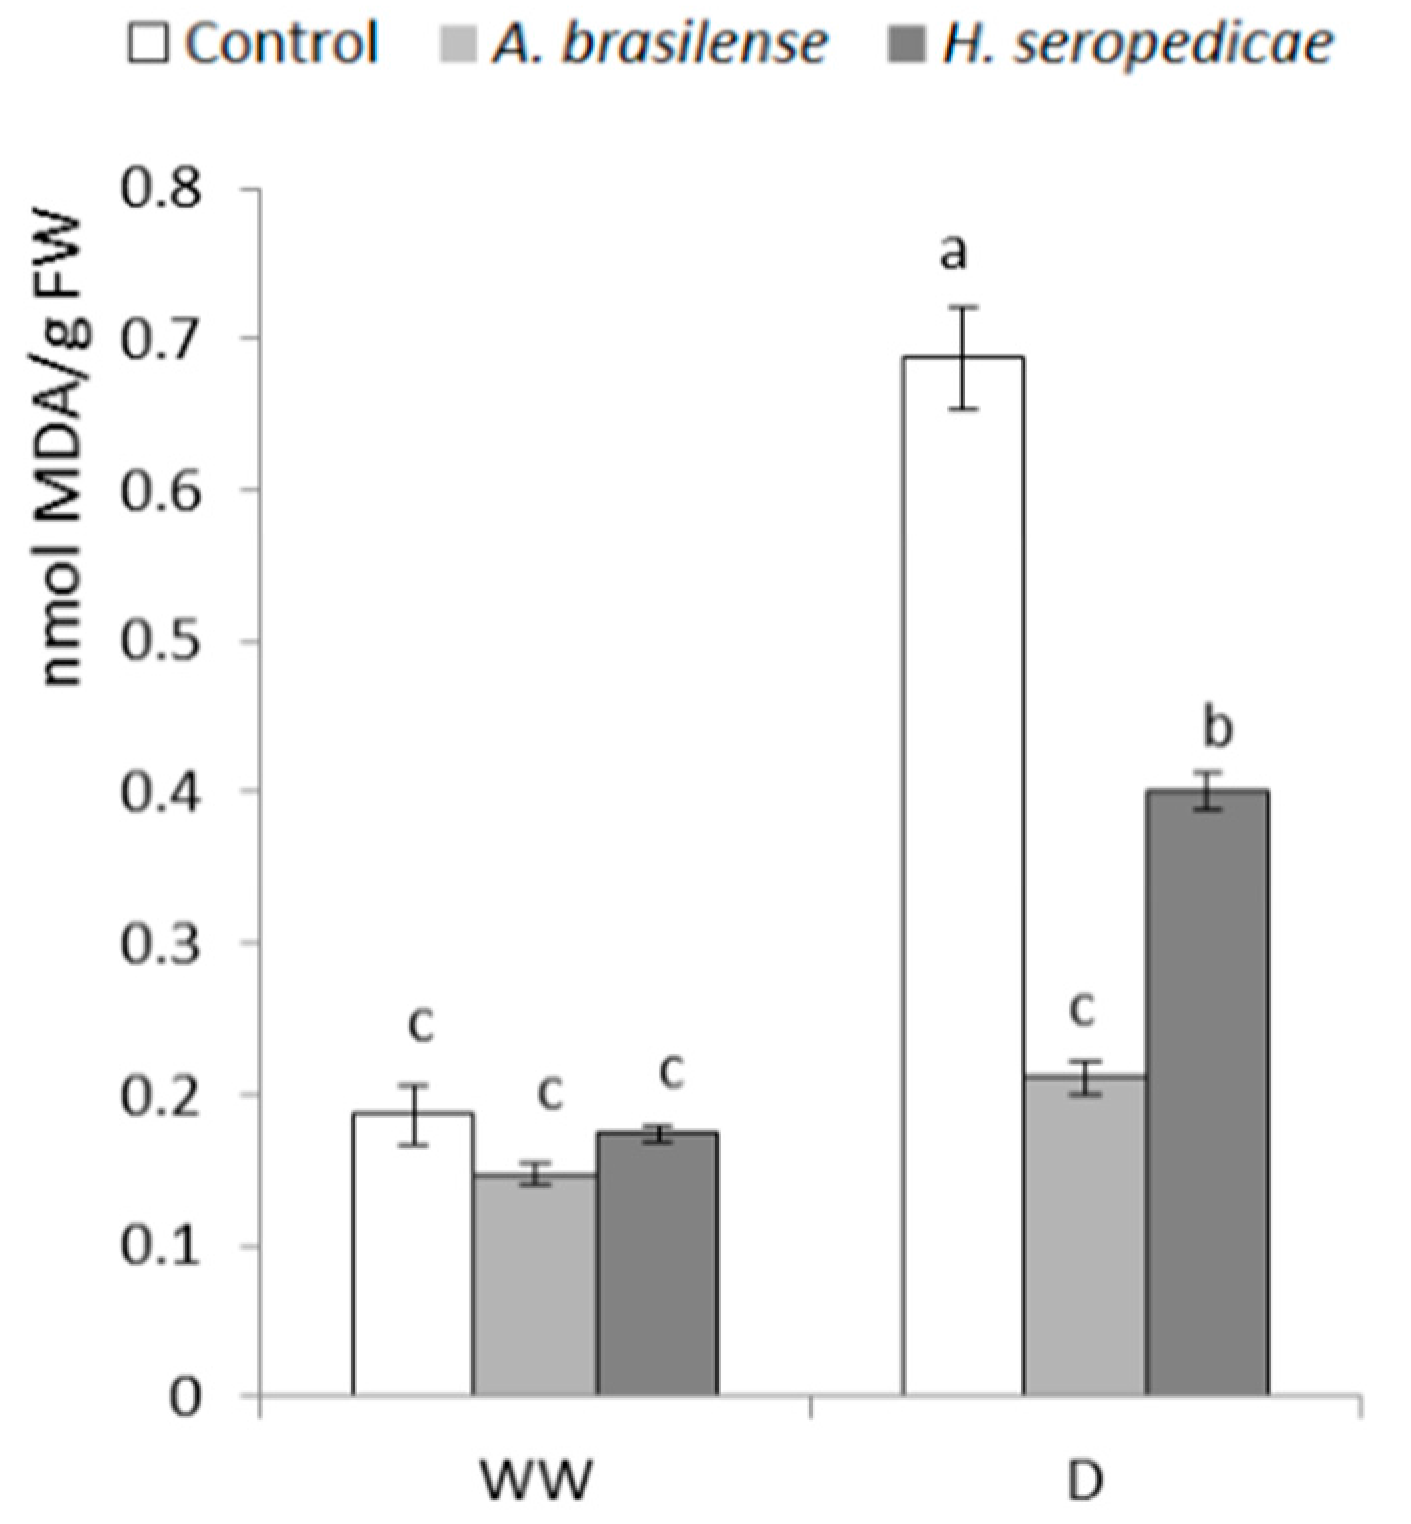
Proline is an indicator of osmoregulation, and was measured during the experiment; the results are indicated in Figure 7. In the WW condition, control plants had a higher proline concentration than plants inoculated with either PGPR. In the D condition, the proline levels increased significantly over time regardless of inoculation status, but control plants had the highest concentration of proline relative to the WW condition (eight-fold more proline than control plants in the WW condition). In the same condition hydric (D), the plants inoculated with H. seropedicae showed the greatest increase (four-fold) in proline over time, while those inoculated with A. brasilense showed a two-fold increase in the proline level (p ≤ 0.05).

3.8. MDA Content

MDA was quantified in order to assess the integrity of the cellular membranes, since MDA acts as a lipid peroxidation indicator. Figure 8 shows the MDA content results 20 DAS. In the D condition, plants inoculated with A. brasilense showed better membrane stability than plants inoculated with H. seropedicae and control plants. In the D condition, plants inoculated with H. seropedicae showed a two-fold increase in MDA content over time, while control plants showed a >300% increase in MDA content. In the D condition, plants inoculated with A. brasilense showed a ~30% increase in MDA content, which was not significantly different than control plants in the WW condition (p ≤ 0.05).

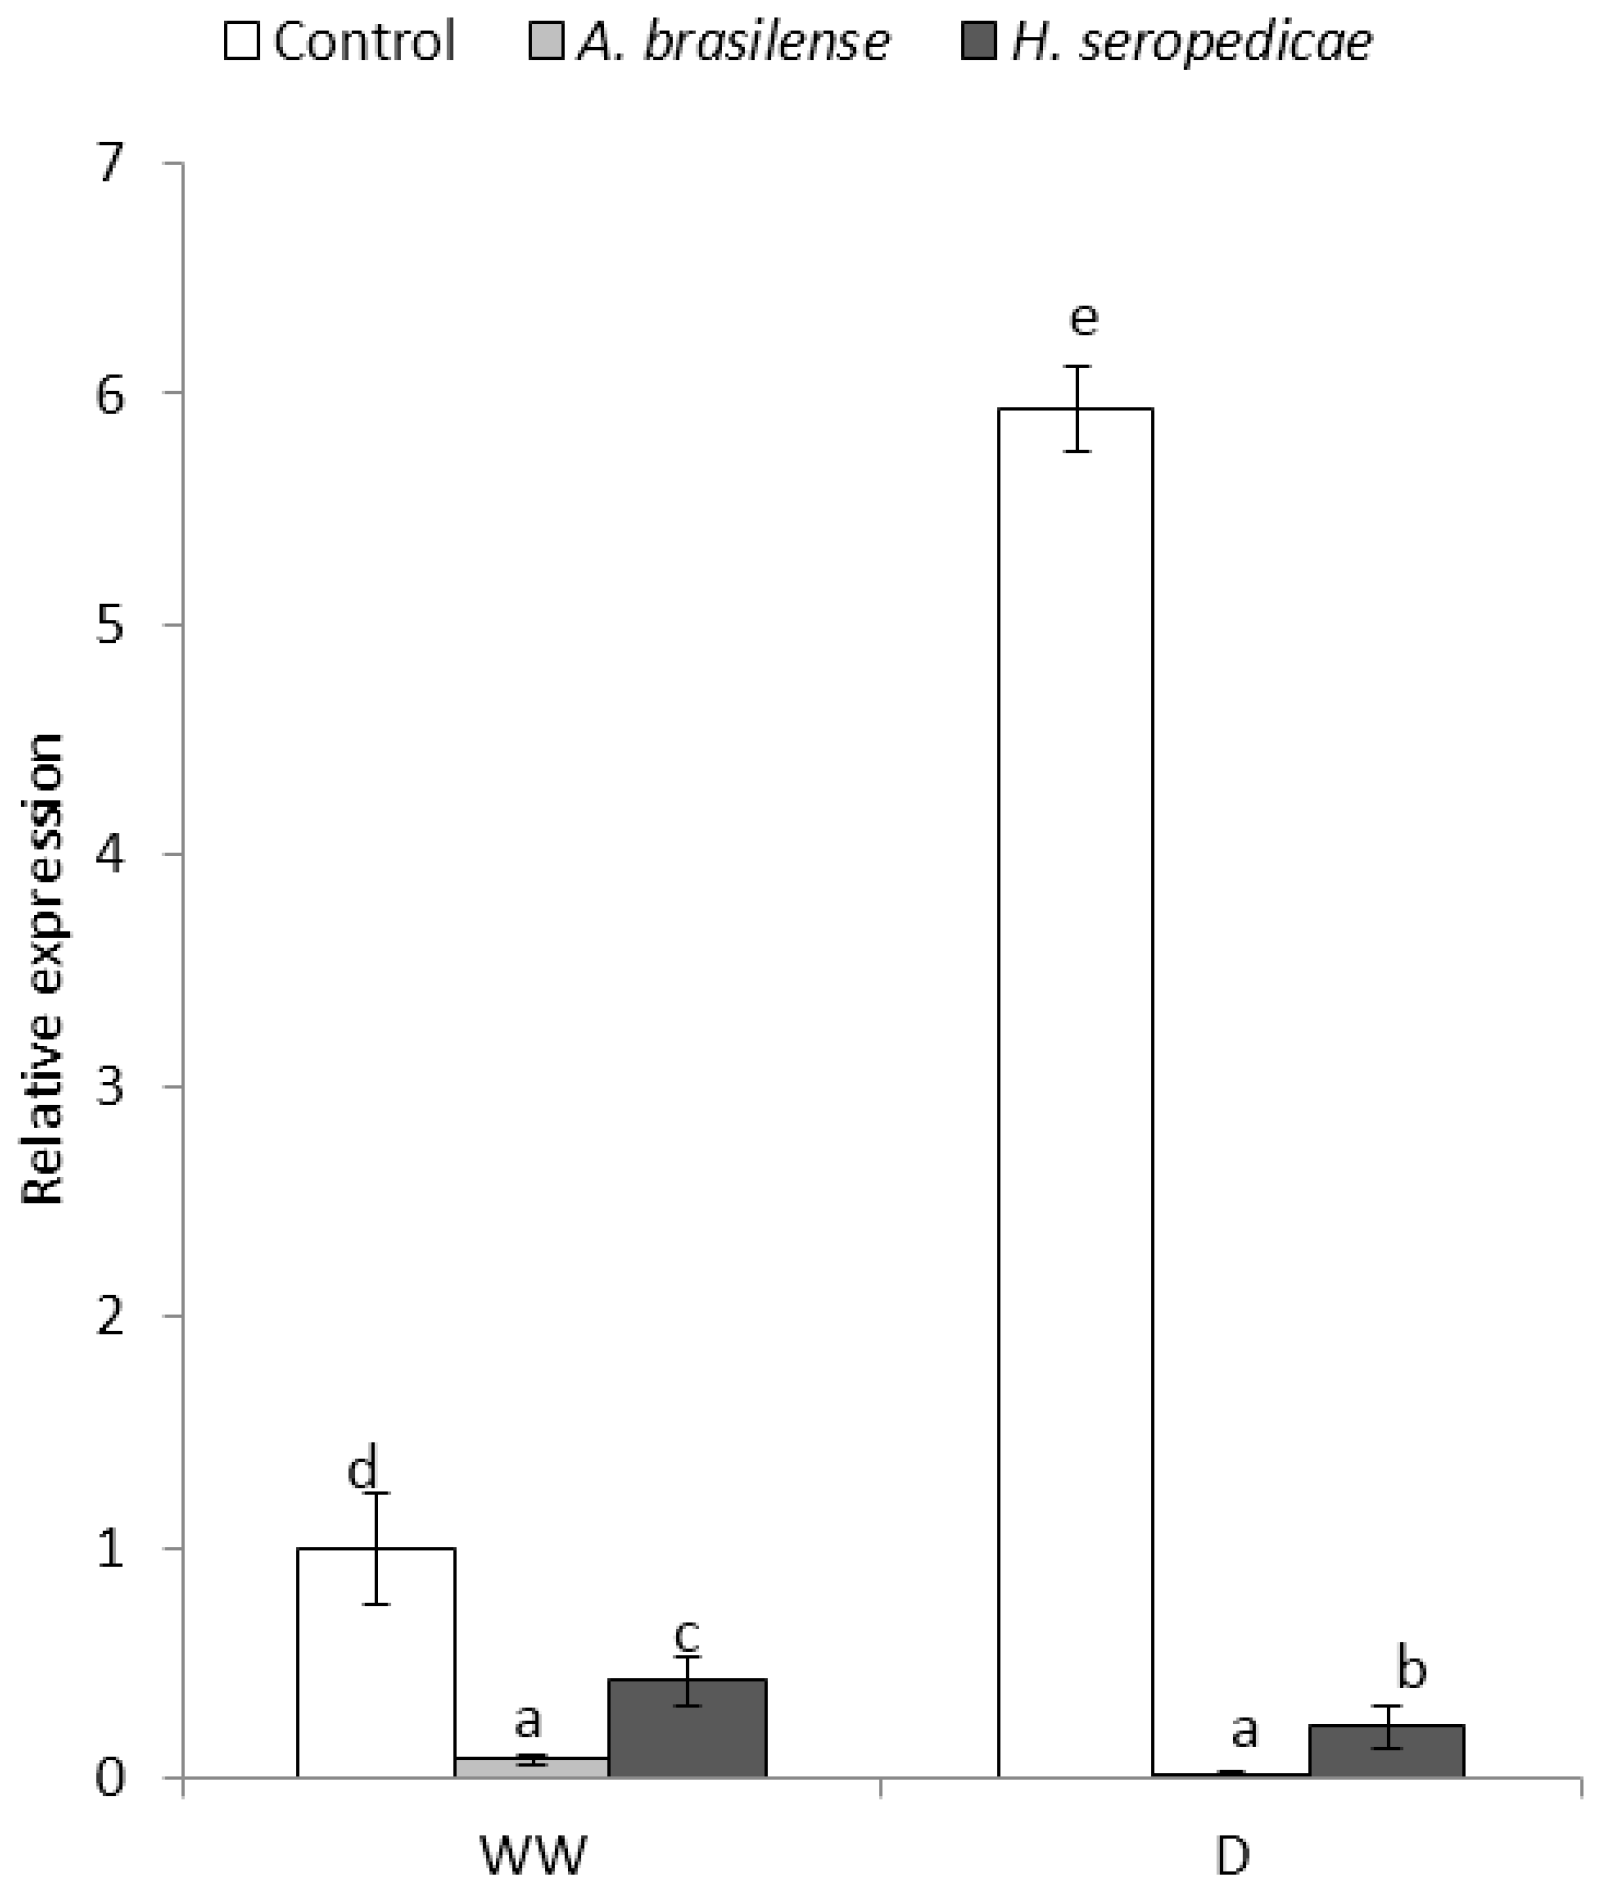
3.9. Expression of the ZmVP14 Gene

Figure 9 shows the results of the ZmVP14 gene expression analysis. The gene expression level was considered to be 1 in control plants in the WW condition. In the WW condition, ZmVP14 gene expression was higher in control plants than in PGPR-inoculated plants. In control plants, ZmVP14 gene expression was almost five-fold higher in the D condition than in the WW condition. ZmVP14 gene expression was almost undetectable in plants inoculated with A. brasilense in both water conditions.

4. Discussion

Determination of the CFU mL−1 in the root samples showed that A. brasilense and H. seropedicae effectively colonized the corn seedlings in plants grown in both the WW and D conditions. Thus, bacterial growth was not significantly affected by the D condition, and our results were similar to those obtained by Ruíz-Sánchez et al. [53] with arbuscular micorrhiza and Azospirillum sp. in rice, by Naveed et al. [55] with other PGPR (Burkholderia sp. and Enterobacter sp.) in corn, and by Cohen et al. [56] with Azospirillum sp. in Arabidopsis thaliana.
The TB results (Figure 1) showed that the bacteria promoted vegetal growth in both hydric conditions, but the differences in growth in inoculated versus control plants were greater in D conditions (p = 0.0213). These results may be related to a lower level of stress in the inoculated plants, which showed higher TB. Our results were similar to those obtained by Ruíz-Sánchez et al. [53], Naveed et al. [55], Cohen et al. [56], and Tiwari et al. [67], using Pseudomonas sp. in Cicer arietinum L. There were other interesting results related to TB production that are shown in Figure 2, Figure 3 and Figure 4, in terms of the TC, TN, and TChl contents. Specifically, when TB was greater, TC (p = 0.0473) and TN (p = 0.0482) were also higher regardless of the inoculation status or hydric condition. These results may be related to a lower level of stress in inoculated plants, which showed lower ABA content. This allowed the stomata to stay open, even in drought conditions, and also allowed better fixation of atmospheric CO2 in the carbon compounds used in biomass production. These results are in accordance with those of Naveed et al. [55], who showed higher CO2 assimilation levels, stomatal conductance, and transpiration rate in inoculated corn plants in a drought condition. On the other hand, the higher nitrogen content of inoculated plants may be related to the nitrogen that is provided by the PGPR, which is the result of the biological fixation of atmospheric N2 [47]. Regarding the TChl content (p = 0.0273), the available nitrogen could have been used for chlorophyll synthesis, which could explain the differences between the TChl in inoculated plants versus control plants. Our results were consistent with those of Ruíz-Sánchez et al. [53], Naveed et al. [55], and Cohen et al. [56].
In this experiment, we found the highest concentrations of ABA in control plants in the D condition. This shows that stressful conditions trigger a signaling pathway that leads to ABA biosynthesis. The control seedlings in the D condition were pale green, smaller in size (lower aerial and radical biomass), had lower turgidity (the plants had fallen or were low), and showed other symptoms of stress, such as leaf senescence. This is an expected result, according to Salinas-Moreno and González-Hernández [73], who showed that a decrease in the hydric potential of corn leaves increased ABA production. In drought conditions, this process prevents the plant from losing water through transpiration. In turn, this decreases the photosynthesis rate, which leads to the observed loss of color (chlorophyll) and slowed or halted growth. The ABA concentration results (Figure 5) showed that in the WW condition, control plants had a mean of 0.25 μg/gFW ABA, whereas inoculated plants had a mean of 0.05 μg/gFW ABA. In the D condition, control plants showed an increase in the ABA concentration, whereas inoculated plants did not show a similar response. Our results showed that inoculation with PGPR had a negative effect on ABA synthesis in plants. The inoculated plants had a lower stress level. On the other hand, the inoculated plants did not show significant changes in the level of ZmVP14 expression in both WW and D conditions, except those inoculated with H. seropedicae, which showed significant differences (inoculation * drought interaction p < 0.0001). It has been reported that Bacillus subtilis, strain B26, confers resistance against drought stress in Brachypodium and this is linked to the upregulation of expression of several drought-responsive genes and the modulation of the DNA methylation process [74].
The ethylene content was also lower in inoculated plants (p = 0.0297) (Figure 6). This could be due to the effects of the ACC deaminase produced by the bacteria, which may mitigate the deleterious effect of ethylene, thereby lowering the stress level in the plant and promoting plant growth [18]. The RWC (Table 1) was higher in inoculated plants in both the WW and D conditions (p < 0.0001). It is possible that the integrity of the plasma membrane was better due to the beneficial effects of inoculation, which may have mitigated the damage by the ROS produced in stressful conditions. This was shown by Naveed et al. [55], Cohen et al. [56], and Tiwari et al. [57]. The MDA results (Figure 8) showed that the PGPR-inoculated seedlings had a lower level of damage during drought stress, because in the D condition, control plants showed a significant increase in the MDA level, which is an indicator of the damage caused by lipid peroxidation. The consequences of lipid peroxidation include deterioration in the cellular membrane, deterioration in the selective permeability of the membrane and, finally, cellular disintegration and death. We observed the same effects in the MDA concentrations in the WW condition regardless of inoculation status, demonstrating that inoculation does not affect the MDA in WW conditions. In contrast, in the D condition, there was a clear difference between inoculated plants and control plants. These results may be related to the RWC (Table 1), because less cellular membrane damage would allow a higher water content level inside the cells. Importantly, MDA analysis is used in tolerance tests of corn crops under hydric stress [75], and these results show that in D conditions, the bacteria help plants reduce membrane damage.
Osmolytes synthesis induced by ABA can also help protect plants against drought stress. Notably, osmolytes can decrease the hydric potential of the cell and thereby help it to avoid losing water. Proline is one type of osmolyte, and in this experiment, changes in the ABA concentration (Figure 5) were similar to the changes in the proline concentration (Figure 7) in the D condition. It appeared that non-inoculated plants could not use this physiological tool to maintain the RWC because the control plants were not turgid and, in many cases, had fallen. These results are in agreement with those obtained by Paleg et al. [76] and Ashraf and Foolad [77], who showed that proline synthesis can be seen as a symptom of stress in plants, taking into account their pathway of induction. It has also been reported that plants that were inoculated with PGPR (Pseudomonas sp.) bacteria showed a decrease in proline synthesis when they were under water stress [57]. This would be in agreement with our results, that plants inoculated with A. brasilense and H. seropedicae may have a lower level of stress in the D condition than control plants. Finally, Bogges et al. [78] determined that water stress prevents the oxidation of proline, resulting in higher proline levels. In addition, other researchers working with Bacillus megaterium BOFC15 and Arabidopsis found that spermidine improves drought tolerance in plants, which was associated with altered levels of ABA [79].
The ZmVP14 gene expression analysis (Figure 9) showed that in both the WW and D conditions, control plants showed higher ZmVP14 expression than inoculated plants. Notably, ZmVP14 expression is induced when the seedlings are under hydric stress. Our data showed that there were differences in inoculated versus non-inoculated plants in terms of genetic regulation of ABA production that resulted in differences in ABA concentration. Our ZmVP14 expression results agreed with those of Tan et al. [16] and with those of Chernys and Zeevaart [80], who showed that the inhibition of ZmVP14 affects ABA biosynthesis. Furthermore, the inoculated plants grew well even under conditions of water deficit, in addition the inoculated plants had lower levels of ABA than the control plants. Perhaps because there is some kind of mechanism induced for the presence of bacteria that allows sustaining a good growth and good water ratio in the plant.
Our results are probably in agreement and are explained by the highest RWC, such as that found in References [81,82]. Changes in the distribution of specific fatty acids in the root [82] and polyamines—compounds that regulate the growth of plants, including cadaverine—have been correlated with the growth of the radical system or the mitigation of osmotic stress in some plant species [83].

5. Conclusions

Our results show that the inoculation of maize plants with A. brasilense or H. seropedicae bacteria had important effects on the tolerance of the maize to drought stress. The bacteria had direct effects on physiological, biochemical, and molecular processes that resulted in reduced stress to the plants. The results very clearly show a large positive effect on growth under drought and a reduced stress response (proline, ethylene), and reduced evidence of stress (MDA). Inoculation with these bacteria also greatly affected % total carbon, ABA content, and ethylene content. These results suggest that these bacteria could be used to reduce the effects of drought stress and thereby improve the productivity of maize crops in drought conditions.

Acknowledgments

This work was supported by grants from the Universidad de Buenos Aires to José Alfredo Curá (20020130100161BA).

Author Contributions

Diego Reinaldo Franz, Julián Ezequiel Filosofía, Lautaro Exequiel Burgueño and José Alfredo Curá did the experiments; José Alfredo Curá, Diego Reinaldo Franz, Julián Ezequiel Filosofía and Karina Beatríz Balestrasse conceived the research and did the interpretation of data; José Alfredo Curá, Diego Reinaldo Franz and Julián Ezequiel Filosofía wrote the paper.

Conflicts of Interest

The authors declare no conflict of interest.

References

  1. FAOSTAT. 2013. Available online: http://faostat3.fao.org/browse/Q/QC/S (accessed on 1 October 2016).
  2. Daryanto, S.; Wang, L.; Jacinthe, P.A. Global Synthesis of Drought Effects on Maize and Wheat Production. PLoS ONE 2016, 11, e0156362. [Google Scholar] [CrossRef] [PubMed] [Green Version]
  3. Heiniger, R.W. Irrigation and Drought Management; North Carolina State University: Raleigh, NC, USA, 2000. [Google Scholar]
  4. Edmeades, G.O. Drought tolerance in maize: An emerging reality. A feature. In Global Status of Commercialized Biotech/GM Crops; James, C., Ed.; ISAAA Brief No. 39; ISAAA: Ithaca, NY, USA, 2008; p. 275. [Google Scholar]
  5. Lata, C.; Muthamilarasan, M.; Prasad, M. Drought stress responses and signal transduction in plants. In Elucidation of Abiotic Stress Signaling in Plants; Pandey, G.K., Ed.; Springer: New York, NY, USA, 2015; pp. 195–225. [Google Scholar]
  6. Lata, C.; Jha, S.; Dixit, V.; Sreenivasulu, N.; Prasad, M. Differential antioxidative responses to dehydration-induced oxidative stress in core set of foxtail millet cultivars (Setaria italica L.). Protoplasma 2011, 248, 817–828. [Google Scholar] [CrossRef] [PubMed]
  7. Silveira, J.A.G.; Costa, R.C.L.; Oliveira, J.T.A. Drought-induced effects and recovery of nitrate assimilation and nodule activity in cowpea plants inoculated with Bradyrhizobium spp. under moderate nitrate level. Braz. J. Microbiol. 2001, 32, 187–194. [Google Scholar] [CrossRef]
  8. Riera, M.; Valon, C.; Fenzi, F.; Giraudat, J.; Leung, J. The genetics of adaptive responses to drought stress: Abscisic acid-dependent and abscisic acid-independent signalling components. Physiol. Plant. 2005, 123, 111–119. [Google Scholar] [CrossRef]
  9. Shinozaki, K.; Yamaguchi-Shinozaki, K. Molecular responses to dehydration and low temperature: Differences and cross-talk between two stress signaling pathways. Curr. Opin. Plant Biol. 2000, 3, 217–223. [Google Scholar] [CrossRef]
  10. Finkelstein, R.R.; Gampala, S.S.; Rock, C.D. Abscisic acid signaling in seeds and seedlings. Plant Cell 2002, 14, S15–S45. [Google Scholar] [PubMed]
  11. Xiong, L.; Schumaker, K.; Zhu, J.K. Cell signaling during cold, drought and salt stress. Plant Cell 2002, 14, S165–S183. [Google Scholar] [CrossRef] [PubMed]
  12. Taiz, L.; Zeiger, E. Responses and Adaptations to Abiotic Stress. In Plant Physiology, 5th ed.; Sinauer Associates Inc.: Sunderland, MA, USA, 2012; pp. 755–778. [Google Scholar]
  13. Zeevaart, J.A.D. Abscisic acid metabolism and its regulation. In Biochemistry and Molecular Biology of Plant Hormones; Hooykaas, P.J., Hall, M.A., Libbenga, R., Eds.; Elsevier: Amsterdam, The Netherlands, 1999; pp. 189–207. [Google Scholar]
  14. Xiong, L.; Zhu, J.K. Regulation of Abscisic acid biosynthesis. Plant Physiol. 2003, 133, 29–36. [Google Scholar] [CrossRef] [PubMed]
  15. Thompson, A.J.; Jackson, A.C.; Symonds, R.C.; Mulholland, B.J.; Dadswell, A.R.; Blake, P.S.; Burbidge, A.; Taylor, I.B. Ectopic expression of a tomato 9-cis-epoxycarotenoid dioxygenase gene causes over-production of abscisic acid. Plant J. 2000, 23, 363–374. [Google Scholar] [CrossRef] [PubMed]
  16. Tan, B.C.; Schwartz, S.H.; Zeevaart, J.A.D.; McCarty, D.R. Genetic control of abscisic acid biosynthesis in maize. Proc. Natl. Acad. Sci. USA 1997, 94, 12235–12240. [Google Scholar] [CrossRef] [PubMed]
  17. Hardoim, P.R.; van Overbeek, L.S.; van Elsas, J.D. Properties of bacterial endophytes and their proposed role in plant growth. Trends Microbiol. 2008, 16, 463–471. [Google Scholar] [CrossRef] [PubMed]
  18. Glick, B.R. Modulation of plant ethylene levels by the bacterial enzyme ACC deaminase. FEMS Microbiol. Lett. 2005, 251, 1–7. [Google Scholar] [CrossRef] [PubMed]
  19. Inzé, D.; van Montagu, M. Oxidative stress in plants. Curr. Opin. Biotechnol. 1995, 6, 153–158. [Google Scholar] [CrossRef]
  20. Storz, G.; Imalay, J.A. Oxidative stress. Curr. Opin. Microbiol. 1999, 2, 188–194. [Google Scholar] [CrossRef]
  21. Chugh, V.; Kaur, N.; Gupta, A.K. Evaluation of oxidative stress tolerance in maize (Zea mays L.) seedlings in response to drought. Indian J. Biochem. Biophys. 2011, 48, 47–53. [Google Scholar] [PubMed]
  22. Chimenti, C.A.; Marcantonio, M.; Hall, A.J. Divergent selection for osmotic adjustment results in improved drought tolerance in maize (Zea mays L.) in both early growth and flowering phases. Field Crop. Res. 2005, 95, 305–315. [Google Scholar] [CrossRef]
  23. Parra-Quezada, R.A.; Rodríguez-Ontiveros, J.L.; González-Hernández, V.A. Transpiración, potencial hídrico y prolina en zarzamora bajo déficit hídrico. Terra Latinoam. 1999, 17, 125–130. [Google Scholar]
  24. Kloepper, J.W.; Schroth, M.N. Plant growth promoting rhizobacteria on radishes. In Proceedings of the 4th International Conference on Plant Pathogenic Bacteria, Angers, France, August 1978; I.N.R.A.: Angers, France; Volume 2, pp. 879–882. [Google Scholar]
  25. Glick, B.R. The enhancement of plant growth by free-living bacteria. Can. J. Microbiol. 1995, 41, 109–117. [Google Scholar] [CrossRef]
  26. Bashan, Y.; Holguin, G. Proposal for the division plant growth promoting rhizobacteria into two classifications: Biocontrol-PGPB (plant growth-promoting bacteria) and PGPB. Soil Biol. Biochem. 1998, 30, 1225–1228. [Google Scholar] [CrossRef]
  27. Kloepper, J.W.; Rodriguez-Ubana, R.; Zehnder, G.W.; Murphy, J.F.; Sikora, E.; Fernández, C. Plant root-bacterial interactions in biological control of soilborne diseases and potencial extensión to systemic and foliar diseases. Australas. Plant Pathol. 1999, 28, 21–26. [Google Scholar] [CrossRef]
  28. Bashan, J.; Holguin, G. Root-to-root travel of the benefitial bacterium Azospirillum brasilense. Appl. Environ. Microbiol. 1997, 60, 2120–2131. [Google Scholar]
  29. Cassán, F.; Bottini, R.; Schneider, G.; Piccoli, P. Azospirillum brasilense and Azospirillum lipoferum hydrolize conjugates of GA20 and metabolize the resultant aglycones to GA1 in seedlings of rice dwarf mutants. Plant Physiol. 2001, 125, 2053–2058. [Google Scholar] [CrossRef] [PubMed]
  30. Bottini, R.; Cassán, F.; Picolli, P. Gibberellin production by bacteria and its involvement in plant growth promotion and yield increase. Appl. Microbiol. Biotechnol. 2004, 65, 497–503. [Google Scholar] [CrossRef] [PubMed]
  31. Ribaudo, C.M.; Rondanini, D.P.; Trinchero, G.D.; Curá, J.A. Effect of Herbaspirillum seropedicae inoculation on maize nitrogen metabolism. Maydica 2006, 51, 481–485. [Google Scholar]
  32. De Salamone, I.G.; Döbereiner, J. Maize genotype effects on the response to Azospirillum inoculation. Biol. Fertil. Soils 1996, 21, 193–196. [Google Scholar] [CrossRef]
  33. Ribaudo, C.M.; Paccusse, N.A.; Rondanini, D.P.; Curá, J.A.; Fraschina, A.A. Maize-Azospirillum association: Effects on the dry matter yield and nitrate reductase activity. Agric. Trop. Subtrop. 1998, 31, 61–70. [Google Scholar]
  34. Ribaudo, C.M.; Krumpholz, E.M.; Cassán, F.D.; Bottini, R.; Cantore, M.L.; Curá, J.A. Azospirillum sp. promotes growth of tomato plants by modulating the levels of root-produced ethylene. J. Plant Growth Regul. 2006, 24, 175–185. [Google Scholar] [CrossRef]
  35. Nico, M.; Ribaudo, C.M.; Gori, J.I.; Cantore, M.L.; Curá, J.A. Uptake of phosphate and promotion of vegetative growth in glucose-exuding rice plants (Oryza sativa) inoculated with plant growth-promoting bacteria. Appl. Soil Ecol. 2012, 65, 190–195. [Google Scholar] [CrossRef]
  36. Nielsen, T.H.; Sorensen, D.; Tobiasen, C.; Andersen, J.B.; Christeophersen, C.; Givskov, M.; Sorensen, J. Antibiotic and biosurfactant properties of cyclic lipopeptides produced by fluorescent Pseudomonas spp. from the sugar beet rhizosphere. Appl. Environ. Microbiol. 2002, 63, 3416–3423. [Google Scholar] [CrossRef]
  37. Raaijmakers, J.M.; Vlami, M.; de Souza, J.T. Antibiotic production by bacteria biocontrol agents. Antonie Van Leeuwenhoek 2002, 81, 537–547. [Google Scholar] [CrossRef] [PubMed]
  38. Whipps, J.M. Microbial interactions and biocontrol in the rhizosphere. J. Exp. Bot. 2001, 52, 487–511. [Google Scholar] [CrossRef] [PubMed]
  39. Frankowski, J.; Lorito, M.; Scala, F.; Schmidt, R.; Berg, G.; Bahl, H. Purification and properties of two chitinolytic enzymes of Serratia plymuthica HRO-C48. Arch. Microbiol. 2001, 176, 421–426. [Google Scholar] [CrossRef] [PubMed]
  40. Dong, Y.H.; Zhang, X.F.; Xu, J.L.; Zhang, L.H. Insecticidal Bacillus thuringiensis silences Erwinia carotovora virulence by a new form of microbial antagonism, signal interference. Appl. Environ. Microbiol. 2004, 70, 954–960. [Google Scholar] [CrossRef] [PubMed]
  41. Kloepper, J.W. Plant growth-promoting rhizobacteria (other systems). In Azospirillum/Plant Associations; Okon, Y., Ed.; CRC Press: Boca Raton, FL, USA, 1995; pp. 137–166. [Google Scholar]
  42. Bashan, Y.; Holguin, G. Azospirillum—Plant relationships: Environmental and physiological advances (1990–1996). Can. J. Microbiol. 1997, 43, 103–121. [Google Scholar] [CrossRef]
  43. Holguin, G.; Patten, C.L.; Glick, B.R. Genetics and molecular biology of Azospirillum. Biol. Fertil. Soils 1999, 29, 10–23. [Google Scholar] [CrossRef]
  44. Steenhoudt, O.; Vanderleyden, J. Azospirillum, a free-living nitrogen fixing bacterium closely associated grasses: Genetic, biochemical and ecological aspects. FEMS Microbiol. Rev. 2000, 24, 487–506. [Google Scholar] [CrossRef] [PubMed]
  45. Okon, Y.; Labandera-González, C.A. Agronomic applications of Azospirillum: An evaluation of 20 years worldwide field inoculation. Soil Biol. Biochem. 1994, 26, 1591–1601. [Google Scholar] [CrossRef]
  46. Boddey, R.M.; de Oliveira, O.C.; Urquiaga, S.; Reis, V.M.; Olivares, F.L.; Baldani, V.L.D.; Döbereiner, J. Biological nitrogen fixation associated with sugar cane and rice: Contributions and prospects for improvement. Plant Soil 1995, 174, 195–209. [Google Scholar] [CrossRef]
  47. James, E.K. Nitrogen fixation in endophytic and associative symbiosis. Field Crop Res. 2000, 65, 197–209. [Google Scholar] [CrossRef]
  48. Elbeltagy, A.; Nishioka, K.; Sato, T. Endophytic colonization and in plant nitrogen fixation by a Herbaspirillum sp. isolated from wild rice species. Appl. Environ. Microbiol. 2001, 67, 5285–5293. [Google Scholar] [CrossRef] [PubMed]
  49. James, E.K.; Gyaneshwar, P.; Mathan, N.; Barraquio, W.L.; Reddy, P.M.; Iannetta, P.P.M.; Olivares, F.L.; Ladha, J.K. Infection and colonization of rice seedlings by the plant growth promotion bacterium Herbaspirillum seropedicae Z67. Mol. Plant Microbe Interact. 2002, 15, 894–906. [Google Scholar] [CrossRef] [PubMed]
  50. Casanovas, E.M.; Barassi, C.A.; Sueldo, R.J. Azospirillum inoculation mitigates water stress effects in maize seedlings. Cereal Res. Commun. 2002, 30, 343–350. [Google Scholar]
  51. Marulanda, A.; Barea, J.M.; Azcón, R. Stimulation of plant growth and drought tolerance by native microorganisms (AM fungi and bacteria) from dry environments mechanisms related to bacterial effectiveness. J. Plant Growth Regul. 2009, 28, 115–124. [Google Scholar] [CrossRef]
  52. Yang, J.; Kloepper, J.W.; Ryu, C.M. Rhizosphere bacteria help plants tolerate abiotic stress. Trends Plant Sci. 2009, 14, 1–4. [Google Scholar] [CrossRef] [PubMed]
  53. Ruíz-Sánchez, M.; Armada, E.; Muñoz, Y.; García de Salamone, I.E.; Aroca, R.; Ruíz-Lozano, J.M.; Azcón, R. Azospirillum and arbuscular mycorrhizal colonization enhance rice growth and physiological traits under well-watered and drought conditions. J. Plant Physiol. 2011, 168, 1031–1037. [Google Scholar] [CrossRef] [PubMed]
  54. Nautiyal, C.S.; Srivastava, S.; Chauhan, P.S.; Seem, K.; Mishra, A.; Sopory, S.K. Plant growth-promoting bacteria Bacillus amyloliquefaciens NBRISN13 modulates gene expression profile of leaf and rhizosphere community in rice during salt stress. Plant Physiol. Biochem. 2013, 66, 1–9. [Google Scholar] [CrossRef] [PubMed]
  55. Naveed, M.; Mitter, B.; Reichenauer, T.G.; Wieczorek, K.; Sessitsch, A. Increased drought stress resilience of maize through endophytic colonization by Burkholderia phytofirmans PsJN and Enterobacter sp. FD17. Environ. Exp. Bot. 2014, 97, 30–39. [Google Scholar] [CrossRef]
  56. Cohen, A.C.; Bottini, R.; Pontin, M.; Berli, F.J.; Moreno, D.; Boccanlandro, H.; Travaglia, C.N.; Piccoli, P.N. Azospirillum brasilense ameliorates the response of Arabidopsis thaliana to drought mainly via enhancement of ABA levels. Physiol. Plant. 2015, 153, 79–90. [Google Scholar] [CrossRef] [PubMed]
  57. Tiwari, S.; Lata, C.; Chauhan, P.S.; Nautiyal, C.S. Pseudomonas putida attunes morphophysiological, biochemical and molecular responses in Cicer arietinum L. during drought stress and recovery. Plant Physiol. Biochem. 2016, 99, 108–117. [Google Scholar] [CrossRef] [PubMed]
  58. Vurukonda, S.S.K.P.; Vardharajula, S.; Shrivastava, M.; SkZ, A. Enhancement of drought stress tolerance in crops by plant growth promoting rhizobacteria. Microbiol. Res. 2016, 184, 13–24. [Google Scholar] [CrossRef] [PubMed]
  59. Döbereiner, J.; Marriel, I.E.; Nery, M. Ecological distribution of Spirillum lipoferum Beijerinck. Can. J. Microbiol. 1976, 22, 1464–1473. [Google Scholar] [CrossRef] [PubMed]
  60. FCA-UNC. Facultad de Ciencias Agropecuarias. Universidad Nacional de Córdoba. Available online: http://www.infostat.com.ar/index.php (accessed on 1 October 2016).
  61. Baldani, V.L.D.; Baldani, J.I.; Olivares, F.L.; Döbereiner, J. Identification and ecology of Herbaspirillum seropedicae and closely related Pseudomonas rubrisubalbicans. Symbiosis 1992, 13, 65–73. [Google Scholar]
  62. Murashige, T.; Skoog, F. A revised medium for rapid growth and bioassays with tobacco tissue cultures. Physiol. Plantarum 1962, 18, 100–127. [Google Scholar] [CrossRef]
  63. Rodríguez-Cáceres, E. Improved medium for isolation of Azospirillum spp. Appl. Environ. Microbiol. 1982, 44, 990–991. [Google Scholar]
  64. Walkley, A.; Black, I. An examination of the Degtjareff method and a proposed modification of the chromic matter and a proposed modification of the chromic acid titration method. Soil Sci. 1934, 34, 29–38. [Google Scholar] [CrossRef]
  65. Association of Official Analytical Chemists. Official Methods of Analysis, 12th ed.; Association of Official Analytical Chemists: Washington, DC, USA, 1975.
  66. Inskeep, W.P.; Bloom, P.R. Extinction coefficients of chlorophyll a and b in N,N-Dimethylformamide and 80% Acetone. Plant Physiol. 1985, 77, 483–485. [Google Scholar] [CrossRef] [PubMed]
  67. Kelen, M.; Cubuk Demiralay, E.; Sen, S.; Ozkan, G. Separation of Abscisic Acid, Indole-3-Acetic Acid, Gibberellic Acid in 99 R (Vitis berlandieri x Vitis rupestris) and Rose Oil (Rosa damascena Mill.) by Reversed Phase Liquid Chromatography. Turk. J. Chem. 2004, 28, 603–610. [Google Scholar]
  68. Iriti, M.; Picchi, V.; Rossoni, M.; Gomarasca, S.; Ludwig, N.; Gargano, M.; Faoro, F. Chitosan antitranspirant activity is due to abscisic acid-dependent stomatal closure. Environ. Exp. Bot. 2009, 66, 493–500. [Google Scholar] [CrossRef]
  69. Teulat, B.; Zoumarou-Wallis, N.; Rotter, B.; Ben Salem, M.; Bahri, H.; This, D. QTL for relative water content in field-grown barley and their stability across Mediterranean environments. Theor. Appl. Genet. 2003, 108, 181–188. [Google Scholar] [CrossRef] [PubMed]
  70. Heath, R.L.; Packer, L. Photoperoxidation in isolated chloroplasts. I. Kinetics and stoichiometry of fatty acid peroxidation. Arch. Biochem. Biophys. 1968, 125, 189–198. [Google Scholar] [CrossRef]
  71. Troll, W.; Lindsley, J. A photometric method for the determination of proline. J. Biol. Chem. 1955, 215, 655–660. [Google Scholar] [PubMed]
  72. Livak, K.J.; Schmittgen, T.D. Analysis of relative gene expression data using real-time quantitative PCR and the 2−ΔΔCT Method. Methods 2001, 25, 402–408. [Google Scholar] [CrossRef] [PubMed]
  73. Salinas-Moreno, Y.; González-Henández, V.A. Potencial hídrico y ácido abscísico en hoja, jilote y espiga de maíz sometido a sequía. Agricultura Técnica en México 2003, 29, 135–143. [Google Scholar]
  74. Gagné-Bourque, F.; Mayer, B.F.; Charron1, J.B.; Vali, H.; Bertrand, A.; Jabaji, S. Accelerated Growth Rate and Increased Drought Stress Resilience of the Model Grass Brachypodium distachyon Colonized by Bacillus subtilis B26. PLoS ONE 2015, 10, e0130456. [Google Scholar] [CrossRef] [PubMed]
  75. Moussa, H.R.; Abdel-Aziz, S.M. Comparative response of drought tolerant and drought sensitive maize genotypes to water stress. Aust. J. Crop. Sci. 2008, 1, 31–36. [Google Scholar]
  76. Paleg, L.G.; Stewart, G.R.; Bradbeer, J.W. Proline and Glycine Betaine Influence Protein Solvation. Plant Physiol. 1983, 75, 974–978. [Google Scholar] [CrossRef]
  77. Ashraf, M.; Foolad, M.R. Roles of glycine betaine and proline in improving plant abiotic stress resistance. Environ. Exp. Bot. 2005, 59, 206–216. [Google Scholar] [CrossRef]
  78. Bogges, S.F.; Aspinnal, D.; Paleg, L.G. Inhibition of Proline Oxidation by Water Stress. Plant Physiol. 1977, 59, 930–932. [Google Scholar] [CrossRef]
  79. Zhou, C.; Ma, Z.; Zhu, L.; Xiao, X.; Xie, Y.; Zhu, J.; Wang, J. Rhizobacterial Strain Bacillus megaterium BOFC15 Induces Cellular Polyamine Changes that Improve Plant Growth and Drought Resistance. Int. J. Mol. Sci. 2016, 17, 976. [Google Scholar] [CrossRef] [PubMed]
  80. Chernys, J.T.; Zeevaart, J.A.D. Characterization of the 9-cis-Epoxycarotenoid Dioxygenase Gene Family and the Regulation of Abscisic Acid Biosynthesis in Avocado. Plant Physiol. 2000, 124, 343–353. [Google Scholar] [CrossRef] [PubMed]
  81. El-Komy, H.M.; Hamdia, M.A.; El-Baki, G.K.A. Nitrate reductase in wheat plants grown under water stress and inoculated with Azospirillum spp. Biol. Plant. 2003, 46, 281–287. [Google Scholar] [CrossRef]
  82. Creus, C.M.; Graziano, M.; Casanovas, E.M.; Pereyra, M.A.; Simontacchi, M.; Puntarulo, S.; Barassi, C.A.; Lamattina, L. Nitric oxide is involved in the Azospirillum brasilense-induced lateral root formation in tomato. Planta 2005, 221, 297–303. [Google Scholar] [CrossRef] [PubMed]
  83. Cassán, F.D.; Maiale, S.; Masciarelli, O.; Vidal, A.; Luna, V.; Ruiz, O. Cadaverine production by Azospirillum brasilense and its possible role in plant growth promotion and osmotic stress mitigation. Eur. J. Soil Biol. 2009, 45, 12–19. [Google Scholar] [CrossRef]
Figure 1. Total biomass production 20 days after sowing (DAS). Data are shown as means ± standard deviations (SD) (n = 6). Means with common letters are not significantly different (p > 0.05). The plants were cultivated under well-watered (WW) or drought (D) conditions. The inoculation * drought interaction p = 0.0213.
Microorganisms 05 00041 g001
Figure 2. Percentage of total carbon content 20 DAS. Data are shown as means ± SD (n = 3). Means with common letters are not significantly different (p > 0.05). The plants were cultivated under WW or D conditions. The inoculation * drought interaction p = 0.0473.
Microorganisms 05 00041 g002
Figure 3. Percentage of total nitrogen content 20 DAS. Data are shown as means ± SD (n = 3). Means with common letters are not significantly different (p > 0.05). The plants were cultivated under WW or D conditions. The inoculation * drought interaction p = 0.0482.
Microorganisms 05 00041 g003
Figure 4. Total chlorophyll content 20 DAS. Data are shown as means ± SD (n = 3). Means with common letters are not significantly different (p > 0.05). The plants were cultivated under WW or D conditions. The inoculation * drought interaction p = 0.0273.
Microorganisms 05 00041 g004
Figure 5. Abscisic acid (ABA) content 20 DAS. Data are shown as means ± SD (n = 24). Means with common letters are not significantly different (p > 0.05). The plants were cultivated under WW or D conditions. The inoculation * drought interaction p = 0.0908.
Microorganisms 05 00041 g005
Figure 6. Ethylene content 20 DAS. Data are shown as means ± SD (n = 3). Means with common letters are not significantly different (p > 0.05). The plants were cultivated under WW or D conditions. The inoculation * drought interaction p = 0.0297.
Microorganisms 05 00041 g006
Figure 7. Proline concentration 20 DAS. Data are shown as means ± SD (n = 24). Means with common letters are not significantly different (p > 0.05). The plants were cultivated under WW or D conditions. The inoculation * drought interaction p < 0.0001.
Microorganisms 05 00041 g007
Figure 8. Malondialdehyde (MDA) concentration 20 DAS. Data are shown as means ± SD (n = 24). Means with common letters are not significantly different (p > 0.05). The plants were cultivated under WW or D conditions. The inoculation * drought interaction p < 0.0001.
Microorganisms 05 00041 g008
Figure 9. Relative expression of the ZmVP14 gene 20 DAS. Data are shown as means (n = 5). Means with common letters are not significantly different (p > 0.05). The plants were cultivated under WW or D conditions. The inoculation * drought interaction p < 0.0001.
Microorganisms 05 00041 g009
Table 1. Effect of inoculation on the relative water content (RWC) of plants in well-watered (WW) and drought (D) conditions. Means with common letters are not significantly different (p > 0.05). Data are means of six replicates ± standard deviation (SD). The inoculation x drought interaction p < 0.0001.
TreatmentRWC (%)
WWD
Control52.71 ± 2.5 c45.45 ± 1.17 a
A. brasilense58.81 ± 2.7 e47.86 ± 1.37 b
H. seropedicae53.93 ± 3.16 d48.1 ± 1.95 b

