
Optimization Approach for Multisensory Feedback in Robot-Assisted Pouring Task

1
Weldon School of Biomedical Engineering, Purdue University, West Lafayette, IN 47907, USA
2
School of Industrial Engineering, Purdue University, West Lafayette, IN 47907, USA
*
Author to whom correspondence should be addressed.
Actuators 2024, 13(4), 152; https://doi.org/10.3390/act13040152
Submission received: 29 February 2024
/
Revised: 2 April 2024
/
Accepted: 14 April 2024
/
Published: 18 April 2024
(This article belongs to the Special Issue Rehabilitation Robots and Assistive Devices: A Special Issue in Honor of Prof. Dr. Rory A. Cooper)
Abstract
:Individuals with disabilities and persons operating in inaccessible environments can greatly benefit from the aid of robotic manipulators in performing daily living activities and other remote tasks. Users relying on robotic manipulators to interact with their environment are restricted by the lack of sensory information available through traditional operator interfaces. These interfaces deprive users of somatosensory feedback that would typically be available through direct contact. Multimodal sensory feedback can bridge these perceptual gaps effectively. Given a set of object properties (e.g., temperature, weight) to be conveyed and sensory modalities (e.g., visual, haptic) available, it is necessary to determine which modality should be assigned to each property for an effective interface design. The goal of this study was to develop an effective multisensory interface for robot-assisted pouring tasks, which delivers nuanced sensory feedback while permitting the high visual demand necessary for precise teleoperation. To that end, an optimization approach was employed to generate a combination of feedback properties to modality assignments that maximizes effective feedback perception and minimizes cognitive load. A set of screening experiments tested twelve possible individual assignments to form this optimal combination. The resulting perceptual accuracy, load, and user preference measures were input into a cost function. Formulating and solving as a linear assignment problem, a minimum cost combination was generated. Results from experiments evaluating efficacy in practical use cases for pouring tasks indicate that the solution was significantly more effective than no feedback and had considerable advantage over an arbitrary design.
1. Introduction
Robot-assisted manipulation has applications in diverse tasks and environments. In the last decade, applications of high significance have emerged, such as in robot-assisted surgical procedures [1,2] and space and undersea exploration [3,4]. In addition, remote robot manipulation is useful for situations that are hazardous to humans, such as toxic waste clean-up sites [5], or scenarios where humans may adversely affect the environment, such as clean rooms [6,7]. One other field where remote robot operation is emerging is assistive technology [8,9,10,11]. Robot manipulators can significantly enhance the quality of life of individuals with disabilities [12,13].
Users relying on robotic manipulators to interact with the environment are deprived of an experience comparable to direct object manipulation due to the lack of access to sensory information such as tactile, thermal, and force feedback. Such somatosensory feedback can convey information such as thermal and tactile properties of the object being manipulated. By doing so, they may contribute to enhancing situational awareness and aiding decision making relevant to the tasks being executed [14,15,16]. Multimodal feedback interfaces may provide effective solutions to bridging this gap and have been explored previously in several applications such as human–computer interaction and teleoperation [17,18].
The premise of a multimodal feedback interface is that information can be conveyed more effectively when distributed across modalities. For example, if one is engaged in a visually occupying task, it would be better to provide instructions through sound rather than a visual display [19]. Thus, the intention is to avoid overloading a single perceptual pathway and/or provide additional information that cannot be obtained by a single modality alone. Cognitive models of information processing such as Wickens’ multiple resource theory [20] support this reasoning [21,22]. Further, Ernst’s theory of sensory integration indicates that the accuracy of perception increases with the number of modalities that present congruent or redundant information [23].
Although multimodal feedback studies with assistive robotic manipulators are limited, investigations spanning a range of other similar applications have been reported. In [24], an interface provides visual, auditory, and tactile feedback from a virtual telepresence robot through the corresponding modalities. In [25], visual, audio, and haptic feedback is provided in redundance for a virtual manipulation task. A multimodal vibrotactile interface provided multiple properties in an upper limb prosthesis [26]. Interfaces have also been studied for collaborative robots to inform users of robot status [21] and independent robot interactions [27]. Multimodal feedback also proved useful in poor visual conditions [28,29] in teleoperation tasks. Several reviews of multimodal displays [17,18,30] have concluded that performance is empirically shown to improve with feedback across a variety of tasks.
However, some studies suggest that certain combinations of modalities may counter-productively prove to be burdensome, and an optimal combination may be dependent on the task type [17], individual differences [31], and context [32,33]. As a result, evaluative studies of multimodal feedback have yielded conflicting results across the literature. In a study comparing uni-, bi-, and tri-modal feedback conditions [34], the bimodal condition of haptic and visual feedback emerged most effective. On the other hand, a user study found that the introduction of vibrotactile and auditory feedback improved performance time in the operation of an impact wrench, but that the addition of force feedback did not improve performance [35]. Results from a multimodal vibrotactile feedback study indicated the need for additional research to determine whether the combination of certain feedback types may cause sensory confusion [26]. A neural efficiency study found task performance to be highest for visual only feedback compared to visual and haptic feedback in a virtual robot interaction task [27]. Due to such variability, multisensory feedback interfaces cannot be generalized across applications and would benefit from a context-generalizable design approach.
Remote robot control draws heavily on visual resources to guide navigation and detect critical objects while maintaining environmental awareness [22]. It would therefore be expected that perceptual demands will primarily be placed on visual channels, as demonstrated by several studies evaluating visual cues and displays in teleoperation [22]. The primary manual tasks related to robot control may include subtasks such as mode shifts, button presses, and other input interactions while steering a joystick in a traditionally controlled robot. These tasks require visual and motor attention. Including multimodal feedback in the user interface adds several secondary subtasks (i.e., to perceive the modalities) to the robot operation tasks of visually tracking and manually controlling the robot that may distract the user. Thus, to design an effective multimodal feedback interface, the perceptual demands of the interface should be balanced with those of a robot operation task.
Approaches for designing multisensory interfaces that deliver feedback effectively while balancing any cognitive burdens associated with the interface have not been discussed extensively. A systematic approach to designing an interface for stationary robot feedback in an industry setting by employing one hundred employee responses to an online questionnaire has been proposed previously [21]. However, this approach relies solely on subjective responses and may also not be as easily adapted in applications where the reachable number of users is limited. In the study by Zhang et al. [36], an optimal assignment approach is used to provide multimodal feedback of image properties to blind individuals in a virtual image exploration task. Apart from this, many of the studies conducted so far have been evaluative studies of predetermined combinations measuring criteria such as performance time, accuracy, and cognitive load [37,38]. These findings, as made evident by varying results across the spectrum, are likely to be applicable exclusively to those specific applications and contexts.
The primary objective of this work was to develop an effective multisensory interface for robot-assisted pouring tasks, which delivers nuanced sensory feedback while permitting the high visual demand necessary for precise robot operation. To that end, an optimization approach was employed to generate a combination of feedback property to modality assignments that maximizes effective delivery and minimizes load. A system was developed integrating a robotic arm with a haptic device, vibrating tactors, a visual display, and a thermal feedback module as modalities to provide weight, temperature, and liquid level properties in a robot-assisted pouring task. A set of metrics including perception accuracy and resolution and cognitive load measures was selected to model the cost to be optimized. A linear assignment problem structure was used to solve for the optimal mapping based on the selected metrics. Two sets of experiments were conducted. The first set collected data for the selected metrics from which a minimum cost solution was generated. The second experiment evaluated the efficacy of the generated solution for decision making tasks against a control case of no feedback and an arbitrary design.
2. Materials and Methods
2.1. System Architecture
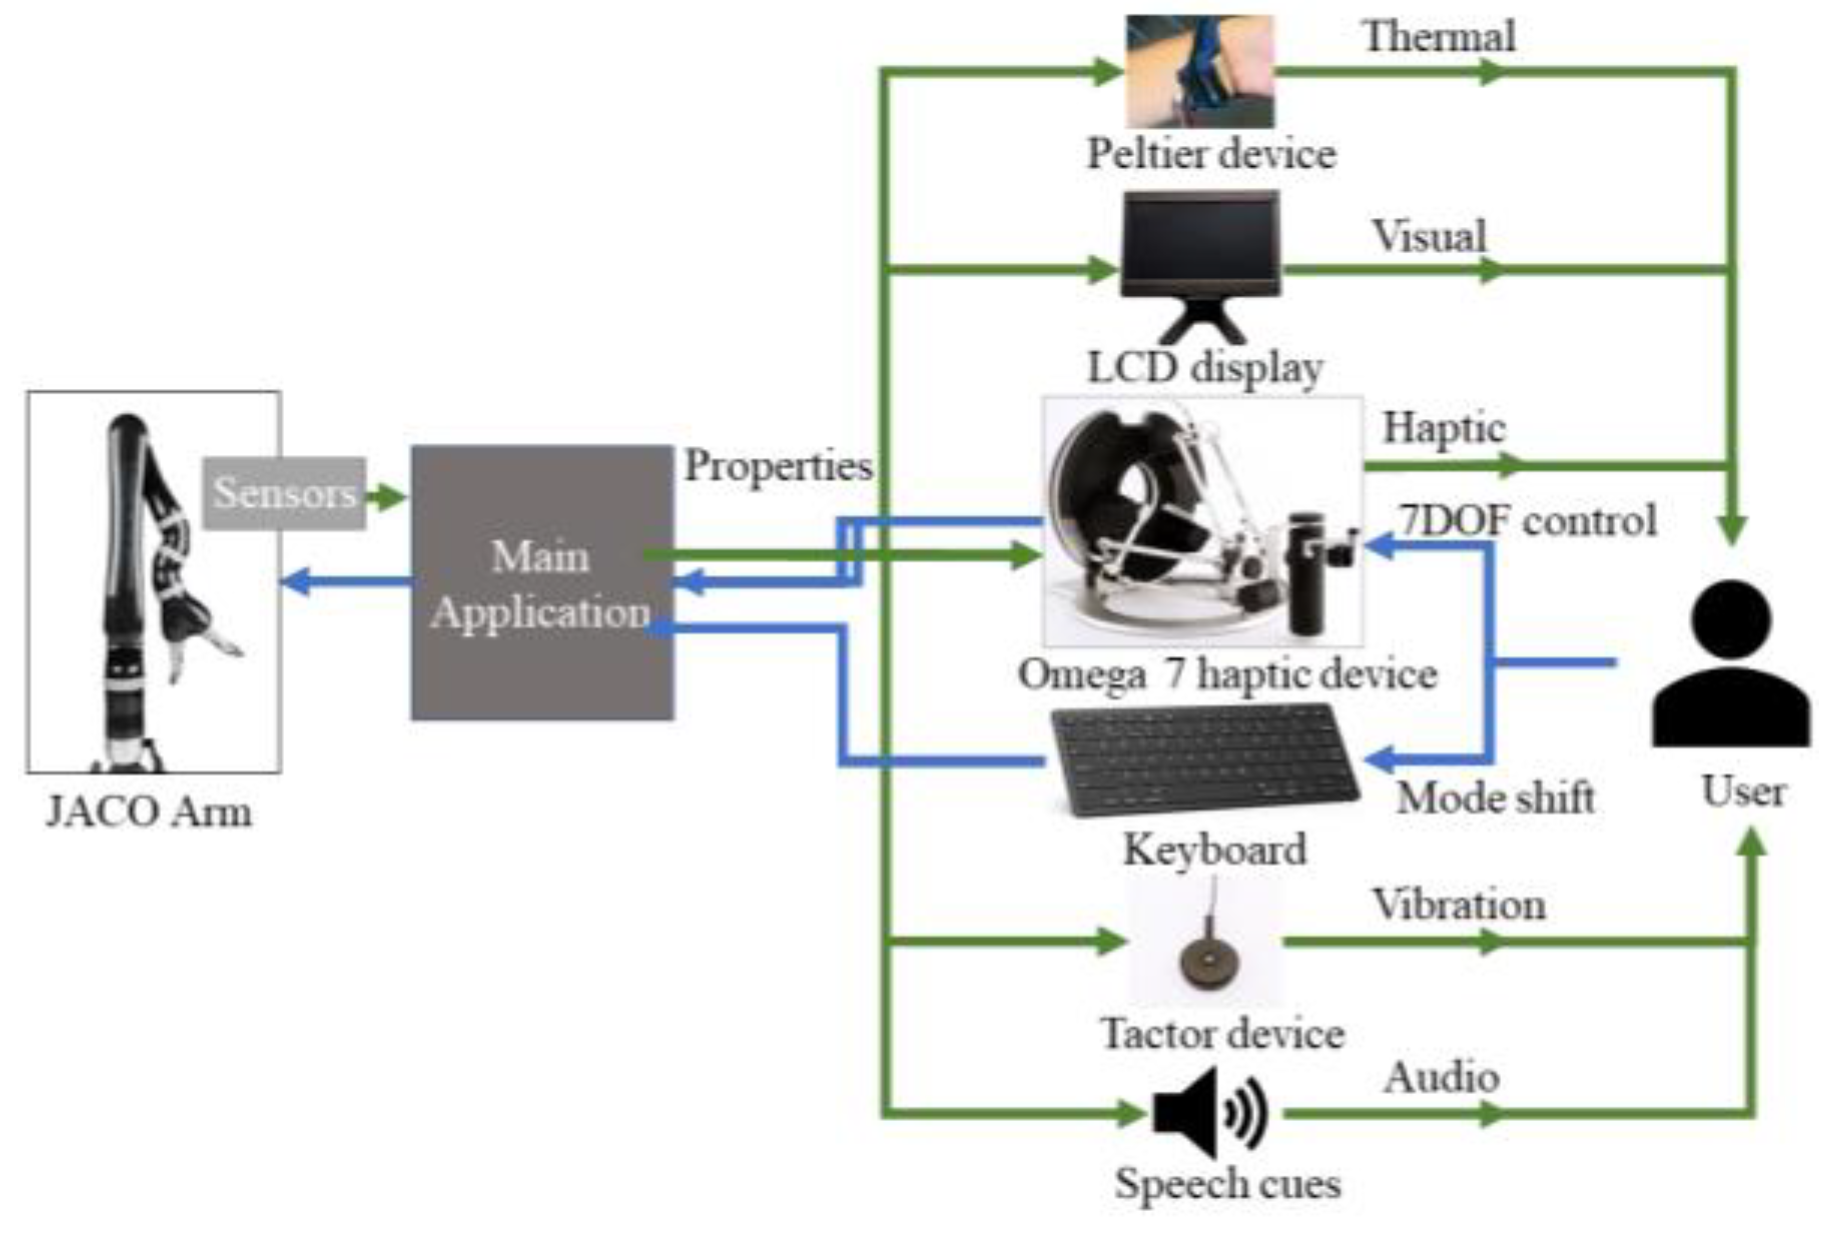
The overall architecture for the control and feedback interface is summarized in Figure 1 below. A Gen2 6DOF JACO arm (Kinova® Boisbriand, QC, Canada) [8] was used without the manufacturer-provided joystick. Control inputs to guide the robot were provided through a Force Dimension® (Nyon, Switzerland) Omega 7 haptic device [39] joystick and keyboard presses. Sensors were mounted on the robot gripper, including a capacitance-based, non-contact liquid sensor for liquid level and an infrared thermal sensor for temperature. Property information acquired from the robot end were provided through multiple feedback modalities, including kinesthetic force feedback through the same haptic device, visual feedback through a 7″ LCD monitor, vibration feedback through an Engineering Acoustics® (Casselberry, FL, USA) tactor device [40], audio speech cues through the computer speakers, and thermal feedback through an Arduino-controlled Peltier device. Serial communication was established between all devices and integrated in a multithreaded console application on a Windows™ 7 desktop computer.
Following the results and tradeoffs discussed by Jiang et al. in [41] in a comparison of multiple input modalities including the haptic device 3D joystick, a hybrid control approach integrating a haptic device joystick and keyboard inputs was implemented. The haptic device served as the motion control input method to guide the robot while keyboard inputs were used for shifting between modes and to carry out other built in single-command motions.
The feedback modalities were configured to render property feedback for a desired temperature range of 60–145 °F, a weight range of 0–10 N, and a binary (above or below grasp point) indicator for liquid level.
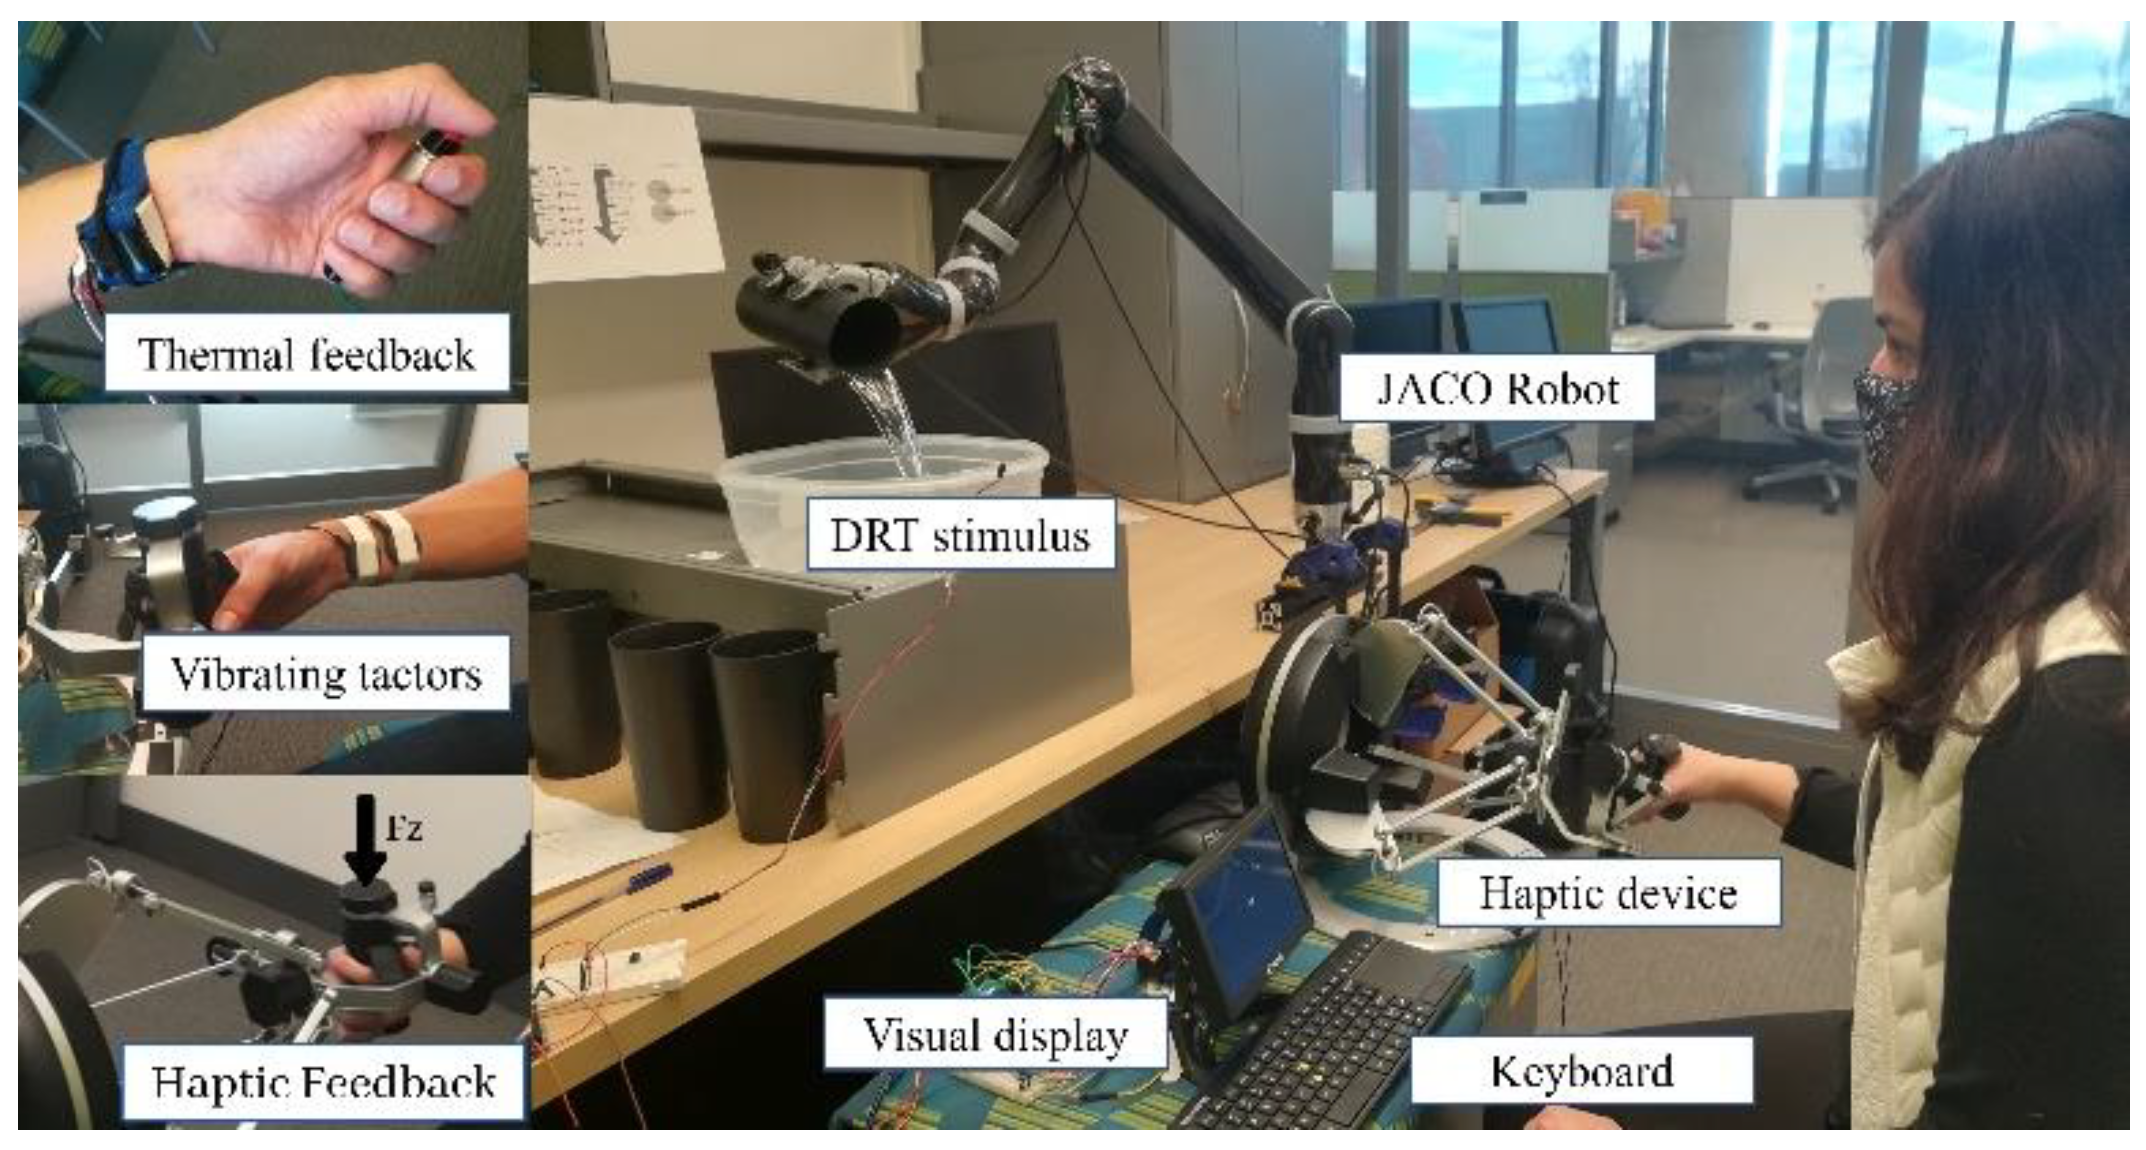
Haptic feedback: Haptic force feedback (Figure 2) was rendered as a downward force on the joystick stylus. The true weight (N) of the pouring vessel was provided for weight while for liquid level a downward force indicated that liquid was above the grasp level and no force indicated no liquid detected.
Vibration feedback: The vibration modality (Figure 2) was a substitution modality for all the properties selected for this problem. In all three cases, frequency was mapped linearly from the desired property range to the maximum range afforded by the tactor device (30–350 Hz). The tactor device [40] comprises C-2 tactors with mechanical resonance in the 200–300 Hz range, coinciding with the peak sensitivity of the Pacinian corpuscle at 250 Hz [42].
Visual feedback: The visual feedback modality provided information through text and color displayed on a 7″ LCD monitor placed in front of the user (Figure 2). Feedback properties were categorized to provide text outputs of categories (e.g., ‘Hot’, ‘Very Hot’), and background color intensities were used to differentiate between higher and lower values within categories. For example, warmer temperatures were progressively deeper red in color, and cooler temperatures were deeper blue with a white neutral range (90–95 °F).
Audio feedback: Audio feedback was provided as speech cues describing the categories for each of the properties in the text outputs of the visual feedback modality above—i.e., ‘Very Cold’, ‘Cold’, ‘Cool’, ‘Warm’, ’Hot’, and ‘Very Hot’ for temperature; volume conversions ‘Less than one quarter full’, ‘One quarter to one half full’, ‘One half to three quarters full’, and ‘Three quarters to full’ to represent weight; and ‘Liquid is ABOVE level’ and ‘Liquid is BELOW level’ for liquid level—were implemented here. Unlike the visual modality, the audio modality did not capture the resolution of color gradient changes within each category. Speech files generated from a text-to-speech converter were used with equal playback speed, volume, and pitch across all modalities. The audio cues were provided through the speakers installed on the LCD monitor, in close proximity to the user.
Thermal feedback: Thermal displays may be implemented using Peltier cells, which can be electronically controlled to generate heat toward or away from an area of skin that it is in contact with [42,43,44]. The thermal feedback modality in this system was implemented through a wrist-mounted Peltier device (Figure 2). The device was placed on the wrist because of its sensitivity to temperature; proximity to the palm, where a high concentration of thermal receptors is found; and practical positioning in the robot control task. Thermal feedback was the only provided modality-matched feedback of temperature.
2.2. Optimization Approach
Optimization approaches have been used previously, combining perception or recognition accuracy and psychophysiological measures for haptic image rendering [36] and gesture-based interaction studies [37]. In this work, we used the structure of the linear assignment problem (LAP) to find an effective mapping of each of the three identified properties to one of five available feedback modalities with feedback perception accuracy and cognitive load metrics considered.
The linear assignment problem is a combinatorial optimization problem that deals with the question of assigning a given number of tasks to a given number of agents such that the total cost is minimized [45]. It consists of two components: the underlying combinatorial structure that defines the assignment and an objective function that models the cost of assignment [46].
Using this structure to frame the problem, we first begin with a cost matrix representing the possible mappings of properties to modalities (Table 1). Five possible sensory modalities (vibration, visual, haptic, audio speech cues, and thermal) were selected to convey three selected properties of interest in this study. The LAP constrains the problem such that only one modality can be used to represent one property. Further, not all assignments were included as candidates. Only modality renderings that have been demonstrated in previous work or renderings that had straightforward translations for the property were used. The remaining mappings (darkened cells in Table 1) were treated as initial conditions with costs set to infinity.
Based on the experimental results discussed in the subsequent section, we defined a cost function with a set of identified metrics to compute the costs associated with the assignments. The optimum mapping combination from 30 possible combinations can thus be generated by finding the combination of mappings that yields the minimum total cost.
Thus, the assignment problem can be defined as follows:
Given two sets of vertices, P representing a set of properties (size 3) and M representing a set of modalities (size 5) with a cost function C: P × M → Q, find a bijection function h: F → M that minimizes the total cost. Thus, for the matrix presented in Figure 2, find the minimum cost linear assignment:
where:
and
with
and the cost of no assignment set to infinity. Because the sizes of the property and modality sets are different, an extension of the Hungarian algorithm for a rectangular cost matrix introduced by Bourgeois and Lasalle (1971) [47] was used to solve this problem.
To define and quantify the cost function, a set of metrics were identified to be included in the cost function for optimization. The metrics selected for this study included perception accuracy, change response accuracy, cognitive load measures, and a subjective preference rating.
Perception accuracy: Given the categories (or levels) into which the range of one property was divided, perception accuracy was defined as the closeness of the perceived category to the actual category [38]. Thus, in the screening experiments, it was defined as follows:
where is the actual category of stimulus, is the perceived category of stimulus, and is the number of possible categories for the property. This categorized approach was based on the human tendency to discretize continuous information into categories for decision making [48], termed ‘categorical perception’ [49].
Change response accuracy: This measures sensitivity to changes and was defined as the ability to detect whether a change (increase or decrease) has occurred and in which direction [38,50]. To quantify this measure in the screening experiments, responses for whether the perceived feedback was higher than, lower than, or the same as the previous trial were scored of 1 if correct, and if incorrect, a score of 0 was given.
Cognitive load measures: To measure cognitive load, a Detection Response Task (DRT) was used. The DRT is an ISO standard tool used in driving experiments to measure driver distraction [51]. The method consists of a simple task where subjects respond to a frequently repeated stimulus presented at randomized intervals of 3–5 s [52]. Hit rate and mean reaction time measurements of the DRT has been used as an objective cognitive load metric in driving and human–computer interaction tasks [52,53,54]. Decreased hit rate and increased reaction time correlate to increased cognitive load. To focus on visual attentional load, we implemented a remote DRT with a visual stimulus placed in the task environment. Hit rate (responses to stimuli as a fraction of total stimuli) and mean reaction times to each hit were recorded per trial.
Subjective preference rating: Subjective feedback has been an integral method of assessing user acceptance and identifying additional requirements [15,55,56]. Subjective preference ratings can capture several factors that are subtle and/or difficult to quantify including perceptions of physical comfort, psychological comfort, integrated sensory perceptions [57], and elements of subjective workload that may reflect effects of resources such as memory [58] and task differences [59]. To capture a combined measure of other factors that may affect the efficacy of a multisensory interface, a subjective preference rating was included in this study as a metric to inform the assignment cost. A multi-attribute preference weighting technique known as the analytic hierarchy process (AHP) [60,61] pairwise comparison method was used to determine subjective preference ratings. This process was applied by collecting pairwise preference comparisons of the feedback modalities (e.g., visual vs. vibration) for each property from the subject, corresponding to each property set of trials in the screening experiments. These ratings were then used to compute scores per modality by adding the total number of times a modality was selected from a pair. Final scores were generated by dividing by the maximum possible score (where the maximum score was 3) such that total weights summed to 1.
All of the measures above were normalized to between 0 and 1, and normalized means of data from the screening experiments were used to quantify associated costs. Data corresponding to these metrics were then collected from a set of screening experiments discussed in the next section.
The objective cost function to compute the costs of each cell in the cost matrix was defined as a weighted sum of the metrics generated through the screening experiments. Thus, a set of metrics of size k as response variables from the screening experiments and a set of corresponding weights of size k defined the contribution of a given metric to the cost. The cost function was defined as follows:
where is the set of metric means normalized to between 0 and 1, which may include measures of perception accuracy and change, DRT load measures, and the subjective preference rating. The set of weights, were generated using a subjective method during the screening experiments.
The AHP was also used to determine subjective metric weightings. To do this, a hypothetical scenario was constructed where the robotic manipulator would be used to make a drink consisting of a cup of coffee or tea. Subjects were asked to provide a pairwise comparison rating of which factor they perceived to be more important in this task. Each factor corresponded to one metric in the optimization cost. These ratings were collected after the subject had trained on the robot such that they had a clear idea of the demands of manipulating the robot, but before the screening experiments and introduction to feedback modalities such that responses would not be biased by the idea of feedback availability. Final weights computations for a set of metrics size k were computed from mean metric scores as follows:
Using the problem definition, cost function definition, and weighting strategies discussed thus far, the LAP was solved to generate and optimal mapping. A set of evaluation experiments were then conducted to assess the generated solution against not providing any feedback or an arbitrary design.
2.3. Experimental Design
This study involved two sets of experiments. In the first screening experiments, we collected data to quantify the costs associated with each of the identified metrics. Twelve individual assignments that could generate 30 possible combinations were tested in this set. In the validation experiments, we evaluated the generated solution against a control case without feedback and against an arbitrary design.
2.3.1. Screening Experiments
In this set of experiments, a within-subjects design was employed where each subject tested all the individual property-modality assignments with the same task. For the properties selected in this application, a robot-assisted pouring task was chosen. Experiments were divided into three sets representing each property (temperature, weight, and liquid level) completed on separate days, each of which contained four modality assignments. To compensate for possible learning effects tied to participants becoming more comfortable with controlling the robot, the three sets were ordered from the easiest to the hardest property set (liquid level, weight, and temperature) and within each set from easiest to hardest feedback rendering (visual, audio, vibration, and haptic/thermal). Each subject performed three trials of the pouring task for each assignment pair, for four modalities assigned to each of the three properties, totaling 3 × 4 × 3 = 36 trials per subject. Nine subjects (four male, five female) were recruited for this experiment, yielding a data set with a total of 324 trials with n = 27 trials per each individual assignment.
The experimental setup for this experiment was similar to the preliminary DRT experiment setup described above, but with inclusion of the different feedback modalities. The system with the JACO robot, haptic device, sensing, and feedback modalities as described was set up for a robot-assisted pouring task, as illustrated in Table 1. Black 26oz plastic tumblers (16.81 cm tall, 8.89 cm diameter opening, Target Corporation, Minneapolis, MN, USA) were used as the sample vessels from which to pour and a large bowl was used as the receiving vessel. The robot was mounted in a fixed position on the table and the bowl position remained fixed. The robot end effector was returned to the same ‘home’ position before each trial. A control console placed between the subject and the table supported the haptic device, keyboard for mode shifts, and LCD display with speaker for feedback. The vibrating tactor elements were placed on the subject’s right wrist as illustrated in the table, and the thermal feedback device was worn on the left wrist. The DRT stimulus was mounted on the bowl with the button held in the participant’s left hand. Metrics identified to be optimized were the response variables of interest in in this set of experiments. These included feedback perception, cognitive load, and subjective preference metrics.
2.3.2. Evaluation Experiments
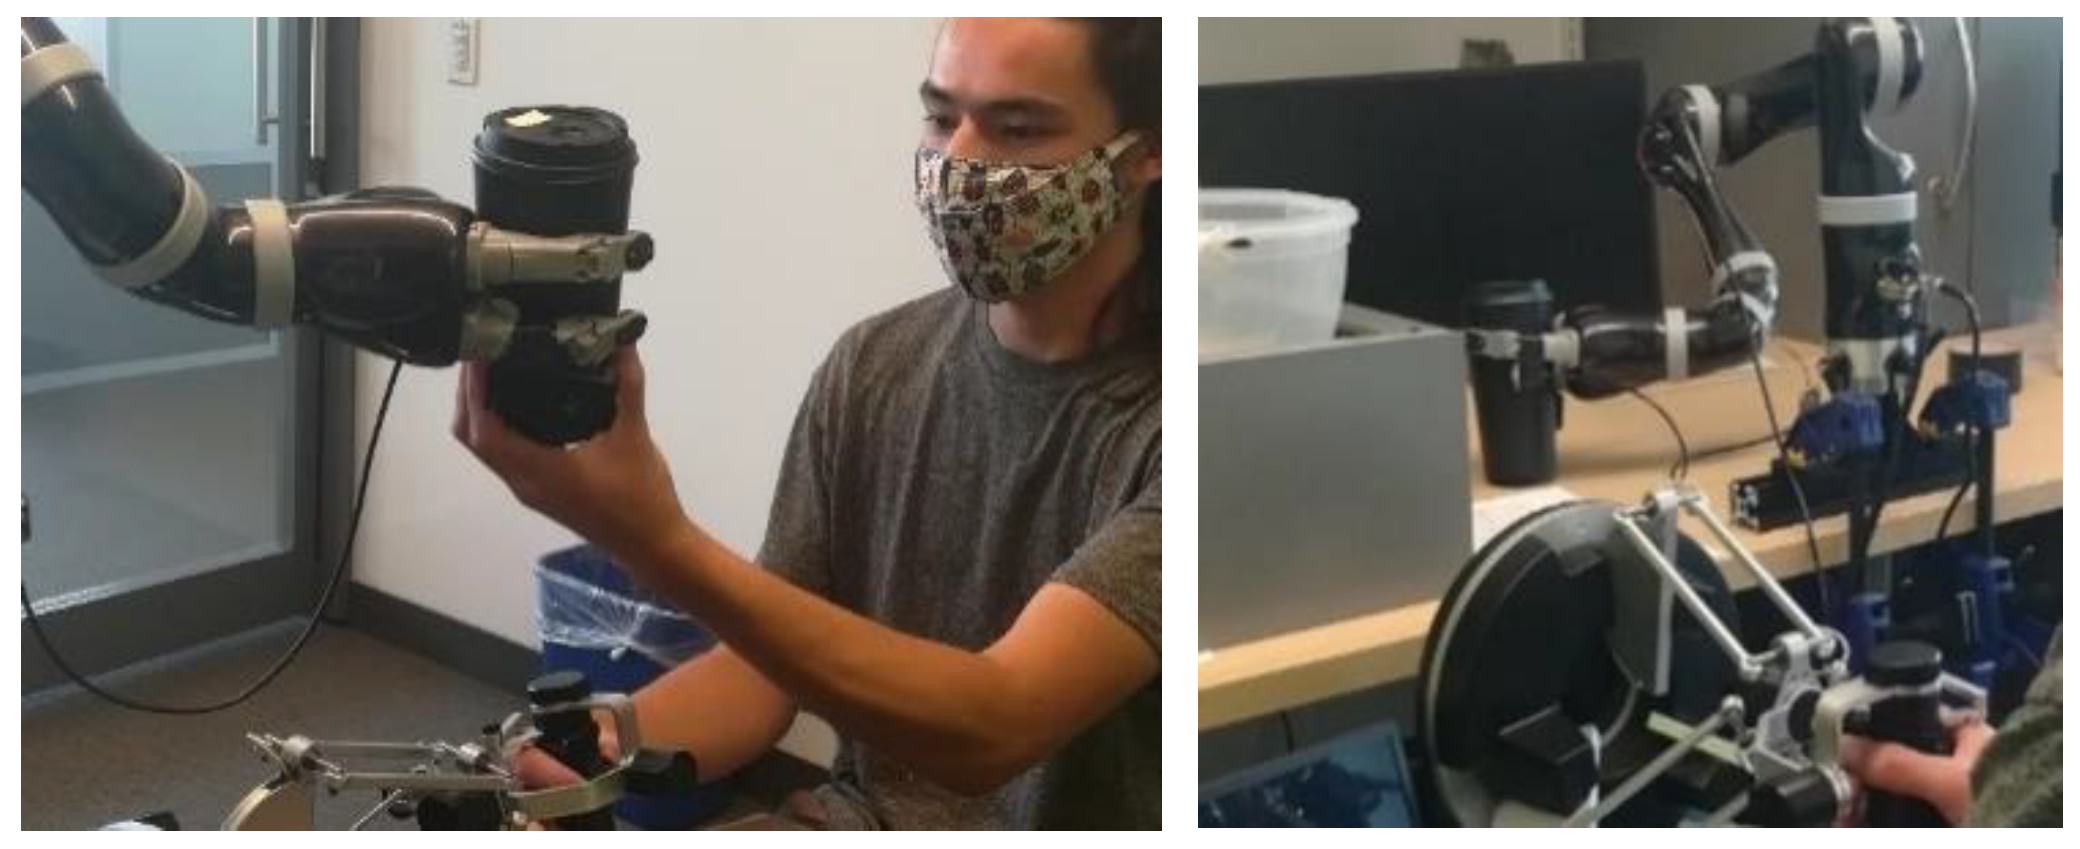
The primary objective of the validation experiments was to determine whether the generated mapping provided feedback in an effective manner. To address this, the solution feedback treatment was assessed against a control treatment of no feedback and a third treatment of an arbitrary solution. The mapping for the arbitrary design was selected randomly and liquid level was mapped to the visual display, weight to the haptic device/joystick, and temperature to the vibration modality. In the control treatment, since feedback was not available to make the relevant decisions, alternative exploratory strategies were identified to obtain the necessary information. These strategies are illustrated in Figure 3 and included touching the surface of the vessel to judge temperature and tapping the vessel on the table to judge amount of liquid from hollowness of the sound.
The same setup and robot-assisted pouring task used in the screening experiments was adapted for these experiments. All three feedback modalities were simultaneously activated for the duration of each trial.
Decision success, task completion time, and subjective mental demand ratings were collected as response variables. Decision success was marked between 0 and 1 following the conditions as described in each of the use cases. Because the alternative strategies resulted in tasks of varying lengths, the DRT was not used to quantify load in this experiment. Instead, a subjective mental demand rating on a 0–100 scale was collected at the end of each trial. This was supplemented by the response time variable, which captures additional load by alternative strategies and perception through complex modalities and represents a convenience measure for real-life situations. Response time captured the time taken to make the decision and complete the pouring task. One-way ANOVA was performed to analyze results using a linear mixed model that factored in the treatment and sample as main effects and the subject as a random effect.
Three separate use cases targeting different properties were defined to test each of the treatments. A within-subjects design was used where each subject performed two trials for each treatment with each use case. Twelve subjects (six female, six male) were recruited to test the control vs. solution, totaling 24 trials per use case per treatment. Seven of these subjects (four male, three female) tested all three treatments, yielding 14 trials per use case per treatment.
Case 01: Temperature Decision Task: The first use case was a temperature decision task. For each trial in the experiment, if the sample was in the desired ‘Hot’ range (105–115 °F, 40.6–46.1 °C), the subject was instructed to continue with the pouring task. If the sample was above this range, subjects could choose to wait till the sample reached the correct range and then decide to pour. Success (1) or failure (0) was recorded based on the decision. The decision was marked as a failure if the sample was at the desired temperature, but the participant chose to wait; the sample was too hot, but the participant chose to continue; the participant did not wait long enough for the temperature to reduce to the desired range; or waited too long. For the temperature trials, where some trials were compounded by a wait time, response time was computed as the wait time subtracted from total task time to compute response time.
Two fixed sample levels were defined for this experiment. The first was at 110 °F (43.3 °C, the desired) and the second was at 145 °F (62.8 °C, too hot). The sample type was selected randomly with replacement for each trial. Prior to the experiment, the subject was given reference samples to hold.
Case 02: Empty Vessel Identification: The second use case required the participant to identify whether the vessel was empty or not empty. For each trial in the experiment, subjects were tasked with identifying whether the vessel was empty or not. Success (1) or failure (0) was recorded based on the decision. The decision was marked as a failure if the sample was empty, but the participant identified it as not empty or vice versa. Participants were instructed to inform of their decision as it was made and continue with the pouring motion to keep the task time at a comparable length.
The two fixed sample levels were an empty sample and a half-full sample. The sample type was selected randomly with replacement for each trial. Prior to the experiment the subject was introduced to the tapping sounds for each sample as reference.
Case 03: Tilt Angle Estimation: In the third use case, the participant was tasked with estimating the angle of tilt to bring the meniscus of the liquid stream to a target region in the vessel. Prior to the experiment, the subjects were shown the marked target range in the vessel (Figure 4, left), which covered an area of 0.75 inches below the rim of the cup without spilling.
The decision was marked as a failure (0) if the liquid spilled out of the opening in the coffee lid or the liquid was below the level of the targeted range. If the liquid did not spill out of the opening, but spilled when the lid was removed, the trial was marked with a 0.5. A successful tilt is shown in Figure 4.
The two sample levels used were a quarter-full sample and a three-quarters-full sample selected randomly with replacement for each trial. Prior to the experiment, the subject was introduced to the tapping sounds for each sample as reference.
3. Results
This section discusses the results of each experiment, including means of response variables and one-way ANOVA results (α = 0.05) for each property-modality assignment in the screening experiments, generated metric weights, cost functions, and one-way ANOVA and post-hoc Tukey test results (α = 0.05) of the validation experiment for each use case.
3.1. Screening Experiments
Results for each of the response variables were as follows:
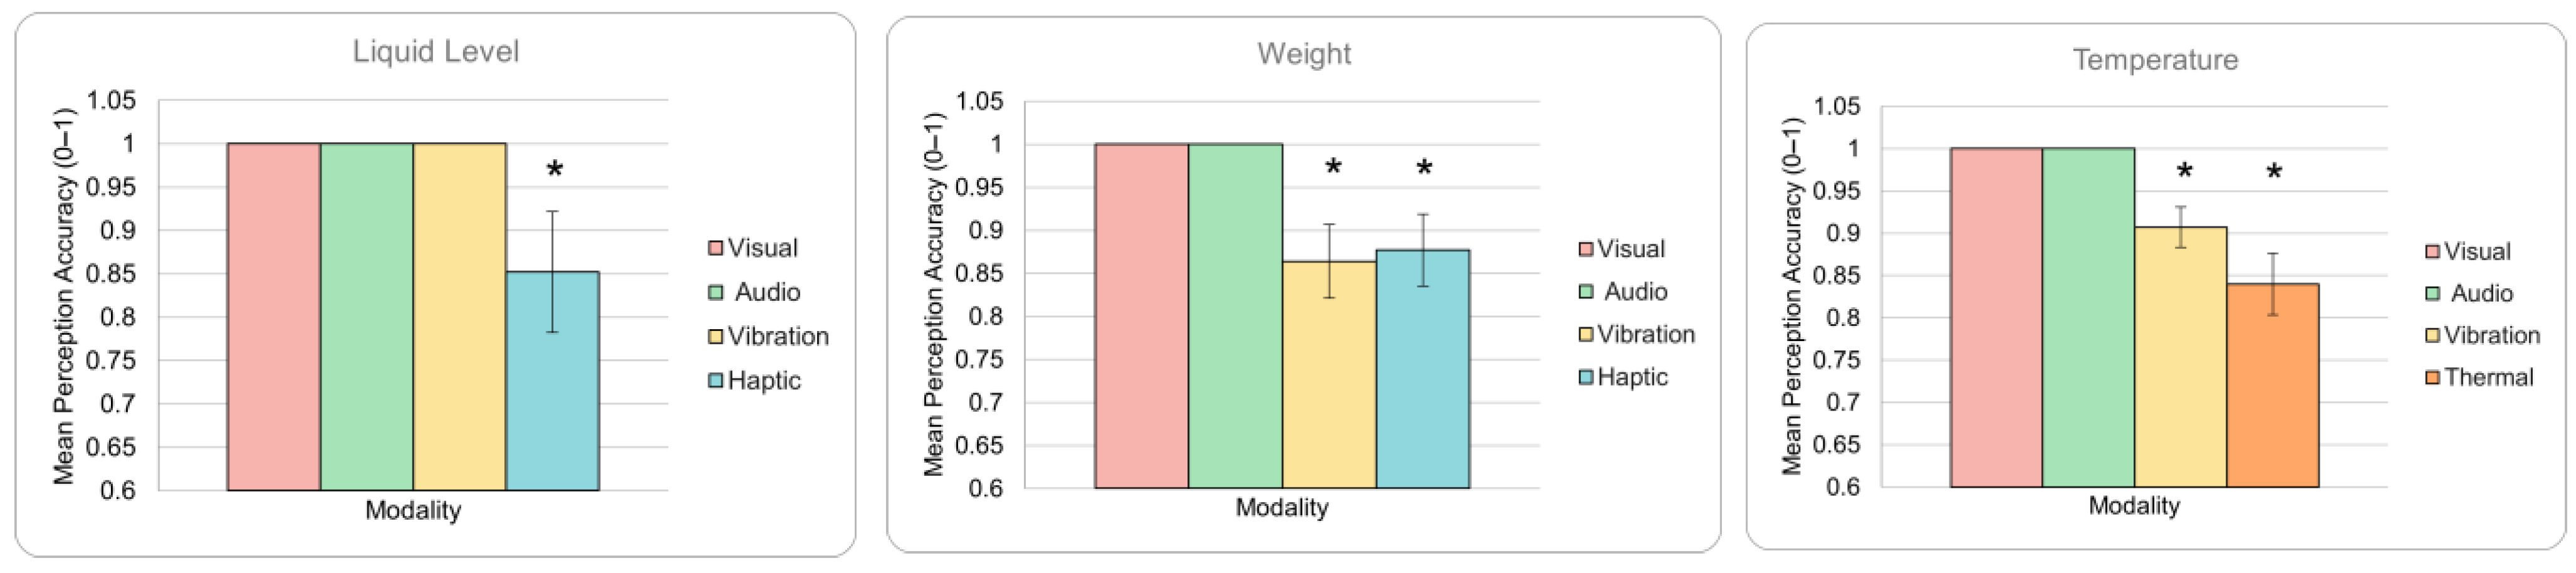
Perception accuracy: One-way ANOVA results for perception accuracy (Figure 5) show significant differences between modalities for all three properties with F = 4.52, p = 0.0051 for liquid level; F = 8.46, p = 4.427 × 10⁻⁵ for weight; and F = 17.32, p = 3.389 × 10⁻⁹ for temperature. The significant results for perception accuracy confirm that it is an important and relevant metric to be included in the cost function for identifying an appropriate mapping.
Change response accuracy: Despite the differences in means observed in Figure 6, the ANOVA results for change response accuracy yielded F = 0.69, p = 0.5632 for liquid level; F = 1.89, p = 0.1397 for weight; and F = 1.4, p = 0.2512 for temperature. The insignificance of results for this metric indicates that it may not be a critical metric to be included in the cost function.
DRT measures: For the DRT hit rate means observed in Figure 7, the ANOVA results found F = 2.01, p = 0.1166 for liquid level; F = 4.47, p = 0.0054 for weight; and F = 3, p = 0.0338 for temperature. While liquid level was found to be insignificant, the results for weight and temperature categories are observed to be significant for the DRT hit rate. Since liquid level is the simplest of the properties, and the more complex properties were significant, we can interpret these results to indicate that DRT hit rate is a valid inclusion in the cost function for optimization. Although differences in means are observed on Figure 8, the ANOVA results for DRT reaction time produced F = 0.12, p = 0.9486 for liquid level; F = 1.8, p = 0.1509 for weight; and F = 1.22, p = 0.2704 for temperature. The insignificance of results for this metric indicates that it may not be a critical metric to be included in the cost function.
Subjective preference score: ANOVA results for subjective preference comparisons from the AHP analysis (Figure 9) were found to be highly significant with F = 21.05, p = 9.861 × 10⁻¹¹ for liquid level; F = 19.75, p = 3.289 × 10⁻¹⁰ for weight; and F = 92.26, p = 3.439 × 10⁻²⁹ for temperature. The significance of results confirms that it is an important and relevant metric to be included in the cost function for identifying the minimum cost assignment.
Metrics for weighting: Metrics for weights were generated through a subjective pairwise comparison completed by the nine participants after robot training and before the experiments. The resulting weights for all the metrics are shown in Figure 10. However, since some metrics were not significant in the screening experiment results, a second set of weights was generated with those metrics filtered out. ‘Attention’ represents the importance of visual attention on the task and is intended to isolate only DRT hit rate while ‘overall demand’ captures DRT reaction time.
In Figure 10 (left) the lowest-weighted metrics were also the insignificant metrics in the experimental results. This indicates that metrics perceived to be least important in the subjective method predicted the experimental outcome and thereby corroborates the screening experiment results. Since the weighting was completed prior to the introduction of the feedback interface, the experiments, and the perception tasks, the responses were not biased by knowledge of what was measured during the experiment. The significance results and the metric weighting results were thus mutually supportive of their relevance and provide further validation of the process.
3.2. Assignment Solution
The final step in the solution strategy was to define a cost function, generate a cost matrix, and solve for the final solution. Since some metrics were found to be insignificant, two sets of weights were defined, and cost matrices were generated for two cases, both with and without the insignificant metrics. The cost function for significant metrics only was defined as follows:
where , , and are the means of perception accuracy, hit rate, and preference score, respectively, and , , and translate to error, miss rate, and disfavor of the modality, all of which would increase the cost.
For the case with all the metrics, this equation is modified:
where and are change response accuracy and DRT reaction time, respectively, and is the change response error. represents each respective weight identified in Figure 11. Computing costs in this manner yielded two cost matrices corresponding to Equation (8) and Equation (9), respectively. A minimum cost solution was generated for each matrix, both of which generated the same mapping solution illustrated in the bipartite graph in Figure 11.
3.3. Validation Experiments
The results comparing the solution mapping to the control experiments from the three use cases (the temperature decision task, empty vessel identification, and tilt angle estimation) are provided in Figure 12.
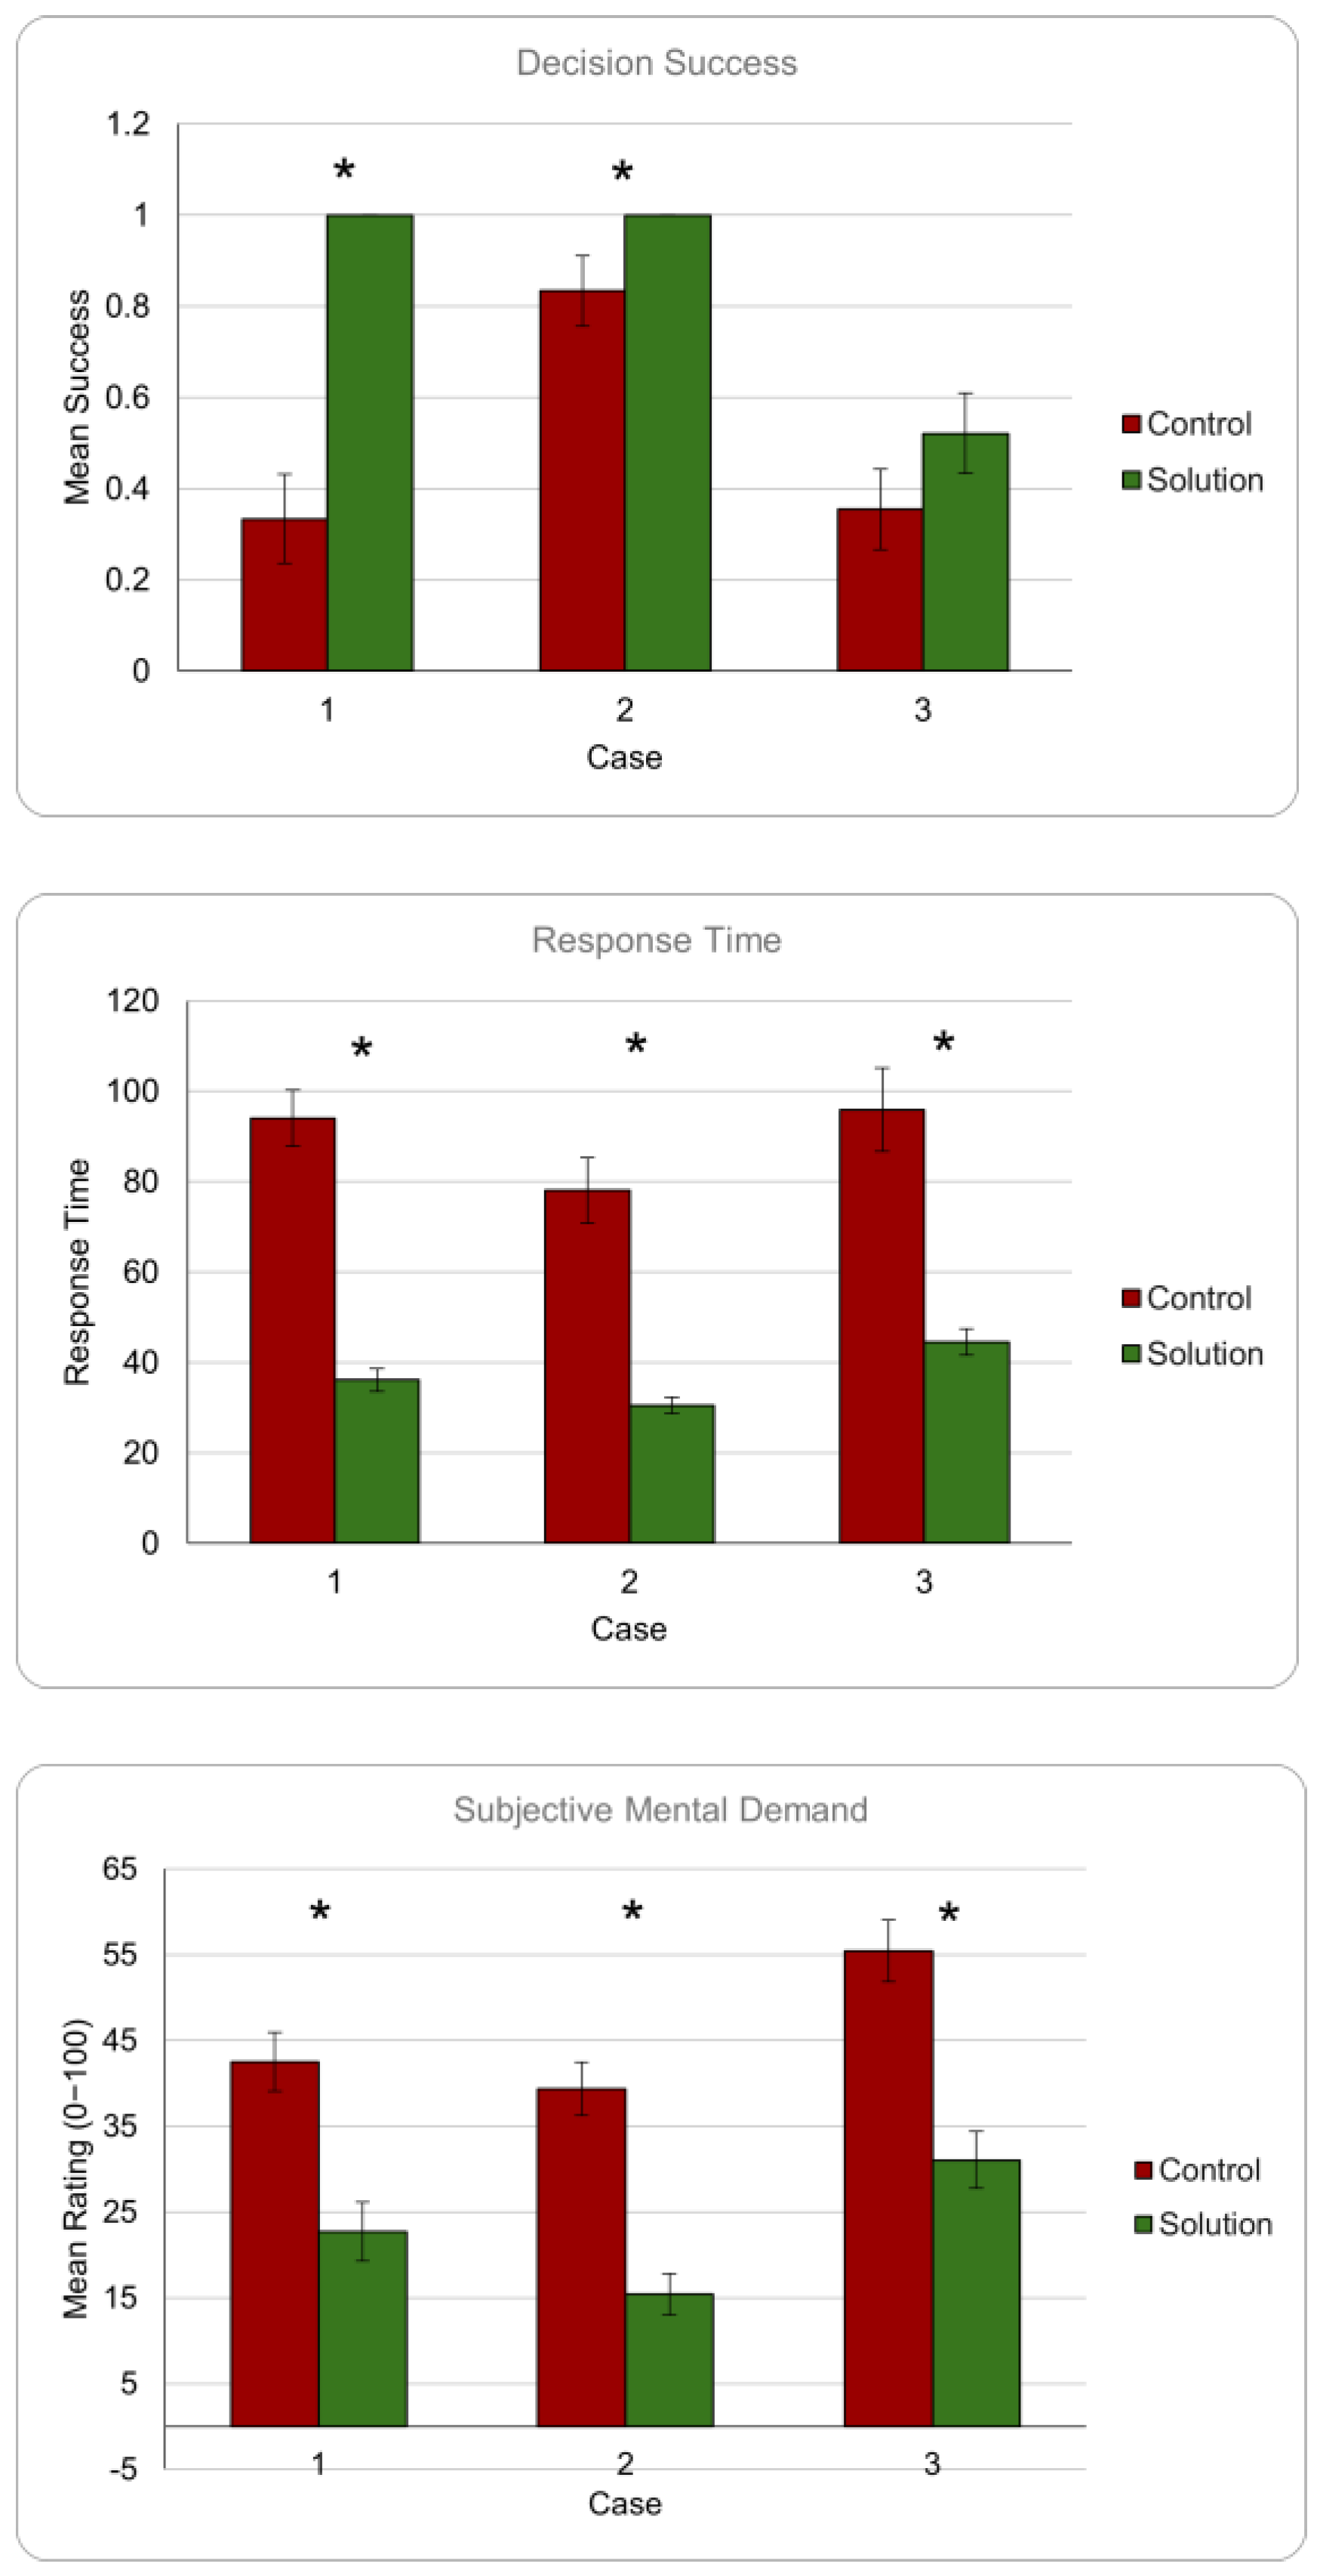
From the means, it can be observed that results are as expected across all the test cases with the solution performing consistently better with higher success rate, lower response times, and lower mental demand.
ANOVA results per use case were as follows:
Case 01 (temperature): Results from all three response variables are observed to be highly significant with F = 56.87, p < 0.0001 for success; F = 96.44, p < 0.0001 for response time; and F = 33.32, p < 0.0001 for mental demand. These results indicate that the feedback interface performed much better than the control strategies by providing significantly more reliable information to inform the decision, significantly reducing the time taken to execute the task, and offering a significant reduction on the cognitive demand of the task.
Case 02 (empty vessel): Significant differences are observed across all three variables once again for the second use case with F = 4.52, p = 0.0419 for success; F = 45.62, p < 0.0001 for response time; and F = 110.83, p < 0.0001 for mental demand. The feedback interface is seen to have performed much better than the control strategies in feedback delivery, task time, and cognitive demand in this use case.
Case 03 (tilt angle): Results are observed to be highly significant for response time F = 41.42, p < 0.0001 and mental demand F = 116.82, p < 0.0001, indicating that the feedback interface was successful in reducing task time and cognitive effort associated with this task. Despite the difference observed in Figure 12, however, success is not statistically significant with F = 1.63, p = 0.2116. This is likely due to the more complex nature of the task relative to the other use cases, on which the impact of the feedback interface may be more subtle.
Figure 13 illustrates the results comparing the solution mapping to an arbitrary mapping and the control in each of the three cases in this experiment. These results help determine whether the solution mapping was better than providing any arbitrary mapping of feedback.
Overall, consistent patterns are observed across the use cases, reflecting reliable experimental design and conditions and consequently reliable results. Results from one-way ANOVA and post-hoc Tukey tests are presented case by case below.
Case 01 (temperature): Results from all three response variables are observed to be highly significant with F = 18.42, p < 0.0001 for success; F = 124.08, p < 0.0001 for response time; and F = 8.13, p = 0.0018 for mental demand. Post-hoc Tukey tests indicated that the differences in success were significant between the solution and control and the solution and arbitrary treatments, indicating that the solution is capable of significantly better feedback delivery than both the arbitrary mapping and control. For response time, there was no significant difference detected between the solution and arbitrary mapping as predicted upon observation of means. For subjective load, the Tukey tests detected significant differences between the solution and control and the solution and arbitrary treatments, indicating that the solution significantly reduced cognitive load relative to the arbitrary mapping in addition to the control. Overall, these results indicate that the solution mapping performs better than the control for this use case.
Case 02 (empty vessel): Significant differences are observed with F = 26.68, p < 0.0001 for response time and F = 22.98, p < 0.0001 for mental demand, while the observed differences are found to be insignificant for success with F = 1.6, p = 0.2202. Given that the significance observed for solution vs. control with twelve subjects in the previous analysis is not observed here, a significant difference may be detected with the arbitrary mapping if a larger number of subjects were used to test this case. Tukey tests revealed that for response time there was no significant difference detected between the solution and arbitrary mapping similar to the previous case. For subjective load, the Tukey tests detected significant differences between the solution and both the control and arbitrary treatments, indicating that the solution significantly reduced cognitive load relative to the arbitrary mapping as well as the control.
Case 03 (tilt angle): Results are observed to be significant for response time F = 33.76, p < 0.0001 and mental demand F = 15.86, p < 0.0001, while success is not statistically significant with F = 0.5, p = 0.6096. This is not surprising, following insignificant results from the previous analysis, and can be interpreted in the same way. Similar to the previous cases, Tukey tests did not detect significant differences between the solution and arbitrary mapping for response time, although both treatments were significantly better than the control. The same was true for subjective mental load despite the differences in means observed in the graph. While none of the variables could differentiate between the arbitrary mapping and the solution in this use case, means indicate that the solution has an overall advantage in success and mental load.
4. Discussion
4.1. Screening Experiments
From the results across all metrics in the screening experiments, we observed that perception accuracy, DRT hit rate, and subjective preference yielded significant differences between two or more modalities, while change response accuracy and DRT reaction time differences were not found to be significant. For the purposes of our optimization cost function, we divided our approach into two parallel paths from this point forward: we computed cost weights and matrices and finally generated solutions with (1) only the significant metrics and with (2) all the metrics. In the remainder of this section, we will discuss the results obtained from each metric separately.
From Figure 5, it can be observed that the visual and audio modalities provided the best perception accuracy consistently across all properties and outperformed by modality-matched feedback (haptic to weight, temperature to thermal). This is not surprising as humans tend to favor visual and audio channels as general means for communication and learning [62]. For literate individuals, text, color, and speech cues are simple to learn and interpret, and can provide clear labels and representations of distinctions needed to be made. However, information processed through mechanoreceptors such as vibration and haptic perception do not provide the same resolution and are not as intuitive, especially when used as a substituted modality. Thermal perception is even lower in resolution likely due to the relatively sparse spread of thermoreceptors in the skin and is affected by the participant’s basal body temperature, which can influence the heat transfer rate and thus the perception of thermal cues [50]. However, it should be noted that all modalities yielded over 80% mean accuracy, supporting the choice of selected modalities and corresponding feedback configurations across the three properties despite the relative drawbacks.
In Figure 6, we observe that the haptic and vibration modalities provide better perception of change, especially relative to the audio feedback, and in the case of weight, also visual feedback. Since audio speech cues did not provide a method to draw distinctions within categories compared to the linearly scaled vibration and haptic feedback, this result captures when samples provided were in the same category in consecutive trials.
Based on Figure 7, the DRT results show that hit rate was lower for the visual modality compared to audio across all properties with higher corresponding reaction times, as well as compared to vibration and haptic in liquid level and weight indicating higher attentional load. Overall, audio feedback is seen to impose the lowest load for the robot-assisted pouring task. This aligns with the expected visual attentional load trade-off despite easier perception in the visual modality. Increased load in tactile, haptic, and thermal modalities may be attributed to kinesthetic interference in controlling the joystick and/or encumbrance. These would also be relevant factors to consider for a robot-assisted task with given control and input modalities. While DRT mean reaction time was found to be insignificant, it should be noted that the reaction time is computed only from hits while hit rate is a measure relative to the total of hits and misses. Despite this lack of significance, it is important to observe that the hit rate load increases are corroborated by consistently opposing reaction time trends, representing cognitive load without contradictions (i.e., lower hit rate and lower reaction time together).
The subjective preference score metric (Figure 9) is by far the most distinct measure between modalities. While the preference scores indicate that the visual modality was preferred consistently across all modalities, it is peculiar that for the remaining modalities, preferences vary depending on the property. The visual modality preference can be explained by our natural affinity for processing visual information, the ease of understanding text and color representations, as well as attributes such as low memory and effort requirements to retain the different category levels. While the audio feedback can have similar advantages, one repeated comment during experiments was that the repetitive vocalization of the category was irritating. Thus, for liquid level, it may have been viewed as an unnecessary inconvenience. The low preference score for thermal feedback, although modality-matched, may have resulted from confusion arising from perceiving temperature changes from one trial to the next and from initial to target temperature, as well as learning the association between skin temperature perception and oral temperature perception, which for some of the middle categories may have been counterintuitive. Overall, the subjective preference metric can be seen to have captured a number of different factors that would be useful to consider, and also presents the most variation between modalities.
4.2. Validation Experiments
Considering the first set of results (solution vs. control in Figure 13) we can conclude that the optimal solution is significantly more effective than the control treatment. This was true for all three metrics in the first and second use cases, and response time and subjective demand metrics in the tilt angle use case. The insignificance observed for tilt angle success may be attributed to the complexity of that task and may perhaps be observed more distinctly with a larger sample size. Overall, higher success rates, lower reaction times, and lower subjective load results demonstrated a clear and significant benefit from the presence of the feedback interface to aid in these tasks.
To determine whether the optimization approach yielded a near optimal solution, we compared the solution against an arbitrary design (Figure 13). Based on these means, the overall results observed were as expected across all the test cases with the solution performing with higher success rate and lower mental demand compared to the arbitrary mapping. While the arbitrary mapping was seen to improve response time and mental demand relative to the control, it performed as poorly or worse than the control in task success. This is arguably the most important performance metric for the interface because it reflects effective delivery of feedback and indicates that the optimization approach guarded against highly unreliable solutions. This observation underscores the value of the optimization approach used to produce the solution mapping.
Despite these promising observations in the means, only three of the comparisons (success for temperature task, subjective demand for temperature task, and subjective demand for empty vessel task) resulted in statistical significance in the differences. In all these comparisons that were significant, the optimal solution performed better than the arbitrary solution. In the remaining comparisons, the optimal solution performed better in means. This indicates that it had a considerable overall advantage over the arbitrary solution.
To further validate these results, we considered the costs generated for each of these mappings from the first set of screening experiments in the interpretation of these results. The total cost for the optimal solution was computed to be 0.634 while that of the arbitrary mapping was 1.011. However, there were a number of mappings that will result in even higher costs, the highest of which is 1.375 (mapping liquid level—haptic; weight—vibration; temperature—thermal). The difference between this worst mapping and the optimal (0.741) is almost double the difference of cost between the arbitrary solution (0.377) and the optimal. The arbitrary design tested here is placed in the mid-range of solution costs and we can expect the optimal solution to perform even better relative to a worse, higher-cost mapping and are likely to see increasing significance of results as the mapping cost increases. We can thus infer from these results that an effective solution was generated from the optimization strategy, and that it has effectively guarded against unreliable solutions that, as observed, may perform even worse than no feedback.
The results reported above are for only three of many possible use cases that could be constructed for this feedback. The solution feedback was determined to perform distinctly better than the control strategies based on the first analysis. Considering the complete set of results from the second analysis, the solution mapping was observed to have an advantage over the arbitrary mapping as evident in two of the three use cases and the trends in means. This visible advantage supports the use of the optimization approach in producing a sensory feedback interface. Further evaluation with more use cases, more elaborate versions of these use cases, and/or more subjects may also solidify these findings further.
5. Conclusions
In this study, an optimization approach was taken to develop a multimodal sensory feedback interface for robot-assisted tasks. Feedback perception accuracy, cognitive load, and subjective preference measures were selected as optimization metrics to produce a solution that balances effective feedback delivery with added attentional load requirements to those of controlling a robot. A robot-assisted pouring task was chosen as the functional task to be investigated. Three selected properties, temperature, weight, and liquid level, were configured to be conveyed through five available sensory feedback modalities including visual, audio, haptic, vibration, and thermal. A set of screening experiments were conducted to quantify the selected metrics. A subjective pairwise comparisons test was used to produce weighting coefficients for each of the metrics. The optimization problem was formulated and solved as a Linear Assignment Problem to generate the minimum cost property-to-modality assignment mapping. In a set of validation experiments with three selected use cases, the solution mapping was evaluated against a control treatment with alternative strategies and no feedback, and an arbitrarily mapped solution. Task success, response time, and subjective mental demand ratings were analyzed to evaluate the generated solution. Overall results indicate that the solution is significantly more effective than the control treatment and has considerable advantage over the arbitrary mapping solution. The proposed approach can therefore be concluded to have produced an effective solution for delivering feedback for robot-assisted tasks.
This approach addressed the contradicting requirements of providing effective sensory feedback to bridge the disconnection between the user and the task environment and minimizing the compounded cognitive load on robot operation which is by itself an attention-demanding function. It produced a solution that delivers information effectively, reduces the time taken to execute the task and improves user satisfaction and perceived mental effort. Bridging the multisensory feedback gap can expand the scope of robot-assisted tasks, increasing efficiency of the functions and processes that they are a part of, and advancing the utility of robots in the field and/or in the lives of users. The relevance of feedback for decision making—an overlooked aspect so far in robot-assisted tasks—is also demonstrated in this work. Further insights into the design considerations for such interfaces are generated from experimental findings, and results may also contribute towards further understanding of cognitive limitations associated with multisensory processing.
Author Contributions
Conceptualization, M.S.M.; methodology, M.S.M.; software, M.S.M.; validation, M.S.M., B.S.D. and J.P.W.; formal analysis, M.S.M.; investigation, M.S.M.; writing—original draft preparation, M.S.M.; writing—review and editing, B.S.D. and J.P.W.; visualization, M.S.M.; supervision, B.S.D. and J.P.W.; project administration, B.S.D. and J.P.W.; funding acquisition, B.S.D. and J.P.W. All authors have read and agreed to the published version of the manuscript.
Funding
This research was supported through the National Science Foundation Partnerships for Innovation (PFI-TT) #10001520 and NSF #2140612.
Data Availability Statement
The data presented in this study are publicly available on request from the corresponding author.
Acknowledgments
We are grateful to the participants of this study. We appreciate Mitch Sanchez for assistance in manuscript preparation.
Conflicts of Interest
The authors declare no conflicts of interest. The funders had no role in the design of the study; in the collection, analyses, or interpretation of data; in the writing of the manuscript; or in the decision to publish the results.
References
- Molinero, M.B.; Dagnino, G.; Liu, J.; Chi, W.; Abdelaziz, M.E.; Kwok, T.M.; Riga, C.; Yang, G.Z. Haptic Guidance for Robot-Assisted Endovascular Procedures: Implementation and Evaluation on Surgical Simulator. In Proceedings of the 2019 IEEE/RSJ International Conference on Intelligent Robots and Systems (IROS), Macau, China, 3–8 November 2019. [Google Scholar]
- Ta, Q.M.; Cheah, C.C. Cooperative and mobile manipulation of multiple microscopic objects based on micro-hands and laser-stage control. Automatica 2018, 98, 201–214. [Google Scholar] [CrossRef]
- Skaar, S.B.; Ruoff, C.F. Teleoperation and Robotics in Space; American Institute of Aeronautics and Astronautics, Inc.: Boulder, CO, USA, 1994. [Google Scholar]
- Kwon, D.-S.; Ryu, J.-H.; Lee, P.-M.; Hong, S.-W. Design of a teleoperation controller for an underwater manipulator. In Proceedings of the IEEE International Conference on Robotics and Automation. Symposia Proceedings, San Francisco, CA, USA, 24–28 April 2000. [Google Scholar]
- Trevelyan, J.; Hamel, W.R.; Kang, S.C. Robotics in Hazardous Applications. In Handbook of Robotics; Springer International Publishing: Cham, Switzerland, 2016; pp. 1521–1548. [Google Scholar]
- Higuchi, T.; Oka, K.; Sugawara, H. Clean room robot with non-contact joints using magnetic bearings. Adv. Robot. 1992, 7, 105–119. [Google Scholar] [CrossRef]
- Cui, J.; Tosunoglu, S.; Roberts, R.; Moore, C.; Repperger, D.W. A review of teleoperation system contol. In Proceedings of the Florida Conference on Recent Advances in Robotics, Boca Raton, FL, USA, 8–9 May 2003. [Google Scholar]
- Campeau-Lecours, A.; Maheu, V.; Lepage, S.; Lamontagne, H.; Latour, S.; Paquet, L.; Hardie, N. JACO Assistive Robotic Device: Empowering People with Disabilities through Innovative Algorithms. In Proceedings of the Rehabilitation Engineering and Assistive Technology Society of North America (RESNA) Conference, Arlington, VA, USA, 10–14 July 2016. [Google Scholar]
- Kim, D.; Wang, Z.; Paperno, N.; Behal, A. System Design and Implementation of UCF-MANUS—An Intelligent Assistive Robotic Manipulator. IEEE/ASME Trans. Mechatron. 2014, 19, 225–237. [Google Scholar] [CrossRef]
- Assistive Innovations. iArm. Available online: https://assistive-innovations.com/en/robotic-arms/iarm (accessed on 15 April 2021).
- North Coast Medical. North Coast Medical & Rehabilitation Products; North Coast Medical: Morgan Hill, CA, USA, 2015. [Google Scholar]
- Brose, S.W.; Weber, D.J.; Salatin, B.A.; Grindle, G.G.; Wang, H.; Vazquez, J.J.; Cooper, R.A. The Role of Assistive Robotics in the Lives of Persons with Disability. Am. J. Phys. Med. Rehabil. 2010, 89, 509–521. [Google Scholar] [CrossRef] [PubMed]
- Romer, G.R.B.E.; Stuyt, H.J.A.; Peters, A. Cost-savings and economic benefits due to the assistive robotic manipulator (ARM). In Proceedings of the 9th International Conference on Rehabilitation Robotics (ICORR), Chicago, IL, USA, 28 June–1 July 2005. [Google Scholar]
- Endsley, M. Toward a Theory of Situation Awareness in Dynamic Systems Society. Hum. Factors J. Hum. Factors Ergon. Soc. 1995, 37, 32–64. [Google Scholar] [CrossRef]
- Correal, R.; Jardón, A.; Martínez, S.; Cabas, R.; Giménez, A.; Balaguer, C. Human-Robot Coexistence in Robot-Aided Apartment. In Proceedings of the 23rd ISARC, Tokyo, Japan, 3–5 October 2006. [Google Scholar]
- Beckerle, P. Going beyond Traditional Surface Electromyography. In Proceedings of the First Workshop on Peripheral Machine Interfaces, 2017. Available online: https://www.frontiersin.org/articles/10.3389/fnbot.2014.00022/full (accessed on 15 April 2021).
- Burke, J.L.; Prewett, M.S.; Gray, A.A.; Yang, L.; Stilson, F.R.; Coovert, M.D.; Elliot, L.R.; Redden, E. Comparing the effects of visual-auditory and visual-tactile feedback on user performance. A meta-analysis. In Proceedings of the Eighth International Conference on Multimodal Interfaces, Banff, AB, Canada, 2–4 November 2006. [Google Scholar]
- Chen, J.H.E.B.M. Human performance issues and user interface design for teleoperated robots. IEEE Trans. Syst. Man Cybern. 2007, 37, 1231–1245. [Google Scholar] [CrossRef]
- Freeman, E.; Wilson, G.; Vo, D.B.; Ng, A.; Politis, I.; Brewster, S. Multimodal feedback in HCI: Haptics, non-speech audio, and their applications. In The Handbook of Multimodal-Multisensor Interfaces: Foundations, User Modeling, and Common Modality Combinations; Association for Computing Machinery and Morgan & Claypool: New York, NY, USA, 2017; pp. 277–317. [Google Scholar]
- Wickens, C. Multiple resources and mental workload. Hum. Factors J. Hum. Factors Ergon. Soc. 2008, 50, 449–455. [Google Scholar] [CrossRef] [PubMed]
- Hoecherl, J.; Schmargendorf, M.; Wrede, B.; Schlegl, T. User-Centered Design of Multimodal Robot Feedback for Cobots of Human-Robot Working Cells in Industrial Production Contexts. In Proceedings of the ISR 2018; 50th International Symposium on Robotics, Munich, Germany, 20–21 June 2018. [Google Scholar]
- Prewett, M.S.; Johnson, R.C.; Saboe, K.N.; Elliott, L.R.; Coovert, M.D. Managing workload in human–robot interaction: A review of empirical studies. Comput. Hum. Behav. 2010, 26, 840–856. [Google Scholar] [CrossRef]
- Ernst, M.O. A Bayesian View on Multimodal Cue Integration. In Human Body Perception from Inside Out; Oxford University Press: Oxford, UK, 2006; pp. 105–130. [Google Scholar]
- Martinez-Hernandez, U.; Boorman, L.W.; Prescott, T.J. Multisensory Wearable Interface for Immersion and Telepresence in Robotics. IEEE Sens. J. 2017, 17, 2534–2541. [Google Scholar] [CrossRef]
- Huang, S.; Ishikawa, M.; Yamakawa, Y. Human-Robot Interaction and Collaborative Manipulation with Multimodal Perception Interface for Human. In Proceedings of the HAI 1‘9: Proceedings of the 7th International Conference on Human-Agent Interaction, Kyoto, Japan, 6–10 October 2019. [Google Scholar]
- Lee, J.; Choi, M.H.; Jung, J.H.; Hammond, F.L. Multimodal sensory feedback for virtual proprioception in powered upper-limb prostheses. In Proceedings of the 2017 26th IEEE International Symposium on Robot and Human Interactive Communication (RO-MAN), Lisbon, Portugal, 28 August–1 September 2017. [Google Scholar]
- Nuamah, J.K.; Mantooth, W.; Karthikeyan, R.; Mehta, R.K.; Ryu, S.C. Neural Efficiency of Human–Robotic Feedback Modalities Under Stress Differs with Gender. Front. Hum. Neurosci. 2019, 13, 287. [Google Scholar] [CrossRef] [PubMed]
- Massimino, M.J.; Sheridan, T.B. Teleoperator performance with varying force and visual feedback. Hum. Factors 1994, 36, 145–157. [Google Scholar] [CrossRef] [PubMed]
- Richard, P.; Birebent, G.; Coiffet, P.; Burdea, G.; Gomez, D.; Lagrana, N. Effect of frame rate and force feedback on virtual object manipulation. Presence 1996, 5, 95–108. [Google Scholar] [CrossRef]
- Coovert, M.; Walvoord, A.; Elliot, L.; Redden, E. A tool for the accumulation and evaluation of multimodal research. IEEE Trans. Syst. Man Cybern. 2008, 24, 1884–1906. [Google Scholar] [CrossRef]
- Park, E.; Kim, K.J.; Del Pobil, A.P. The effects of multimodal feedback and gender on task performance of stylus pen users. Int. J. Adv. Robot. Syst. 2012, 9, 30. [Google Scholar] [CrossRef]
- van Huysduynen, H.H.; De Valk, L.; Bekker, T. Tangible play objects: Influence of different combinations of feedback modalities. In Proceedings of the TEI’16: Tenth International Conference on Tangible, Embedded, and Embodied Interaction, New York, NY, USA, 14–17 February 2016. [Google Scholar]
- Adebiyi, A.; Sorrentino, P.; Bohlool, S.; Zhang, C.; Arditti, M.; Goodrich, G.; Weiland, J.D. Assessment of feedback modalities for wearable visual aids in blind mobility. PLoS ONE 2017, 12, e0170531. [Google Scholar] [CrossRef] [PubMed]
- Vitense, H.S.; Jacko, J.A.; Emery, V.K. Multimodal feedback: An assessment of performance and mental workload. Ergonomics 2003, 46, 68–87. [Google Scholar] [CrossRef] [PubMed]
- Chung, C.S.; Wang, H.; Cooper, R.A. Functional assessment and performance evaluatioon for assistive robotic manipulators. J. Spinal Cord Med. 2013, 36, 273–289. [Google Scholar] [CrossRef] [PubMed]
- Zhang, T.; Duerstock, B.S.; Wachs, J.P. Multimodal Perception of Histological Images for Persons Who Are Blind or Visually Impaired. ACM Trans. Access. Comput. 2017, 9, 1–27. [Google Scholar] [CrossRef]
- Stern, H.I.; Wachs, J.P.; Edan, Y. Designing hand gesture vocabularies for natural interaction by combining psycho-physiological and recognition factors. Int. J. Semant. Comput. 2008, 2, 137–160. [Google Scholar] [CrossRef]
- Dunkelberger, N.; Bradley, J.; Sullivan, J.L.; Israr, A.; Lau, F.; Klumb, K.; Abnousi, F.; O’Malley, M.K. Improving Perception Accuracy with Multi-sensory Haptic Cue Delivery. In EuroHaptics 2018: Haptics: Science, Technology, and Application; Springer: Cham, Switzerland, 2018. [Google Scholar]
- Force Dimension. omega.7. Available online: https://www.forcedimension.com/products/omega (accessed on 15 April 2021).
- Engineering Acoustics. Advanced Tactile Array Cueing (ATAC) Technology. Available online: https://www.eaiinfo.com/tactor-landing/ (accessed on 15 April 2021).
- Jiang, H.; Wachs, J.P.; Pendergast, M.; Duerstock, B.S. 3D joystick for robotic arm control by individuals with high level spinal cord injuries. In Proceedings of the 2013 IEEE 13th International Conference on Rehabilitation Robotics (ICORR), Seattle, WA, USA, 24–26 June 2013. [Google Scholar]
- Visell, Y. Tactile sensory substitution: Models for enaction in HCI. Interact. Comput. 2009, 21, 38–53. [Google Scholar] [CrossRef]
- Jones, L.A. Kinesthetic sensing. In Human and Machine Haptics; MIT Press: Cambridge, MA, USA, 2000. [Google Scholar]
- Jimenez, M.C.; Fishel, J.A. Evaluation of force, vibration and thermal tactile feedback in prosthetic limbs. In Proceedings of the 2014 IEEE Haptics Symposium (HAPTICS), Houston, TX, USA, 23–26 February 2014. [Google Scholar]
- Munkres, J. Algorithms for the Assignment and Transportation Problems. J. Soc. Ind. Appl. Math. 1957, 5, 32–38. [Google Scholar] [CrossRef]
- Burkard, R.E.; Cela, E. Linear Assignment Problems and Extensions. In Handbook of Combinatorial Optimization; Kluwer Academic Publishers: Dordrecht, The Netherlands, 1999; pp. 75–149. [Google Scholar]
- Bourgeois, F.; Lassalle, J.C. An Extension of the Munkres Algorithm for the. Commun. ACM 1971, 14, 802–804. [Google Scholar] [CrossRef]
- Green, P.A.; Brandley, N.C.; Nowicki, S. Categorical perception in animal communication and decision-making. Behavioral Ecology 2020, 31, 859–867. [Google Scholar] [CrossRef]
- Harnad, S.R. Categorical Perception: The Groundwork of Cognition; University of Cambridge Press: Cambridge, UK, 1987. [Google Scholar]
- Jones, L.A.; Berris, M. The psychophysics of temperature perception and thermal-interface design. In Proceedings of the 10th Symposium on Haptic Interfaces for Virtual Environment and Teleoperator Systems. HAPTICS 2002, Orlando, FL, USA, 24–25 March 2002. [Google Scholar]
- ISO 17488:2016; Road Vehicles—Transport Information and Control Systems—Detection-Response Task (DRT) for Assessing Attentional Effects of Cognitive Load in Driving. ISO Ergonomics: Geneva, Switzerland, 2016.
- Bruyas, M.-P.; Dumont, L. Sensitivity of Detection Response Task (DRT) to the Driving. In Proceedings of the 2013 Driving Assessment Conference, Bolton, UK, 17–20 June 2013. [Google Scholar]
- Stojmenova, K.; Sodnik, J. Detection-Response Task—Uses and Limitations. Sensors 2018, 18, 594. [Google Scholar] [CrossRef] [PubMed]
- Thorpe, A.; Nesbitt, K.; Eidels, A. Assessing Game Interface Workload and Usability: A Cognitive Science Perspective. In Proceedings of the ACSW 2019: Proceedings of the Australasian Computer Science Week Multiconference, Sydney, Australia, 29–31 January 2019. [Google Scholar]
- Perlman, G. Chapter 37—Software Tools for User Interface Development. In Handbook of Human-Computer Interaction; Elsevier: Amsterdam, The Netherlands, 1988; pp. 819–833. [Google Scholar]
- Jahan, A.; Edwards, K.L. Chapter 4–Multiattribute Decision-Making for Ranking of Candidate Materials. In Multi-Criteria Decision Analysis for Supporting the Selection of Engineering Materials in Product Design; Butterworth-Heinemann: Oxford, UK, 2013; pp. 43–82. [Google Scholar]
- Wong, A.S.W.; Li, Y.I. 9—Overall comfort perception and preferences. In Woodhead Publishing Series in Textiles, Clothing Biosensory Engineering; Woodhead Publishing: Sawston, UK, 2006; pp. 167–177. [Google Scholar]
- Vidulich, M.A. The Cognitive Psychology of Subjective Mental Workload. Adv. Psychol. 1988, 52, 219–229. [Google Scholar]
- Vidulich, M.A.; Tsang, P.S. Techniques of subjective workload assessment: A comparison of SWAT and the NASA-Bipolar methods. Ergonomics 1986, 29, 1385–1398. [Google Scholar] [CrossRef]
- Maggino, F.; Ruviglioni, E. Obtaining weights: From objective to subjective approaches in view of more participative methods in. In Proceedings of the NTTS: New Techniques and Technologies for Statistics, Brussels, Belgium, 18–20 February 2009. [Google Scholar]
- Yoon, K.P.; Hwang, C. Multiple Attribute Decision Making: An Introduction; Sage Publications: Thousand Oaks, CA, USA, 1995. [Google Scholar]
- Ward, J. The Student’s Guide to Cognitive Neuroscience; Routledge: New York, NY, USA, 2019. [Google Scholar]
Figure 1.
Overall interface architecture. Blue arrows represent information flowing into the system from the user, while green arrows represent information flowing out of the system to the user as feedback.
Figure 1.
Overall interface architecture. Blue arrows represent information flowing into the system from the user, while green arrows represent information flowing out of the system to the user as feedback.

Figure 2.
The experimental setup with robot, joystick haptic device, feedback devices, and pouring task apparatus. A tumbler used as a sample vessel is also pictured in the robot grip.
Figure 2.
The experimental setup with robot, joystick haptic device, feedback devices, and pouring task apparatus. A tumbler used as a sample vessel is also pictured in the robot grip.

Figure 3.
Alternative strategies: touch (left) for temperature use case (case 01) and tap (right) for empty vessel and tilt angle use cases (case 02, 03).
Figure 3.
Alternative strategies: touch (left) for temperature use case (case 01) and tap (right) for empty vessel and tilt angle use cases (case 02, 03).

Figure 4.
Target tilt marking (left) and successful tilt (right).

Figure 5.
Means of perception accuracy for each property and modality. Error bars represent standard error. * indicates modalities significantly different from visual display (p < 0.05).
Figure 5.
Means of perception accuracy for each property and modality. Error bars represent standard error. * indicates modalities significantly different from visual display (p < 0.05).

Figure 6.
Means of change response accuracy for each property and modality. Error bars represent standard error. No modalities significantly different from visual display (p < 0.05).
Figure 6.
Means of change response accuracy for each property and modality. Error bars represent standard error. No modalities significantly different from visual display (p < 0.05).

Figure 7.
Means of DRT hit rate for each property and modality. Error bars represent standard error. * indicates modalities significantly different from visual display (p < 0.05).
Figure 7.
Means of DRT hit rate for each property and modality. Error bars represent standard error. * indicates modalities significantly different from visual display (p < 0.05).

Figure 8.
Means of DRT reaction time for each property and modality. Error bars represent standard error. No modalities significantly different from visual display (p < 0.05).
Figure 8.
Means of DRT reaction time for each property and modality. Error bars represent standard error. No modalities significantly different from visual display (p < 0.05).

Figure 9.
Means scores of subjective preference from AHP analysis for each property and modality. Error bars represent standard error. * indicates modalities significantly different from visual display (p < 0.05).
Figure 9.
Means scores of subjective preference from AHP analysis for each property and modality. Error bars represent standard error. * indicates modalities significantly different from visual display (p < 0.05).

Figure 10.
Weights generated for cost function with all metrics (left) and significant metrics only (right).
Figure 10.
Weights generated for cost function with all metrics (left) and significant metrics only (right).

Figure 11.
Bipartite graph for solution mapping assignment. The optimal solution mapped liquid level to vibration, weight to audio, and temperature to the visual display.
Figure 11.
Bipartite graph for solution mapping assignment. The optimal solution mapped liquid level to vibration, weight to audio, and temperature to the visual display.

Figure 12.
Solution vs. control means (12 subjects, 24 trials) for success (top), response time (middle), and subjective mental demand (bottom) in temperature (case 01), empty vessel (case 02), tilt angle (case 03) tasks. Error bars represent standard error. * indicates significantly different groups.

Figure 13.
Solution vs. arbitrary and control means (7 subjects, 14 trials) for success (top), response time (middle), and subjective mental demand (bottom) in temperature (case 01), empty vessel (case 02), tilt angle (case 03) tasks. Error bars represent standard error. * indicates groups with solution significantly different from arbitrary solution.


Table 1.
Cost matrix indicating candidate modalities. Black cells indicate maximum cost initial conditions. Each column i corresponds to a property and each column j corresponds to a modality.
Table 1.
Cost matrix indicating candidate modalities. Black cells indicate maximum cost initial conditions. Each column i corresponds to a property and each column j corresponds to a modality.
| i | ||||
| j | Weight | Temperature | Liquid Level | |
| Haptic | ||||
| Visual | ||||
| Vibratory | ||||
| Audio | ||||
| Thermal | ||||
Disclaimer/Publisher’s Note: The statements, opinions and data contained in all publications are solely those of the individual author(s) and contributor(s) and not of MDPI and/or the editor(s). MDPI and/or the editor(s) disclaim responsibility for any injury to people or property resulting from any ideas, methods, instructions or products referred to in the content. |
© 2024 by the authors. Licensee MDPI, Basel, Switzerland. This article is an open access article distributed under the terms and conditions of the Creative Commons Attribution (CC BY) license (https://creativecommons.org/licenses/by/4.0/).
Share and Cite
MDPI and ACS Style
Marambe, M.S.; Duerstock, B.S.; Wachs, J.P. Optimization Approach for Multisensory Feedback in Robot-Assisted Pouring Task. Actuators 2024, 13, 152. https://doi.org/10.3390/act13040152
AMA Style
Marambe MS, Duerstock BS, Wachs JP. Optimization Approach for Multisensory Feedback in Robot-Assisted Pouring Task. Actuators. 2024; 13(4):152. https://doi.org/10.3390/act13040152
Chicago/Turabian StyleMarambe, Mandira S., Bradley S. Duerstock, and Juan P. Wachs. 2024. "Optimization Approach for Multisensory Feedback in Robot-Assisted Pouring Task" Actuators 13, no. 4: 152. https://doi.org/10.3390/act13040152
Note that from the first issue of 2016, this journal uses article numbers instead of page numbers. See further details here.