
Multi-Objective Optimization of Two-Stage Helical Pairs in Helical Hydraulic Rotary Actuator Using Ensemble of Metamodels and NSGA-II

School of Mechanical Science and Engineering, Institute of Marine Mechatronics Equipment, Huazhong University of Science and Technology, Wuhan 430074, China
*
Author to whom correspondence should be addressed.
Actuators 2023, 12(10), 385; https://doi.org/10.3390/act12100385
Submission received: 7 September 2023
/
Revised: 4 October 2023
/
Accepted: 10 October 2023
/
Published: 13 October 2023
(This article belongs to the Special Issue Innovative and Intelligent Actuation for Heavy-Duty Applications)
Abstract
:This paper aims to optimize the two-stage helical pairs (TSHPs) in a helical hydraulic rotary actuator (HHRA) in terms of volume, transmission efficiency, and maximum contact stress. Volume and transmission efficiency can be determined through analytical mathematical models. However, calculating the contact stress of helical pairs necessitates complex and time-consuming finite element simulation. To address this issue, a method for predicting the maximum contact stress using an ensemble of metamodels (EMs) is proposed, with an automated finite element simulation process developed for data provision. The superiority of the EMs is validated through comparative analysis with three stand-alone metamodels. The optimization is carried out using the NSGA-II algorithm, including four combinations of the three objectives, and global sensitivity is analyzed over the objectives. The results indicate a trade-off relationship between maximum contact stress and volume in the optimal space. Moreover, considering multiple combinations enhances the robustness of the optimization results. The method is effectively applied to the design of the TSHPs and provides a new idea for the related actuator design.
1. Introduction
The helical hydraulic rotary actuator (HHRA) is a specialized hydraulic cylinder that employs two-stage helical pairs (TSHPs) with substantial lead angles to generate rotational motion, effectively converting hydraulic energy into mechanical energy [1]. As illustrated in Figure 1, the internal structure of a typical HHRA primarily comprises an output shaft, piston, fixed nut, and cylinder. The first-stage helical pair is composed of the internal teeth (nut) of the piston and the external teeth (screw) of the output shaft, while the second-stage helical pair consists of a fixed nut and the screw of the piston. Under the influence of differential pressure between the inlet and outlet, the piston is compelled to perform a reciprocating helical motion due to the TSHPs, which concurrently drive the output shaft to reciprocate rotation, generating both angle and torque. Owing to its distinctive two-stage helical pairs, the HHRA offers several advantages over alternative hydraulic rotary actuators, including a compact structure, small size, large output torque, extensive rotation angle, and high transmission efficiency [2].
The advancement of hydraulic actuators towards high pressure and high power density represents an inevitable progression. This development demands that the HHRA optimally outputs torque and rotation angle within restricted spatial constraints while minimizing energy consumption and ensuring enhanced durability. These requirements present a significant challenge for the design of TSHPs. Although the TSHPs designed following conservative standards, such as ISO or AGMA, can satisfy fundamental required strength, they often lack advantages in dimensions, efficiency, and durability, and may even fail to meet design specifications. Furthermore, while the geometric characteristics of the TSHPs share similarities with those of gear pairs, notable distinctions exist. In the case of the TSHPs, the helix angle is reduced, and all teeth engage during operation, serving to actualize the screw drive rather than the gear drive. As a result, in addition to the customary considerations of volume, transmission efficiency, and contact stress in gear drive, the output torque and rotation angle must also be factored into the design of the TSHPs. The incorporation of additional dynamic features exacerbates the complexity of the TSHP design, necessitating more comprehensive research to determine an optimal approach for achieving superior performance. However, within the scope of the literature reviewed by the present authors, no studies have been found that address the optimization of the TSHPs. Consequently, the rational design of high-performance TSHPs requires further in-depth investigation.
The optimal design of gear structures can be categorized into macro-geometry design and micro-geometry modifications [3]. These designs necessitate the optimization of numerous variables, rendering traditional manual trial-and-error approaches cumbersome and inefficient for identifying optimal solutions. With the development of computer technology, metaheuristic algorithms have emerged as a widely adopted solution to address these challenges. Miler et al. [4] employed a genetic algorithm to optimize the macro-geometry of gear pairs with the objective of minimizing weight. Subsequently, they incorporated power losses into the objectives and utilized the non-dominated sorting genetic algorithm-II (NSGA-II) for multi-objective optimization of macro-geometry parameters in steel and polymer gears [5,6]. Atila et al. [7] compared the strengths and weaknesses of various commonly used metaheuristic optimization methods in the context of gear design optimization. Additionally, beyond their application in the optimization of gear structures, metaheuristic algorithms have also been successfully utilized for fault diagnosis of electro-mechanical actuators [8], global optimization in power point tracking of partially shaded solar photovoltaic systems [9], and optimizing deep learning models for secure IoT environments [10]. Collectively, metaheuristic algorithms demonstrate superior performance and are broadly applicable to various types of engineering optimization designs. However, the direct application of metaheuristic algorithms in the TSHPs optimization presents significant challenges when it comes to contact stress. This is primarily due to the strong nonlinearity of calculating contact stress, for which a finite element method (FEM) is required to obtain accurate results, despite its time-consuming and cumbersome nature [11]. Furthermore, metaheuristic algorithms require hundreds of iterations to identify optimal solutions, resulting in excessive computational resources and unacceptably long simulation times when combined with the FEM [5]. One approach to addressing these issues is to replace the original FE model with a more cost-effective surrogate model. Metamodeling techniques, such as polynomial response surface (PRS) [12], radial basis function [13], Kriging (KRG) [14,15], and support vector regression (SVR) [16], provide simpler, easier-to-calculate surrogate models in place of complex actual models. Numerous engineering cases have successfully applied metamodeling techniques for mathematical modeling and optimization. For instance, Tang et al. [17] built a hydrodynamic metamodel of the orifice plate using an adaptive sampling method and a BP neural network to improve design efficiency. Jaiswal et al. [18] employed an ensemble of metamodels (EMs) to establish a mapping relationship between the input power of a centrifugal pump and the blade parameters. Zhang et al. [19] utilized the NURBS method to parameterize glider shape and constructed a Kriging-based optimization framework for the optimal lift–drag ratio. Huang et al. [20] established a Kriging model of the mechanical extraction process of crude camellia oil and optimized the process parameters using NSGA-II.
Despite the widespread success of metamodeling techniques, their application in related gear design remains relatively limited. Among the scarce literature available, the research findings of Zhang et al. [21] and Korta et al. [22] are particularly noteworthy. Zhang et al. [21] employed the Kriging method to construct a metamodel for large gear strength responses and used genetic algorithms (GA) to perform reliability optimization, identifying an optimal set of macro-geometric parameter values. In a separate study, Korta et al. [22] investigated the applicability of three distinct stand-alone metamodels in gear profile modification optimization. The results indicated that the Gaussian process (GP) model could better predict gear stress and static transmission errors, and the performance of gear profile modification using metamodeling techniques combined with optimization algorithms was significantly enhanced compared to unmodified gears. The research of Korta et al. [22] reveals that different metamodels are suitable for various types of problems, and the accuracy of a metamodel largely depends on its selection. As it is challenging to predict which metamodel will be most effective beforehand, the process of choosing the optimal metamodel can be cumbersome and time-consuming. In contrast to stand-alone metamodels, the ensemble of metamodels [23] represents a promising metamodeling technology that capitalizes on the advantages of various metamodels while circumventing the tedious selection process. Further research is needed to explore the applicability of the EMs for predicting contact stress or optimizing related gear design.
The primary aim of this study is to conduct multi-objective optimization of the TSHPs, with the goal of achieving minimized volume, enhanced efficiency, and prolonged surface fatigue life. Additionally, the study explores the applicability of the EMs for predicting maximum contact stress in helical pairs. The rest of this paper is structured as follows: Section 2 establishes analytical mathematical models for the rotation angle, output torque, and transmission efficiency of the HHRA, as well as a FEM automation simulation model for the maximum contact stress. Section 3 develops an EM for the maximum contact stress. Section 4 presents the comprehensive design optimization process. Section 5 analyzes the superiority of EMs, the results of multi-objective optimization, and the global sensitivity of design variables. Section 6 outlines the conclusions of the paper.
2. Mathematical Model
This subsection primarily focuses on the modeling process for key output characteristics of the TSHPs, including rotation angle, output torque, transmission efficiency, overall volume, and contact stress. These indicators play a crucial role in the design of the TSHPs. To distinguish more intuitively between the first- and second-stage helical pairs, the subscript “” is utilized to denote the ith stage helical pair in the subsequent formulas and symbols presented in this paper. When i = 1, it represents the corresponding parameters of the first-stage helical pair. When i = 2, it represents the corresponding parameters of the second-stage helical pair.
2.1. Analytical Modeling
2.1.1. Rotation Angle
A schematic diagram of the motion model of the TSHPs is shown in Figure 2. Assuming that the piston moves a distance of along the axis due to a pressure difference, the piston rotates by degrees, and the output shaft rotates simultaneously by degrees relative to the piston. The following equations can be obtained:
where denotes the screw lead. As per the ISO standard [24], , where represents the modulus, signifies the number of teeth, and refers to the helix angle of the graduated circle.
Based on the principle of relative motion, the absolute rotation angle of the output shaft, denoted as A, can be expressed as follows:
2.1.2. Transmission Efficiency and Output Torque
To provide an intuitive visualization of the force state of the TSHPs, a schematic diagram of the screw is presented in Figure 3.
Based on the force decomposition analysis, the following relationship can be derived:
where is the normal force at the meshing point, , , and are the force components of along the axial, radial, and circumferential direction, respectively. is the friction force, is the total circumferential force auto-simulation, is the hydraulic actuator force, is the bearing reaction force, is normal pressure angle, and is friction coefficient.
The theoretical output torque , considering the surface friction of the TSHPs, can be deduced from Equation (3):
where is the diameter of graduated circle. is the equivalent friction angle, , is the equivalent friction coefficient, and .
Assuming that the contact surface of the friction pair is smooth, denoted as , then the output torque of the HHRA under ideal conditions can be derived as follows:
Thus, the transmission efficiency of the HHRA can be expressed as:
Taking as the mechanical efficiency excluding the friction loss of the TSHPs, with a value of 0.9 [25], the theoretical output torque T of the HHRA can be expressed as:
2.1.3. Volume of TSHPs
The schematic diagram of the TSHPs is simplified and shown in Figure 4. It can be seen that the volume of the TSHPs not only refers to its actual volume but also to the space of the piston movement inside the HHRA, which can be expressed as:
where D signifies the cylinder’s diameter. As per the ISO standard [24], , where represents the top height factor, set as 0.8 for this study. l denotes the original length of the TSHPs, manually adjusted by technicians in accordance with working conditions. Combining the above equation with Equation (2), V can also be expressed as follows:
2.1.4. Model Validation
A prototype of the HHRA has been developed, and a test stand for the HHRA has been established. The purpose of the experiment is to record both the maximum output angle and maximum output torque of the HHRA under different pressures. The validity of the analytical mathematical model is then confirmed through a comparison of its computed results with the experimental data collected.
The hydraulic test stand is depicted in Figure 5. The HHRA is connected to the end load via shaft couplings. The end load can be either a mechanical clutch, which tests the maximum output torque of the HHRA, or a disc loading, which evaluates the maximum rotation angle and assesses the overall functionality. The rotation angle of the HHRA is measured using an angle sensor, while the output torque is obtained from the torque sensor, as shown in Figure 5.
The mechanical clutch is locked, and the inlet pressure of the HHRA is adjusted to obtain the maximum output torque under various differential pressures. The HHRA is operated unloaded to measure its maximum rotation angle. Figure 6 presents a comparison between the test results and the simulation data, with annotations indicating the simulation errors at different experimental test points. The comparison results reveal a congruence between the simulated and experimental rotation angles. Both the simulated and experimental curves for maximum output torque display analogous trends and exhibit an approximate linear distribution with the simulation error for the angle consistently measuring 0.18%, and the maximum simulation error for the torque not exceeding 2%. The results demonstrate that the established analytical mathematical model is highly accurate and effectively characterizes the rotation angle, maximum output torque, and transmission efficiency.
2.2. Finite Element Model
2.2.1. Model Building
The commercial FEM analysis software ABAQUS is employed to simulate the contact stress of the helical pair, and the following assumptions are made: the machining error and gear tooth backlash of the helical pair are disregarded, implying that all teeth uniformly mesh and share an equal load. The 3D model is generated using the commercial software CATIA, with simplifications made for features that minimally impact simulation outcomes. The material properties of the helical pair are presented in Table 1. An eight-node linear element with reduced integration (C3D8R) is utilized to mesh the 3D model, incorporating local refinement in the contact area and rounded corners, as depicted in Figure 7. The teeth of the screw and nut are designated as the target and contact surface with finite sliding, and the contact property is defined as “hard”. Fixed constraints are applied to the outer surface of the nut, while all degrees of freedom of the screw are constrained, except for rotary motion and linear movement along the axial direction. Torque is applied to the screw, and a displacement of S is applied to the piston along the axial direction, causing it to traverse from one end of the fixed nut to the other. The stress nephogram of the piston at each position during movement can be obtained. The analysis is divided into 11 steps, with each step corresponding to a specific displacement, denoted as . The ABAQUS/Standard solver is employed to solve the model. The maximum contact stress for each step and the average maximum contact stress for all steps can be extracted from the contact stress nephogram, as illustrated in Figure 8.
2.2.2. Automatic FEM Analysis Process
To simplify the FE modeling process, eliminate time-consuming manual operations and enable the FEM simulation results to be directly invoked by the optimization algorithm, an automated FEM simulation workflow has been developed. Initially, Python was employed for the secondary development of CATIA Automation, enabling automatic parameterization of the geometric model. Subsequently, an ABAQUS-based FE model for the maximum contact stress is implemented using a Python script, facilitating automatic simulation. This process is illustrated in Figure 7.
2.2.3. Contact Stress
As the HHRA operates, the TSHPs engage in helical transmission, leading to meshing interactions between the helical pairs, which generate localized, concentrated internal material pressure at contact points. The magnitude of contact stress is crucial for the design of related gear structures, as excessive contact stress directly contributes to tooth surface wear and pitting [26]. Helical pairs with varying sizes and dimensional parameters exhibit distinct contact stresses under identical loads. Among these, the first-stage helical pair has a smaller diameter compared to the second-stage one. When subjected to the same torque, the tooth surface pressure acting on the first-stage helical pair is greater, making them more susceptible to tooth surface wear and pitting. Consequently, it is essential to monitor and minimize the contact stress of the first-stage helical pair to prevent its premature fatigue failure. Since helical transmission is a dynamic process, contact stress varies with the relative positions of the screw and nut. Figure 8 illustrates an example of the maximum contact stress history at various relative positions as the screw moves along the nut. It can be observed that as the screw moves from the beginning to the end of the nut, the maximum contact stress gradually decreases and slightly increases at the end. The goal is to reduce each maximum contact stress throughout the entire motion. Therefore, in the subsequent metamodel construction process, the contact stress to be predicted is defined as the average value of the maximum contact stress throughout the entire helical transmission process.
2.2.4. FE Model Convergence Analysis
The maximum contact stress during the helical transmission cycle of the helical pair serves as the criterion for FE convergence analysis. Figure 8 displays the full-cycle maximum contact stress curves obtained from FE models with three different mesh sizes. According to the results, when the number of elements is 431,930, the FEM results essentially converge. This value ensures a good balance between result accuracy and simulation efficiency. Consequently, this element size has been selected for the simulation.
3. Ensemble of Metamodels
3.1. Basic Theory of Stand-Alone Metamodels
In order to establish an exact relationship between the contact stress and the macro-geometry parameters of the helical pair, an EM based on the generalized mean square cross-validation error (GMSE) [23] is employed in this paper. Three stand-alone metamodels, specifically PRS [12], KRG [14,15], and SVR [16], are utilized to construct the metamodel due to their applicability to varying degrees of non-linearity, dimensions, smoothness, and noisy responses [27]. The fundamental theories of the three metamodels are described as follows.
3.1.1. Polynomial Response Surface
The second-order polynomial model, a widely used PRS technique, is formulated as:
where is the predicted value of the actual response function, , is the ith and jth design variables, k is the number of design variables, and and are the unknown parameters that need to be determined using the least-squares method.
3.1.2. Kriging Model
The Kriging model is one of the most famous surrogate models based on the Gaussian process. An ordinary Kriging model can be expressed as:
where represents the mean value of the Kriging prediction function, corresponds to the error term of a Gaussian process with a zero mean but a nonzero variance, and its covariance can be expressed as follows:
where is a correlation function mainly affected by the distance between the sample points and , and is the symmetric correlation matrix.
3.1.3. Support Vector Regression
SVR prediction can be achieved by linear or nonlinear regression. When linear regression is carried out, then the function is formulated as:
where is the dot product between and . The approximate function should be as flat as feasible. In order to achieve that, the optimization problem can be expressed as:
where is the predicted value of the actual response function at point , and b is the intercept.
The dot product in Equation (13) can be replaced by a kernel function when the nonlinear regression is considered. Finally, the output response of the SVR model can be obtained through:
where and are the Lagrangian multipliers and is the kernel function. The Gaussian function is employed in this paper since it is one of the most commonly used kernel functions.
3.1.4. Calculation of Weight Factors
The weight factor for each metamodel is proportional to its modeling accuracy. Higher-accuracy metamodels receive larger weight factors, whereas lower-accuracy ones are assigned smaller weights. This paper utilizes the GMSE, a distinguished and extensively applied criterion, as the hybrid error measure to amplify the reliability of the error metric.
The weight factor of the ith individual metamodel can be defined as:
where subscript i represents the ith metamodel and superscript j represents the jth sample point. is the hybrid error metric of the ith metamodel at prediction point.
The can be calculated by:
where is the Leave One Out Cross-Validation value of the ith metamodel at the jth sample point, is the true value at the jth sample point, and is the corresponding predicted value according to the ith metamodel built based on all sample points except .
3.2. Evaluation Functions for Metamodel
To assess the accuracy of the metamodels, two commonly used error metrics, root mean squared error (RMSE) and maximum absolute error (MAE), are introduced. The RMSE represents the overall accuracy of the metamodel, while the MAE provides insight into its local precision. To ensure the accuracy of the metamodel, MAE should be minimized. Additionally, a lower RMSE value signifies a higher degree of prediction model accuracy.
where N is the number of test points, is the actual value at the jth test point, and is the corresponding predict value.
3.3. Design of Experiment
The optimized Latin hypercube sampling (OLHS) method [28], a commonly used experimental design method, is employed for generating sampling points as part of the design of experiments (DOE). By substituting the sampling points into the automatic simulation process described in Section 2.2.2, the corresponding output values can be obtained. Before establishing the metamodel, it is essential to determine the number of sample points needed to ensure accuracy. Therefore, 20 additional points are generated by the OLHS method to estimate the error of the metamodels. The RMSE and MAE values corresponding to the five different sample sizes (25, 50, 75, 100, 125) obtained from the EMs based on the GMSE criterion are compiled in Figure 9.
As seen in the figure, when the number of sample points is less than 75, both the RMSE and MAE values decrease significantly with the increase in sample points. This illustrates that when there are fewer sample points, increasing the number of sample points can significantly enhance model accuracy. However, when the number of sample points exceeds 75, the decrease in RMSE and MAE values with increasing sample points is slight, and the improvement in model accuracy is also very limited. Given that FE simulation in this study is time-consuming, a balance between simulation cost and model accuracy is sought. Hence, 75 sample points are selected for constructing the EMs in this paper.
4. Optimization Process
4.1. Optimization Problem
The optimization aims to minimize the volume V, reduce the contact stress of the first-stage helical pair , and maximize the transmission efficiency . The macro-geometric characteristics of the TSHPs are determined by the modulus m, the number of teeth z, and the helix angle . Consequently, these essential structural parameters serve as design variables. Importantly, the modulus is discrete, based on the modulus criterion, and the number of teeth is an integer, requiring adherence to specific rules. However, during the TSHPs optimization, both the modulus and the number of teeth may deviate from these rules. To address this problem, the closest standard modulus is assigned to update the new modulus, while decimals are replaced with rounded numbers to resolve the integer limitation for the teeth. The design space and initial values of these parameters are presented in Table 2.
Concurrently, the minimum output torque ( in this study) and the minimum rotation angle ( in this study) represent essential technical requirements that must be met, while the maximum bending stress must satisfy fundamental strength requirements, thereby establishing them as constraints. Moreover, as illustrated in Figure 2, the piston necessitates maintaining a specific thickness to withstand torque, thus demanding adherence to strength requirements under pure shear stress. As a result, the optimization problem can be formulated as follows:
Find:
To minimize:
Subject to:
where and represent the shear stress experienced by the piston and the allowable shear stress, respectively. denotes the calculated torque, with , and K is the correction factor, which is 1.2 here. signifies the section modulus in torsion of the piston, given by . Here, refers to the root circle diameter of helical teeth.
In the domain of multi-objective optimization design, the selection of distinct criteria as objectives yields markedly divergent outcomes [29]. Consequently, the choice of objectives necessitates alignment with practical requirements. To better analyze the impact of different combinations of objectives on the optimization results of the TSHPs, this paper not only considers the combination of volume, transmission efficiency, and contact stress of the TSHPs as objectives but also examines their pairwise combinations for comparative evaluation. The specific combinations are as follows:
- a.
- Volume + Contact Stress + Transmission Efficiency (Vl + CS + TE)
- b.
- Volume + Contact Stress (Vl + CS)
- c.
- Volume + Transmission Efficiency (Vl + TE)
- d.
- Contact Stress + Transmission Efficiency (CS + TE)
4.2. Optimization Workflow
The proposed optimization procedure is depicted in Figure 10. The optimization program is run in MATLAB R2022b, and the overall optimization steps of multi-objective optimization of the TSHPs can be expressed as follows:
- Step 1: Model building
This process entails the development of analytical mathematical models and the EMs of the TSHPs, as previously described.
- Step 2: Multi-objective optimization
The optimization procedure was performed using the constrained NSGA-II, notable for its rapid non-dominated sorting technique, effective crowding distance assignment for population front ranking and selection, and genetic operators. The principal procedure is depicted in the NSGA-II module within Figure 10. Hyperparameters were configured with a population size of 300, crossover probability and mutation probability of 0.8 and 0.5, respectively, and a maximum generation count of 500 [30]. For an extensive understanding of NSGA-II, please refer to the study by Deb et al. [31].
- Step 3: Global sensitivity analysis
Understanding the degree of influence each design variable exerts on the optimization objectives is crucial. As the sensitivity analysis method can provide an intuitive and quantitative estimation of this influence, a commonly used global sensitivity analysis method, Sobol’s method [32], is performed based on the established model. The degree of influence of a single variable or multiple variables and their interactions with the optimization objectives is analyzed. For a more detailed exploration of Sobol’s global sensitivity analysis method, please refer to the study by Sobol [32].
5. Results and Discussions
5.1. Test of the EMs
To verify the superiority of the EMs based on the GMSE error criterion in predicting the maximum contact stress of helical pair, a comparative analysis was conducted with three stand-alone metamodels—PRS, KRG, and SVR. The test object is the average maximum contact stress obtained from the FEM result, and four sets of tests are conducted with different initial sampling points: 25, 50, 75, 100, and 125. The test results are shown in Table 3.
The results indicate that no stand-alone metamodel consistently maintains high prediction accuracy across all sample sizes. For example, the PRS model exhibits the best prediction accuracy when the sample points are 50, 75, and 100, but its accuracy is inferior to KRG and SVR when the sample points are 25. In contrast, the EMs demonstrate better prediction accuracy than the stand-alone metamodels in all sample point tests. This is because the EMs can utilize the predictive capabilities of different stand-alone metamodels, enhancing the prediction accuracy. Moreover, it can be seen that for the stand-alone metamodels and EMs, when the sample size is less than 75, both RMSE and MAE values decrease with increasing sample size, indicating an improvement in model precision. However, when the sample size exceeds 75, the RMSE and MAE values of the EMs still decrease with increasing samples, while some stand-alone metamodels exhibit a significant increase in RMSE and MAE values, indicating overfitting during model fitting. For the EMs, no saturation effect was discerned within 125 samples, indicating stronger robustness compared to stand-alone metamodels. Consequently, the EMs exhibit higher prediction accuracy and robustness in the problem studied, achieving the highest fitting accuracy for the original model.
5.2. Optimization Results
The NSGA-II algorithm was utilized to tackle the optimization problem discussed above, resulting in Pareto solutions for four combinations, as illustrated in Figure 11a. Each point in this figure represents a potential optimal solution, providing designers with a range of options that can be chosen based on specific project requirements. The Pareto solutions for the four combinations are differentiated by employing scatter plots with unique colors and shapes. To further clarify the interplay among the different objectives, the three-dimensional Pareto solutions derived from Figure 11a are projected onto the three coordinate planes. This approach allows visualization of the Pareto solutions for the bilateral relationships between two objectives. Specifically, Figure 11b displays the two-dimensional Pareto solution combining contact stress and volume. Figure 11c elucidates the two-dimensional Pareto solution integrating contact stress and transmission efficiency. Lastly, Figure 11d illustrates the two-dimensional Pareto solution comprising volume and transmission efficiency.
As discerned from Figure 11a, each point exhibits varying degrees of superiority and inferiority, suggesting the nonexistence of a singular design point that simultaneously optimizes all objectives. When a specific objective value of point 1 surpasses that of point 2, there is an inevitable superiority of the other objective value of point 2 over that of point 1, signifying the non-dominance characteristic in the Pareto solution. Furthermore, the Pareto solutions of different combinations exhibit traits of both “concentration” and “scattering”. “Concentration” is manifested when adjacent scatter points compile into a near-continuous “curve”, whereas “scattering” is discernible in the relative segregation and discontinuity of these curves. Examination of the design variables corresponding to the objective values reveals that the scatter points on the same “curve” possess identical quantities of teeth and modules, with continuous alterations in helix angle inducing shifts in the “curve” trend. Conversely, the scatter points on different “curves” display varying quantities of teeth and modules. Given that both the number of teeth and modules are discrete variables, the discreteness of design variables also contributes to the discontinuity of the Pareto solutions, resulting in the "scattering" characteristic of different “curves”. A meticulous inspection of Figure 11a uncovers that for the Vl + CS + TE combination, the three-dimensional Pareto solution forms multiple “curves” exhibiting pronounced spatial discontinuity along the volume coordinate axis. As the major cause of spatial discontinuity between “curves” is the fluctuation in the number of teeth and modules, it can be inferred that these factors exert a significant influence on the volume of the TSHPs. Considering that both the number of teeth and modules can markedly modify the diameter of the helical pair, thereby influencing the overall volume, this inference is congruent with realistic scenarios. Lastly, the spatial distribution of the Pareto solution for the Vl + CS + TE combination is the most dispersed, a trait also mirrored in the presence of optimal solutions in all objective directions compared to the other three combinations. The Vl + CS combination is ranked as the second most dispersed, while the CS + TE combination presents a relatively compact spatial distribution, and the Vl + TE combination is the densest. Furthermore, the three-dimensional Pareto solution in the Vl + CS + TE combination reveals clear spatial discontinuity between the “curves”. However, these discrete “curves”, when projected along the transmission efficiency coordinate axis (refer to Figure 11b), appear to form an almost continuous new “curve”. This new “curve” distinctly signals a trade-off relationship—as contact stress increases (decreases), the volume correspondingly shrinks (grows). To better discern the patterns in Figure 11b, the x-axis coordinates were segmented into distinct regions, as illustrated in Figure 12. The slope of the curve intuitively represents the trade-off relationship between contact stress and volume. This relationship can be articulated as Equation (22):
where denotes the increase in volume and represents the increase in contact stress.
Upon further examination of Figure 12, the volume and contact stress in the lower-left region of the new “curve” mentioned above are both reduced compared to the upper-right region, suggesting that the upper-right region dominates the lower-left region. This “curve” represents the Pareto frontier considering only volume and maximum contact stress. The scatter points of the Pareto solution located at the far left of the “curve” correspond to the highest volume and the lowest contact stress. As these points shift from left to right along the x-axis within region D, the volume drops sharply with the rise in contact stress. This region witnesses the contact stress increasing from 87 MPa to 155 MPa, while the volume shrinks from 1380 to 846 , yielding a K value of −7.9 . Within this region, a minor decrease in contact stress results in a substantial volume surge. As the scatter points keep shifting towards the positive x-axis direction within region C, the rate of volume decrease gradually moderates. Here, the contact stress rises from 155 MPa to 255 MPa, while the volume shrinks from 846 to 532 , with a K value of −3.1 . This region essentially acts as a transitional region for the rates of volume change. The scatter points continue their movement in the positive x-axis direction within region B, where the volume decrease rate decelerates even further. In this region, the contact stress ascends from 255 MPa to 400 MPa, and the volume diminishes from 532 to 382 , yielding a K value of −1 . It can be inferred that a volume reduction by 1 necessitates a sacrifice of 1 MPa of contact stress in this region. Notably, compared to regions C and D, the volume decrease rate in this region is more gradual and consistent. As the scatter points continue moving towards the far right of the “curve” in region A, the contact stress surges from 400 MPa to 500 MPa, while the volume contracts from 382 to 355 , with a K value of −0.3 . The volume change in this region is minimal, and at the far right of the “curve”, the volume remains mostly stable. In this context, a slight volume reduction triggers a significant increase in contact stress. For the Vl + CS combination, the “curve” trajectory formed by the Pareto solution scatter points mirrors that of the Vl + CS + TE combination. However, within the confines of region B and a significant portion of region C, the “curve” of the Vl + CS combination leans more towards the lower-left coordinate space in comparison to the Vl + CS + TE combination, and its Pareto solution ultimately dominates the latter. Clearly, the Vl + CS combination, which disregards transmission efficiency, can yield relatively superior results in terms of volume and contact stress. For the CS + TE combination, the Pareto solution set primarily resides in region D of the Vl + CS + TE combination. This arises from the combination focus on optimizing maximum contact stress and transmission efficiency, excluding volume consideration. Therefore, the solution set of this combination leans towards lower contact stress and heightened transmission efficiency. Considering the trade-off relationship between volume and contact stress, discussed in the paper, this optimization combination also exhibits a larger volume. Thus, its associated solution set concentrates on regions characterized by lower contact stress, enhanced transmission efficiency, and larger volume. In contrast, for the Vl + TE combination, the Pareto solution set is mainly located in region A of the Vl + CS + TE combination. Similarly, this combination centers on optimizing volume and transmission efficiency without taking contact stress into account. Consequently, its solution set is more focused on smaller volumes and higher transmission efficiency. Nevertheless, due to the trade-off relationship, it results in excessive maximum contact stress. Therefore, its corresponding solution set is concentrated in local areas with a small volume, high transmission efficiency, and high contact stress.
Upon analyzing Figure 11c,d, it is clear that contact stress and volume do not exhibit an apparent conflicting relationship with transmission efficiency. In other words, increasing (or decreasing) contact stress or increasing (or decreasing) volume does not necessarily lead to an increase (or decrease) or decrease (or increase) in transmission efficiency. This can be attributed to the fact that transmission efficiency is primarily influenced by helix angles, as demonstrated by the results of the global sensitivity analysis discussed later.
5.3. Solution Selection
Optimization results from the four different combinations offer intriguing insights into the Pareto solutions. Specifically, the Pareto solutions of the CS + TE combination are characterized by exceedingly large volumes, whereas the Pareto solutions of the Vl + TE combination are marked by extraordinarily high contact stresses. These results, falling short of optimization expectations, are subsequently excluded from the optimization scheme selection process. In contrast, the Pareto solutions for both the Vl + CS + TE and Vl + CS combinations exhibit wide distribution. The Vl + CS combination, despite its lack of consideration for transmission efficiency, does not display exceedingly low transmission efficiency across all design points in the Pareto solutions. Consequently, the optimal candidates are selected by giving consideration solely to the Vl + CS + TE and Vl + CS combinations. Figure 12, demonstrating strong regularity and the trade-off between volume and contact stress, provides a viable source for the candidate solution. Within Figure 12, the boundary lines demarcating regions A–D symbolize transitional zones between regions and offer high representativeness, as well as the midpoints of each region. The points where the boundary lines and midpoints of each region intersect with the Pareto frontier can be identified as candidates for selection. The designation P represents candidates, with the absence of a superscript indicating the Vl + CS + TE combination and a prime superscript “” denoting the Vl + CS combination. The subscript, meanwhile, refers to the position of a point. For instance, refers to the intersection of the shared boundary line between regions A and B with the Pareto frontier under the Vl + CS + TE combination, whereas signifies the midpoint of region C on the Pareto frontier under the Vl + CS combination.
To verify the accuracy and reliability of the predicted contact stress for each candidate, FE models were established for each candidate, and their prediction errors were obtained using Equation (23). The results are presented in Table 4.
where represents the contact stress derived from the FE model, whereas denotes the contact stress using the EMs.
The design variables and corresponding objective values for all candidates are systematically presented, and the results can be seen in Table 5. In order to analyze the advantages of each candidate more intuitively, and considering the practical requirements, candidates are categorized into two zones, specifically:
- a.
- Volume optimal zone: volume ≤ 500 . (, , , , ).
- b.
- Contact stress optimal zone: contact stress ≤ 260 MPa. (, , , , )
Within each zone, each candidate is evaluated and scored, with higher scores indicating better optimization. The scoring method is as follows:
- Step 1: Assume there are n candidates within the zone. For each objective, assign scores to the candidates based on their level of optimization, with the most optimized objective value receiving n points, the second most optimized receiving points, and so forth, with the least optimized result receiving 1 point.
- Step 2: The final score for each candidate is the sum of the scores obtained for each objective value in Step 1.
The scores for the candidates are indirectly illustrated in Figure 13, in which a larger area corresponds to a higher score. As can be seen Figure 13a and Table 5, within the optimal volume zone, ranked highest among the five candidates, followed by and . These candidates not only maintain a smaller volume (not exceeding 405 mm3) but also uphold a high transmission efficiency (all above 0.84). Further observation reveals that the transmission efficiency of and is virtually unchanged relative to , with a slight increase of 0.17% and 0.13%, respectively. Conversely, volume reduction is more substantial, at 4.7% and 8.9%, respectively, accompanied by contact stress augmentations of 25.9% and 25.5%. These two candidates, therefore, are better suited for scenarios where the material of the friction pair has superior wear resistance and there are strict requirements for the volume of the TSHPs. Comparatively, outperforms with a significant volume reduction and negligible changes in transmission efficiency and contact stress. Therefore, should be prioritized under these conditions. However, , despite a slight volume increase relative to and , exhibits a notable decrease in contact stress, making it optimal for scenarios requiring extended surface fatigue life and larger volume allowances. Considering Figure 13b and Table 5, within the optimal contact stress zone, scored highest among the five candidates, followed by . These two options substantially reduce contact stress (no more than 260 MPa) while keeping the transmission efficiency high (all above 0.84). Further examination shows that compared to , significantly reduces volume but increases contact stress. Therefore, is suitable in situations where the high surface fatigue life is required, and certain volume requirements need to be met. Conversely, is advisable when the surface fatigue life of the helical pair is of paramount importance, with minimal regard for volume considerations.
It can be observed that the recommended candidates for the volume optimal zone mainly originate from the Vl + CS combination, while those for the contact stress optimal zone come from the Vl + CS + TE combination. In light of the above findings, while considering that some small prediction discrepancies still exist in the EMs, it is suggested that both combinations be considered in the optimization design of the TSHPs, which can enhance the robustness of the optimization results, and the optimal scheme can be selected depending on different requirements.
5.4. Global Sensitivity Analysis
Figure 14, Figure 15 and Figure 16 depict the results of the global sensitivity analysis of design variables on objectives. The magnitudes represented by the bars correspond to the total order and first-order sensitivity indices, thereby indicating the extent of their influence on the objectives. The first-order sensitivity index characterizes the importance of each variable quantitatively, while the total order sensitivity index describes not only the effect of each variable on the target but also the interactions among all the design variables.
As illustrated in Figure 14, the first-order sensitivity index for the helix angle of the first-stage helical pair on transmission efficiency is 0.595, while that of the second-stage helical pair is 0.392. The first-order sensitivity index for the remaining design variables is 0.001, indicating that the transmission efficiency is primarily influenced by the helix angles of the TSHPs, while the impact of the modulus and number of teeth on the transmission efficiency is negligible. Further observation of Figure 14 reveals that the total order sensitivity index of all design variables is very close to the corresponding first-order sensitivity index, suggesting that the transmission efficiency is primarily affected by the independent influence of the helix angles of the TSHPs. Moreover, both the first-order sensitivity index and the total sensitivity index for the helix angle of the first-stage helical pair on the transmission efficiency are greater than the corresponding indices for the second-stage helical pair. This phenomenon can be explained through the following mathematical derivation. Based on Equation (6), let . By taking derivatives with respect to the first-stage helix angle and the second-stage helix angle , the rate of change in transmission efficiency with respect to and can be obtained as follows:
where .
Comparing the aforementioned two equations, it is apparent that the influence of the first-stage helix angle on transmission efficiency is directly proportional to the outer diameter of the second-stage helical pair, whereas the impact of the second-stage helix angle on transmission efficiency corresponds to the outer diameter of the first-stage helical pair. Given that the outer diameter of the second-stage helical pair is inevitably larger than the first-stage helical pair, the first-order sensitivity index and total sensitivity index for the helix angle of the first-stage helical pair on transmission efficiency exceed those of the second-stage helical pair. This implies that the transmission efficiency is more sensitive to the first-stage helical pair with a sensitivity level positively correlated with the ratio of the outer diameters of the second-stage and first-stage helical pairs.
As depicted in Figure 15, the first and total order sensitivity indices for the design variables of the first-stage helix pair do not exceed 0.003, implying their negligible impact on volume. This can be attributed to the radial enclosure of the first-stage helix pair by the second-stage pair, rendering adjustments to the macro-geometric parameters of the first-stage helix pair largely ineffective on the TSHP volume. Conversely, the modulus, number of teeth, and helix angle of the second-stage helix pair substantially influence the volume, with the modulus and number of teeth exerting a more pronounced effect. This is due to the quadratic relationship between volume and overall diameter, where alterations to the number of teeth and modulus affect the overall diameter of the TSHPs. When the modulus and number of teeth remain constant, modulating the helix angle alters the axial dimension, subsequently impacting the TSHP volume. Nonetheless, given the linear relationship between volume and the axial dimension, the influence of the helix angle proves less significant than that of the modulus and number of teeth. Moreover, the total order sensitivity indices for tooth number and modulus considerably outstrip their first ones, suggesting a more significant effect of tooth number and modulus interaction on the TSHP volume.
To facilitate a more nuanced analysis of the influence exerted by each design variable on the maximum contact stress of each stage, the overall maximum contact stress of the TSHPs is defined as the sum of the average maximum contact stress of each stage. As depicted in Figure 16, the design variables of the first-stage helical pair have a greater influence on the overall maximum contact stress than those of the second-stage helical pair. This suggests that the contact stress of the first-stage helical pair is more susceptible to alterations in macro-geometric parameters since the design variables of each stage exclusively affect their corresponding contact stress. The reason for this outcome is that the first-stage helical pair exhibits a smaller diameter compared to the second-stage pair. Consequently, under the same torque, the first-stage helical pair experiences a higher tooth surface pressure, leading to increased contact stress. Moreover, the number of teeth exerts a more significant influence on the overall maximum contact stress in both the first and second-stage helical pair than the modulus and helix angle. This can primarily be attributed to the fact that an increase in tooth count not only enlarges the overall size of the helical pair, thereby reducing the maximum contact stress but also lessens the load on individual teeth due to enhanced load sharing, further diminishing contact stress. Additionally, the total order sensitivity indices of all design variables markedly surpass their first ones, indicating a more substantial effect of variable interactions on maximum contact stress.
6. Conclusions
With the aim of designing an HHRA with a high power density and long fatigue life, this paper proposes an optimization framework combination of the EMs and NSGA-II for multi-objective optimization of the TSHPs. Initially, the analytical mathematical models for the output angle, output torque, and transmission efficiency of the TSHPs were established, which were also validated through experiments. Subsequently, to establish an accurate prediction model for the contact stress of the helical pair, replacing time-consuming and complex FEM simulations, the EM was employed and its superiority was verified by comparison with the three stand-alone metamodels. With the volume, efficiency, and contact stress as the optimization objectives and the rotation angle, output torque, and strength requirements as constraints, NSGA-II was utilized for multi-objective optimization. An analysis was conducted on the Pareto optimal solutions of four combinations of the three objectives, and suggestions were made for the selection of the optimal scheme depending on different requirements. Lastly, Sobol’s global sensitivity is performed based on the established mathematical models. The conclusions of this paper are summarized as follows.
- (1)
- Compared to the PRS, KRG, and SVR, the E based on the GMSE criterion demonstrates higher prediction accuracy and robustness for predicting the contact stress of the helical pair.
- (2)
- Volume and contact stress exhibit a clear trade-off relationship in the optimal space, whereas the transmission efficiency mainly relates to the helix angle and does not demonstrate such a trade-off relationship.
- (3)
- The Pareto solutions of the combination that only considers contact stress and transmission efficiency have an overly large volume. Meanwhile, the Pareto solutions of the combination that only considers volume and transmission efficiency yield exceedingly high contact stress, both of which do not result in satisfactory optimization outcomes.
- (4)
- The combination of volume, contact stress, and transmission efficiency, as well as the combination considering only volume and contact stress, has a widely distributed Pareto solution. In the optimization design of the TSHPs, it is recommended to consider both combinations, which can enhance the robustness of the optimization results.
- (5)
- Global sensitivity analysis results indicate that the transmission efficiency of the TSHP is mainly related to the helix angles; the volume of the TSHP is positively correlated with the number of teeth, the modulus, and the helix angle of the second-stage helical pair; the maximum contact stress of the first-stage helical pair is more sensitive to the changes in macro-geometric parameters, and the number of teeth exerts a more significant influence on the overall maximum contact stress in both the first and second-stage helical pair than the modulus and helix angle.
The optimization framework proposed in this paper can effectively improve the overall performance of the HHRA, which holds potential for application in related actuator design.
Author Contributions
S.L.: writing, methodology, and investigation. G.Y.: resources and overseeing of analysis. S.L. and Y.X.: experiment. S.L. and R.G.: methodology, validation, investigation, writing, review and editing. B.L.: supervision. All authors have read and agreed to the published version of the manuscript.
Funding
This research received no external funding.
Data Availability Statement
The ABAQUS-based finite element simulation model is generated using Python scripts. The analytic models, metamodels and NSGA-II are run using Matlab scripts. The optimization-related codes can be made available with a reasonable request to the corresponding author. Unfortunately, we cannot share the simulation model used in this work due to confidentiality reasons.
Acknowledgments
The authors would like to acknowledge the support of Institute of Marine Mechatronics Equipment in HUST.
Conflicts of Interest
The authors declare no conflict of interest.
Abbreviations
The following abbreviations are used in this manuscript:
| NSGA-II | Non-dominated sorting genetic algorithm-II |
| HHRA | Helical hydraulic rotary actuator |
| TSHPs | Two-stage helical pairs |
| EMs | Ensemble of metamodels |
| FEM | Finite element method |
| KRG | Kriging |
| PRS | Polynomial response surface |
| RBF | Radial basis function |
| SVR | Support vector regression |
| OLHS | Optimized Latin hypercube sampling |
| DOE | Design of experiments |
| GMSE | Generalized mean square cross validation error |
| RMSE | Root mean squared error |
| MAE | Mean absolute error |
References
- Tho, N.H.; Phuong, V.N.Y.; Danh, L.T. Development of an Adaptive Fuzzy Sliding Mode Controller of an Electrohydraulic Actuator Based on a Virtual Prototyping. Actuators 2023, 12, 258. [Google Scholar] [CrossRef]
- Zheng, Y.; Sun, R.; Liu, Y.; Wang, Y.; Song, R.; Li, Y. A Hybridization Grey Wolf Optimizer to Identify Parameters of Helical Hydraulic Rotary Actuator. Actuators 2023, 12, 220. [Google Scholar] [CrossRef]
- Miler, D.; Hoić, M. Optimisation of cylindrical gear pairs: A review. Mech. Mach. Theory 2021, 156, 104156. [Google Scholar] [CrossRef]
- Miler, D.; Lončar, A.; Žeželj, D.; Domitran, Z. Influence of profile shift on the spur gear pair optimization. Mech. Mach. Theory 2017, 117, 189–197. [Google Scholar] [CrossRef]
- Miler, D.; Žeželj, D.; Lončar, A.; Vučković, K. Multi-objective spur gear pair optimization focused on volume and efficiency. Mech. Mach. Theory 2018, 125, 185–195. [Google Scholar] [CrossRef]
- Miler, D.; Hoić, M.; Škec, S.; Žeželj, D. Optimisation of polymer spur gear pairs with experimental validation. Struct. Multidiscip. Optim. 2020, 62, 3271–3285. [Google Scholar] [CrossRef]
- Atila, Ü.; Dörterler, M.; Durgut, R.; Şahin, İ. A comprehensive investigation into the performance of optimization methods in spur gear design. Eng. Optim. 2020, 52, 1052–1067. [Google Scholar] [CrossRef]
- Baldo, L.; Querques, I.; Dalla Vedova, M.D.L.; Maggiore, P. A Model-Based Prognostic Framework for Electromechanical Actuators Based on Metaheuristic Algorithms. Aerospace 2023, 10, 293. [Google Scholar] [CrossRef]
- Nagadurga, T.; Devarapalli, R.; Knypiński, Ł. Comparison of Meta-Heuristic Optimization Algorithms for Global Maximum Power Point Tracking of Partially Shaded Solar Photovoltaic Systems. Algorithms 2023, 16, 376. [Google Scholar] [CrossRef]
- Sagu, A.; Gill, N.S.; Gulia, P.; Singh, P.K.; Hong, W.C. Design of Metaheuristic Optimization Algorithms for Deep Learning Model for Secure IoT Environment. Sustainability 2023, 15, 2204. [Google Scholar] [CrossRef]
- Limmer, L.; Nowell, D.; Hills, D. A combined testing and modelling approach to the prediction of the fretting fatigue performance of splined shafts. Proc. Inst. Mech. Eng. Part G J. Aerosp. Eng. 2001, 215, 105–112. [Google Scholar] [CrossRef]
- Myers, R.H.; Montgomery, D.C.; Anderson-Cook, C.M. Response Surface Methodology: Process and Product Optimization Using Designed Experiments; John Wiley & Sons: Hoboken, NJ, USA, 2016. [Google Scholar]
- Dyn, N.; Levin, D.; Rippa, S. Numerical procedures for surface fitting of scattered data by radial functions. SIAM J. Sci. Stat. Comput. 1986, 7, 639–659. [Google Scholar] [CrossRef]
- Sacks, J.; Welch, W.J.; Mitchell, T.J.; Wynn, H.P. Design and analysis of computer experiments. Stat. Sci. 1989, 4, 409–423. [Google Scholar] [CrossRef]
- Martin, J.D.; Simpson, T.W. Use of Kriging models to approximate deterministic computer models. AIAA J. 2005, 43, 853–863. [Google Scholar] [CrossRef]
- Brereton, R.G.; Lloyd, G.R. Support vector machines for classification and regression. Analyst 2010, 135, 230–267. [Google Scholar] [CrossRef]
- Tang, T.; Yang, G.; Zhang, D.; Lei, L.; Li, B.; Gao, L. A hydrodynamic prediction model of throttle orifice plate using space filling and adaptive sampling method. Struct. Multidiscip. Optim. 2020, 62, 1563–1578. [Google Scholar] [CrossRef]
- Jaiswal, A.K.; Siddique, M.H.; Paul, A.R.; Samad, A. Surrogate-based design optimization of a centrifugal pump impeller. Eng. Optim. 2022, 54, 1395–1412. [Google Scholar] [CrossRef]
- Zhang, D.; Wang, Z.; Ling, H.; Zhu, X. Kriging-based shape optimization framework for blended-wing-body underwater glider with NURBS-based parametrization. Ocean Eng. 2021, 219, 108212. [Google Scholar] [CrossRef]
- Huang, S.; Hu, Y.; Li, F.; Jin, W.; Wu, B. Multi-objective optimization of mechanical oil extraction from Camellia oleifera seeds using Kriging regression and NSGA-II. J. Food Process Eng. 2020, 43, e13549. [Google Scholar] [CrossRef]
- Zhang, G.; Wang, G.; Li, X.; Ren, Y. Global optimization of reliability design for large ball mill gear transmission based on the Kriging model and genetic algorithm. Mech. Mach. Theory 2013, 69, 321–336. [Google Scholar] [CrossRef]
- Korta, J.A.; Mundo, D. Multi-objective micro-geometry optimization of gear tooth supported by response surface methodology. Mech. Mach. Theory 2017, 109, 278–295. [Google Scholar] [CrossRef]
- Goel, T.; Haftka, R.T.; Shyy, W.; Queipo, N.V. Ensemble of surrogates. Struct. Multidiscip. Optim. 2007, 33, 199–216. [Google Scholar] [CrossRef]
- <i>Standard, I. Standard, I. 21771: 2007 (E); Gears–Cylindrical Involute Gears and Gear Pairs–Concepts and Geometry. International Organization for Standardization: Geneva, Switzerland, 2007.
- John, M. Machinery’s Handbook; Industrial Press, Inc.: New York, NY, USA, 2004. [Google Scholar]
- Barbieri, M.; Zippo, A.; Pellicano, F. Adaptive grid-size finite element modeling of helical gear pairs. Mech. Mach. Theory 2014, 82, 17–32. [Google Scholar] [CrossRef]
- Acar, E.; Rais-Rohani, M. Ensemble of metamodels with optimized weight factors. Struct. Multidiscip. Optim. 2009, 37, 279–294. [Google Scholar] [CrossRef]
- Liefvendahl, M.; Stocki, R. A study on algorithms for optimization of Latin hypercubes. J. Stat. Plan. Inference 2006, 136, 3231–3247. [Google Scholar] [CrossRef]
- Kim, S.C.; Moon, S.G.; Sohn, J.H.; Park, Y.J.; Choi, C.H.; Lee, G.H. Macro geometry optimization of a helical gear pair for mass, efficiency, and transmission error. Mech. Mach. Theory 2020, 144, 103634. [Google Scholar] [CrossRef]
- Buiga, O.; Haragâş, S.; Tudose, L. Helical gears pair optimal design using Genetic Algorithms. In Proceedings of the 2023 10th International Conference on Modern Power Systems (MPS), Cluj-Napoca, Romania, 21–23 June 2023; IEEE: Piscataway, NJ, USA, 2023; pp. 1–6. [Google Scholar]
- Deb, K.; Pratap, A.; Agarwal, S.; Meyarivan, T. A fast and elitist multiobjective genetic algorithm: NSGA-II. IEEE Trans. Evol. Comput. 2002, 6, 182–197. [Google Scholar] [CrossRef]
- Sobol, I.M. Global sensitivity indices for nonlinear mathematical models and their Monte Carlo estimates. Math. Comput. Simul. 2001, 55, 271–280. [Google Scholar] [CrossRef]
Figure 1.
General configuration of HHRA.

Figure 2.
Motion model of TSHPs.

Figure 3.
Force analysis of screw.

Figure 4.
Volume of TSHPs.

Figure 5.
Test stand of HHRA.

Figure 6.
Comparison of simulation and experimental results.

Figure 7.
Automatic FEM simulation process.

Figure 8.
Convergence analysis of the FE model mesh.

Figure 9.
Error metrics vs. sample sizes.

Figure 10.
Flowchart of optimization procedure.
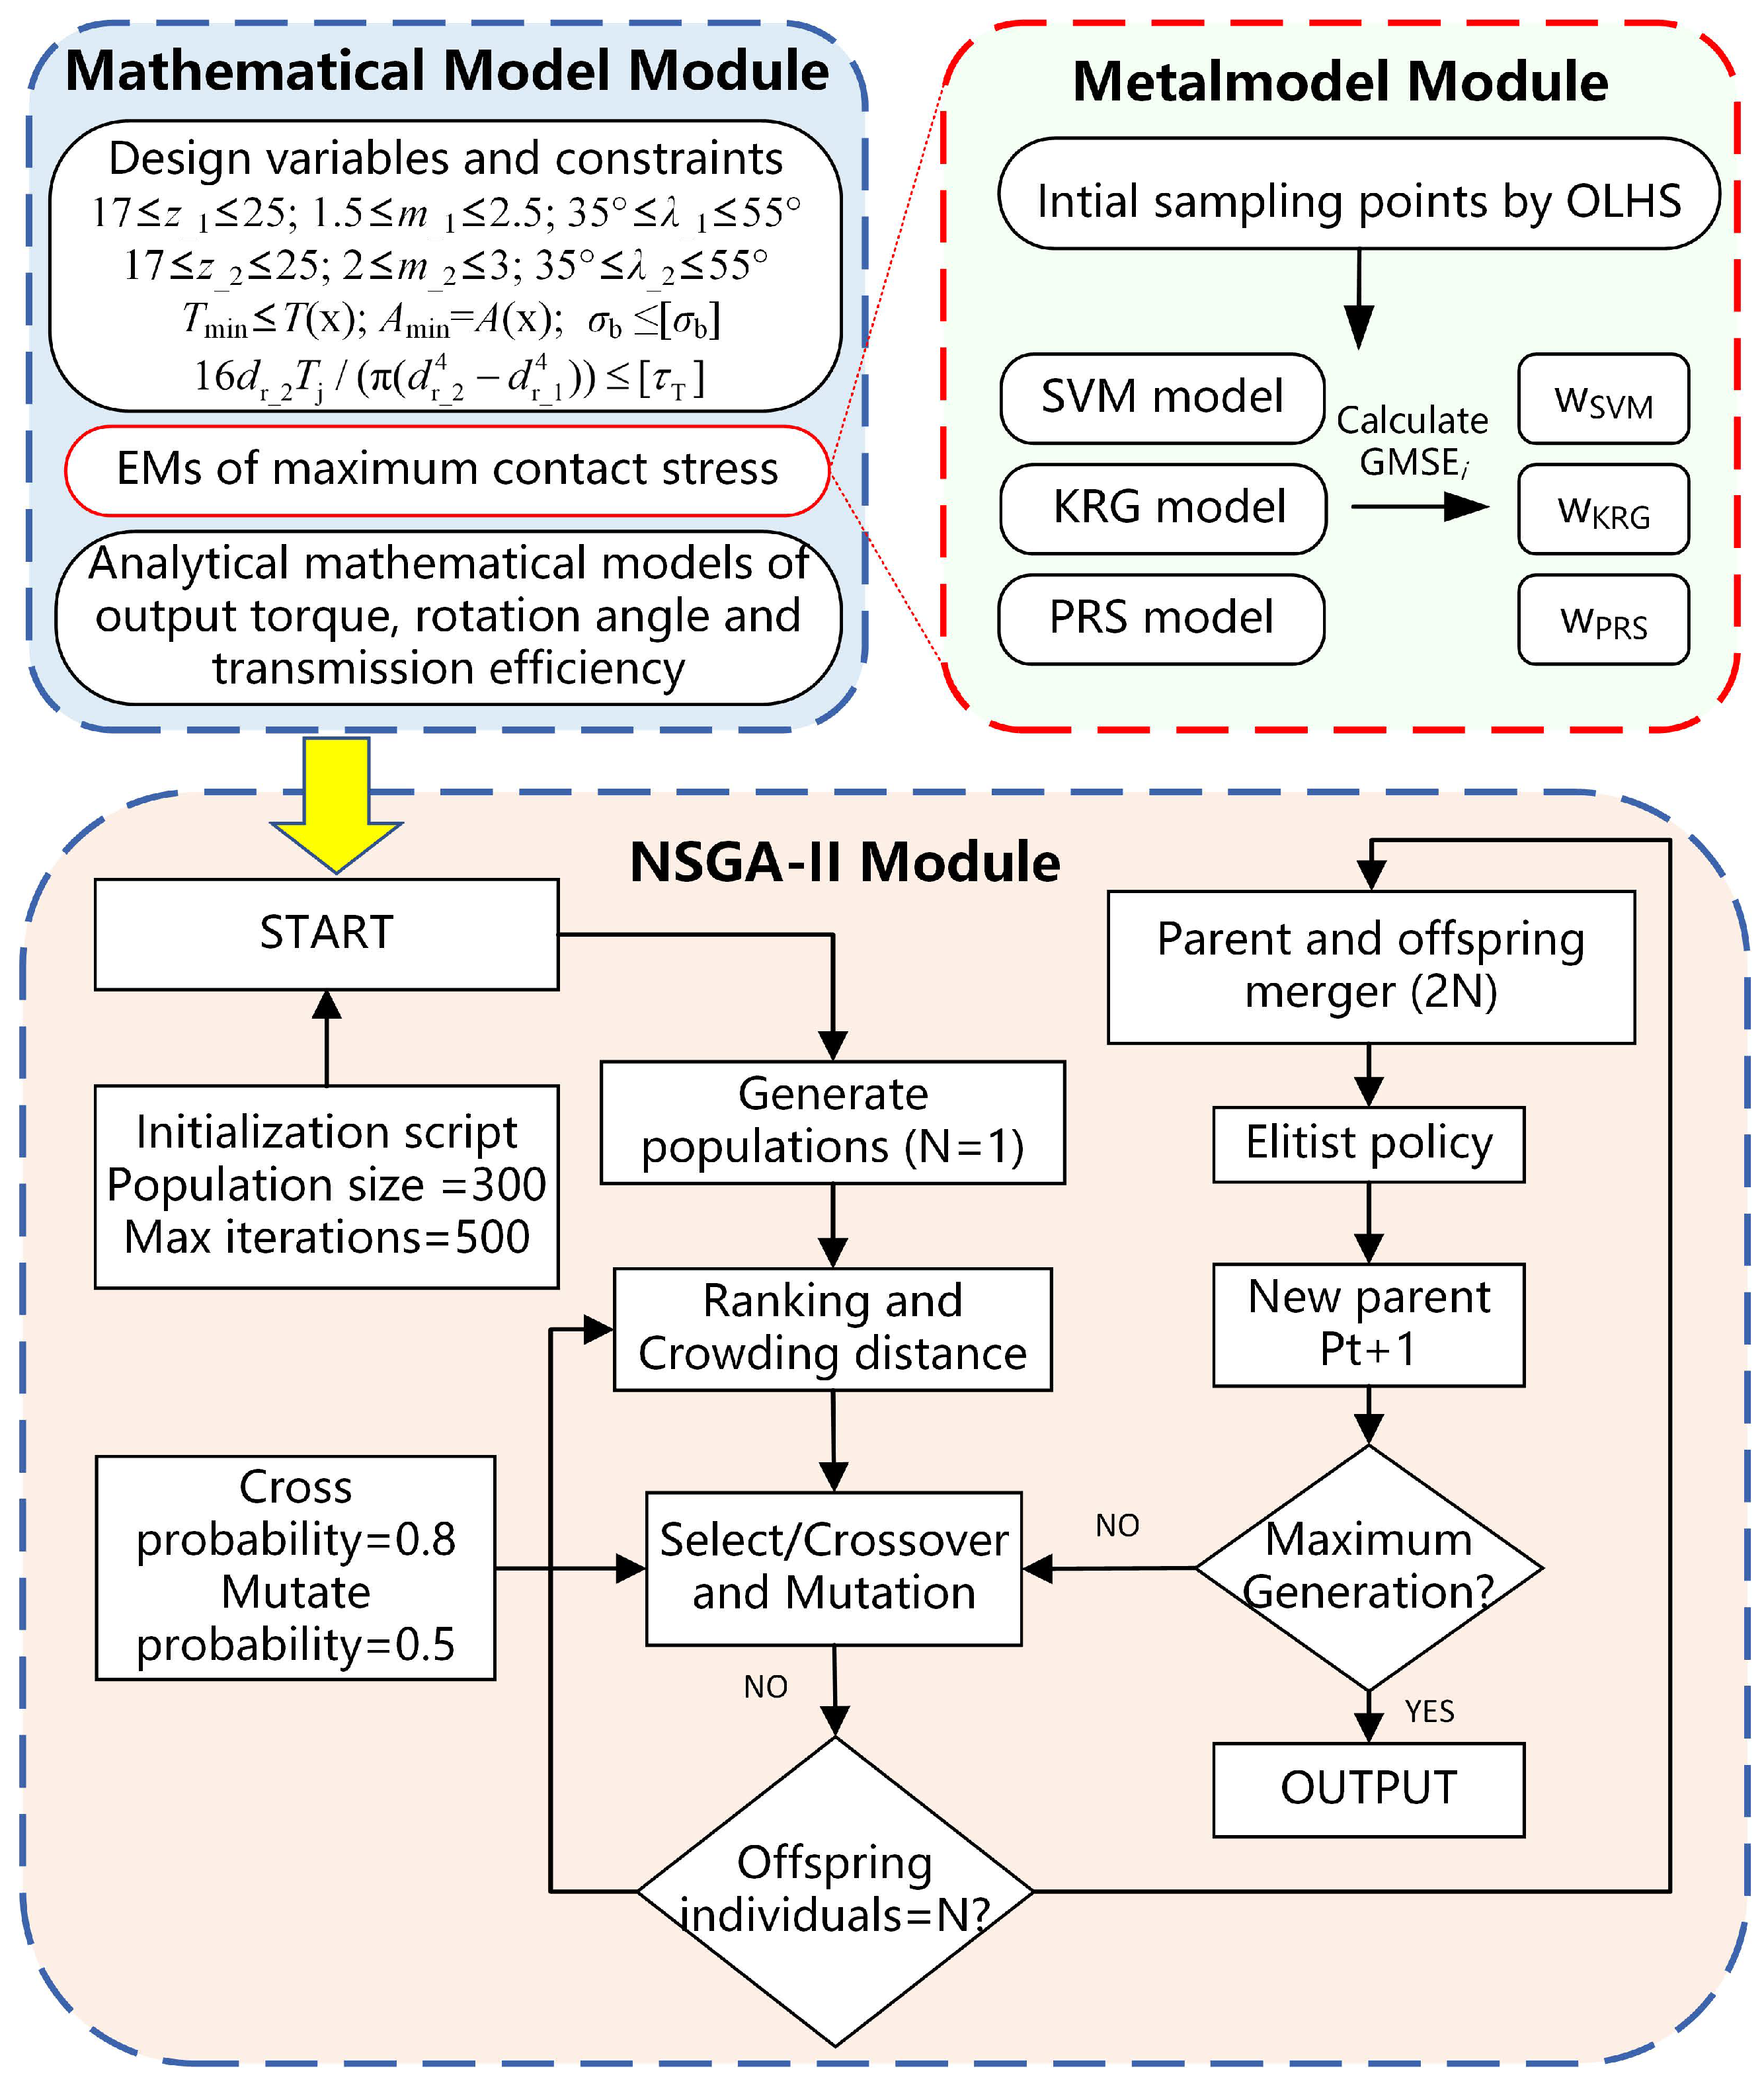
Figure 11.
Pareto frontier. (a) The 3D Pareto frontier for contact stress, volume and transmission efficiency. (b) The 2D Pareto frontier for contact stress and volume. (c) The 2D Pareto frontier for contact stress and transmission efficiency. (d) The 2D Pareto frontier for volume and transmission efficiency.

Figure 12.
The 2D Pareto frontier for contact stress and volume with distinct regions with candidates.
Figure 12.
The 2D Pareto frontier for contact stress and volume with distinct regions with candidates.

Figure 13.
Radar chart for scores of candidates. (a) Volume optimal zone. (b) Contact stress optimal zone.
Figure 13.
Radar chart for scores of candidates. (a) Volume optimal zone. (b) Contact stress optimal zone.

Figure 14.
Effects of design variables on transmission efficiency.

Figure 15.
Effects of design variables on volume.

Figure 16.
Effects of design variables on maximum contact stress.


Table 1.
Material properties.
| Category | ZCuSn10Pb1 | QT-500 |
|---|---|---|
| Density/kg · m | 8500 | 8500 |
| Young’s modulus/Pa | ||
| Poisson’s ratio | 0.3 | 0.24 |
Table 2.
Design space.
| Parameter | Design Space |
|---|---|
| , teeth number of first-stage helical pair | [17–25] |
| , teeth number of second-stage helical pair | [17–25] |
| (mm), modulus of first-stage helical pair | 1.5, 1.75, 2,2. 25, 2.5 |
| (mm), modulus of second-stage helical pair | 2, 2.25, 2.5, 2.75, 3 |
| (°), helix angle of first-stage helical pair | [35–55] |
| (°), helix angle of first-stage helical pair | [35–55] |
Table 3.
Error metrics of different metamodels with various sample sizes.
| Sample Size | Metric | PRS | KRG | SVR | GMSE |
|---|---|---|---|---|---|
| 25 | RMSE | 27.19 | 16.38 | 25.24 | 15.88 |
| MAE | 62.44 | 53.30 | 68.29 | 40.49 | |
| 50 | RMSE | 11.22 | 12.78 | 15.20 | 9.72 |
| MAE | 29.35 | 36.86 | 48.63 | 30.22 | |
| 75 | RMSE | 11.64 | 12.34 | 12.53 | 8.03 |
| MAE | 27.72 | 26.26 | 32.04 | 20.18 | |
| 100 | RMSE | 8.35 | 14.39 | 12.80 | 7.24 |
| MAE | 20.04 | 44.51 | 41.28 | 19.14 | |
| 125 | RMSE | 14.26 | 19.43 | 11.34 | 6.97 |
| MAE | 38.70 | 74.27 | 29.09 | 17.96 |
Table 4.
Metamodel validation results.
| Candidate | FEM-Based (MPa) | Predicted (MPa) | Error (%) |
|---|---|---|---|
| 419.33 | 401.54 | 4.24 | |
| 418.15 | 399.91 | 4.36 | |
| 339.73 | 328.69 | 3.25 | |
| 333.16 | 328.45 | 1.41 | |
| 254.33 | 254.30 | 0.01 | |
| 262.77 | 255.21 | 2.88 | |
| 197.22 | 206.15 | 4.53 | |
| 201.05 | 206.01 | 2.47 | |
| 161.93 | 155.94 | 3.70 | |
| 162.69 | 155.21 | 4.60 |
Table 5.
Results for various candidates.
| Candidate | Variables | Objectives | |||||||
|---|---|---|---|---|---|---|---|---|---|
| (mm) | (°) | (mm) | (°) | () | (MPa) | ||||
| 19 | 1.5 | 43.75 | 20 | 2.25 | 40.78 | 382.20 | 419.33 | 0.8434 | |
| 20 | 1.5 | 39.73 | 22 | 2 | 40.68 | 365.43 | 418.15 | 0.8431 | |
| 19 | 1.5 | 51.38 | 23 | 2 | 43.89 | 425.42 | 339.73 | 0.8390 | |
| 20 | 1.5 | 47.89 | 22 | 2 | 44.46 | 401.13 | 333.16 | 0.8420 | |
| 20 | 1.75 | 47.15 | 24 | 2 | 47.27 | 532.80 | 254.33 | 0.8417 | |
| 20 | 1.5 | 55.00 | 22 | 2 | 49.78 | 477.79 | 262.77 | 0.8328 | |
| 18 | 2.25 | 41.08 | 24 | 2 | 50.07 | 607.03 | 197.22 | 0.8410 | |
| 25 | 1.5 | 46.99 | 17 | 2.5 | 54.50 | 573.55 | 201.05 | 0.8361 | |
| 22 | 2 | 46.81 | 23 | 2.5 | 48.76 | 846.05 | 161.93 | 0.8412 | |
| 22 | 1.75 | 55.00 | 21 | 2.5 | 52.32 | 786.98 | 162.69 | 0.8314 | |
Disclaimer/Publisher’s Note: The statements, opinions and data contained in all publications are solely those of the individual author(s) and contributor(s) and not of MDPI and/or the editor(s). MDPI and/or the editor(s) disclaim responsibility for any injury to people or property resulting from any ideas, methods, instructions or products referred to in the content. |
© 2023 by the authors. Licensee MDPI, Basel, Switzerland. This article is an open access article distributed under the terms and conditions of the Creative Commons Attribution (CC BY) license (https://creativecommons.org/licenses/by/4.0/).
Share and Cite
MDPI and ACS Style
Liu, S.; Li, B.; Gan, R.; Xu, Y.; Yang, G. Multi-Objective Optimization of Two-Stage Helical Pairs in Helical Hydraulic Rotary Actuator Using Ensemble of Metamodels and NSGA-II. Actuators 2023, 12, 385. https://doi.org/10.3390/act12100385
AMA Style
Liu S, Li B, Gan R, Xu Y, Yang G. Multi-Objective Optimization of Two-Stage Helical Pairs in Helical Hydraulic Rotary Actuator Using Ensemble of Metamodels and NSGA-II. Actuators. 2023; 12(10):385. https://doi.org/10.3390/act12100385
Chicago/Turabian StyleLiu, Song, Baoren Li, Runlin Gan, Yue Xu, and Gang Yang. 2023. "Multi-Objective Optimization of Two-Stage Helical Pairs in Helical Hydraulic Rotary Actuator Using Ensemble of Metamodels and NSGA-II" Actuators 12, no. 10: 385. https://doi.org/10.3390/act12100385
Note that from the first issue of 2016, this journal uses article numbers instead of page numbers. See further details here.