Whole-Proteome Analysis of Twelve Species of Alphaproteobacteria Links Four Pathogens

Abstract
:
1. Introduction

| Organism | Accession Number | Genome Size (bp) | Number of CDS |
|---|---|---|---|
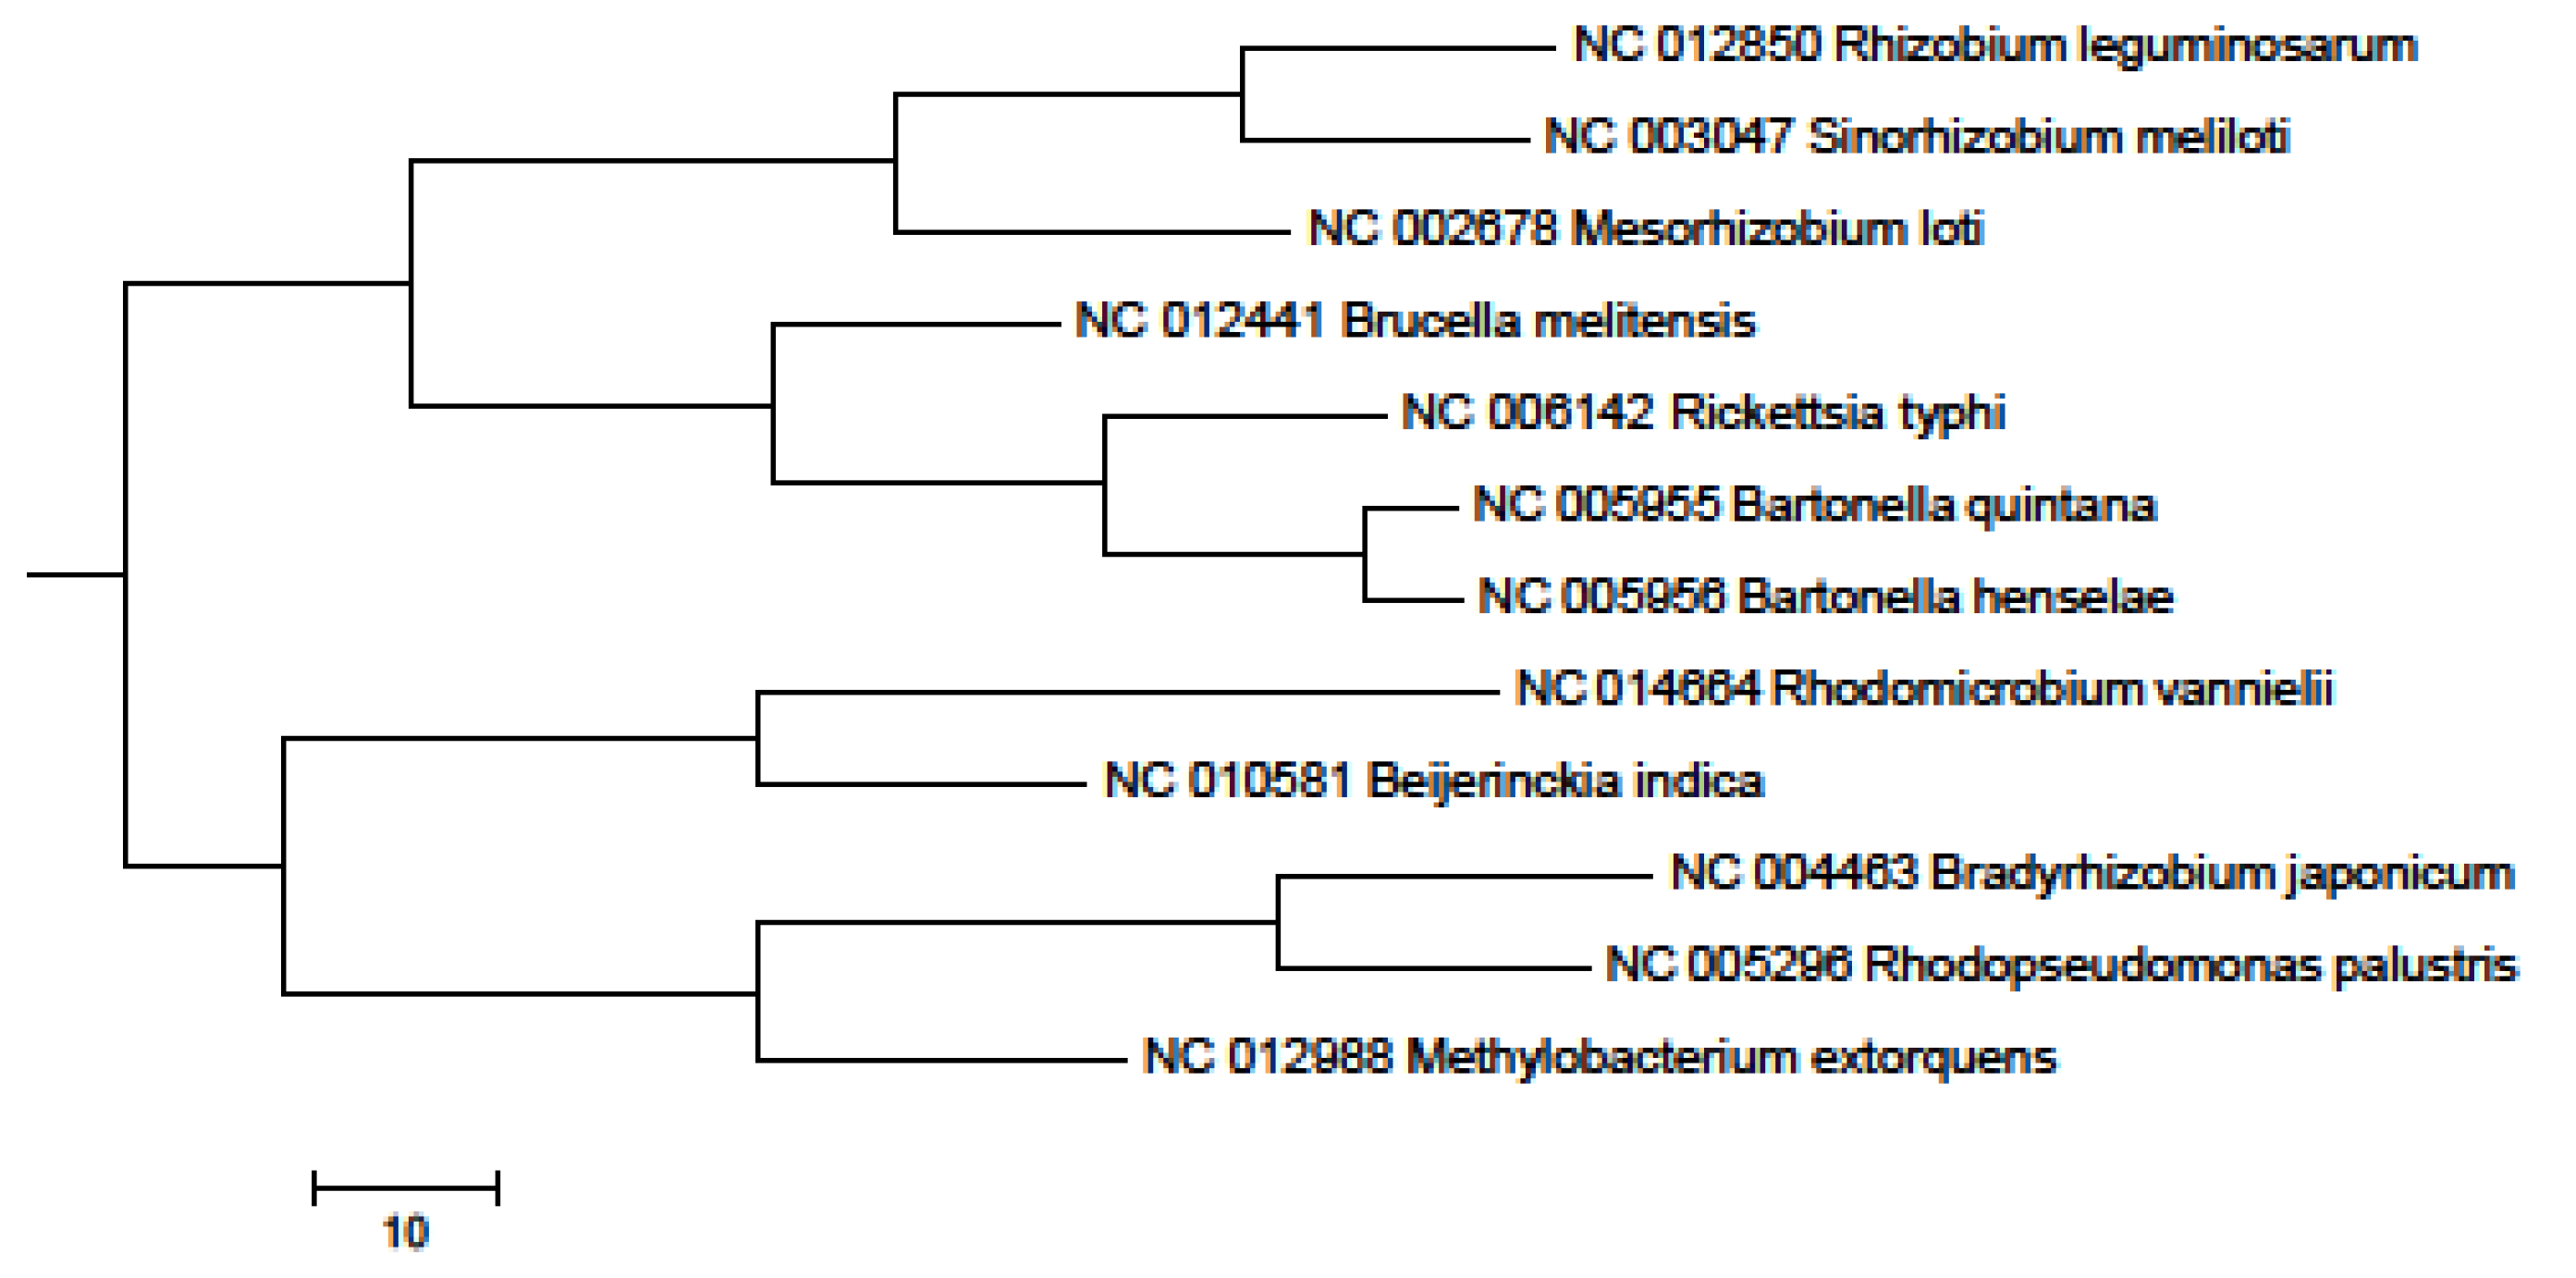
| Mesorhizobium loti MAFF303099 | NC_002678 | 7,036,071 | 6,743 |
| Sinorhizobium meliloti 1021 | NC_003047 | 3,654,135 | 3,359 |
| Bradyrhizobium japonicum USDA 110 | NC_004463 | 9,105,828 | 8,317 |
| Rhodopseudomonas palustris CGA009 | NC_005296 | 5,459,213 | 4,813 |
| Bartonella quintana str. Toulouse | NC_005955 | 1,581,384 | 1,142 |
| Bartonella henselae str. Houston-1 | NC_005956 | 1,931,047 | 1,488 |
| Rickettsia typhi str. Wilmington | NC_006142 | 1,111,496 | 837 |
| Beijerinckia indica subsp. indica ATCC 9039 | NC_010581 | 4,170,153 | 3,569 |
| Brucella melitensis ATCC 23457, Chrs 1 | NC_012441 | 2,125,701 | 2,063 |
| Rhizobium leguminosarum WSM1325 | NC_012850 | 4,767,043 | 4,565 |
| Methylobacterium extorquens DM4 | NC_012988 | 5,943,768 | 5,594 |
| Rhodomicrobium vannielii ATCC 17100 | NC_014664 | 4,014,469 | 3,565 |
2. Results and Discussion


3. Experimental
4. Conclusions
Acknowledgments
Conflicts of Interest
References
- Woese, C.R.; Kandler, O.; Wheelis, M.L. Towards a natural system of organisms: Proposal for the domains Archaea, Bacteria, and Eucarya. Proc. Natl. Acad. Sci. USA 1990, 87, 4576–4579. [Google Scholar] [CrossRef]
- Wheelis, M.L.; Kandler, O.; Woese, C.R. On the nature of global classification. Proc. Natl. Acad. Sci. USA 1992, 89, 2930–2934. [Google Scholar] [CrossRef]
- Eisen, J.A. The RecA protein as a model molecule for molecular systematic studies of bacteria: Comparison of trees of RecAs and 16S rRNAs from the same species. J. Mol. Evol. 1995, 41, 1105–1123. [Google Scholar] [CrossRef]
- Garrity, G.M.; Holt, J.G. The road map to the manual. In Bergey’s Manual of Systematic Bacteriology, 2nd ed.; Boone, D.R., Castenholz, R.W., Eds.; Springer: New York, NY, USA, 2001; Volume 1, pp. 119–141. [Google Scholar]
- Marshall, C.R. Statistical and computational problems in reconstructing evolutionary histories from DNA data. Comput. Sci. Statist. 1997, 29, 218–226. [Google Scholar]
- Fitz-Gibbon, S.T.; House, C.H. Whole genome-based phylogenetic analysis of free-living microorganisms. Nucleic Acids Res. 1999, 27, 4218–4222. [Google Scholar] [CrossRef]
- Williams, K.P.; Sobral, B.W.; Dickerman, A.W. A robust tree for the Alphaproteobacteria. J. Bacteriol. 2007, 189, 4578–4586. [Google Scholar] [CrossRef]
- Feng, D.F.; Cho, G.; Doolittle, R.F. Determining divergence times with a protein clock: Update and reevaluation. Proc. Natl. Acad. Sci. USA 1997, 94, 13028–13033. [Google Scholar] [CrossRef]
- Brown, J.R.; Douady, C.J.; Italia, M.J.; Marshall, W.E.; Stanhope, M.J. Universal trees based on large combined protein sequence data sets. Nat. Genet. 2001, 28, 281–285. [Google Scholar] [CrossRef]
- Roux, V.; Rydkina, E.; Eremeeva, M.; Raoult, D. Citrate synthase gene comparison, a new tool for phylogenetic analysis, and its application for the Rickettsiae. Int. J. Syst. Bacteriol. 1997, 47, 252–261. [Google Scholar] [CrossRef]
- Daubin, V.; Gouy, M.; Perriere, G. A phylogenomic approach to bacterial phylogeny: Evidence of a core of genes sharing a common history. Genome Res. 2002, 12, 1080–1090. [Google Scholar] [CrossRef]
- Eisen, J.A. Assessing evolutionary relationships among microbes from whole-genome analysis. Curr. Opin. Microbiol. 2000, 3, 475–480. [Google Scholar] [CrossRef]
- Yeh, R.F.; Lim, L.P.; Burge, C.B. Computational inference of homologous gene structures in the human genome. Genome Res. 2001, 11, 803–816. [Google Scholar] [CrossRef]
- Lin, F.P.; Lan, R.; Sintchenko, V.; Gilbert, G.L.; Kong, F.; Coiera, E. Computational bacterial genome-wide analysis of phylogenetic profiles reveals potential virulence genes of Streptococcus agalactiae. PLoS One 2011, 6, e17964. [Google Scholar]
- Snel, B.; Bork, P.; Huynen, M.A. Genome phylogeny based on gene content. Nat. Genet. 1999, 21, 108–110. [Google Scholar] [CrossRef]
- Tekaia, F.; Lazcano, A.; Dujon, B. The genomic tree as revealed from whole proteome comparisons. Genome Res. 1999, 9, 550–557. [Google Scholar]
- House, C.H.; Fitz-Gibbon, S.T. Using homolog groups to create a whole-genomic tree of free-living organisms: An update. J. Mol. Evol. 2002, 54, 539–547. [Google Scholar] [CrossRef]
- Wolf, Y.I.; Rogozin, I.B.; Gridhin, N.V.; Koonin, E.V. Genome trees and the tree of life. Trends Genet. 2002, 18, 472–479. [Google Scholar] [CrossRef]
- Bansal, A.K.; Meyer, T.E. Evolutionary analysis by whole-genome comparisons. J. Bacteriol. 2002, 184, 2260–2272. [Google Scholar] [CrossRef]
- Coenye, T.; Vandamme, P. Extracting phylogenetic information from whole-genome sequencing projects: The lactic acid bacteria as a test case. Microbiology 2003, 149, 3507–3517. [Google Scholar] [CrossRef]
- Zhou, Y.; Call, D.R.; Broschat, S.L. Using protein clusters from whole proteomes to construct and augment a dendrogram. Adv. Bioinformatics 2013, e191586. [Google Scholar]
- Whatmore, A.M.; Perrett, L.L.; MacMillan, A.P. Characterisation of the genetic diversity of Brucella by multilocus sequencing. BMC Microbiol. 2007. [Google Scholar] [CrossRef]
- Sasson, O.; Vaaknin, A.; Fleischer, H.; Portugaly, E.; Bilu, Y.; Linial, N.; Linial, M. ProtoNet: Hierarchical classification of the protein space. Nucleic Acids Res. 2003, 31, 348–352. [Google Scholar] [CrossRef]
- Gupta, R.S. Protein signatures distinctive of alphaproteobacteria and its subgroups and a model for α-proteobacterial evolution. Crit. Rev. Microbiol. 2005, 31, 101–135. [Google Scholar] [CrossRef]
- Wu, C.; Kalyanaraman, A.; Cannon, W.R. pGraph: Efficient parallel construction of large-scale protein sequence homology graphs. IEEE TPDS 2012. [Google Scholar] [CrossRef]
- Altschul, S.F.; Madden, T.L.; Schaffer, A.A.; Zhang, J.; Zhang, Z.; Miller, W.; Lipman, D.J. Gapped BLAST and PSI-BLAST: A new generation of protein database search programs. Nucleic Acids Res. 1997, 25, 3389–3402. [Google Scholar]
- Williams, K.P.; Sobral, B.W.; Dickerman, A.W. A robust species tree for the Alphaproteobacteria. J. Bacteriol. 2007, 189, 4578–4586. [Google Scholar] [CrossRef]
- Gupta, R.S.; Mok, A. Phylogenomics and signature proteins for the alpha Proteobacteria and its main groups. BMC Microbiol. 2007. [Google Scholar] [CrossRef]
- Ludwig, W.; Klenk, H.P. Overview: A phylogenetic backbone and taxonomic framework for procaryotic systematics. In Bergey’s Manual of Systematic Bacteriology, 2nd ed.; Boone, D.R., Castenholz, R.W., Garrity, G.M., Eds.; Springer: New York, NY, USA, 2001; pp. 49–50. [Google Scholar]
- Kersters, K.; Devos, P.; Gillis, M.; Vandamme, P.; Stackebrandt, E. Introduction to the proteobacteria. In The Prokaryotes: An Evolving Electronic Resource for the Microbiological Community; Dworkin, M., Ed.; Springer-Verlag: New York, NY, USA, 2003. [Google Scholar]
- Sällström, B.; Andersson, S.G.E. Genome reduction in the α-Proteobacteria. Curr. Opin. Microbiol. 2005, 8, 579–585. [Google Scholar]
- Ribosomal Database Project. Available online: http://rdp.cme.msu.edu/ (accessed on 22 November 2013).
- National Center for Biotechnology Information. Available online: http://www.ncbi.nlm.nih.gov (accessed on 22 November 2013).
- Cole, J.R.; Wang, Q.; Cardenas, E.; Fish, J.; Chai, B.; Farris, R.J.; Kulam-Syed-Mohideen, A.S.; McGarrell, D.M.; Marsh, T. The ribosomal database project: Improved alignments and new tools for rRNA analysis. Nucleic Acids Res. 2009, 37, D141–D145. [Google Scholar] [CrossRef]
- Tamura, K.; Peterson, D.; Peterson, N.; Stecher, G.; Nei, M.; Kumar, S. MEGA5: Molecular evolutionary genetics analysis using maximum likelihood, evolutionary distance, and maximum parsimony methods. Mol. Biol. Evol. 2011, 28, 2731–2739. [Google Scholar] [CrossRef]
- Bruno, W.J.; Socci, N.D.; Halpern, A.L. Weighted neighbor joining: A likelihood-based approach to distance-based phylogeny reconstruction. Mol. Biol. Evol. 2000, 17, 189–197. [Google Scholar] [CrossRef]
© 2013 by the authors; licensee MDPI, Basel, Switzerland. This article is an open access article distributed under the terms and conditions of the Creative Commons Attribution license (http://creativecommons.org/licenses/by/3.0/).
Share and Cite
Zhou, Y.; Call, D.R.; Broschat, S.L. Whole-Proteome Analysis of Twelve Species of Alphaproteobacteria Links Four Pathogens. Pathogens 2013, 2, 627-635. https://doi.org/10.3390/pathogens2040627
Zhou Y, Call DR, Broschat SL. Whole-Proteome Analysis of Twelve Species of Alphaproteobacteria Links Four Pathogens. Pathogens. 2013; 2(4):627-635. https://doi.org/10.3390/pathogens2040627
Chicago/Turabian StyleZhou, Yunyun, Douglas R. Call, and Shira L. Broschat. 2013. "Whole-Proteome Analysis of Twelve Species of Alphaproteobacteria Links Four Pathogens" Pathogens 2, no. 4: 627-635. https://doi.org/10.3390/pathogens2040627
APA StyleZhou, Y., Call, D. R., & Broschat, S. L. (2013). Whole-Proteome Analysis of Twelve Species of Alphaproteobacteria Links Four Pathogens. Pathogens, 2(4), 627-635. https://doi.org/10.3390/pathogens2040627