Developing a Methodology for Integration of Whole Life Costs into BIM Processes to Assist Design Decision Making


1
Cartwright Pickard, 1 Canal Side Studios, 8-14 St Pancras Way, London NW1 0QG, UK
2
Glasgow School of Art, 167 Renfrew St, Glasgow G3 6RQ, UK
*
Author to whom correspondence should be addressed.
Buildings 2019, 9(5), 114; https://doi.org/10.3390/buildings9050114
Submission received: 19 March 2019
/
Revised: 22 April 2019
/
Accepted: 27 April 2019
/
Published: 5 May 2019
(This article belongs to the Special Issue IT in Design, Construction, and Management)
Abstract
:A common barrier to achieving design intent is the absence of comprehensive information about operational performance during design development. This results in uninformed decision-making which impacts on actual building performance, in particular Whole Life Costs (WLC). It is proposed that Building Information Modelling (BIM) has the potential to facilitate a more comprehensive and accurate design approach from the initial stages if the model can utilize reliable and robust cost and performance data from buildings in use. This paper describes the initial findings of a research project that has investigated the integration of WLC estimation into BIM processes. The study focusses specifically on the rapidly emerging Private Rental Sector (PRS) as the build-to-rent market has repeatable tasks and similar workflow patterns, roles and responsibilities, but impacts of WLC can significantly influence the business model. The study adopted a mixed method approach for the development and validation of a structured standardized process for timely WLC estimation through BIM. The research identified a number of barriers. These included varying definitions of WLC calculation methodologies; the availability and standards of data sources, in particular, the misalignment of coding systems for identification and classification of components at various levels of development, proprietary ownership of data, lack of knowledge and skills in team members to produce and/or utilize data sources, and limitations of software. However, the research proposes that these may be addressed by a reverse-engineered systematic process that uses the Integrated DEFinition (IDEF) 3 structured diagramming modelling technique that can be incorporated into a software model and has developed a model for a systematic approach for BIM-enabled WLC assessment based on CE principles which would include access to live data streams from completed buildings. The paper describes this model development which has the potential to enhance BIM lifecycle management through an augmented decision-making approach that is integral to the natural design development process.
1. Introduction
Successive UK construction industry reports have documented the fact that the sector has been suffering from low innovation and underperformance in terms of productivity and quality of the final product [1,2,3] and this has led to the UK Government’s target of a 33% reduction in Whole Life Cost (WLC) [2]. Research has shown that over a 30-year life span, the cost of operating the asset could be as much as four times the cost of designing and constructing the building, and that 80% of the operation, maintenance, and that replacement costs of a building can be influenced in the first 20% of the design process [4,5]. However, buildings rarely perform as expected [6,7]. This can impact on sustainability and building performance, but also factors such as energy consumption, environmental quality and operational costs (OpEx) [4,8,9,10]. It has been argued that the most common barrier to achieving design intent is the absence of comprehensive information during design and construction stages, leading to poor decision-making, which impacts on performance and WLC [11,12].
As a consequence, the need for a more holistic approach to building design is gaining momentum. There are several technologies that are expected to play a part in the transition from linear to circular economic growth: the internet of things, the cloud, big data, and Building Information Modelling (BIM) [13]. BIM has proven its potential to facilitate the building development process during planning, designing, construction, and operation [14,15]. Nevertheless, to date, BIM has focused on the design and construction of the built asset. Therefore, although the use of BIM for calculating CapEx has become commonplace, its potential to be used for estimating WLC is not yet developed. Several BIM software solutions have been developed with the aim of calculating WLC, but none of them offers a complete solution [16]. One reason for this is that data exists in varying formats with different owners. Thus, there is the need to bring together different approaches into a standardized framework that utilizes the existing technological enablers by establishing links between them. More importantly, it is essential to specify information requirements and exchange procedures.
To achieve this step change, current working processes have to be re-examined and re-engineered [17] so as to follow a more concurrent approach for WLC assessment [4]. Concurrent Engineering (CE) principles have been successfully implemented in manufacturing, for mapping the design process so as to make it explicit [18,19,20]. Process mapping (using structured diagramming techniques) helps in the identification of tasks that add value to the project, and the elimination of bottlenecks [21,22,23]. However, the mapping of building design processes presents bigger challenges since its nature and variability is fundamentally different from the manufacturing process [11,24], in part due to the bespoke nature of buildings, but also due to lack of common design methods and processes. Nevertheless, it is believed that a CE approach would ensure sustainable development at every stage of the building life cycle, enabling the principles of designing to a cost, as opposed to costing a design [25]. A detailed and accurate model can allow designers and clients to understand the wider impacts of design changes in real time and within iterative processes, and to track this information through construction stages.
This paper is based on a project that examines how BIM policies, technologies, and processes can facilitate a more accurate prediction of WLC that is more efficient in terms of time and effort involved to achieve quality assurance. WLC considers all significant and relevant initial and future costs and benefits of an asset throughout its life cycle, while fulfilling the performance requirements [26,27]. This holistic approach could produce high-performance buildings that are both cost-effective and sustainable, but also mitigate risks to building owners. The project focuses on the Private Rental Sector (PRS), also known as Build-to-Rent (BTR) [28]. Affordable housing tenure under a single management, and assessed viability that recognizes distinct tenure economics are key principles for increasing the quality and quantity of BTR [29]. Thus, for the investor, assessing the long-term viability of such developments, and minimizing risks are critical issues. For that reason, WLC evaluation must provide a careful breakdown of cashflow that goes beyond the CapEx. This includes level of amenities offered along with maintenance decisions and current research demonstrates that performance gaps [6,7] represent a significant threat.
This paper demonstrates how cost information related to maintenance and actual performance of completed buildings can be incorporated during design processes in order to make decisions that are critical for the timely assessment of WLC. It is proposed that BIM can provide a more integrated and rigorous vehicle for assessing viability of BTR schemes, while maintaining high performance standards for quality, thus offering a competitive approach through improved customer service.
First, the paper provides an overview of the UK housing context discussing the need for WLC estimation as an integral part of decision-making throughout the design process. Then, it describes a systematic approach for its standardization using conceptual business process modeling and the Integrated DEFinition (IDEF) 3 structured diagramming technique [23,30]. Next, it reports on the state-of-the-art technological enablers that have facilitated the automation of repetitive prescriptive tasks based on the identified patterns, and presents the factors that affect its efficient implementation. Finally, it presents examples of representation methods used to demonstrate WLC calculations.
2. Materials and Methods
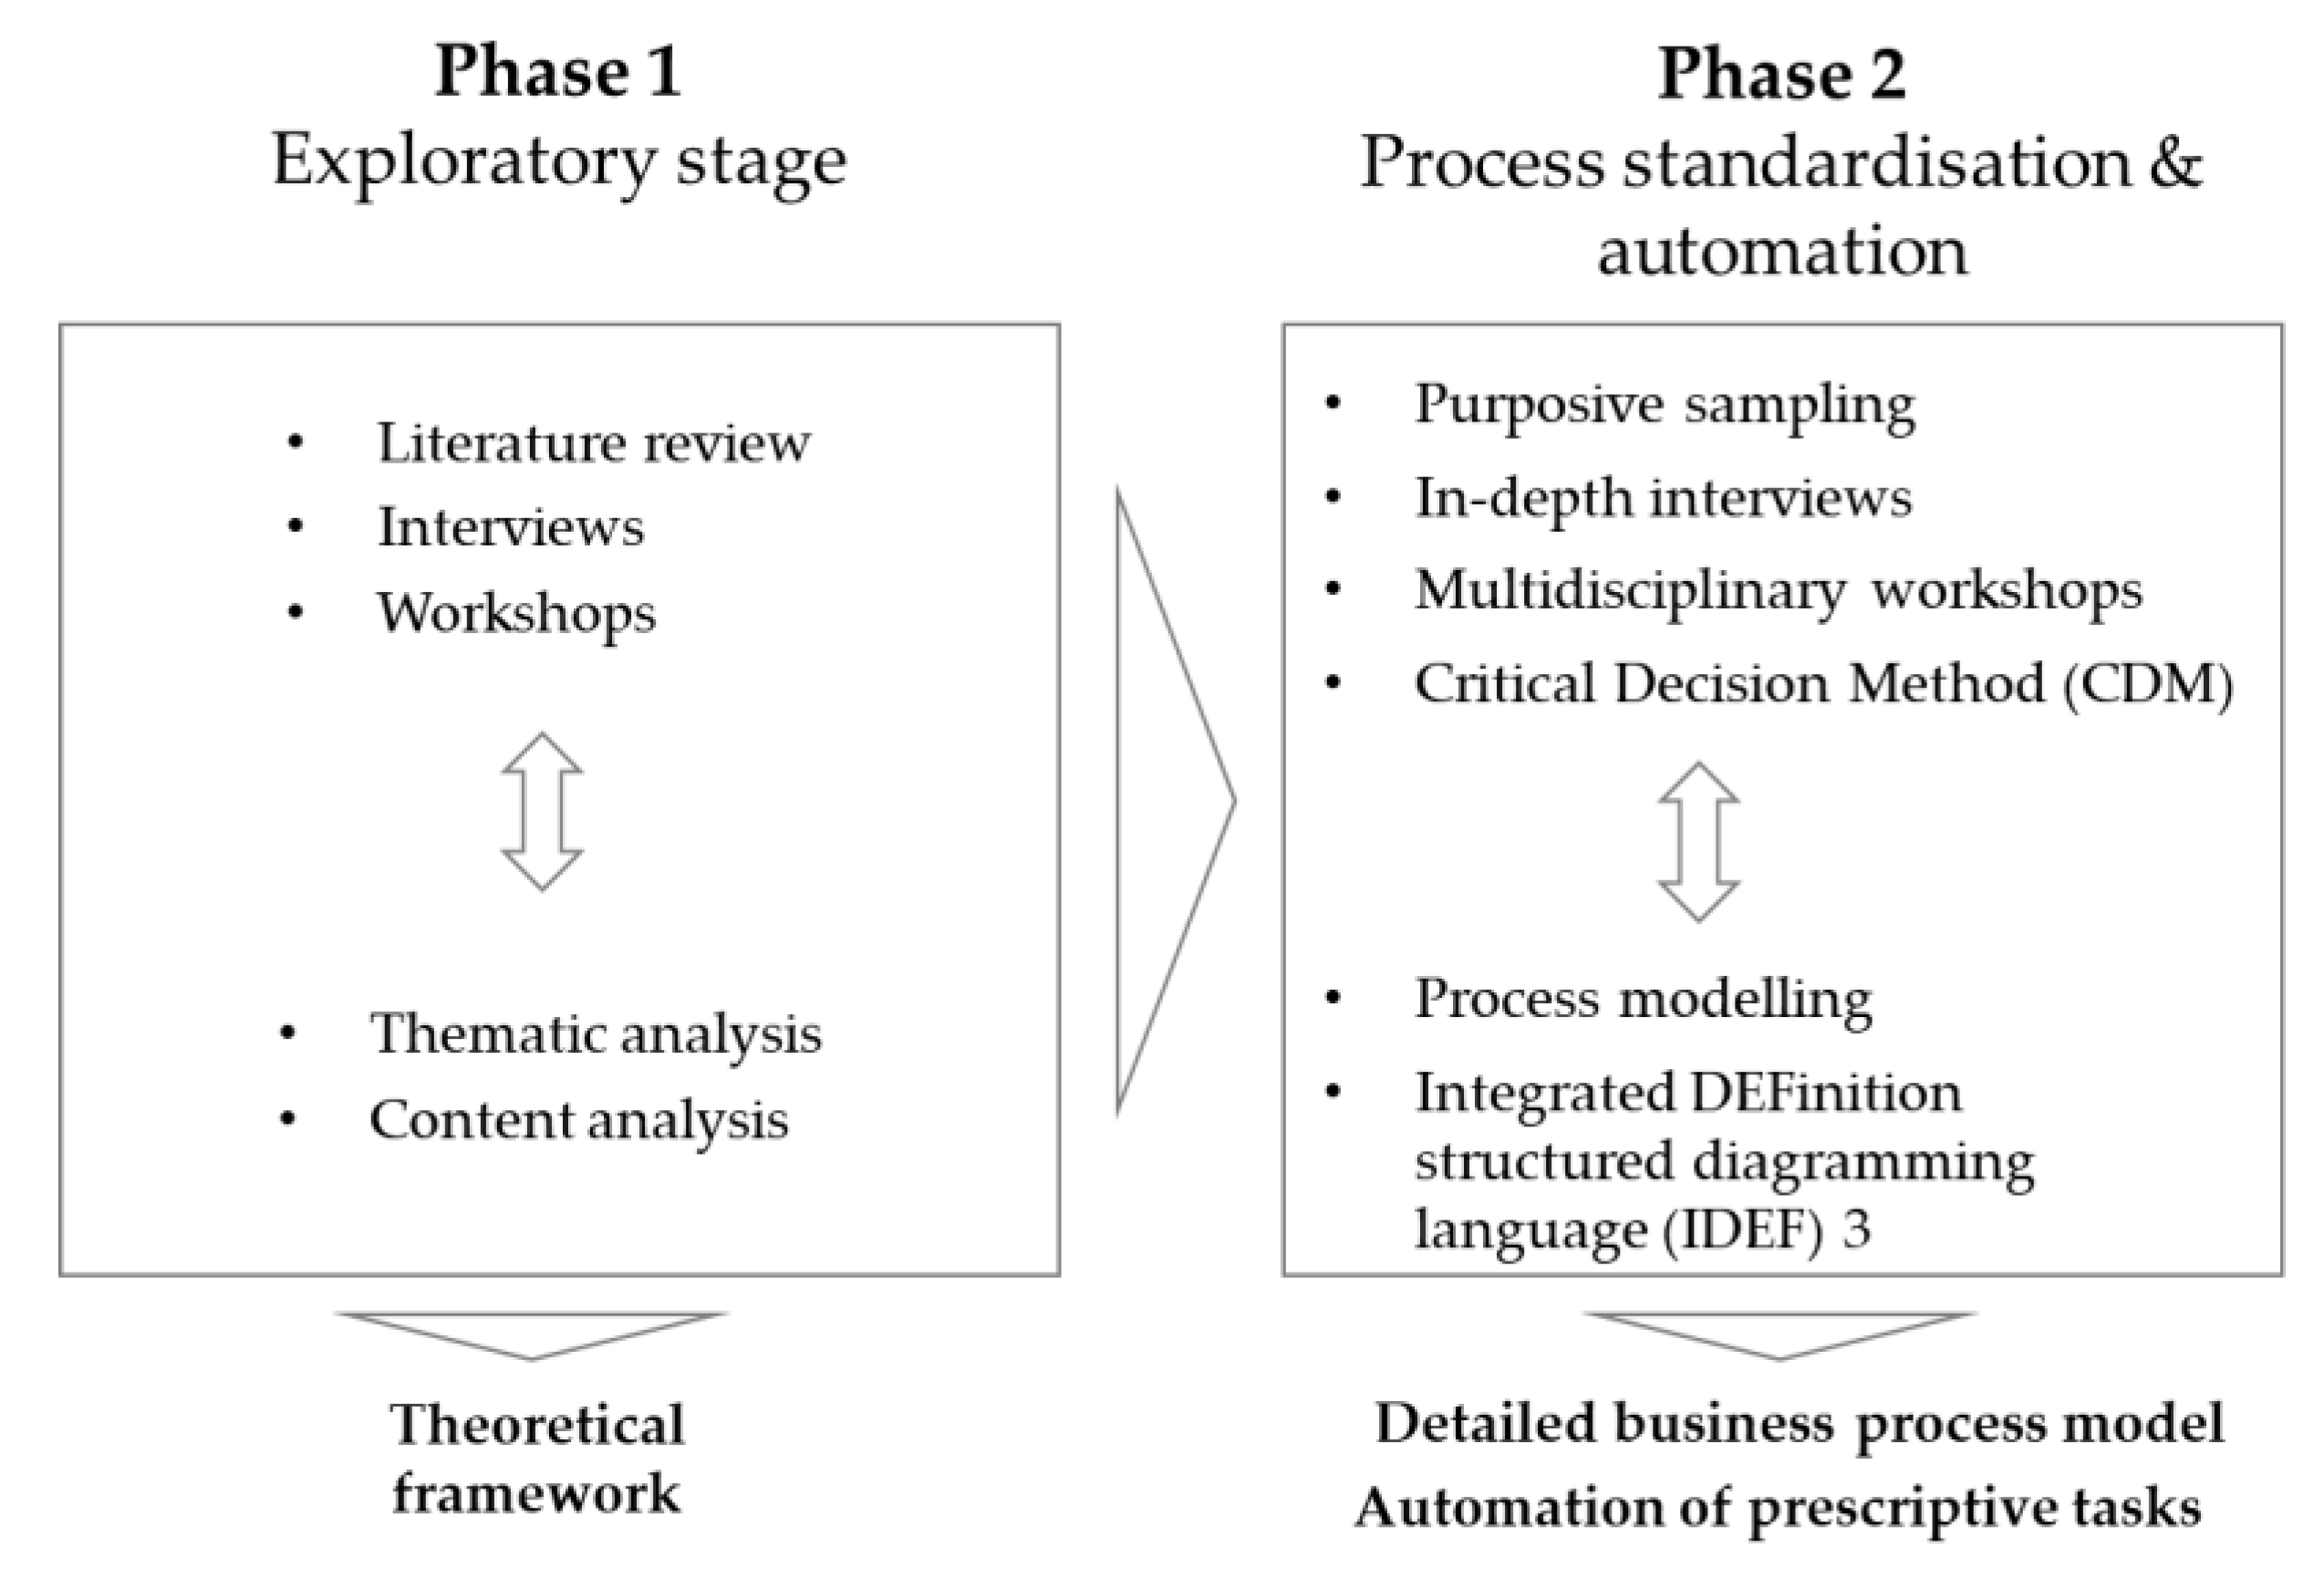
This research follows the pragmatic paradigm throughout the research design, data collection, and analysis [31]. Mixed methods have been utilized [32,33,34], and rationalized through abductive reasoning [35,36] for the development and validation of a structured standardized process for more accurate and timely WLC estimation through BIM. A number of qualitative methods were adopted, which include a thorough literature review, exploratory interviews, in-depth case study interviews, and validation interviews. Yin [37] has discussed six sources of evidence from case study research: (i) documentation, (ii) archival records, (iii) interviews, (iv) direct observations, (v) participant observation, and (vi) physical artefacts. To address the lack of measurability in interview research, which is based on the interpretations of the researcher, triangulation of the data was implemented whenever possible [38]. The triangulation method is considered to be a very powerful one as it combines the strengths and offsets the weaknesses of both qualitative and quantitative methods [34,39]. Corroboration of methods, during this study, provided assurance towards the validity and reliability of the responses and assisted in identifying conflicting responses of individuals [40]. Figure 1 provides an overview of the research design, which has been split into two distinct Phases: (i) Exploratory stage, and (ii) Process standardization and automation.
2.1. Phase 1: Exploratoty Stage—Theoretical Framework
The first phase of the research was exploratory (see Figure 1). Methods implemented include literature review and purposive sampling, which included a series of interviews and workshops with a design team, two tier-1 contractors, two major national developers, engineers, product manufacturers, software providers/developers, an insurance company, and a cost consultant specialist in WLC for the PRS. Thematic [41,42] and content [43,44] analysis was used to develop a theoretical framework that establishes the gaps in knowledge along with the main problems in WLC BIM management. This step served to identify process enablers as well as research questions and assisted in anticipating constraints before commencing the main development effort [45]. The findings of Phase 1 are discussed in Section 3.1.
2.2. Phase 2: Process Standardisation and Automation—Business Process Model
The second phase has been an iterative process of developing a detailed model that clearly links information requirements to design decisions that are critical for the timely assessment of WLC during the delivery of BTR projects (see Figure 1). The model follows CE principles, which have been mainly implemented in manufacturing to ensure quality assurance of the outcome [11]. Since BIM collaborative processes have been found to resemble CE characteristics, there has been a recent shift towards standardization of information exchanges following CE principles [18,46,47]. Similarly, this research utilized process mapping to standardize repeatable high-value tasks for WLC. The research outputs aim to enhance BIM lifecycle management through a smart decision-making approach that is integral to the natural design development process.
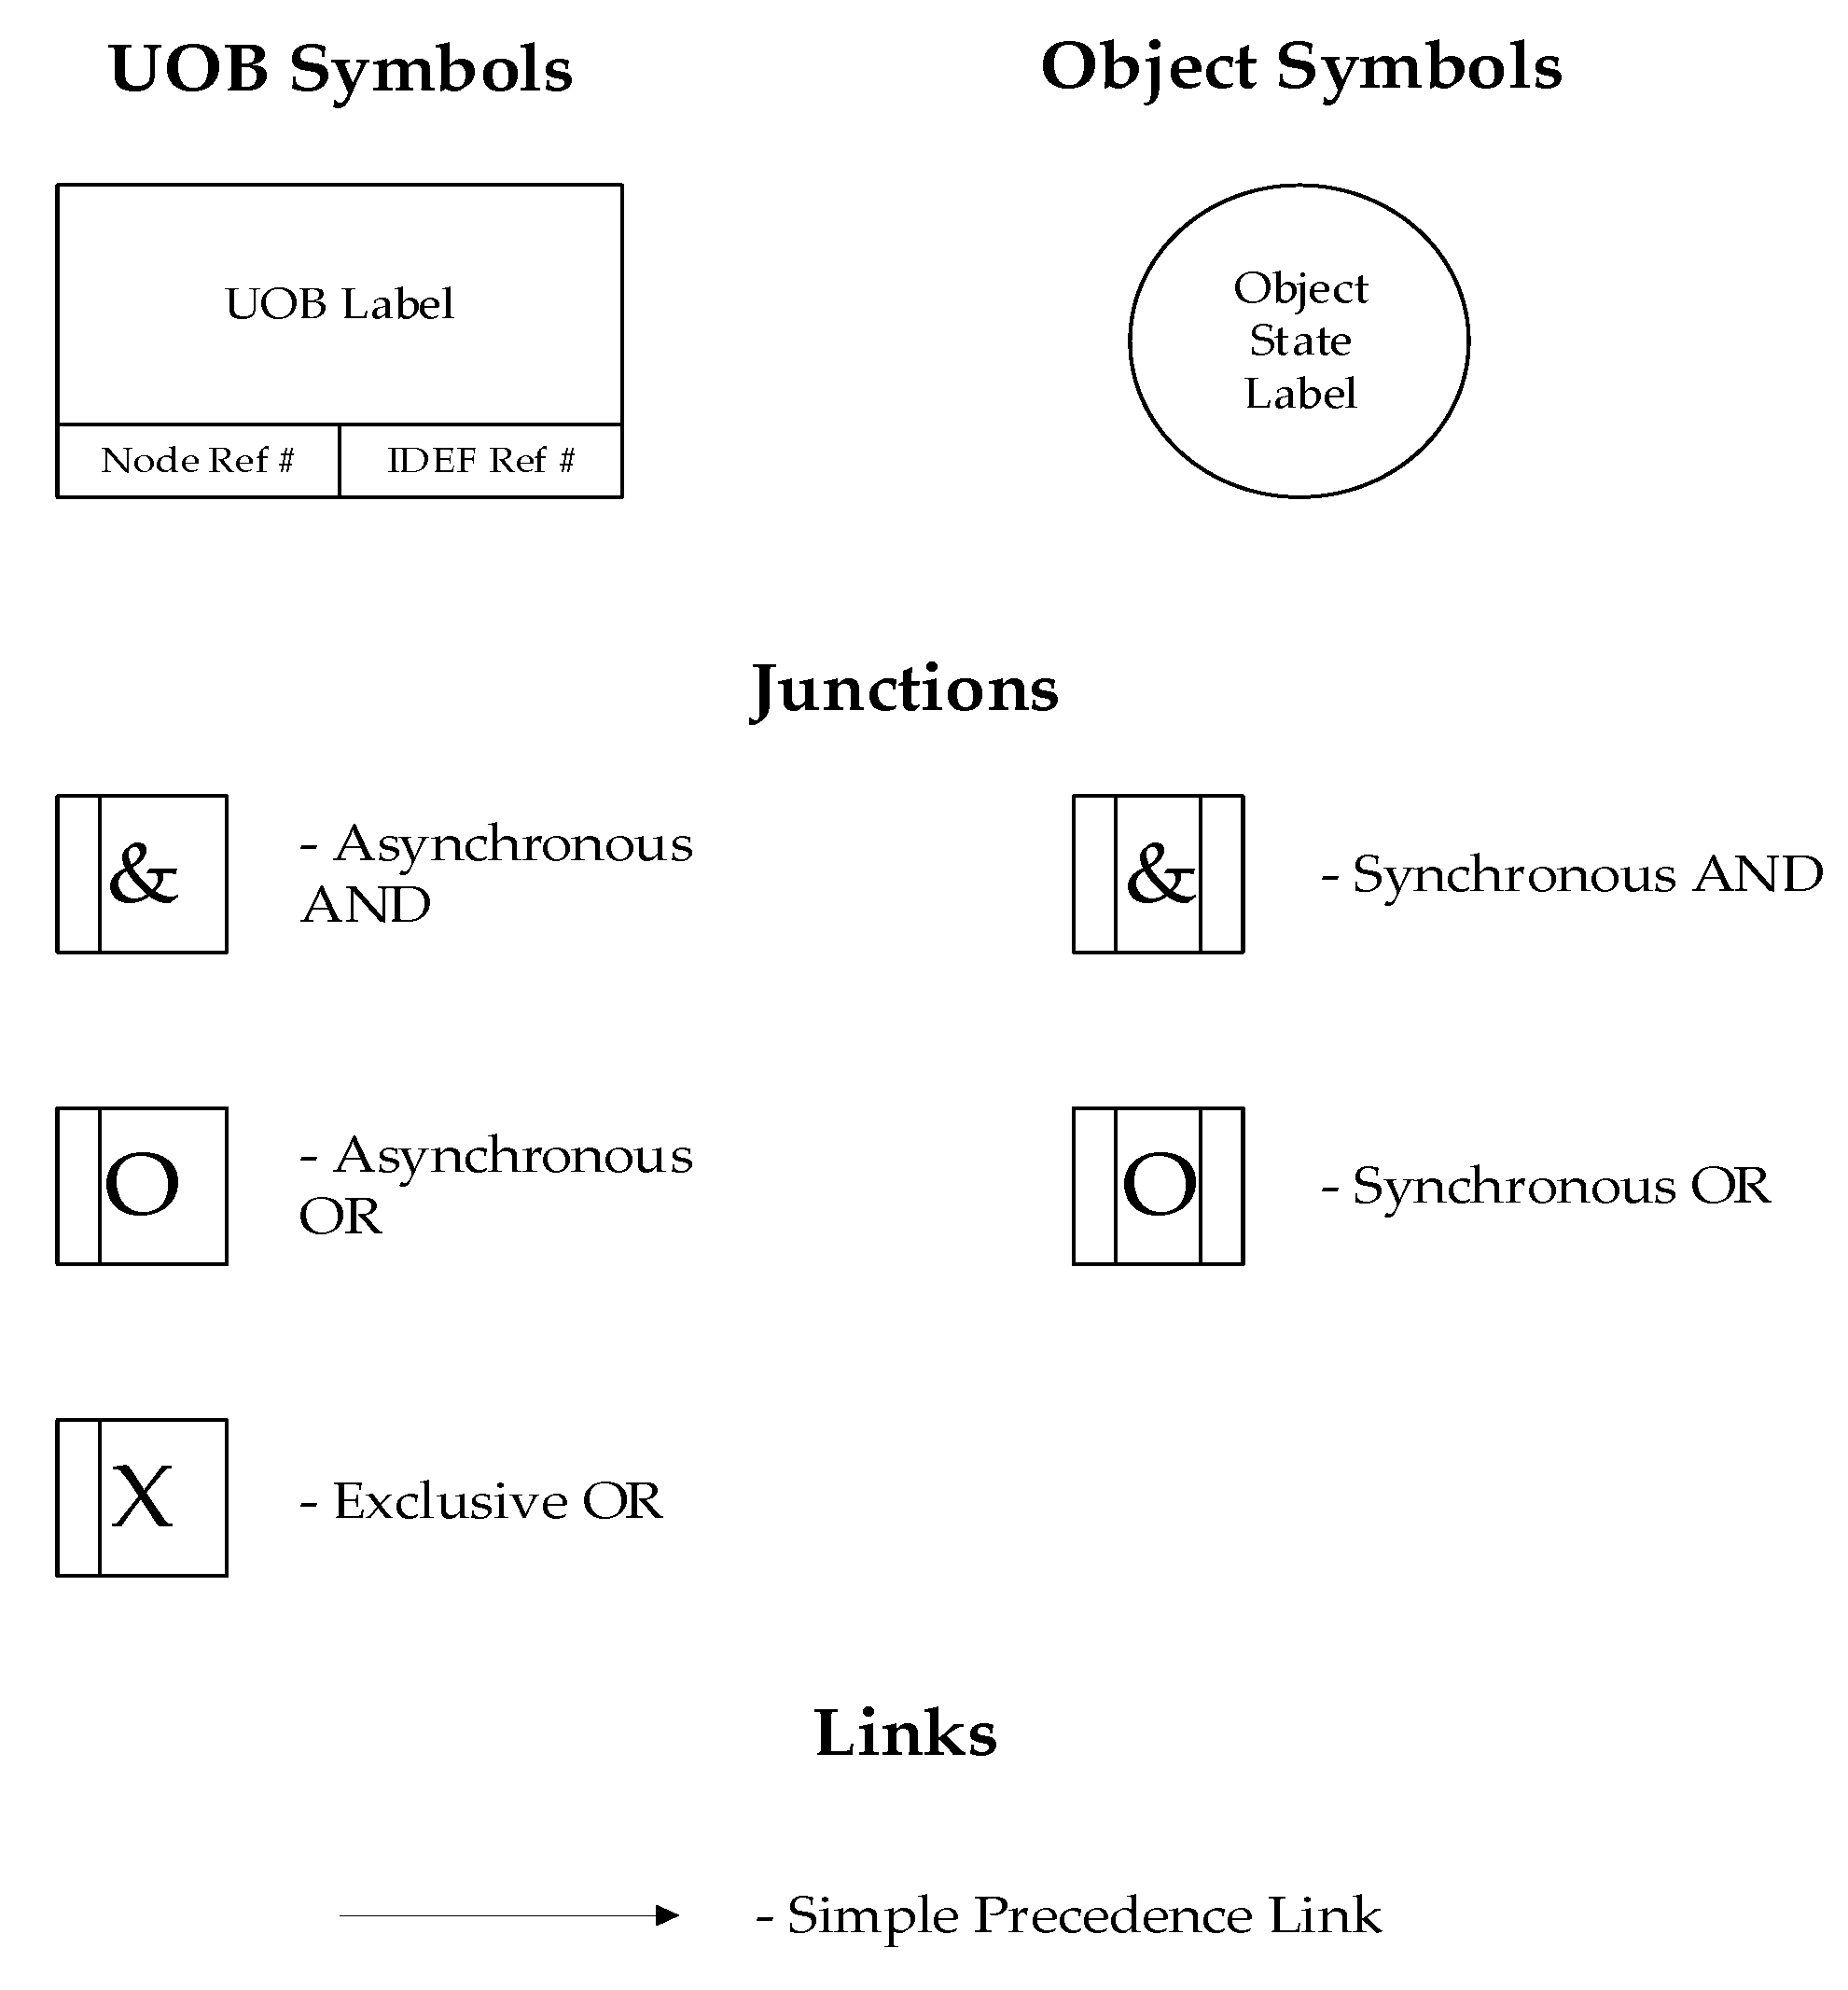
The chain of interdependencies has been determined following the Critical Decision Method (CDM) [48]. These have been coordinated explicitly into a reverse-engineered systematic process that uses the IDEF3 structured diagramming modelling technique [30]. The IDEF3 method was selected due to its high descriptive power, which is considered appropriate for detailed processes that handle know-how knowledge. IDEF3 captures descriptions about sequences of activities, while also identifying critical decision points, or milestones, of the process from different perspectives [30]. IDEF3 has specifically been developed to model stories (situation or process) as an ordered sequence of events and activities [23]. It is a scenario-driven process flow modelling method created to map descriptive activities. The goal of IDEF3 is to provide a structured method for expressing the domain expert’s knowledge about how a particular system, or organization, works (ibid.). For these reasons, the IDEF3 Process Description Capture Method manages to remain simple while maintaining a high descriptive power [49]. In IDEF3, the boxes represent real world processes as happenings; these are referred to as Units-of-Behavior (UOB). The arrows that connect the boxes indicate precedence between actions. The junctions represent constraints and enable process branching. Also, the junctions involve choices among multiple parallel or alternative sub-processes. The logical decisions include: AND (&), OR (O), and EXCLUSIVE-OR (X), and synchronous or asynchronous start and finish of the processes. The objects are illustrated as circles that represent their different states connected with arrows that have UOB’s referents to indicate the entry, transition, state, and exit conditions [30]. Figure 2 shows symbols used for process description schematics.
Examples of the IDEF3 process models are presented in Section 3.2.2. The technological enablers used to facilitate the process, are discussed in Section 3.2.3.
3. Results and Discussion
This section describes and discusses the findings of this research. First, it reviews the theory that underpins this research (Section 3.1) and then, presents the outputs of the research.
3.1. Theoretical Framework
This section is divided into four subsections that provide an overview of the research problem. First, it explains the urgency for WLC assessment of BTR housing developments. Then, it describes the scope of WLC assessment, also examining the issues that hinder its implementation. Following this, it justifies the methods used for calculating and benchmarking WLC. Finally, it presents sources of data.
3.1.1. UK Housing Context and the Build-To-Rent (BTR) Sector
Several recent reports have highlighted the need for increasing both the quality and quantity of affordable housing in the UK [50,51]. Historically, the majority of privately rented properties have been acquired and managed by individuals and there is no shared framework for quality standards. To address this issue, the UK Government announced its Housing Stimulus Package (in September 2012), and established a task force to attract investment and share information on best practice. As a result, there is increased focus on Build-to-Rent (BTR) by larger players, following the example of other advanced countries. The key principles for increasing the number and quality of BTR are [29]: (i) clear definition of BTR with guidance, (ii) affordable housing tenure under a single management, (iii) applied flexibility under Policy 3.5.d of the London Plan, (iv) assessed viability that recognizes distinct tenure economics, (v) best management standards. The large-scale nature of these developments means that assessing the long-term viability of such developments is a critical issue for investors. For that reason, WLC evaluation must provide a careful breakdown of cashflow that goes beyond the CapEx. This includes level of amenities offered along with maintenance decisions. However, research has shown that homes do not always perform in the way that was originally intended [6,7] and the hypothesis is that WLC enabled by BIM can provide a more sophisticated approach for assessing viability of BTR schemes while maintaining high performance standards for quality, thus offering better return on investment and reduced risk. Research has already demonstrated the potential benefits of BIM for delivering a better customer experience in the UK housing sector, supporting the notion that it should be mandated for the majority of construction projects in the UK [52].
The interviewees have stressed the fact that the BTR has a separate set of drivers than some other asset classes, and those differences have an impact of traditionally accepted WLC modelling strategies. Those influencing factors include:
- Residencies need to look almost new every time they are re-let (potentially every 2–3 years);
- Public Areas need to always look new;
- There can be no components that are not always fully functioning.
These requirements create the need to introduce a new term in the WLC terminology, which is Aesthetic Lifecycle. This means that some components should be replaced at a higher frequency in comparison to other types of buildings. To accommodate these constraints into the model, rules have been applied to different types of functional units (e.g., communal areas, residential areas). Furthermore, business critical components have been compiled into a list of manageable assets. An example of how these have been standardized, is presented in Section 3.2.1.
3.1.2. WLC Definition and Scope
WLC has been defined in BSI ISO 15686-5:2008 “Buildings and constructed assets. Service life planning. Life cycle costing” [53] as a methodology for systematic economic consideration of all significant and relevant initial and future costs and benefits of an asset, throughout its life cycle, while fulfilling the performance requirements over a period of analysis, as defined in the agreed scope. On the other hand, Life Cycle Costing (LCC) is narrower in scope as it focuses on economic efficiency and supports the selection of the most cost effective solution at each stage of design development [8,54,55]. Furthermore, Life Cycle Analysis (LCA) is an internationally standardized method for assessing environmental and health impacts that does not address economic considerations [56,57]. Some have considered LCC and LCA inclusive to WLC assessment [16], while others have claimed that LCC and LCA should go hand in hand in a holistic process that considers trade-off relationships between cost and performance issues [58]. Essentially, WLC, LCC, and/or LCA estimations are important parts of Sustainable Building Design (SBD) as defined by several sustainability frameworks and certification systems [59,60], but researchers have identified the lack of standard methods and format for calculating WLC as the main barrier for its implementation [61]. This highlights the need for the development of standardized protocols for BIM-enabled WLC estimation, integrated from the early design stages. However, WLC cannot be the only measure for assessing a project’s viability, nor the only indicator that should be used as a method for future-proofing a design. Intangibles such as user comfort, amenity and efficiency lead to increased occupant satisfaction, and are associated with financial implications [4]. This research, therefore, implements a holistic approach for integrating WLC considerations throughout the design process.
3.1.3. Calculation Methods and Benchmarking
There are several variables that form an important part of WLC calculations, which represent either a decision (by the client or assessor), or a judgment by the designer [8]. The most important ones are:
- the period of analysis;
- the discount rate;
- the cycles or intervals between maintenance activities; and
- the unit rates for work to be done.
After identifying all LCC by year and amount and discounting them to Present Value (PV), they are added to arrive at total LCC for each alternative [62]:
LCC = I + Repl − Res + E + W + OM&R + O
- LCC = Total LCC in PV;
- I = PV investment costs (if incurred at base date, they need not be discounted);
- Repl = PV capital replacement costs;
- Res = PV residual value (resale value, salvage value) less disposal costs;
- E = PV of energy costs;
- W = PV of water costs;
- OM&R = PV of non-fuel operating, maintenance and repair costs;
- O = PV of other costs (e.g., contract costs).
LCC frameworks and standards have been employed to measure economic cost of design alternatives. In addition, trade-off relationships between cost and carbon are considered by comparing LCC against carbon dioxide (CO2), and carbon dioxide equivalent (CO2e). Examples of graphical representants are presented in Section 3.2.4.
As WLC analysis requires assumptions about future behavior, iterative risk analysis can be used to progressively reduce uncertainty, but a residual risk always remains. Therefore, WLC analysis should allow for uncertainty and risk [4]. Uncertainty in input values means that actual outcomes may differ from estimated outcomes. There are several ways to calculate LCC while dealing with uncertainty [63] such as: (i) Deterministic—single value inputs or a combination of values and how they change over time, or (ii) Probabilistic—by contrast are based on the assumption that no single figure can adequately represent the full range of possible alternative outcomes of a risky investment. The outcome is expressed in terms of probabilistic distribution, and statistical analysis can be performed to measure the degree of risk. This study has utilized both deterministic (i.e., sensitivity analysis for a variety of discount factors, service lives, and costs’ increase/decrease) and probabilistic (i.e., Monte Carlo simulations) methods to reflect uncertainties, as recommended by the relevant British Standards [4,64,65,66].
Furthermore, benchmarking performance at various levels of design development has served to transfer lessons learnt so as to close the feedback loop from previous projects [8,67,68,69,70]. These include:
- Cost per m2 (defined as gross internal area);
- Cost per m2 per year;
- Cost per kW (e.g., boilers);
- Cost percentage of total CapEx;
- Cost of renewals over the period of analysis (annualized for short to longer term);
- Gross to net ratio;
- Wall to floor ratio;
- Percentage of circulation space;
- Cost per function unit (e.g., apartment types, bedrooms, user);
- No. of persons per m2;
- Elemental distribution cost at several scales (i.e., component, system, element, cluster, single asset, multiple assets);
- Construction, Renewal, Operation, Maintain, End-of-life (CROME) costs’ distribution.
3.1.4. Sources of WLC Data
The accuracy of WLC assessment substantially depends on the quality and availability of data from all phases of a building [17]. Sources of data can be [8]: (i) Unstructured historical data; (ii) Structured historical data; (iii) Data from modelling; and (iv) Data from manufacturers, suppliers and specialist contractors. While historical data are used for prediction during design, dynamic data from sensors are used for monitoring actual performance to verify predictions. Over time, this data could also be used to generate a historical database that in turn will be used for briefing, as well as predictive design. At present, the literature suggests a lack of longitudinal studies that focus on monitoring the performance and reliability of systems [71,72]. A major problem that limits the effectiveness of building decision support tools is the difficulty to obtain accurate data from various sources related to a building [73]. This research has used data from a variety of sources as indicated in RICS Life Cycle Costing professional guidance [8]. Specifically, the RICS Building Running Costs Online subscription service [74], which is the UK’s largest structured database of empirical data, contains information on CO2 and CO2e performance, apart from economic cost (£). Their benchmarks have been captured for both top-down (i.e., whole building) and bottom-up (i.e., components and systems) calculations and are structured according to the Building Cost Information Service (BCIS) Elemental Standard Form of Cost Analysis [69]. Table 1 contains an example of maintenance schedule for a hardwood window. WLC and CO2/CO2e data are presented as an annual breakdown. Graphs and analyses of WLC calculations are discussed in Section 3.2.4.
3.2. Process Standardization and Automation
Increasing the maturity of BIM-enabled collaborative processes requires the transition from ad hoc design procedures to defined tasks and deliverables [75]. Therefore, the defined process should provide a clear account of value-adding steps, which are delegated to project team members [76]. Optimized flow of information is considered necessary so as to achieve high-performing buildings where decision-making is based on the latest version of information. Systemic approaches to organize design have been implemented since the 1960s and are widely accepted [77]. More recently, the Generic Design and Construction Process Protocol (GDCPP) has defined the complete design process [78,79]. The GDCPP model has not only described the physical stages of the process but has also addressed the management of design. The delivery of coordinated graphical and non-graphical information is the main issue. It has been claimed that the early entry of stakeholders and their functionaries, with an emphasis on the design and planning, can minimize error and reviewing during the construction phase [80]. Following the same principles, several attempts have been made to benchmark the maturity of BIM implementation [75,81,82]. Despite the various standards and protocols that have been released to define BIM, the practical experience for its implementation is still lacking. Thus, the need for the development of a “BIM Execution Plan” (BEP), before the actual design starts, has been argued [83,84]. The plan’s intention is to define the roles, responsibilities, and duties of the different stakeholders according to the BIM deliverables for each design stage. Its purpose is to assist organizations maximize BIM implementation focusing on the activities, messages, and events that are executed to achieve a common goal [85].
This section describes how WLC information has been linked to BIM entities, information requirements and flows for each design stage, and software enablers that have facilitated the automation of functions. Finally, it shows graphical representations that have been generated as a result of the process. The aim is to create a framework and subsequent model that highlights tasks’ dependencies, information requirements, and decisions that are critical for timely assessment of WLC following CE principles to support decision-making at design stages. It has identified patterns of value-adding tasks that have a significant effect on WLC and utilized BIM tools to automate prescriptive tasks so as to accelerate and streamline information exchange procedures. As a result, it ensures the quality of information used for calculations, also increasing the reliability of estimations.
3.2.1. Digitization of Building Information and Data Structures
Open standards have been utilized for enabling information exchange that is not restricted by proprietary formats, assisting in better communication between project team members that use specialized software tools. This study utilizes Industry Foundation Classes (IFC) and Construction Operations Building Information Exchange (COBie), which have a hierarchical object-oriented structure, as illustrated in Figure 3. Their basic building blocks are equivalent to real elements, including their properties. Employment of an object-oriented structure allows association of cost information as attributes to model entities for all levels of abstraction. This level of granularity of information goes beyond what is specified by the current Level 2 BIM maturity definition that has been mandated by the UK Government [1]. Nevertheless, it is essential for performing smart analytics as well as monitoring in-use performance, which in turn assists in making WLC projections based on actual data, and benchmarking at appropriate levels of detail in order to feed lessons learnt in the design of future projects. The following elements have been attributed to the model entities:
- Design criteria and specifications [69].
Table 2 shows how Uniclass classifications for Systems (Ss) and Products (Pr) have been aligned with Level 3 and 4 NRM codes respectively for elemental and sub-elemental (bottom-up) WLC reporting. The main issue in assigning the above information to the model is gaps in alignment between Uniclass2015 and NRM3 codes, and the fact that a single NRM3 code is describing a number of elements of a cost database (with unique identifiers). Nonetheless, this fact has proven to be useful for performing comparative analysis between alternative types of components or systems, as shown in Section 3.2.4. Furthermore, Spaces/Locations (SL) Uniclass codes have been used to benchmark the (top-down) WLC performance of functional units (e.g., SL_45_10_09 Bedrooms, and SL_45_10_49 Living rooms).
3.2.2. Information Flows—Process Model Development
Previous research supports the idea that traditional processes cannot be employed to achieve complex high-performing buildings, and that a CE design process approach to WLC assessment is essential [11,12,17,23]. During the traditional building design process, each stakeholder passes fixed information to the next stakeholder, which results in compromised design outcomes. What the CE approach suggests is that design solutions are developed, assessed, and revised collaboratively, as design progresses [88]. Thus, a single linear prescribed process is not viable, because the complexity, amount of specialization and individual project needs do not enable iterations.
In fact, the importance of decision points has been stressed in UK’s PAS 1192-2:2013 “Specification for information management for the capital/delivery phase of construction projects using building information modelling” and the PD 19650-0:2019 “Transition guidance to BS EN ISO 19650” international standard [89,90] as a critical aspect of the collaborative process. For this reason, this research strives to identify the critical decision points for WLC and align these with the appropriate WLC considerations and criteria. The decision points comprise two types of gates; hard-gates when the design freezes until the review is conducted, and soft-gates that allow the project to proceed in parallel, enabling a CE approach. It is suggested that the hard-gates serve the purpose of committing to decisions collectively, while soft-gates are identified throughout the process so that critical decisions occur in parallel. Instead of design participants working in isolated silos, between the hard-gates (start/end of design stages), the soft-gates identified during the Work-in-Progress (WIP) phase can facilitate communication by triggering design tasks so as to clarify the process for practitioners and reduce uncertainty.
As described in Section 2.2, the IDEF3 process model has been developed abductively, through a series of inductive and deductive steps. Figure 4 shows the high-level (Level 1) decomposition of the IDEF3 process model, which has aligned a number of UK standards for design development, information management, and cost reporting. These comprise the following:
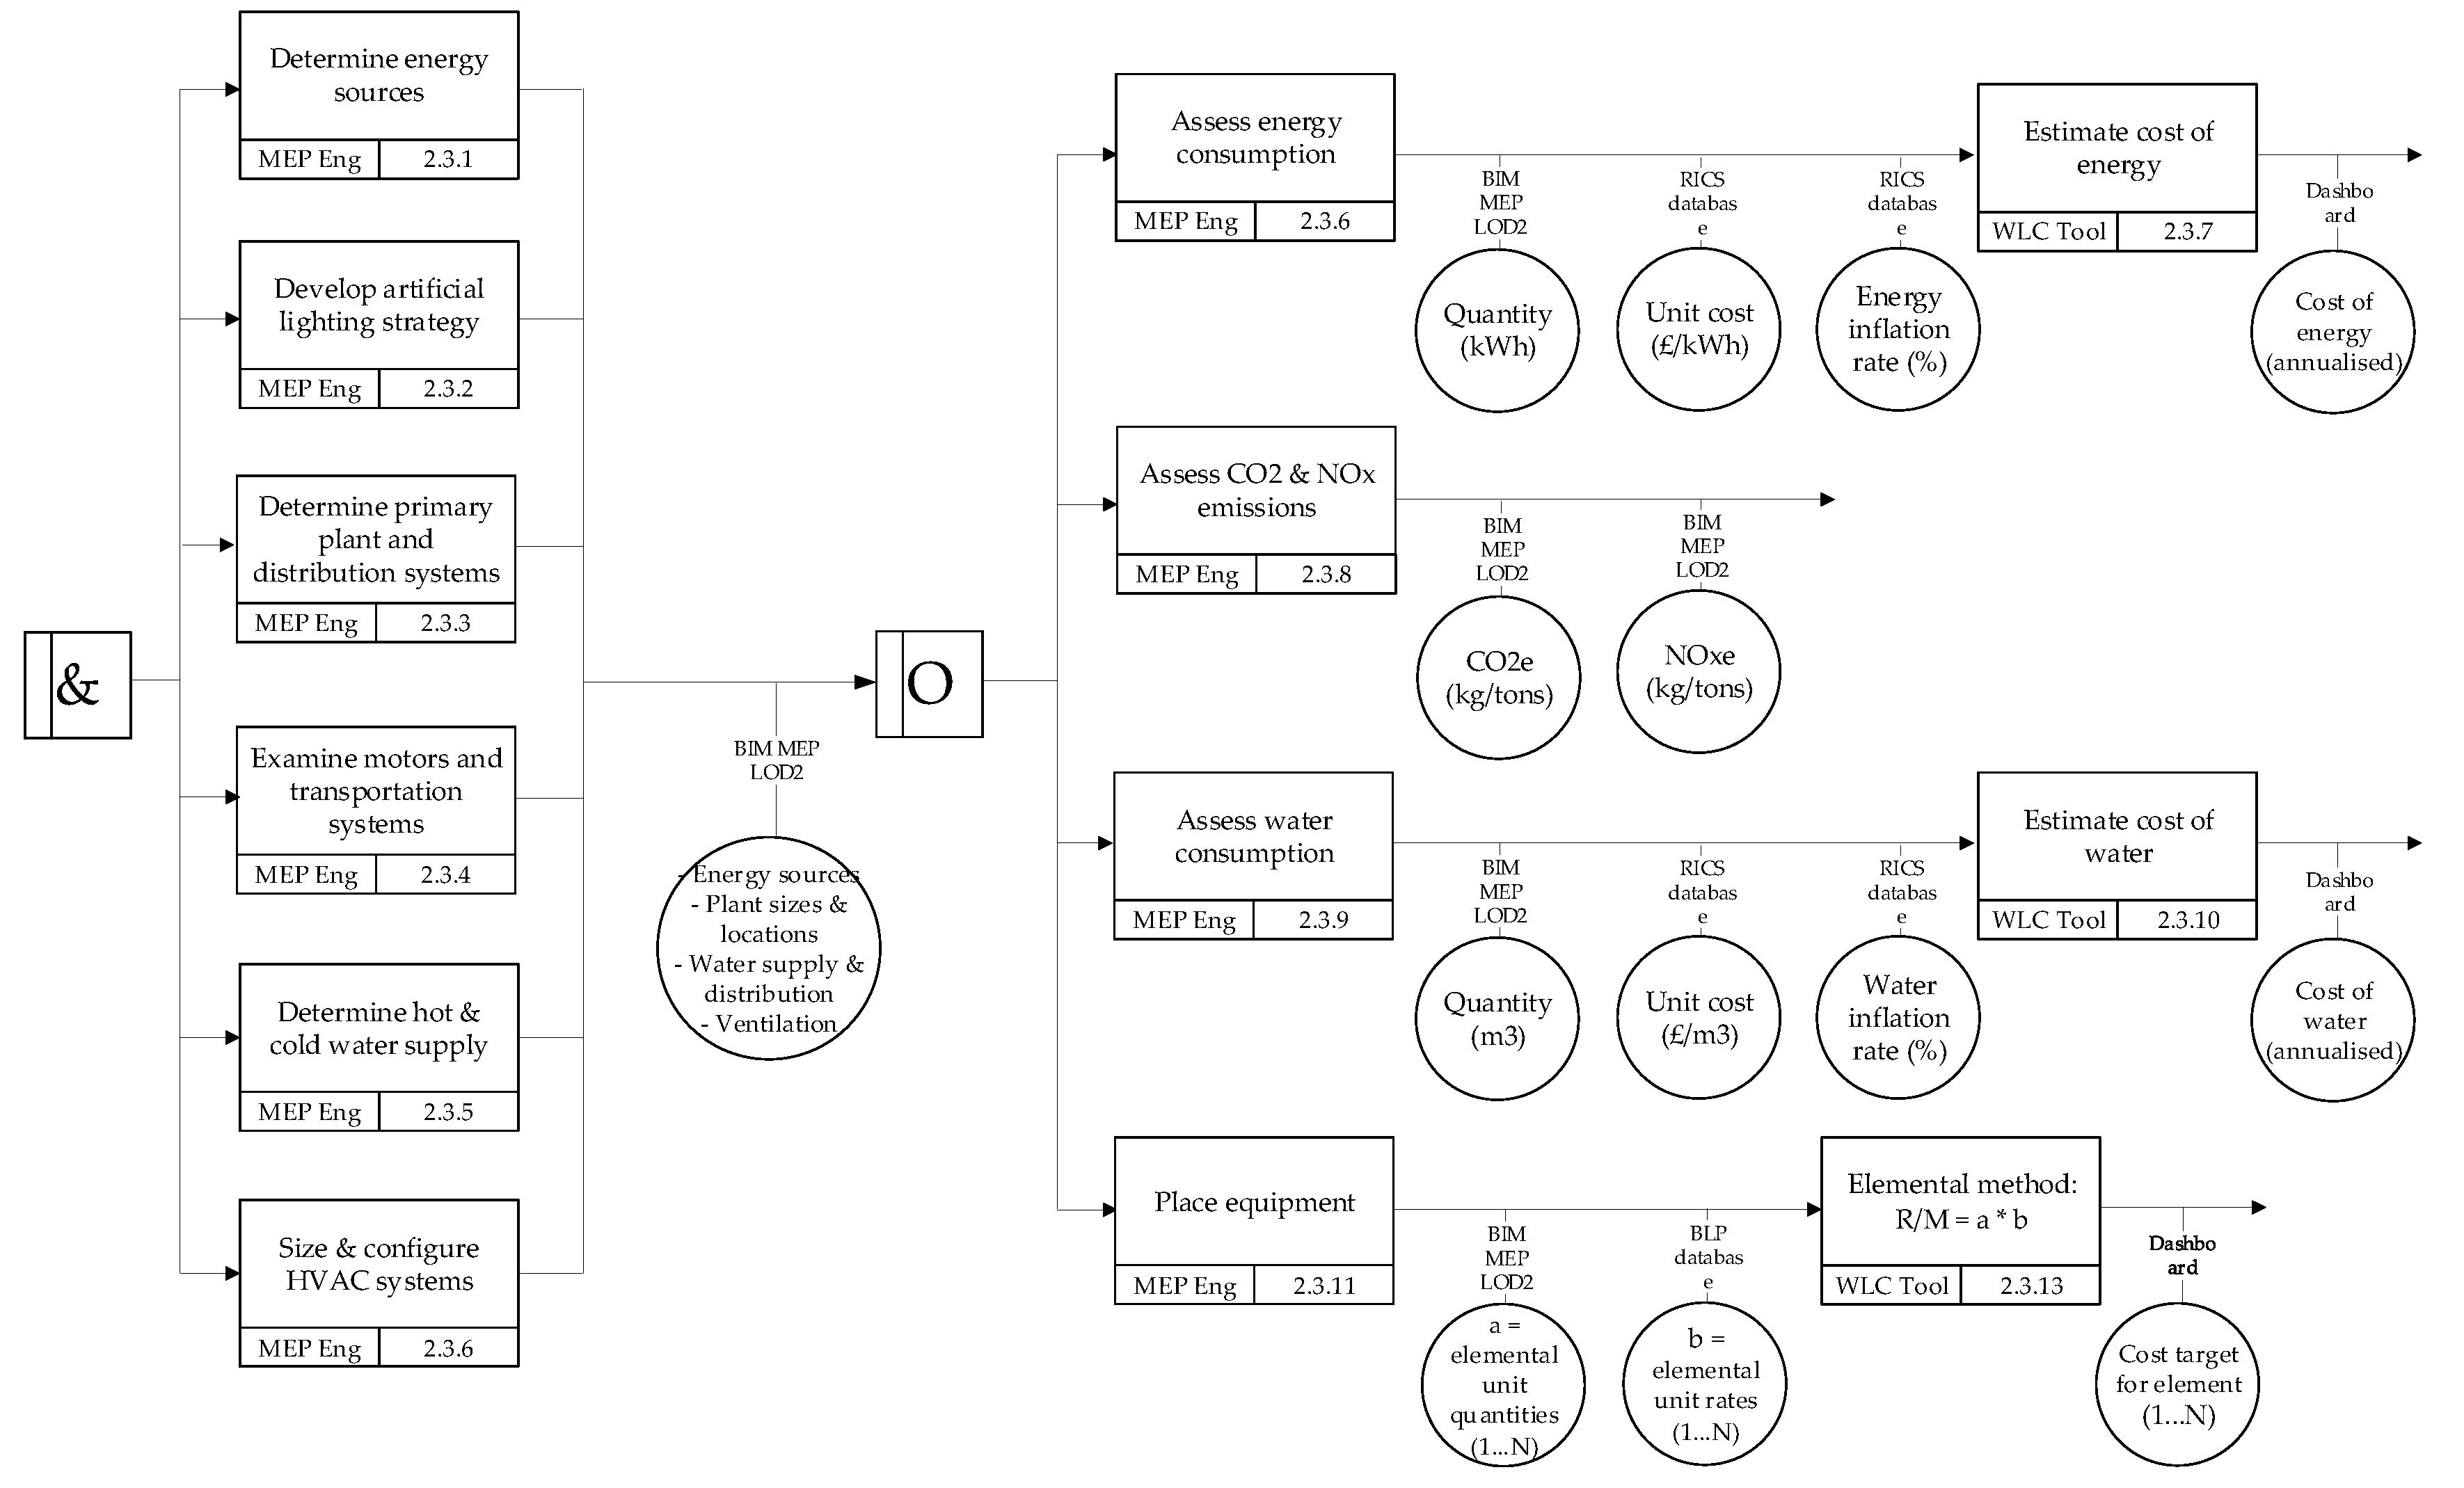
What is more, each UOB can be decomposed into subprocesses, until the tasks are delegated to a single mechanism or actor. Therefore, repetitive prescriptive tasks (such as calculations) can be automated, while the ones that require critical thinking are delegated to humans. This method results in a sociotechnical system that combines descriptive with prescriptive elements into a consensus model [93]. Figure 5 shows the (Level 2) IDEF3 decomposition of UOB 2.0 “Concept design” along with the inputs and outputs of each function. Figure 6 illustrates an example of a detailed (Level 3) IDEF3 decomposition of UOB 2.3 “Mechanical services”. This holistic process mapping approach brings together top-down and bottom-up considerations into a single view, making the process transparent at various hierarchical levels, hence enabling better communication amongst the design team.
3.2.3. Software Capabilities and Interoperability Workflows
Selection of the most appropriate software is extremely important in order to streamline the working process and achieve more with less effort [94]. Key requirements for software tools used by designers include ease of use, time and cost, interoperability, input, output, and accuracy [95]. Furthermore, in terms of transparency, WLC programs can be distinguished between glass box and black box ones depending on the visibility of the process [8]. Table 3 contains a comparison of the WLC assessment software tools reviewed. It has been found that, while the use of BIM for calculating CapEx has become commonplace, its potential for calculating OpEx has not yet been utilized. Some tools (CATO by Causeway, and Impact from BRE) have claimed the ability to estimate WLC, but further investigation has revealed that they implement simplistic approaches. For example, CATO has no links to databases containing cost data, whereas WLC estimation is based on a simple entry of a service life for the whole building, resulting in a high-level generic estimation. The BRE Impact cost database is static (does not get updated) and its current focus has shifted towards environmental assessment. Bionova’s One Click LCA has been found to be the most comprehensive option for WLC estimation, since it utilizes data from several cost databases that get updated on a regular basis, while also being compliant with British Standards [4]. None of the tools reviewed offers the complete solution.
Therefore, it has been inferred that the BIM-enabled estimation process is not completely automatic, as BIM-based quantity take-offs do not provide all the necessary data to create the cost estimate and a bill of quantities [96]. In fact, researchers have claimed that the bill of quantities exported from the BIM is often unreliable and inaccurate [97]. Nevertheless, a review of state-of-the-art readily available software tools, and demonstrations by their providers, has shown a fully automated process for extraction of quantities. Further research is necessary to determine the quality of information extracted, which is dependent partly on the modelling method followed, but also on technological limitations, irrespective of the modelling method used. For example, although the IFC format can cover a wide range of data, various BIM systems do not fully comply with this standard [98].
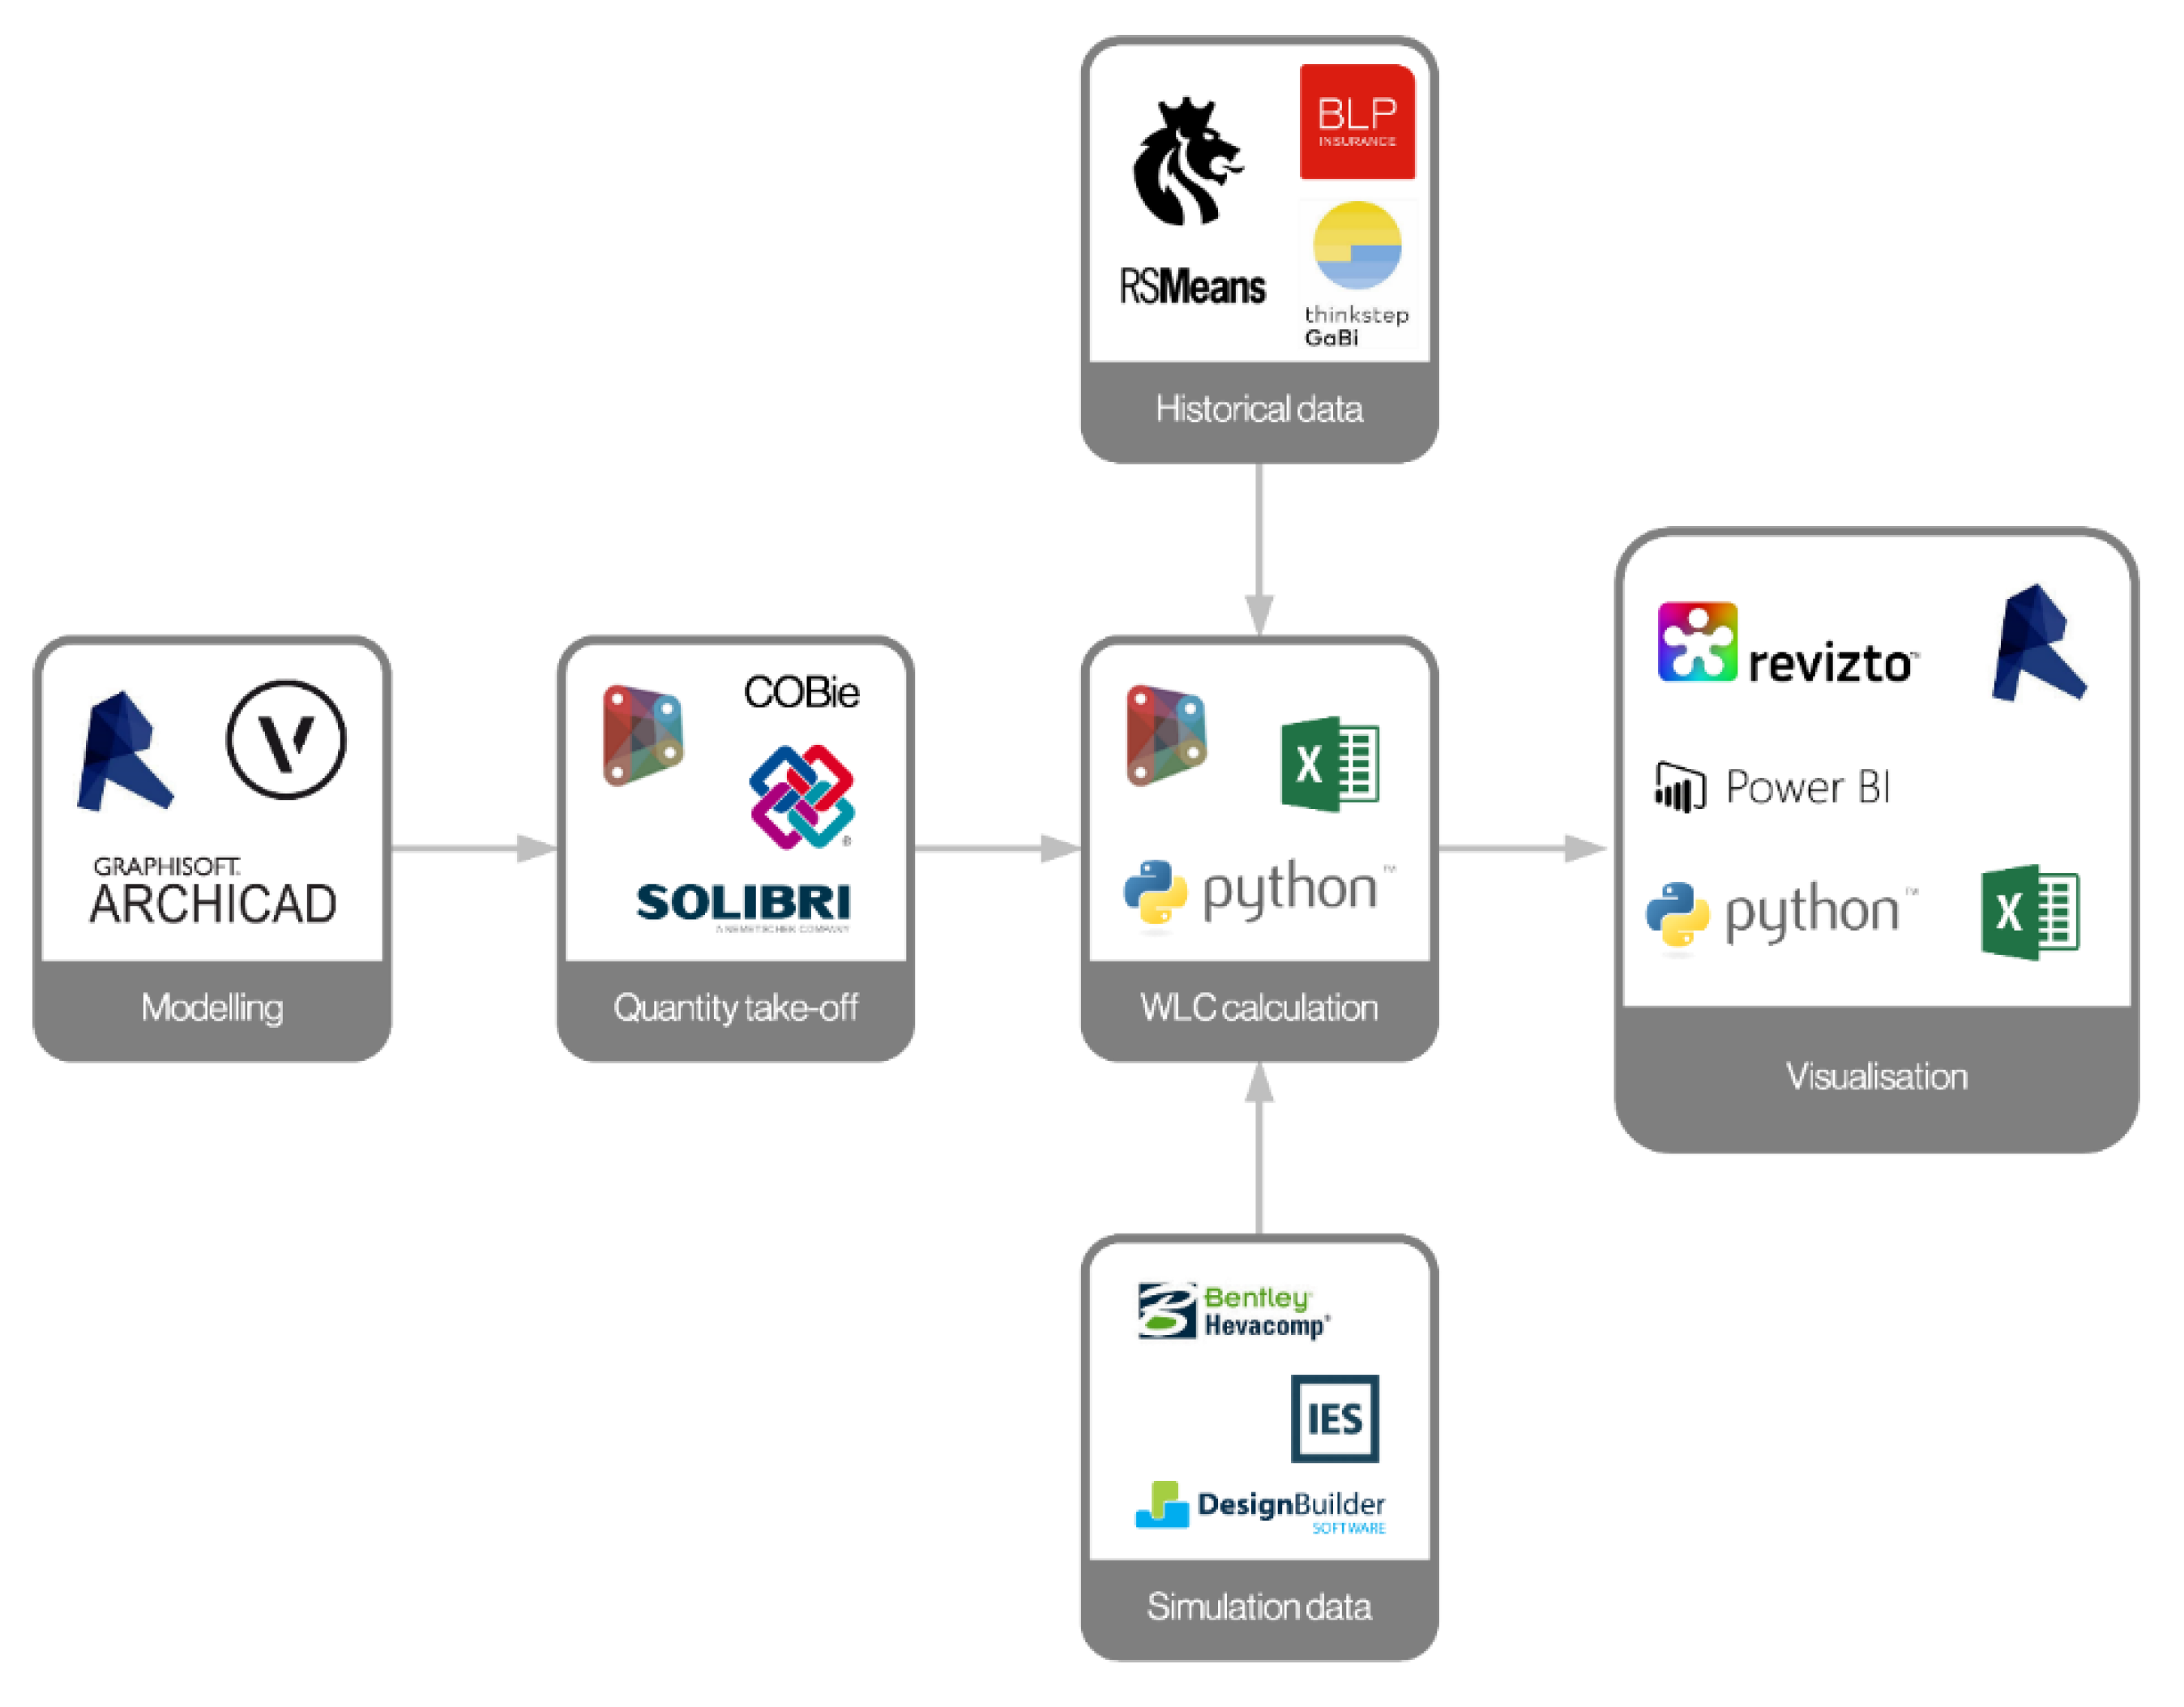
To address these issues, the research has employed a semi-automated workflow using several software applications, as shown in Figure 7:
The following Section 3.2.4 presents examples of graphical representations generated as outputs of this process and discusses design decisions that these may support.
3.2.4. Decisions Supported by WLC Assessment—Representation Methods
During development, WLC integration can assist designers in identifying optimal solutions and areas where performance may be threatened. Such decisions placed in a strategic (organizational) framework, can create added value for the asset and help to identify the most cost-effective operations and maintenance regime. Related research efforts have attempted to integrate aspects of WLC within BIM processes by linking CapEx assessment to design development [103,104], while others have focused on environmental aspects [73,105,106]. Studies that aimed to integrate WLC with BIM have resulted in solutions that are not comprehensive [16], or require manual inputting of cost data [107]. A CE process enables decision-making to be integrated within the design development process, creating soft-gates between hard-gates (design stages) during phase-gate review. Following this principle, conflicts are highlighted, compared to the initial plan, and thus resolved in a timely manner. Several standards describe the types of decisions that may be informed by WLC analysis [4,108,109].
Recent research [110] has shown that visualization of WLC estimations has a significant effect on the quality of the final design. The significant improvements to design efficiency and solution quality, resulting from dynamic performance feedback, demonstrate the value of WLC tools in improving design decision-making. Additionally, the substantial differences in designer performance (based on the type and number of visualization tools provided) have demonstrated the importance of representation of WLC information and calculations (ibid.). WLC analyses graphs may be presented for various scales: (i) single element, (ii) comparison of alternative components, (iii) single asset, (iv) multiple assets (benchmarking buildings of similar type). Figure 8 shows a comparative analysis of four window types (i.e., softwood timber, hardwood timber, PVC, and aluminum frame). Figure 9 illustrates a detailed WLC estimation of a complete BTR building. The elemental breakdown reveals the types of components that have the most significant effect on WLC for a specified period of analysis.
The study revealed several issues that hinder the use of BIM for a whole-of-life approach:
- Misalignment of coding systems for identification and classification of components at various levels of development;
- Models delivered by project team members containing insufficient or unproperly structured information;
- Technological capabilities of software limit the integration of WLC information into BIM models;
- Availability, accuracy, reliability of cost and performance data as well as accessibility and structure of available data;
- Skills and involvement of design team members and facilities managers (e.g., lack of experience to interrogate the quantities/assessments produced);
- Procurement strategies focused on CapEx instead of OpEx;
- Proprietary ownership of data as commercial IP.
4. Conclusions
This section reviews this research study and provides a synopsis of the investigation by drawing together the main conclusions from each of the previous sections of the paper. It summarizes the lessons learnt during this research along with implications of the project’s outcomes for WLC estimation through BIM. Moreover, it discusses the limitations of the study and suggests recommendations for future work.
4.1. Key Findings
This paper discusses the need for WLC estimation from the early stages as an integral part of design development. The findings provide a strong empirical confirmation that defining information requirement granularity, while considering trade-off relationships between economic and environmental factors, streamlines the design development process, and enables safe decision-making. Additionally, BIM technological enablers offer the opportunity to facilitate a more standardized process but the lack of common methodologies for WLC assessment hinder its implementation.
This project focused on the BTR sector, aiming to mitigate risks and ensure viability of such developments. Its aim was to develop a novel methodology for WLC estimation so as to minimize rework and delays during project delivery. To achieve this goal, this research followed a mixed method approach for standardization and automation of a systematic procedure. Interviews, workshops, and the IDEF3 structured diagramming technique were utilized to identify value-adding tasks and coordinate them into a holistic process. Triangulation of qualitative and quantitative methods served to increase the validity and reliability of the data collected.
As a result, this study specified the scope of WLC considerations, and identified drivers and intricacies of the BTR sector along with factors affecting performance. These considerations were linked to a graphical BIM model (for both functional units and building components), using Uniclass classifications and aligning these to NRM codes, used for reporting. Open exchange formats assisted quantity take-off, although information loss hindered interoperability. Therefore, Dynamo scripts supplemented the extraction of quantities from the authoring tool (Revit).
Calculations were performed with several variables (i.e., period of analysis, intervals between maintenance activities, and unit rates for work to be done) using data from historical databases (e.g., RICS Building Running Costs Online service). Nevertheless, re-structuring of available WLC performance data was required. Finally, representations were developed for various building scales, from single component to complete asset.
The developed process model can be used for BIM execution planning that promotes communication amongst the project team, and thus, improves organization of BIM implementation focusing on tasks and deliverables required to achieve a common goal. Furthermore, automation of repetitive tasks accelerates WLC calculations and visualization of results, minimizing the effort involved.
The research findings support the idea that BIM technologies can assist in the accurate estimation of WLC of an asset, from the early design stages, through the implementation of standardized information exchange procedures as it enables a more holistic approach to what is currently a fragmented development system. It can therefore be assumed that, for BTR, repeatable tasks and similar workflow patterns, roles and responsibilities can be identified. This finding enables the development of a systematic approach for BIM-enabled WLC assessment, based on CE principles [88], which would potentially include access to live data streams from completed buildings. This approach would allow lessons learnt from operation to be incorporated in the design of future buildings and to (i) identify and (ii) bridge the design/operating performance gap by providing the feedback loop that is so lacking at present. Thus, it is argued that BIM processes have the potential to optimize performance of all design and construction stages, and during post-occupancy, closing the loop of the building design delivery, reducing performance gaps, and achieving the triple-bottom-line goals of sustainability. Despite the potential, there remain many challenges to be faced before accomplishing fully automated, integrated, and interoperable data, as described by the Level 3 BIM maturity definition.
4.2. Next Steps
Further work needs to be done to establish the effectiveness of the developed process. The next step is to test this concept through the design of a BTR project (or several PRS projects at different design stages) in order to inform and refine the initial model. Moreover, Building Performance Evaluation data will supplement the validation of the process model by identifying gaps between actual and predicted performance, and more importantly the reasons that cause them. For that purpose, both qualitative and quantitative data need to be collected so as to triangulate the research findings. More research is also required to determine:
- Granularity of information that is possible and efficient to be incorporated into the BIM model;
- Criticality and interdependencies of design decisions, prioritization of design criteria, and trade-offs between design parameters;
- Tolerances that can be estimated and attributed to BIM components in order to reflect the level of uncertainty of performance and cost predictions;
- Ways to analyze and visualize WLC assessment results into simpler representations so that they can be used by the design team to set performance targets and inform decision-making during design development.
Author Contributions
Conceptualization, J.P., T.S., and M.Z.; methodology, M.Z., T.S., and P.L.; software, P.L.; validation, T.S., P.L., and J.P.; formal analysis, M.Z.; investigation, M.Z.; resources, J.P., T.S., L.A.; data curation, M.Z.; writing—original draft preparation, M.Z.; writing—review and editing, M.Z., T.S., and L.A.; visualization, M.Z.; supervision, T.S., L.A., and P.L.; project administration, L.A., M.Z., P.L., and T.S.; funding acquisition, J.P., T.S., and L.A.
Funding
We would like to acknowledge the support received from Innovate UK for Knowledge Transfer Partnership funding.
Conflicts of Interest
There is no conflict of interest.
References
- HM Government, Cabinet Office. Government Construction Strategy, May 2011. Available online: https://www.gov.uk/government/publications/government-construction-strategy (accessed on 1 May 2019).
- HM Government. Construction 2025: Strategy. Available online: https://www.gov.uk/government/publications/construction-2025-strategy (accessed on 1 May 2019).
- Farmer, M. Construction labour market in the UK: Farmer review; 2016. Available online: https://www.gov.uk/government/publications/construction-labour-market-in-the-uk-farmer-review (accessed on 1 May 2019).
- BSI (British Standards Institution). BS ISO 15686-5:2017 Buildings and Constructed Assets—Service-Life Planning. Part 5: Life-Cycle Costing. 2017. Available online: https://www.iso.org/obp/ui/#iso:std:iso:15686:-5:ed-2:v1:en (accessed on 1 May 2019).
- White, G.; Boyne, P. Facilities Management. In BIM and Quantity Surveying; Routledge: Abingdon, UK, 2016. [Google Scholar]
- BSRIA. BG 64/2016—Building Performance Evaluation in Domestic Buildings—A BSRIA Guide; BSRIA: Bracknell, UK, 2016. [Google Scholar]
- Sharpe, T.; McGill, G.; Gupta, R.; Gregg, M.; Mawditt, I. Characteristics and Performance of MVHR Systems—A Meta Study of MVHR Systems Used in the Innovate UK Building Performance Evaluation Programme. 2016. Available online: https://core.ac.uk/download/pdf/11340358.pdf (accessed on 1 May 2019).
- RICS. RICS Professional Guidance: Life Cycle Costing, 1st ed.; RICS: London, UK, 2016. [Google Scholar]
- Sharpe, T.; Porteous, C.; Shearer, D.; Foster, J. An Assessment of Environmental Conditions in Bedrooms of Contemporary Low Energy Houses in Scotland. Indoor Built Environ. 2014, 23. [Google Scholar] [CrossRef]
- Howieson, S.G.; Sharpe, T.; Farren, P. Building Tight—Ventilating Right? How Are New Air Tightness Standards Affecting Indoor Air Quality in Dwellings? Build. Serv. Eng. Res. Technol. 2014, 35. [Google Scholar] [CrossRef]
- Zanni, M.A. Communication of Sustainability Information and Assessment within BIM-Enabled Collaborative Environment. Ph.D. Thesis, Loughborough University, Loughborough, UK, 2017. [Google Scholar]
- Zanni, M.A.; Soetanto, R.; Ruikar, K. Towards a BIM-Enabled Sustainable Building Design Process: Roles, Responsibilities, and Requirements. Archit. Eng. Des. Manag. 2017, 13, 101–129. [Google Scholar] [CrossRef]
- Saxon, R. BIM for Construction Clients: Driving Strategic Value through Digital Information Management; National Building Specification Ltd. RIBA Enterprises: London, UK, 2016. [Google Scholar]
- Eastman, C.C.; Teicholz, P.; Sacks, R.; Liston, K. BIM Handbook: A Guide to Building Information Modeling for Owners, Managers, Designers, Engineers and Contractors, 2nd ed.; John Wiley & Sons: Hoboken, NJ, USA, 2011. [Google Scholar]
- Dti. Avanti—Report from the Construction Research Programme—Project Showcase. Available online: http://www.cpic.org.uk/publications/avanti/ (accessed on 1 May 2019).
- Dawood, S.; Lord, R.; Dawood, N. Development of a Visual Whole Life-Cycle Energy Assessment Framework for Built Environment. In Proceedings of the Winter Simulation Conference, Austin, TX, USA, 13–16 December 2009; pp. 2653–2663. [Google Scholar]
- Krigsvoll, G. Life Cycle Costing as Part of Decision Making-Use of Building Information Models. In Proceedings of the SB07 Lisbon—Sustainable Construction, Materials and Practices: Challenge of the Industry for the New Millenium, Lisbon, Portugal, 12–14 September 2007; pp. 433–440. [Google Scholar]
- Kamara, J.M.; Cutting-Decelle, A.-F.; Anumba, C. Concurrent Engineering in Construction Projects; Routledge: Abingdon, UK, 2006. [Google Scholar]
- Evbuomwan, N.F.O.; Anumba, C.J. An Integrated Framework for Concurrent Life-Cycle Design and Construction. Adv. Eng. Softw. 1998, 29, 587–597. [Google Scholar] [CrossRef]
- Anumba, C.J.; Baugh, C.; Khalfan, M.M.A. Organisational Structures to Support Concurrent Engineering in Construction. Ind. Manag. Data Syst. 2002, 102, 260–270. [Google Scholar] [CrossRef]
- De la Garza, J.M.; Alcantara, P., Jr.; Kapoor, M.; Ramesh, P.S. Value of Concurrent Engineering for A/E/C Industry. J. Manag. Eng. 1994, 10, 46–55. [Google Scholar] [CrossRef]
- Gunasekaran, A.; Love, P.E.D. Concurrent Engineering: A Multi-Disciplinary Approach for Construction. Logist. Inf. Manag. 1998, 11, 295–300. [Google Scholar] [CrossRef]
- Mayer, R.J. IDEF Family of Methods for Concurrent Engineering and Business Re-Engineering Applications; Knowledge Based Systems: College Station, TX, USA, 1992. [Google Scholar]
- Hassan, T.M. Simulating Information Flow to Assist Building Design Management. Ph.D. Thesis, Loughborough University, Loughborough, UK, 1996. [Google Scholar]
- Matipa, W.M.; Kelliher, D.; Keane, M. How a Quantity Surveyor Can Ease Cost Management at the Design Stage Using a Building Product Model. Constr. Innov. 2008, 8, 164–181. [Google Scholar] [CrossRef]
- CBPP. Introduction to Whole Life Costing—Fact Sheets; Construction Best Practice Programme, Department of the Environment, Transport and the Regions (DETR): London, UK, 1998. [Google Scholar]
- BSI. BS/ISO 15686-5: 2008 Buildings and Constructed Assets. Service Life Planning. Life Cycle Costing. 2008. Available online: https://www.iso.org/standard/39843.html (accessed on 10 October 2016).
- Urban Land Institute (ULI). Build to Rent Best Practice Guide, 2nd ed.; ULI UK Residential Council: London, UK, 2016. [Google Scholar]
- Mayor of London. Homes for Londoners: Affordable Housing and Viability Supplementary Planning Guidance 2017; 2017. Available online: https://www.london.gov.uk/what-we-do/planning/implementing-london-plan/planning-guidance-and-practice-notes/affordable-housing-and-viability-supplementary-planning-guidance-spg (accessed on 1 May 2019).
- Mayer, R.J.; Menzel, C.P.; Painter, M.K.; Dewitte, P.S.; Blinn, T.; Perakath, B. Information Integration for Concurrent Engineering (IICE)—IDEF3 Process Description Capture Method Report; DTIC Document, No. KBSI-IICE-90-STR-01-0592-02; Knowledge Based Systems Inc.: College Station, TX, USA, 1995. [Google Scholar]
- Flowers, P. Research Philosophies–Importance and Relevance. Research Leading Learning and Change-Cranfield School of Management, 1, 2009. [Google Scholar]
- Tashakkori, A.; Teddlie, C. Sage Handbook of Mixed Methods in Social & Behavioral Research; SAGE: Los Angeles, CA, USA; London, UK; New Delhi, India; Singapore; Washington, DC, USA; Melbourne, Australia, 2010. [Google Scholar]
- Creswell, J.W.; Clark, V.L.P. Designing and Conducting Mixed Methods Research; Wiley Online Library: Hoboken, NJ, USA, 2007. [Google Scholar]
- Creswell, J.W. Research Design: Qualitative, Quantitative, and Mixed Methods Approaches; Sage: Newcastle upon Tyne, UK, 2009. [Google Scholar]
- Dubois, A.; Gadde, L.-E. Systematic Combining: An Abductive Approach to Case Research. J. Bus. Res. 2002, 55, 553–560. [Google Scholar] [CrossRef]
- Reichertz, J. 4.3 Abduction, Deduction and Induction in Qualitative Research. A Companion to Qualitative Research. 2014, pp. 159–164. Available online: https://pdfs.semanticscholar.org/749f/cb02c73b6a5a54fbda02583d154716baba89.pdf (accessed on 1 May 2019).
- Yin, R. Case Study Research: Design and Methods; SAGE Publications: Newcastle upon Tyne, UK, 2013. [Google Scholar]
- Johnson, R.; Onwuegbuzie, A. Mixed Methods Research: A Research Paradigm Whose Time Has Come. Educ. Res. 2004, 33, 14–26. [Google Scholar] [CrossRef]
- Bryman, A. Integrating Quantitative and Qualitative Research: How Is It Done? Qual. Res. 2006, 6, 97–113. [Google Scholar] [CrossRef]
- Amaratunga, D.; Baldry, D.; Sarshar, M.; Newton, R. Quantitative and Qualitative Research in the Built Environment: Application of “Mixed” Research Approach. Work Study 2002, 51, 17–31. [Google Scholar] [CrossRef]
- Braun, V.; Clarke, V. Using Thematic Analysis in Psychology. Qual. Res. Psychol. 2006, 3, 77–101. [Google Scholar] [CrossRef]
- Joffe, H. Thematic Analysis. In Qualitative Research Methods in Mental Health and Psychotherapy: A Guide for Students and Practitioners; Wiley: Hoboken, NJ, USA, 2012. [Google Scholar]
- Krippendorff, K. Content Analysis: An Introduction to Its Methodology; Sage Publications, Inc.: London, UK, 2012. [Google Scholar]
- Cavanagh, S. Content Analysis: Concepts, Methods and Applications. Nurse Res. 1997. [Google Scholar] [CrossRef]
- Axinn, W.G.; Pearce, L.D. Mixed Method Data Collection Strategies; Cambridge University Press: Cambridge, UK, 2006. [Google Scholar]
- Anumba, C.J.; Evbuomwan, N.F.O. Concurrent Engineering in Design-Build Projects. Constr. Manag. Econ. 1997, 15, 271–281. [Google Scholar] [CrossRef]
- Ruikar, K.; Anumba, C.J.J.; Carrillo, P.M.M. Reengineering Construction Business Processes through Electronic Commerce. TQM Mag. 2003, 15, 197–212. [Google Scholar] [CrossRef]
- Klein, G.A.; Calderwood, R.; Macgregor, D. Critical Decision Method for Eliciting Knowledge. IEEE Trans. Syst. Man Cybern. 1989, 19, 462–472. [Google Scholar] [CrossRef]
- Dorador, J.M.; Young, R.I.M. Application of IDEF0, IDEF3 and UML Methodologies in the Creation of Information Models. Int. J. Comput. Integr. Manuf. 2000, 13, 430–445. [Google Scholar] [CrossRef]
- Crisp, R.; Eadson, W.; While, A. Tackling Poverty through Housing and Planning Policy in City Regions. 2016. Available online: https://www.jrf.org.uk/report/tackling-poverty-through-housing-and-planning-policy-city-regions (accessed on 1 May 2019).
- Department for Communities and Local Government. Collection—Housing White Paper; 2017. Available online: https://www.gov.uk/government/collections/housing-white-paper (accessed on 1 May 2019).
- Parn, E.; Mayouf, M.; Laycock, P.; Edwards, D.J. Building Information Modelling (BIM) for UK Housing: Exploring Potential Drivers and Opportunities to Deliver Better Customer Experience. Mindanao J. Sci. Technol. 2015, 13, 51–64. [Google Scholar]
- British Standards Institution. Standardized Method of Life Cycle Costing for Construction Procurement: A Supplement to BS ISO 15686-5:2008 Buildings and Constructed Assets—Service Life Planning—Part 5: Life Cycle Costing; BSI: London, UK, 2008. [Google Scholar]
- NATO RTO. Code of Practice for Life Cycle Costing. 2009. Available online: http://citeseerx.ist.psu.edu/viewdoc/download?doi=10.1.1.215.1928&rep=rep1&type=pdf (accessed on 1 May 2019).
- BSI. BS EN 15643-4: 2012 Sustainability of Construction Works. Assessment of Buildings. Framework for the Assessment of Economic Performance. 2012. Available online: https://shop.bsigroup.com/ProductDetail/?pid=000000000030186110 (accessed on 1 May 2019).
- International Organization for Standardization. ISO 14040:2006 Preview Environmental Management—Life Cycle Assessment—Principles and Framework. 2006. Available online: https://www.iso.org/standard/37456.html (accessed on 1 May 2019).
- International Organization for Standardization. ISO 14044:2006 Preview Environmental Management—Life Cycle Assessment—Requirements and Guidelines. 2006. Available online: https://www.iso.org/standard/38498.html (accessed on 1 May 2019).
- Sturgis, S. Targeting Zero: Embodied and Whole Life Carbon Explained; RIBA Publishing: London, UK, 2017. [Google Scholar]
- BRE. What Is BREEAM? Available online: http://www.breeam.org/about.jsp?id=66 (accessed on 10 October 2017).
- U.S. Green Building Council U.S.G.B. Leadership in Energy and Environmental Design. Available online: https://new.usgbc.org/leed (accessed on 1 May 2019).
- Opoku, A. The Application of Whole Life Costing in the UK Construction Industry: Benefits and Barriers. Int. J. Archit. Eng. Constr. 2013, 2, 35–42. [Google Scholar] [CrossRef]
- National Institute of Building Sciences. Whole Building Design|WBDG Whole Building Design Guide. Available online: https://www.wbdg.org/resources/whole-building-design (accessed on 6 February 2018).
- US Department of Commerce. Handbook 135, the Life Cycle Costing Manual for Federal Energy Management Program; 1996. Available online: https://www.wbdg.org/FFC/NIST/hdbk_135.pdf (accessed on 1 May 2019).
- BSI. BS ISO 15686-1:2011—Buildings and Constructed Assets. Service Life Planning. General Principles and Framework. 2011. Available online: https://shop.bsigroup.com/ProductDetail/?pid=000000000030172556 (accessed on 1 May 2019).
- BSI ISO. BS ISO 15686-4—Building Construction—Service Life Planning—Part 4: Service Life Planning Using Building Information Modelling. 2014. Available online: https://www.iso.org/standard/59150.html (accessed on 1 May 2019).
- BSI ISO. BS ISO 15686-8:2008—Buildings and Constructed Assets—Service Life Planning. Part 8: Reference Service Life and Service-Life Estimation. 2008. Available online: https://shop.bsigroup.com/ProductDetail/?pid=000000000030084862 (accessed on 1 May 2019).
- Chartered Institution of Building Services Engineers; Harris, J.; Craig, B. GVM/14 CIBSE Guide M: Maintenance Engineering and Management: A Guide for Designers, Maintainers, Building Owners and Operators, and Facilities Managers, 2nd ed.; CIBSE: London, UK, 2014. [Google Scholar]
- RICS. Cost Analysis and Benchmarking, RICS Guidance Note 86/2011; RICS: London, UK, 2011. [Google Scholar]
- BCIS. BCIS Elemental Standard Form of Cost Analysis, 4th ed.; RICS: London, UK, 2012. [Google Scholar]
- Green, A.; Benge, D.P.; Royal Institution of Chartered Surveyors. RICS New Rules of Measurement. NRM 3, Order of Cost Estimating and Cost Planning for Building Maintenance Works. 2014. Available online: https://www.rics.org/uk/upholding-professional-standards/sector-standards/construction/rics-nrm-new-rules-of-measurement/ (accessed on 1 May 2019).
- Pittard, S.; Sell, P. BIM and Quantity Surveying; Routledge: Abingdon, UK, 2016. [Google Scholar]
- Fu, C.; Kaya, S.; Kagioglou, G.; Aouad, M. The Development of an IFC-based Lifecycle Costing Prototype Tool for Building Construction and Maintenance. Constr. Innov. 2007, 7, 85–98. [Google Scholar] [CrossRef]
- Kulahcioglu, T.; Dang, J.; Toklu, C. A 3D Analyzer for BIM-Enabled Life Cycle Assessment of the Whole Process of Construction. HVAC R Res. 2012, 18, 283–293. [Google Scholar] [CrossRef]
- RICS. Building Running Costs Online. Available online: https://www.rics.org/uk/products/data-products/facilities-management/building-running-costs-online/ (accessed on 1 May 2019).
- Succar, B.; Sher, W.; Williams, A. Measuring BIM Performance: Five Metrics. Archit. Eng. Des. Manag. 2012, 8, 120–142. [Google Scholar] [CrossRef]
- Dave, B.; Koskela, L.; Kiviniemi, A.; Tzortzopoulos, P.; Owen, R. Implementing Lean in Construction: Lean Construction and BIM; CIRIA: London, UK, 2013; Volume C725. [Google Scholar]
- Goldschmidt, G. Linkography: Unfolding the Design Process; The MIT Press: Cambridge, MA, USA; London, UK, 2014. [Google Scholar] [CrossRef]
- Aouad, G.; Hinks, J.; Cooper, R.; Sheat, D.; Kagioglou, M.; Sexton, M. Map for a Generic Design and Construction Process Protocol. J. Constr. Procure. 1998. [Google Scholar]
- Kagioglou, M.; Cooper, R.; Aouad, G.; Hinks, J. Final Report: Generic Design and Construction Process Protocol; Univ. Salford: Salford, UK, 1998. [Google Scholar]
- Cooper, R.; Aouad, G.; Lee, A.; Wu, S.; Fleming, A.; Kagioglou, M. Process Management in Design and Construction; Wiley-Blackwell: Hoboken, NJ, USA, 2008. [Google Scholar]
- NBIMS. National Building Information Modelling Standard; National Institute of Building Science: Washington, DC, USA, 2007. [Google Scholar]
- Succar, B. Building Information Modelling Framework: A Research and Delivery Foundation for Industry Stakeholders. Autom. Constr. 2009, 18, 357–375. [Google Scholar] [CrossRef]
- Race, S. Bim Demystified; RIBA Enterprises: London, UK, 2012. [Google Scholar]
- Sinclair, D. Assembling a Collaborative Project Team: Practical Tools Including Multidisciplinary Schedules of Services; RIBA Publishing: London, UK, 2013. [Google Scholar]
- CIC. BIM Project Execution Planning Guide Version 2.1; CIC Research Group: San Diego, CA, USA; Pennsylvania State University: State College, PA, USA, 2011. [Google Scholar]
- NBS. Uniclass 2015—A Universal Classification System for the Construction Industry|NBS. Available online: https://www.thenbs.com/news/uniclass-2015-a-universal-classification-system-for-the-construction-industry (accessed on 5 February 2018).
- SFG20. Welcome to SFG20. Available online: http://www.sfg20.co.uk/ (accessed on 7 February 2018).
- Love, P.E.D.; Gunasekaran, A. Concurrent Engineering in the Construction Industry. Concurr. Eng. 1997, 5, 155–162. [Google Scholar] [CrossRef]
- BSI. PAS 1192-2:2013—Specification for Information Management for the Capital/Delivery Phase of Construction Projects Using Building Information Modelling; CIC: London, UK, 2013; Available online: http://shop.bsigroup.com/Navigate-by/PAS/PAS-1192-22013/ (accessed on 5 February 2017).
- BSI. BSI Standards Publication Transition Guidance to BS EN ISO 19650. 2019. Available online: https://shop.bsigroup.com/ProductDetail/?pid=000000000030380842 (accessed on 1 May 2019).
- RIBA. RIBA Plan of Work 2013. Available online: http://www.ribaplanofwork.com/ (accessed on 1 May 2019).
- NBS. NBS BIM Toolkit—Free to Use BIM Level 2 Resource. Available online: https://toolkit.thenbs.com/ (accessed on 5 February 2018).
- Steele, J. The Interdisciplinary Conceptual Design of Buildings. Ph.D. Thesis, Loughborough University, Loughborough, UK, 2000. [Google Scholar]
- Smith, D.K.; Tardif, M. Building Information Modeling: A Strategic Implementation Guide for Architects, Engineers, Constructors, and Real Estate Asset Managers; Tardif, M., Ed.; Wiley: Hoboken, NJ, USA, 2012. [Google Scholar]
- AIA. An Architect’s Guide to Integrating Energy Modelling in the Design Process; The American Institute of Architects: Washington, DC, USA, 2012. [Google Scholar]
- Monteiro, A.; Martins, J.P. A Survey on Modeling Guidelines for Quantity Takeoff-Oriented BIM-Based Design. Autom. Constr. 2013, 35, 238–253. [Google Scholar] [CrossRef]
- Aibinu, A.; Venkatesh, S. Status of BIM Adoption and the BIM Experience of Cost Consultants in Australia. J. Prof. Issues Eng. Educ. Pract. 2014, 140, 04013021. [Google Scholar] [CrossRef]
- Kogut, P.; Tomana, A. 4D and 5D Applications in BIM Technology. CMM-2013–Computer Methods in Mechanic, Poznan, Poland, 27–31 August 2013. Available online: https://bimestimate.eu/wp-content/uploads/2015/05/Referat-A.Tomana-P.Kogut-ENG.pdf (accessed on 1 May 2019).
- Autodesk. Revit BIM Software. Available online: https://www.autodesk.co.uk/products/revit/overview (accessed on 1 May 2019).
- Autodesk. Dynamo Studio Computational BIM Design Software. Available online: https://www.autodesk.com/products/dynamo-studio/overview (accessed on 1 May 2019).
- Nemetschek. Solibri Model Checker. Available online: https://www.solibri.com/ (accessed on 1 May 2019).
- Microsoft. Power BI. Available online: https://powerbi.microsoft.com/en-us/ (accessed on 1 May 2019).
- Sabol, L. Challenges in Cost Estimating with Building Information Modeling; IFMA World Workplace, 2008; pp. 1–16. [Google Scholar]
- Cheung, F.K.T.; Rihan, J.; Tah, J.; Duce, D.; Kurul, E. Early Stage Multi-Level Cost Estimation for Schematic BIM Models. Autom. Constr. 2012, 27, 67–77. [Google Scholar] [CrossRef]
- Basbagill, J.; Flager, F.; Lepech, M.; Fischer, M. Application of Life-Cycle Assessment to Early Stage Building Design for Reduced Embodied Environmental Impacts. Build. Environ. 2013, 60, 81–92. [Google Scholar] [CrossRef]
- Wang, W.; Zmeureanu, R.; Rivard, H. Applying Multi-Objective Genetic Algorithms in Green Building Design Optimization. Build. Environ. 2005, 40, 1512–1525. [Google Scholar] [CrossRef]
- Kehily, D.; Underwood, J. Embedding Life Cycle Costing in 5D BIM. J. Inf. Technol. Constr. 2017, 22, 145–167. [Google Scholar]
- Fuller, S.; Boyles, A.; Miller, B.R. BLCC-NIST Building Life-Cycle Cost Program, Version 5.0. Available online: https://www.nist.gov/publications/blcc-nist-building-life-cycle-cost-program-version-50 (accessed on 6 May 2018).
- US Office of Energy Efficiency & Renewable Energy. Building Life Cycle Cost Programs. Available online: https://www.energy.gov/eere/femp/building-life-cycle-cost-programs (accessed on 10 April 2017).
- Basbagill, J.P.; Flager, F.; Lepech, M. Measuring the Impact of Dynamic Life Cycle Performance Feedback on Conceptual Building Design. J. Clean. Prod. 2017, 164, 726–735. [Google Scholar] [CrossRef]
Figure 1.
Research strategy and methods used.

Figure 2.
Symbols used for Integrated DEFinition 3 structured diagramming technique (IDEF3) process description schematics.
Figure 2.
Symbols used for Integrated DEFinition 3 structured diagramming technique (IDEF3) process description schematics.

Figure 3.
Model entities in a Construction Operations Building Information Exchange (COBie) object-oriented data structure.
Figure 3.
Model entities in a Construction Operations Building Information Exchange (COBie) object-oriented data structure.

Figure 4.
High-level (Level 1) IDEF3 process model (RIBA stages 1–3).

Figure 5.
Mid-level (Level 2) IDEF3 decomposition of UOB 2.0 “Concept design”.

Figure 6.
Detailed (Level 3) IDEF3 decomposition of UOB 2.3 “Mechanical services”.

Figure 7.
Semi-automated information flows between applications.

Figure 8.
Component comparison of four window types (cumulative undiscounted cost estimation).

Figure 9.
Elemental WLC breakdown of a complete BTR building over a 15-year period 3.2.5. Challenges to WLC estimation using BIM.
Figure 9.
Elemental WLC breakdown of a complete BTR building over a 15-year period 3.2.5. Challenges to WLC estimation using BIM.


Table 1.
Maintenance schedule example (source: RICS Building Running Costs Online).
| BCIS Code | Description | Activity | Time Unit | Average Usage | High Usage | Low Usage |
|---|---|---|---|---|---|---|
| 2.6.1.15 | Window size: 915 × 1200 mm high; standard hardwood horizontal bar; hermetically sealed double-glazing units; two coat stain externally; three coat oil paint internally; Thermabate cavity closer; steel wall lintel | |||||
| Asset replacement | Remove Existing and Replace with New | Year | 40 | 30 | 60 | |
| Cleaning | Clean Windows (Externally) | Week | 26 | 13 | 52 | |
| Cleaning | Clean Windows (Internally) | Week | 13 | 6 | 26 | |
| Inspection | Inspect Window | Year | 5 | 3 | 7 | |
| Planned maintenance | Lubricate and Adjust Ironmongery | Year | 2 | 1 | 3 | |
| Planned maintenance | Replace Ironmongery | Year | 10 | 7 | 13 | |
| Planned maintenance | Replace Pointing to Perimeter of Window | Year | 10 | 7 | 13 | |
| Redecoration | Redecoration: Repainting | Year | 6 | 5 | 7 | |
| Reactive maintenance | Allowance for Reactive Maintenance | Year | 5 | 3 | 7 |
Table 2.
Sub-elemental breakdown for extraction of quantities.
| NRM | Element | Uniclass Code | Uniclass Description | Unit Quantity |
|---|---|---|---|---|
| 2.6 | Windows and external doors | - | - | m2 |
| 2.6.1 | External windows | Ss_25_30 | Door and window systems | m2 |
| 2.6.1.1 | Windows: details | Pr_20_29_30_96 | Window fixing lugs | Nr |
| 2.6.1.1 | Windows: details | Pr_20_85_32_98 | Wood window sub-frames | Nr/(m2) |
| 2.6.1.1 | Windows: details | Pr_25_57_51_52 | Metallized plastics window films | Nr |
| 2.6.1.1 | Windows: details | Pr_25_57_51_60 | Plastics window films | Nr/(m2) |
| 2.6.1.1 | Windows: details | Pr_30_36_08_95 | Window casement fasteners | Nr |
| 2.6.1.1 | Windows: details | Pr_30_36_08_96 | Window latches | Nr |
| 2.6.1.1 | Windows: details | Pr_30_36_08_97 | Window locks | Nr |
| 2.6.1.1 | Windows: details | Pr_30_36_08_98 | Window sash fasteners | Nr |
| 2.6.1.1 | Windows: details | Pr_30_36_36_96 | Window hinges | Nr |
| 2.6.1.1 | Windows: details | Pr_30_36_36_67 | Projection window hinges | Nr |
| 2.6.1.1 | Windows: details | Pr_30_36_59_94 | Window casement stays | Nr |
| 2.6.1.1 | Windows: details | Pr_30_36_59_95 | Window latch and lock operating handles | Nr |
| 2.6.1.1 | Windows: details | Pr_35_90_33_22 | Door and window weatherstrips and seals | Nr |
| 2.6.1.1 | Windows: details | Pr_35_31_22 | Decorative coatings | Nr/(m2) |
Table 3.
Comparison of Whole Life Costs (WLC) estimation software tools.
| Tool | CapEx | OpEx | LCA | BIM | Location |
|---|---|---|---|---|---|
| Causeway CATO | Advanced | Basic | N/A | Advanced | UK |
| One Click LCA | Basic | Basic | Advanced | Advanced | Finland |
| BRE IMPACT | Basic | Basic | Advanced | Basic | UK |
| BLP Butterfly | Basic | Basic | Basic | UK | |
| Beck Tech Destini | Advanced | N/A | N/A | Advanced | Texas |
| Exactal CostX | Advanced | N/A | N/A | Advanced | UK |
| RICS BCIS | N/A | Advanced | N/A | N/A | UK |
| Tocoman | Advanced | N/A | N/A | Advanced | Finland |
| Trimble VICO | Advanced | N/A | N/A | Advanced | USA |
| eTool LCD | Basic | Basic | Advanced | Basic | Australia |
© 2019 by the authors. Licensee MDPI, Basel, Switzerland. This article is an open access article distributed under the terms and conditions of the Creative Commons Attribution (CC BY) license (http://creativecommons.org/licenses/by/4.0/).
Share and Cite
MDPI and ACS Style
Zanni, M.; Sharpe, T.; Lammers, P.; Arnold, L.; Pickard, J. Developing a Methodology for Integration of Whole Life Costs into BIM Processes to Assist Design Decision Making. Buildings 2019, 9, 114. https://doi.org/10.3390/buildings9050114
AMA Style
Zanni M, Sharpe T, Lammers P, Arnold L, Pickard J. Developing a Methodology for Integration of Whole Life Costs into BIM Processes to Assist Design Decision Making. Buildings. 2019; 9(5):114. https://doi.org/10.3390/buildings9050114
Chicago/Turabian StyleZanni, Mariangela, Tim Sharpe, Philipp Lammers, Leo Arnold, and James Pickard. 2019. "Developing a Methodology for Integration of Whole Life Costs into BIM Processes to Assist Design Decision Making" Buildings 9, no. 5: 114. https://doi.org/10.3390/buildings9050114
Note that from the first issue of 2016, this journal uses article numbers instead of page numbers. See further details here.