Achieving a Trade-Off Construction Solution Using BIM, an Optimization Algorithm, and a Multi-Criteria Decision-Making Method


1
Department of Forestry and Wood Technology, Linnaeus University, 351 95 Växjö, Sweden
2
Department of Civil Engineering and Energy System, Mälardalen University, 721 23 Västerås, Sweden
3
Department of Construction Engineering and Lighting Science, Jönköping University, 551 11 Jönköping, Sweden
*
Author to whom correspondence should be addressed.
Buildings 2019, 9(4), 81; https://doi.org/10.3390/buildings9040081
Submission received: 5 March 2019
/
Revised: 21 March 2019
/
Accepted: 9 April 2019
/
Published: 10 April 2019
(This article belongs to the Special Issue IT in Design, Construction, and Management)
Abstract
:The Energy Performance of Building Directive obligated all European countries to reduce the energy requirements of buildings while simultaneously improving indoor environment quality. Any such improvements not only enhance the health of the occupants and their productivity, but also provide further economic benefits at the national level. Accomplishing this task requires a method that allows building professionals to resolve conflicts between visual and thermal comfort, energy demands, and life-cycle costs. To overcome these conflicts, this study exploits the incorporation of building information modelling (BIM), the design of experiments as an optimization algorithm, and the analytical hierarchy process (AHP) into a multi-criteria decision-making method. Any such incorporation can (i) create constructive communication between building professionals, such as architects, engineers, and energy experts; (ii) allow the analysis of the performance of multiple construction solutions with respect to visual and thermal comfort, energy demand, and life-cycle costs; and (iii) help to select a trade-off solution, thereby making a suitable decision. Three types of energy-efficient windows, and five types of ground floors, roofs, and external wall constructions were considered as optimization variables. The incorporation of several methods allowed the analysis of the performance of 375 construction solutions based on a combination of optimization variables, and helped to select a trade-off solution. The results showed the strength of incorporation for analyzing big-data through the intelligent use of BIM and a simulation in the field of the built environment, energy, and costs. However, when applying AHP, the results are strongly contingent on pairwise comparisons.
1. Introduction
The Energy Performance of Building Directive (EPBD) obligated all European countries to ensure that nearly-zero-energy codes were the norm for the construction of new buildings while fulfilling the minimum indoor comfort requirements at the national level [1]. In Sweden, office buildings with a total area of 32.3 million square meters [2] were responsible for about 6.25 TWh total energy consumption in 2016, which corresponded to the second greatest share among non-residential buildings in the same year [3]. Accordingly, the construction of office buildings in Sweden has greatly contributed to a reduction in energy demands and greenhouse gases, which also provide economic benefits at the national level [4].
In addition, former studies show that improving indoor environmental quality, including visual and thermal comfort, contributes to a higher level of productivity and enhanced health [5,6], and thereby is conducive to steady economic growth [7,8]. A simultaneous decrease in energy demand and costs, while improving the indoor environmental quality, requires constructive communication between building professionals. At this point, Building Information Modelling (BIM) provides a useful platform for sharing information, which streamlines communications and coordinates collaboration between building professionals, including architects, engineers, and energy experts [9,10]. Furthermore, the implementation of BIM provides further benefits, as it allows design errors to be discovered more easily and reduces construction times and costs [10]. The above-mentioned benefits can be complemented by incorporating an optimization algorithm into BIM-based construction projects [10,11]. This allows three possibilities: (i) resolving an optimization problem with three objectives at the most, (ii) analyzing the performance of multiple construction solutions with respect to optimization objectives, and (iii) selecting a construction solution based on trade-offs between optimization objectives [12]. The incorporation can therefore assist building professionals in their decision-making process. For instance, Shadram and Mukkavaara [13] employed a combination of BIM and an optimization algorithm to find a construction solution based on a trade-off between operational energy and embodied energy for a single detached dwelling in Sweden. Rahmani Asl, Stoupine, Zarrinmehr and Yan [10] developed a framework based on the incorporation of BIM and an optimization algorithm. They validated the framework by selecting a construction solution based on a trade-off between visual comfort and energy demand for a single detached dwelling in the U.S. Sandberg, Mukkavaara, Shadram and Olofsson [14] exploited a combination of BIM and an optimization algorithm to select a construction solution based on a trade-off between total energy demand and life-cycle costs for a multifamily residential dwelling in Sweden.
The benefits of incorporation have provided an expeditious enhancement in BIM uptake within the Swedish construction industry [15] that has led to further investments in adopting BIM in construction projects [16]. The large construction companies in Sweden make up the greatest share of BIM adopters [17], while around 58% of the medium sized companies utilized it in construction projects [18]. One of the main limitations with utilizing BIM is the feasibility of resolving an optimization problem with more than three objectives. This limitation is further illuminated when the construction companies in Sweden are obligated to fulfill the EPBD’s requirements for both reducing energy demand and costs, and to improve visual and thermal comfort. Accordingly, there is a need for a method that allows construction companies to maintain BIM utilization in projects and to exploit its benefits, while overcoming its limitations. Incorporating BIM, an optimization algorithm, and a multi-criteria decision-making (MCDM) method helps to overcome such limitations, thereby allowing the selection of a trade-off construction solution [19,20]. A MCDM method considers occupants’ and owners’ preferences and assists them to make an efficient decision [20]. To the best of the authors’ knowledge, no attempt has been made previously to use BIM, an optimization algorithm, and an MCDM method to select a construction solution based on a trade-off between visual and thermal comfort, energy demands, and life-cycle costs. Accordingly, these methods were exploited to select a trade-off construction solution for an office building in Sweden. Two scenarios were considered when using the incorporation of these methods for selecting a trade-off construction solution. The first scenario emphasized the importance of visual and thermal comfort in the building design process, whereas the second scenario stressed a further decrease in life-cycle costs. The selection of scenarios was based on the current situation in designing office buildings in Sweden, where occupants and owners have mainly different preferences in terms of a building’s performance. Occupants value the indoor environmental quality in office buildings, while owners appreciate lower costs. The outcomes of the two scenarios were later compared to understand how a trade-off construction solution, obtained by prioritizing occupants’ preferences, differed from a trade-off solution achieved following the owners’ preferences.
2. Methodology
The methodology for using the above-mentioned incorporation in an office building followed three main steps. In step 1, a BIM model was generated using Revit Autodesk, version 2016. Revit improves collaboration and communication between professionals, and mitigates risks in construction practices [21]. Later, the BIM model was saved as a Green Building XML (gbxml) file. A gbxml file allows the transfer of building data among several architectural and engineering tools [21]. Step 2 involved the conversion of the gbxml file to an EnergyPlus Input Data File (idf) using the Design Builder simulation tool, version 5.0.3.007. Design Builder uses Energy Plus as a simulation engine to evaluate indoor comfort, energy demand, and life cycle costs [22]. The idf file was later modified using EnergyPlus version 8.5.0 and was prepared for performing an optimization. Step 3 related to the execution of the optimization and the selection of a trade-off construction solution using modeFRONTIER. An optimization algorithm was used to generate new designs by changing the value of the optimization variables and then iterating the simulation process. The iteration process continued until the maximum number of iterations were obtained. When the optimization process was terminated, an MCDM method ranked the optimization results to select a trade-off construction solution. Figure 1 shows a schematic illustration of the applied methodology in this study. Implementation of each step is thoroughly explained below.
2.1. Step 1
Step 1 started by generating a BIM model of the office building, located in climate Zone III in Gothenburg, Sweden. The National Board of Housing, Building and Planning [24] has characterized four climate zones in Sweden, which differ in climate conditions. Climate Zone I, located in the northernmost part of the country, represents the coldest zone, while Climate Zone IV, situated in the southernmost, is the warmest zone. The total area of the office building was about 2821.5 m², divided over three heated floors above ground level. The fourth floor was equipped with a mechanical ventilation heat recovery system and was therefore considered as an unheated area. The BIM model included only data regarding the building’s location and its geometry, the thermal specifications of the materials and operation, and also the occupancy schedules. The model was later saved and exported as a gbxml file.
2.2. Step 2
Step 2 started by converting the gbxlm file to an idf file, using the Design Builder simulation tool. The idf file was later complemented in EnergyPlus by specifying heating, ventilation, and air conditioning systems. EnergyPlus provides more options for defining various heating, ventilation, and air conditioning systems than Revit Autodesk. The office building was connected to the biomass-based district heating system, which provided the energy needed for space heating and domestic hot water. Biomass-based district heating is the most prevalent heat supply system in Sweden due to its low environmental impact in comparison with other supply systems [25]. The distribution temperature of the district heating system was set at 80 °C. Furthermore, it was assumed that the system was ideal, and accordingly the efficiency of subsystems was equal to the unit. The office building was equipped with a water-based radiator system with a temperature setpoint of 60 °C. Table 1 presents further characteristics of the office building.
The idf file was later complemented by determining an additional 3 types of energy-efficient windows and 5 types of external roofs, ground floors, and external walls constructions (Table 2). This decision was taken due to both the need to improve visual comfort and thermal comfort, and to reduce energy demand and life-cycle costs. In addition, fixed outdoor overhang panels at a tilt of 90º were fitted above the windows in the model. The overhang panels were installed at 0.1 m above the windows and had a visible transmittance of 0. The thickness of the insulation layers in the external roof, ground floor, and external wall constructions were changed so that their U-value remained equal to or smaller than the national building codes for new buildings (BBR 2015) [24].
Energy Plus allows the use of various performance metrics for evaluating visual comfort, thermal comfort, energy demand, and life-cycle costs. In this study, visual comfort was analyzed by obtaining: (i) the number of hours when daylight illuminance at reference points exceeded 500 lx, and (ii) the number of hours when the daylight glare index at reference points exceeded 22. Reference points were positioned in the spaces with large glazed areas on the second and third floors and oriented towards east and west directions (Figure A1, Figure A2 and Figure A3 in Appendix A). This decision was made because solar radiation, penetrating to interiors from east and west directions, can cause glare [28]. The degree of discomforting glare is intensified during the winter when solar elevation is low in Sweden [29].
Thermal comfort and energy demands were evaluated by obtaining the predicted percentage of dissatisfied (PPD) and total energy demand (Et), respectively. Et included the energy needed for covering space heating and electricity needs for lighting, and also for the ventilation system. A life-cycle cost evaluation was performed by calculating the present value (Kn) of the costs. Kn considers the investment, operation, and maintenance costs during the lifetime of a building. The investment costs included only the material costs used in the construction of the building envelope. An inflation rate of 1%, a discount rate of 3%, and a lifetime of 30 years were also considered. Since the lifespan of the building envelope was 30 years, no maintenance costs were included in the calculation of Kn. Table 2 presents the U-value, investment costs, and lifespan of the building envelope considered in the calculation of Kn.
2.3. Step 3
Step 3 involved the execution of the optimization and selection of a trade-off construction solution. For this purpose, EnergyPlus and modeFRONTIER were coupled by writing a DOSBatch file in modeFRONTIER. A DOSBatch file allows one to run EnergyPlus via modeFRONTIER. The optimization process was later carried out using Design of Experiment (DOE) in modeFRONTIER. DOE is a method that is used for optimizing the performance of a system with prespecified variables [32]. In this study, the optimization variables comprised all types of building envelopes presented in Table 2. Executing an optimization by DOE allowed the evaluation of the performance of 375 design construction solutions, generated based on a combination of 3 types of windows and 5 types of external roofs, ground floors, and external wall constructions. When running an optimization, a PPD smaller than 10 was considered. This decision was made to ensure the minimum thermal comfort in the office building [33]. Equation (1) presents the optimization problem that was developed.
In the equation:
- HDGI>22 is the number of hours when the daylight glare index at the reference points exceeded;
- Hillu>500 is the number of hours when daylight illuminance at the reference points exceeded 500 lx;
- Et is the total energy needed for space heating and electricity for lighting and artificial ventilation;
- Kn is the present value of different construction solutions;
- PPD < 10 is the predicted percentage of dissatisfied smaller than 10, which was considered as an optimization constraint.
After the optimization process was successfully performed, the analytical hierarchy process (AHP) was employed to find a trade-off solution among the 375 construction solutions. AHP, introduced by Saaty [34], is one of the most commonly used MCDM methods for selecting a trade-off construction solution. The eligibility of the AHP in finding a solution based on the trade-off between visual comfort, thermal comfort, energy demand, and the life-cycle costs was discussed and found to be applicable by Jalilzadehazhari, Johansson, Johansson and Mahapatra [23].
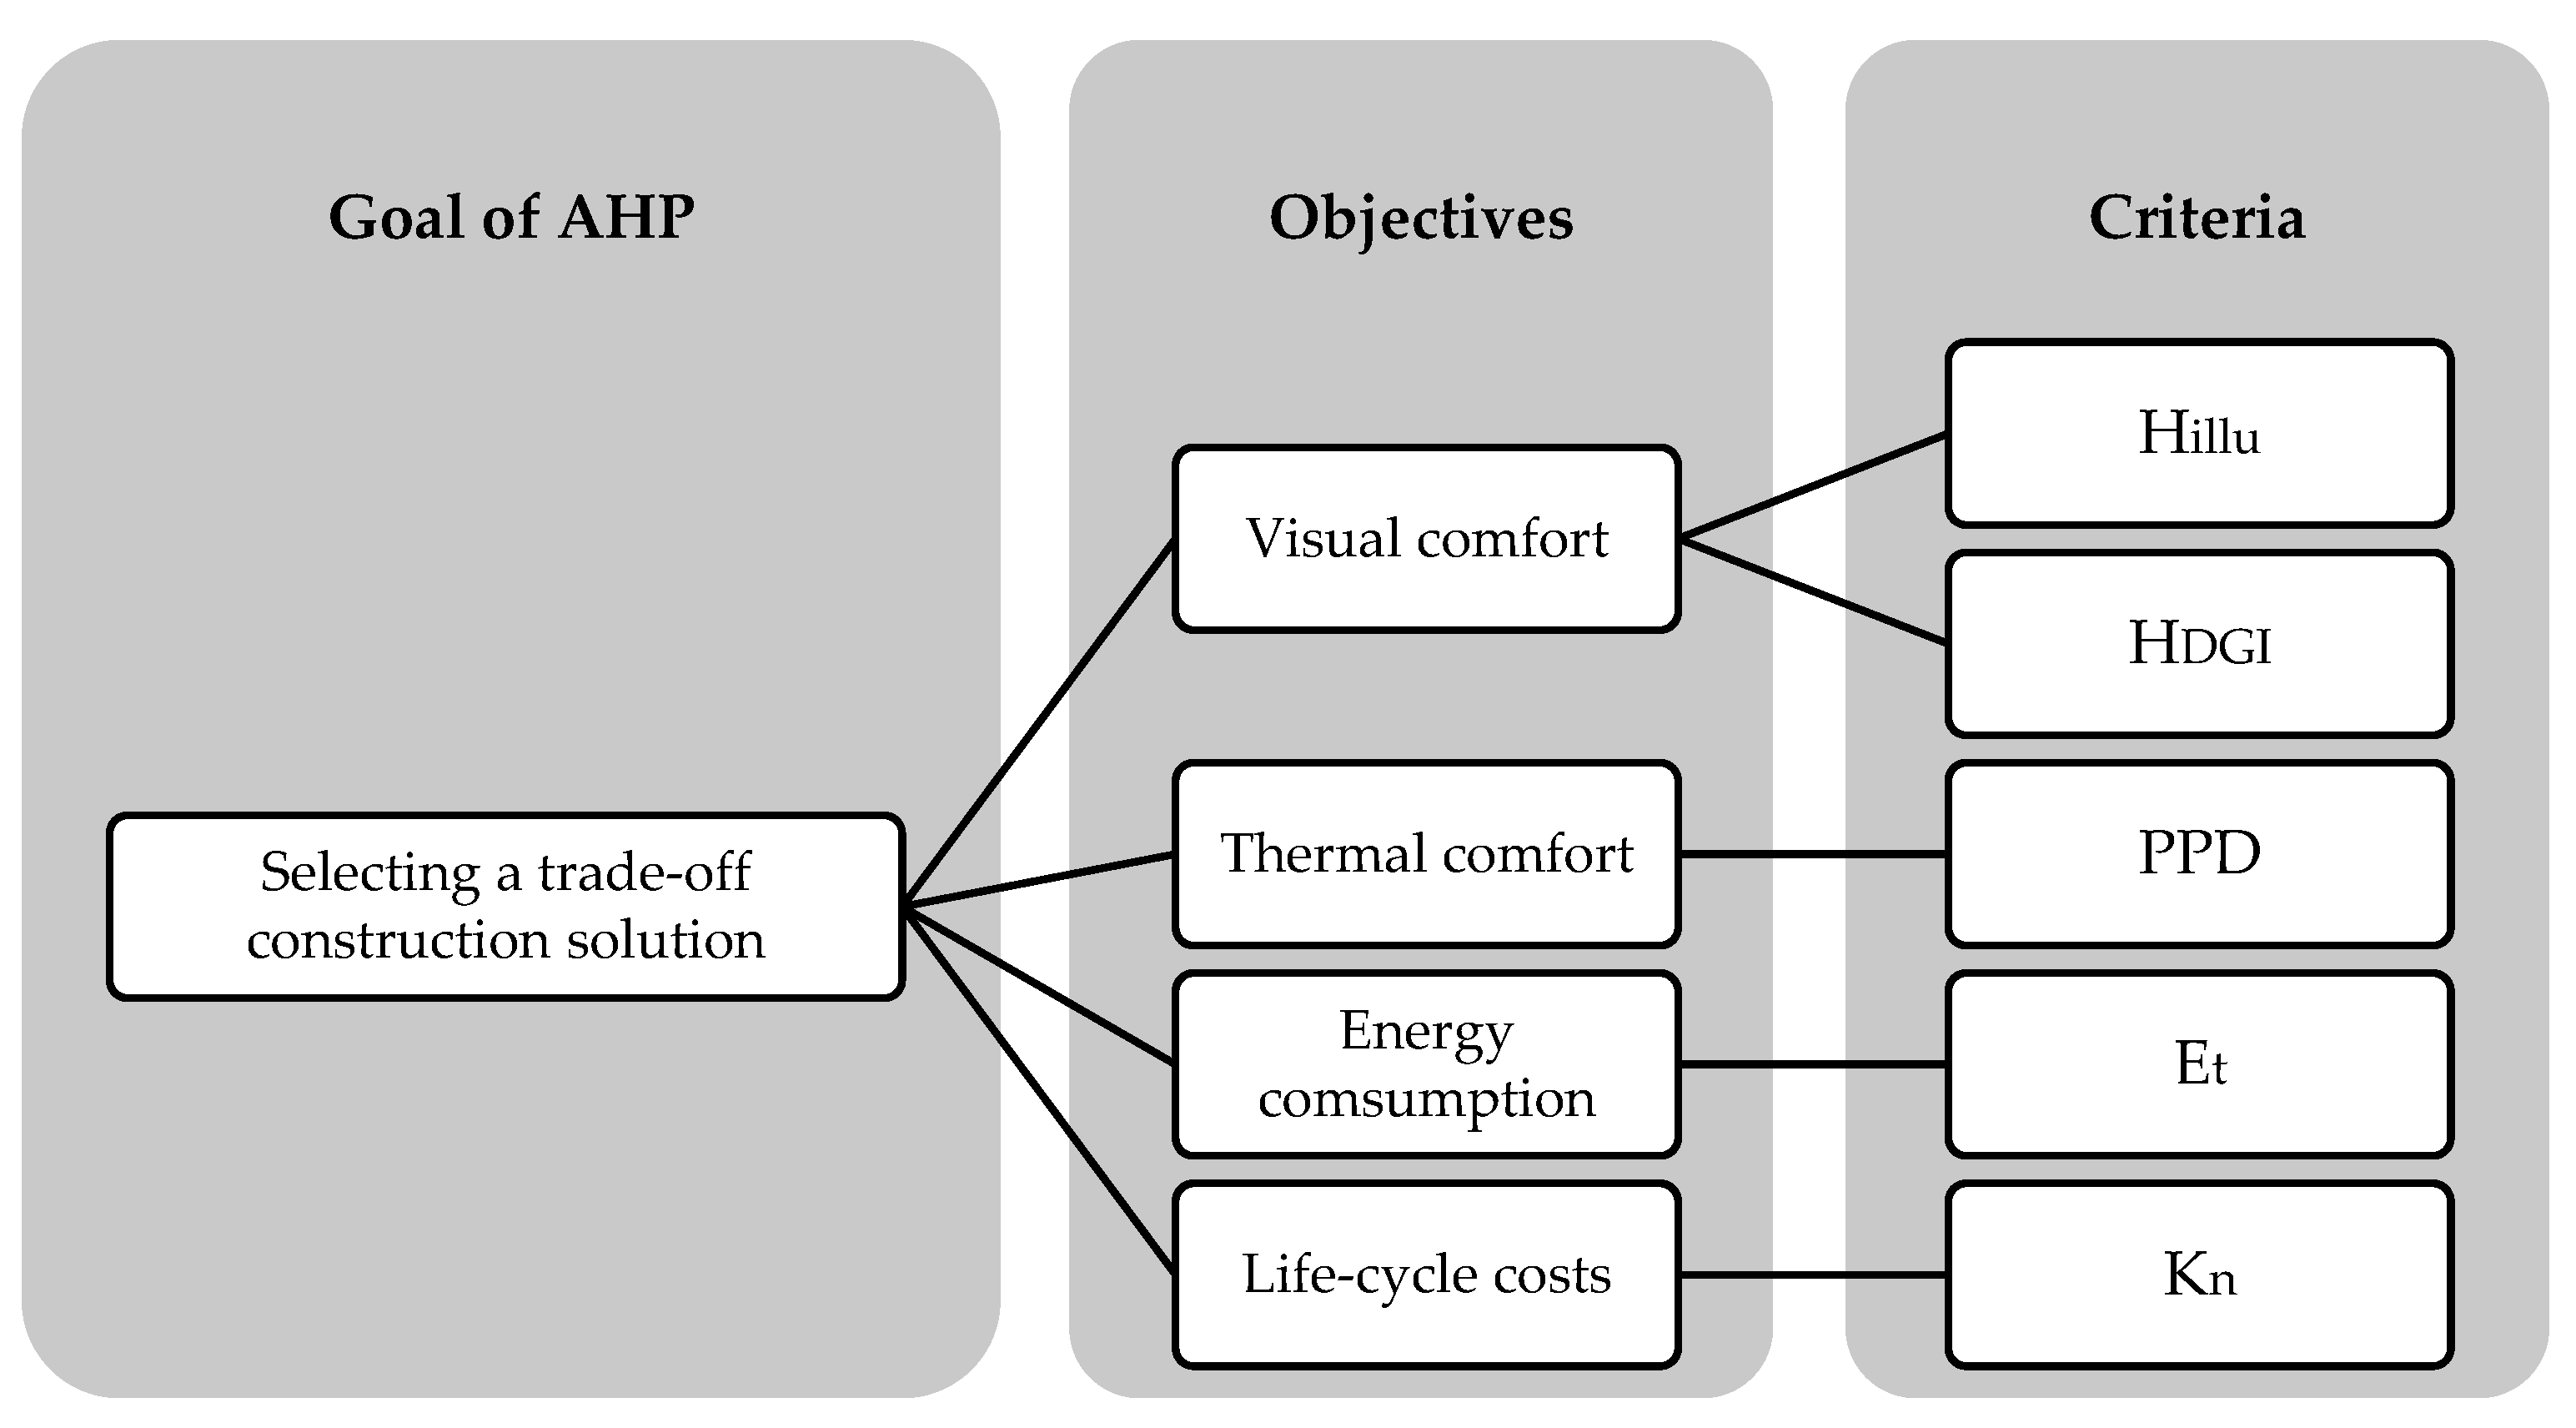
The application of the AHP was started by developing a hierarchy model, which included three different levels. Here the first level represents the goal of AHP, while the second and third levels show the objectives of AHP and their respective criteria, respectively (Figure 2).
Next, comparison matrices among the objectives of AHP and their criteria were developed, using a numerical scale of 1 to 9 (Table 3) [35].
Matrix A presents a comparison matrix, generated among the objectives in Figure 2. The weight of the objectives was calculated in two steps;
- Step one: The comparison matrix was normalized by dividing each value in the matrix by the sum of its respective column.
- Step two: The average of each row in the normalized matrix was quantified, which represented the weight of the objectives.
| A = | Visual comfort | Thermal comfort | Energy consumption | Life cycle cost | |
| Visual comfort Thermal comfort Energy consumption Life cycle cost | |||||
Next, the consistency ratio (CR) of the matrix was calculated following Equation (2). The CR demonstrates whether the performed pairwise comparisons among the objectives and the criteria are consistent. The CR should be less than 0.1 when n > 3 or less than 0.08 when n = 3 [36]. The random consistency index (RI) for a sample size of n = 10 is presented in Table 4 [37].
In the equation:
- λmax is the maximum eigenvalue of a comparison matrix;
- n is the number of values in the developed matrices;
- RI is the random consistency index.
Two scenarios were considered when applying AHP. The first scenario addressed occupants’ satisfaction with the indoor environment, and therefore emphasized the importance of visual and thermal comfort in the building design process. The second scenario concentrated on the economic preferences of the owners and stressed a further decrease in life-cycle costs.
2.3.1. First Scenario
Pairwise comparisons in the first scenario followed the results presented by Kats, Alevantis, Mills and Perlman [8], as improving visual and thermal comfort presented seven times more economic benefits than reducing energy demand and costs. In addition, visual comfort was slightly more important than thermal comfort. This decision was made since visual comfort had slightly more effect on the occupants’ satisfaction with the overall indoor environment than thermal comfort [38]. Matrix B shows the pairwise comparisons performed between the objectives of AHP in Figure 2. The CR obtained for matrix B was about 0.033, which shows the consistency of the pairwise comparisons performed.
| B = | Visual comfort | Thermal comfort | Energy consumption | Life cycle cost | Weight | |
| Visual comfort Thermal comfort Energy consumption Life cycle cost | 0.52 0.36 0.36 0.06 | |||||
Matrix C shows the pairwise comparisons performed among the visual comfort criteria. According to Chung and Ng [39], Hillu > 500 is to a small degree more important than HDGI>22. The weight of the criteria was calculated following the three above-mentioned steps.
| Weight | ||||
| C = | 0.667 0.333 | |||
Thermal comfort, energy demand, and life-cycle costs were studied using a single evaluation metric; therefore, no comparison matrix was generated between their criteria.
2.3.2. Second Scenario
Pairwise comparisons in the second scenario were performed based on the shared opinions of an interest group [35]. The interest group included owners and design specialists in the construction sector: architects, energy experts, project managers, researchers, and academic professors who had close connections with both academia and construction companies in Sweden. The group attributed equal importance to visual comfort, thermal comfort, and energy demand. This decision followed the EPBD requirements for simultaneous improvements in energy efficiency and indoor comfort in the building sector [40]. However, the group ascribed the highest importance to life cycle costs, since making decisions based on the life cycle costs of various construction solutions is prevalent in Sweden. Matrix D shows the comparison matrix generated between the objectives of AHP in Figure 2. The CR obtained for matrix D was about 0.0001, which shows the consistency of the pairwise comparisons performed.
| D = | Visual comfort | Thermal comfort | Energy consumption | Life cycle cost | Weight | |
| Visual comfort Thermal comfort Energy consumption Life cycle cost | 0.167 0.167 0.167 0.499 | |||||
Pairwise comparisons performed among the visual comfort criteria were similar to the pairwise comparisons in the first scenario.
3. Results
The first part of the results describes the variation in the criteria among 375 construction solutions, while the second part presents and compares the trade-off construction solutions found while applying AHP.
3.1. Variation of the Criteria
Performing an optimization using DOE allowed an evaluation of the performance of all 375 construction solutions with respect to visual and thermal comfort, energy demand, as well as life-cycle costs. In terms of visual comfort, Hillu > 500 varied according to Table 5.
The HDGI>22 exceeded 22 only at point 2 on the second and third floors, while it was less than 22 at the other reference points during the full year. Table 6 presents the variation in HDGI > 22 in conjunction with three types of windows.
The analyses of the results showed that PPD among the initial 375 construction solutions varied between four and 11. Accordingly, 95% of the construction solutions (357 of 375) had a PPD smaller than 10, representing designs that provided a comfortable thermal environment. In addition, Et ranged from 60.2 kWh/m² to 66.6 kWh/m², while Kn varied between SEK (Swedish crowns) 8 million and SEK 9.1 million.
3.2. Trade-Off Design Alternatives
When applying AHP, only construction solutions that had a PPD of less than 10 were included in the pairwise comparison process (357 construction solutions). This decision was made to ensure minimum thermal comfort requirements. Table 7 shows the trade-off design alternatives found for the first and second scenarios.
As seen in Table 7, the trade-off construction solutions differ on the ground floor, the roof, and the external wall constructions. The first trade-off construction solution included window type 1. This occurred due to the ability of window type 1 to provide greater Hillu > 500 into the interior, thereby satisfying the most important objective of visual comfort in the first scenario. The second trade-off construction solution also contained window type 1. Although window type 1 had the greatest U-value, its investment costs were 25% and 29% less than the windows of type 2 and 3, respectively. Accordingly, window type 1 in the second trade-off construction solution, where life-cycle costs were the most important objective, contributed to smaller investment costs, thereby reducing the Kn.
The PPD in both scenarios was smaller than 10; yet the thermal comfort condition was slightly better in the first trade-off construction solution. This was because the combination of ground floor 5, along with roof type 5, and external wall type 5 in the first trade-off construction solution, improved the operative temperature. In addition, the above-mentioned combination reduced heat loss via transmission and thereby enhanced the energy performance of the building. At this point, the external walls played the most significant role in reducing Et, since they made up the greatest share among other building envelopes. The ground floor and roof constructions had an identical area. However, the temperature difference between the inside and outside of the roof was larger than the temperature difference between the inside and the outside of the ground floor. Therefore, roof type 5 in the first trade-off construction solution was more efficient than ground floor type 5 in terms of reducing Et. Comparably, external wall type 2 and ground floor type 3 in the second trade-off construction solution, moderately improved the energy performance of the building.
With respect to the life cycle costs, the second trade-off construction solution had the smallest Kn among the investigated design alternatives, while about 12% of them (44 of 375) had a Kn smaller than the first trade-off design. Although the inclusion of ground floor type 5 along with roof type 5 and external wall type 5 in the construction of the first trade-off construction solution reduced the Et, this did not compensate for the high investment costs of these building envelopes.
4. Discussion
The analyses of the results show that although the first trade-off construction solution had a better performance considering thermal comfort and total energy demand, the investment costs and Kn were about 10.6% and 6.2% larger, respectively, than the second trade-off construction solution. This occurred due to the high investment costs of constructing new buildings in Sweden [41], as the reduction in investment costs outweighed the increase in energy costs.
The results obtained in this study differ from the results presented by previous studies. This is because this study exploited DEO to generate multiple construction solutions while also applying the AHP to select a design based on a trade-off among four objectives: visual comfort, thermal comfort, energy demand, and life-cycle costs. However, previous studies have mainly employed algorithms to solve optimization problems with no more than three objectives [42,43,44]. For instance, Carlucci, Cattarin, Causone and Pagliano [42] used the non-dominated sorting genetic algorithm-II (NSGA-II) to optimize visual and thermal comfort in a nearly-zero-energy building in Italy. They presented 24 construction solutions, which satisfied the optimization objectives. Hamdy, Hasan and Siren [43] employed a modified version of the genetic algorithm to optimize the equivalent carbon dioxide emissions and the investment costs for a residential building in Finland. Multiple optimal construction solutions were found as the result of undertaking the optimizations. Niemelä, Kosonen and Jokisalo [44] used an algorithm to optimize the total primary energy demand and life-cycle costs when renovating an educational building. Analyses of the results showed that eight construction solutions satisfied the optimization objectives. Although the above-mentioned studies ran optimizations successfully, they presented sets of solutions; however, having a single trade-off solution is mostly preferred.
5. Conclusions
The incorporation of building information modeling, experimental design, and an analytical hierarchy process allowed the analysis of the performance of 375 construction solutions, and the selection of a solution based on a trade-off among visual comfort, thermal comfort, energy demand, and life-cycle costs. Construction solutions were generated based on a combination of three types of energy-efficient windows and five types of ground floors, roofs, and external walls constructions with different U-values. Two scenarios were later defined when selecting a trade-off construction solution. The first scenario concentrated on the importance of visual and thermal comfort in the building design process, while the second scenario focused on the further decrease in the life cycle costs. The trade-off construction solutions differed in the ground floor, roof, and external wall constructions, while they were identical in terms of window type.
This study found the incorporation of several methods to be a beneficial way of selecting a trade-off construction solution through intelligent use of building information, modelling, and simulation in exploring big-data in the built environment, energy, and cost sectors. The current increase in processing and computation power allows building professionals not only to use the incorporation of these methods to analyze a large variant of construction solutions through an automated procedure in a relatively short period of time, but also to specify how the trade-off solution is affected through changes in pairwise matrices.
The benefits of incorporating the methods outlined above can be achieved when designing new buildings or retrofitting existing ones. However, the results obtained are strongly dependent on pairwise comparisons, performed between objectives of AHP and their respective criteria. Furthermore, the benefits of the using the incorporation is limited to the evaluation of the objective criteria of visual comfort, thermal comfort, energy demand, and life-cycle costs. Subjective values related to the design process still rely on architects’ and building engineers’ creativity.
Future work includes the utilization of the incorporation method for selecting a trade-off construction solution when considering various heating, cooling, and air conditioning systems together with different window sizes.
Author Contributions
Conceptualization, E.J. and A.V.; Formal analysis, E.J. and A.V.; Methodology, E.J.; Supervision, P.J.; Writing—original draft, E.J. and A.V.; funding acquisition, Knowledge Foundation.
Funding
This research was funded by Knowledge Foundation, grant number 20130245.
Acknowledgments
The present study was accomplished as part of a PhD project, financed by Knowledge Foundation. Authors appreciate greatly for their contributions.
Conflicts of Interest
The authors declare no conflict of interest.
Appendix A
Figure A1.
First-floor plan.

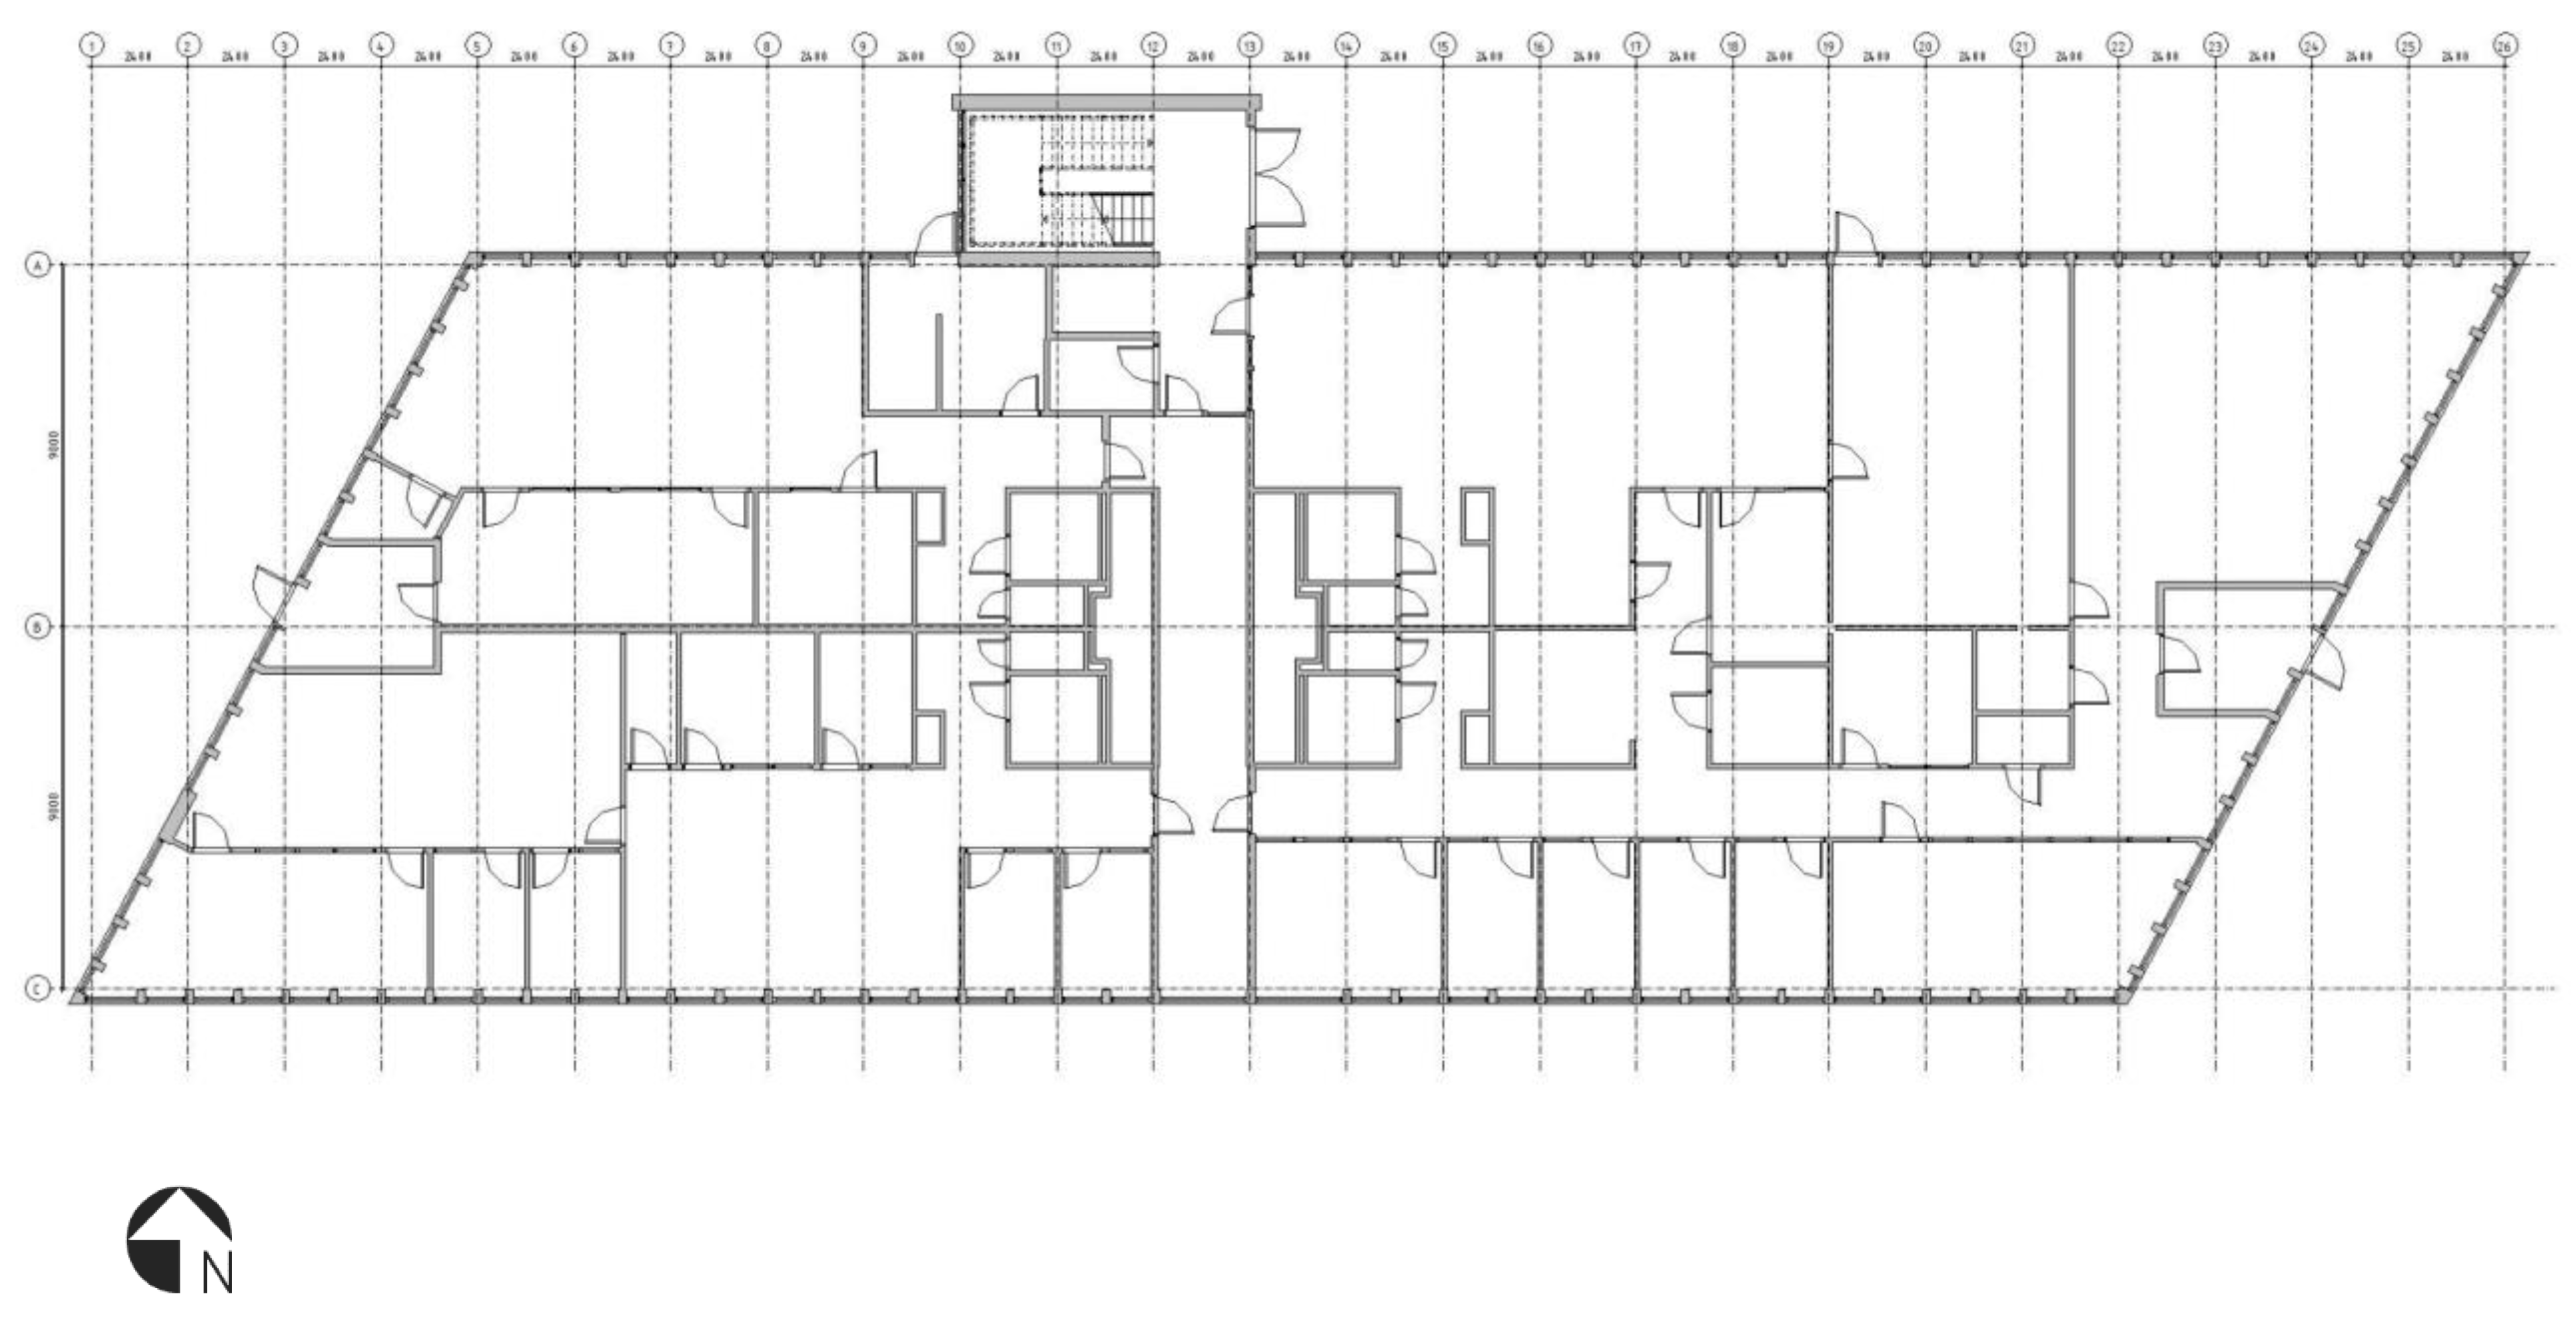
Figure A2.
Second-floor plan.

Figure A3.
Third-floor plan.

References
- Energy Performance of Building Directive (EPBD), ANNEX to the Proposal for a Directive of The European Parliament and of The Council. Amending Directive 2010/31/EU on the energy performance of buildings. Annex I, point 2. Off. J. Eur. Union 2016, 13–35. [Google Scholar]
- Swedish Energy Agency. Energy Statistics for Non-Residential Building 2016 [Energistatistik i lokaler 2016]; Swedish Energy Agency: Bromma, Sweden, 2017; p. 56. (In Swedish) [Google Scholar]
- Swedish Energy Agency. Energy Situation [Energiläget]; Swedish Energy Agency: Bromma, Sweden, 2017; pp. 1–86. (In Swedish) [Google Scholar]
- International Energy Agency. Energy Policies of IEA Countries, Sweden; International Energy Agency: Paris, France, 2013; pp. 1–182. [Google Scholar]
- Aries, M.; Aarts, M.; van Hoof, J. Daylight and health: A review of the evidence and consequences for the built environment. Lighting Res. Technol. 2015, 47, 6–27. [Google Scholar] [CrossRef]
- Heerwagen, J. Green buildings, organizational success and occupant productivity. Build. Res. Inf. 2000, 28, 353–367. [Google Scholar] [CrossRef]
- al Horr, Y.; Arif, M.; Kaushik, A.; Mazroei, A.; Katafygiotou, M.; Elsarrag, E. Occupant productivity and office indoor environment quality: A review of the literature. Build. Environ. 2016, 105, 369–389. [Google Scholar] [CrossRef]
- Kats, G.; Alevantis, L.; Mills, E.; Perlman, J. The Costs and Financial Benefits of Green Buildings: A Report to California’s Sustainable Building Task Force; California Department of Resources Recycling and Recovery: Sacramento, CA, USA, 2003. [Google Scholar]
- Muller, M.F.; Loures, E.R.; Canciglieri, O. Interoperability Assessment for Building Information Modelling. In Proceedings of the 5th International Conference on Structures and Building Materials (ICSBM 2015), Shenzhen, China, 28–29 March 2015. [Google Scholar]
- Asl, M.R.; Stoupine, A.; Zarrinmehr, S.; Yan, W. Optimo: A BIM-based Multi-Objective Optimization Tool Utilizing Visual Programming for High Performance Building Design. In Proceedings of the 33rd eCAADe Conference, Vienna University of Technology, Vienna, Austria, 16–18 September 2015; Martens, B., Wurzer, G., Grasl, T., Lorenz, W.E., Schaffranek, R., Eds.; pp. 673–682. [Google Scholar]
- Sakikhales, M.; Stravoravdis, S. Using BIM to facilitate iterative design, Building Information Modelling (BIM) in Design. Constr. Oper. 2015, 149, 9–19. [Google Scholar]
- Chand, S.; Wagner, M. Evolutionary many-objective optimization: A quick-start guide. Surv. Oper. Res. Manag. Sci. 2015, 20, 35–42. [Google Scholar] [CrossRef]
- Shadram, F.; Mukkavaara, J. An integrated BIM-based framework for the optimization of the trade-off between embodied and operational energy. Energy Build. 2018, 158, 1189–1205. [Google Scholar] [CrossRef]
- Sandberg, M.; Mukkavaara, J.; Shadram, F.; Olofsson, T. Multidisciplinary Optimization of Life-Cycle Energy and Cost Using a BIM-Based Master Model. Sustainability 2019, 11, 286. [Google Scholar] [CrossRef]
- Sanchez, A.X.; Hampson, K.D.; Vaux, S. Delivering Value with BIM: A Whole-of-Life Approach; Routledge: Abingdon, UK, 2016. [Google Scholar]
- Gustavsson, T.K.; Samuelson, O.; Wikforss, Ö. Organizing it in construction: Present state and future challenges in Sweden. J. Inf. Technol. Constr. 2012, 17, 520–534. [Google Scholar]
- Davies, R.; Crespin-Mazet, F.; Linné, Å.; Pardo, C.; Havenvid, M.I.; Harty, C.; Ivory, C.; Salle, R. BIM in Europe: Innovation networks in the construction sectors of Sweden, France and the UK. In Proceedings of the 31st Annual ARCOM Conference, Lincoln, UK, 7–9 September 2015; Raidén, A.B., Aboagye-Nimo, E., Eds.; Association of Researchers in Construction Management; pp. 1135–1144. [Google Scholar]
- Bosch-Sijtsema, P.; Isaksson, A.; Lennartsson, M.; Linderoth, H.C. Barriers and facilitators for BIM use among Swedish medium-sized contractors—“We wait until someone tells us to use it”. Vis. Eng. 2017, 5, 3. [Google Scholar] [CrossRef]
- Jalilzadehazhari, E.; Johansson, P.; Johansson, J.; Mahapatra, K. Developing a decision-making framework for resolving conflicts when selecting windows and blinds. Archit. Eng. Des. Manag. 2018. [Google Scholar] [CrossRef]
- Mosavi, A. Multiple criteria decision-making preprocessing using data mining tools. arXiv 2010, arXiv:1004.3258. [Google Scholar]
- Revit. 2017. Available online: https://www.autodesk.com/products/revit-family/overview (accessed on 3 December 2017).
- Design Builder. 2017. Available online: www.designbuilder.co.uk (accessed on 12 December 2018).
- Jalilzadehazhari, E.; Johansson, P.; Johansson, J.; Mahapatra, K. Application of analytical hierarchy process for selecting an interior window blind. Archit. Eng. Des. Manag. 2017, 13, 308–324. [Google Scholar] [CrossRef]
- National Board of Housing Building and Planning. Building Regulation [Boverkets Byggregler, BFS 2011: 6 med ändringar till och med 2015: 3]; National Board of Housing, Building and Planning [Boverket]: Karlskrona, Sweden, 2015. (In Swedish) [Google Scholar]
- Gustafsson, M.; Gustafsson, M.S.; Myhren, J.A.; Bales, C.; Holmberg, S. Techno-economic analysis of energy renovation measures for a district heated multi-family house. Appl. Energy 2016, 177, 108–116. [Google Scholar] [CrossRef]
- Flodberg, K. Very Low Energy Office Buildings in Sweden; Lund University: Lund, Sweden, 2012. [Google Scholar]
- Månsson, L. Light & Room, Guide for Planning of Indoor Lighting [Ljus & Rum: Planeringsguide för Belysning Inomhus]; Ljuskultur: Stockholm, Sweden, 2003. (In Swedish) [Google Scholar]
- Al-Sallal, K. Low Energy Low Carbon Architecture: Recent Advances & Future Directions; CRC Press: Boca Raton, FL, USA, 2016. [Google Scholar]
- Bülow-Hübe, H. Solar Shading and Daylight Redirection, Architecture and Built Environment. Ph.D. Thesis, Lund University, Lund, Sweden, 2007. [Google Scholar]
- Elitfonster. 2016. Available online: www.elitfonster.se (accessed on 24 January 2018).
- I.S.W.B. Wikells construction calculations, AB]. Sectional Facts—NYB 12/13: Technical-Economic Compilation of Buildings [Sektionsfakta—NYB 12/13: Teknisk-ekonomisk sammanställning av byggdelar], 22nd ed.; Wikells Byggberäkningar: Växjö, Sweden, 2012. (In Swedish)
- Koziel, S.; Yang, X.S. Computational Optimization, Methods and Algorithms; Springer: Berlin/Heidelberg, Germany, 2011. [Google Scholar]
- Pourshaghaghy, A.; Omidvari, M. Examination of thermal comfort in a hospital using PMV–PPD model. Appl. Ergon. 2012, 43, 1089–1095. [Google Scholar] [CrossRef] [PubMed]
- Saaty, T.L. How to make a decision: The analytic hierarchy process. Eur. J. Oper. Res. 1990, 48, 9–26. [Google Scholar] [CrossRef]
- Saaty, T.L. Decision making with the analytic hierarchy process. Int. J. Serv. Sci. 2008, 1, 83–98. [Google Scholar] [CrossRef]
- Ordouei, M.H.; Elkamel, A.; Dusseault, M.B.; Alhajri, I. New sustainability indices for product design employing environmental impact and risk reduction: Case study on gasoline blends. J. Clean. Prod. 2015, 108, 312–320. [Google Scholar] [CrossRef]
- Hotman, E. Base reference analytical hierarchy process for engineering process selection. In Proceedings of the International Conference on Knowledge-Based and Intelligent Information and Engineering Systems, Melbourne, Australia, 14–16 September 2005; Springer: Berlin/Heidelberg, Germany, 2005; pp. 184–190. [Google Scholar]
- Frontczak, M.; Andersen, R.V.; Wargocki, P. Questionnaire survey on factors influencing comfort with indoor environmental quality in Danish housing. Build. Environ. 2012, 50, 56–64. [Google Scholar] [CrossRef]
- Chung, T.; Ng, R. The application of analytic hierarchy process in daylighting performance assessment. Indoor Built Environ. 2016, 25, 50–68. [Google Scholar] [CrossRef]
- EPBD, Directive 2010/31/EU of the European Parliament and of the Council of 19 May 2010 on the energy performance of buildings (recast). Off. J. Eur. Union 2010, 18, 2010.
- Emanuelsson, R. Supply of housing in Sweden. Sver. Riksbank Econ. Rev. 2015, 2, 47–75. [Google Scholar]
- Carlucci, S.; Cattarin, G.; Causone, F.; Pagliano, L. Multi-objective optimization of a nearly zero-energy building based on thermal and visual discomfort minimization using a non-dominated sorting genetic algorithm (NSGA-II). Energy Build. 2015, 104, 378–394. [Google Scholar] [CrossRef]
- Hamdy, M.; Hasan, A.; Siren, K. Applying a multi-objective optimization approach for Design of low-emission cost-effective dwellings. Build. Environ. 2011, 46, 109–123. [Google Scholar] [CrossRef]
- Niemelä, T.; Kosonen, R.; Jokisalo, J. Cost-optimal energy performance renovation measures of educational buildings in cold climate. Appl. Energy 2016, 183, 1005–1020. [Google Scholar] [CrossRef]
Figure 1.
Schematic illustration of the applied methodology (the figure was modified and adapted from Figure 2 in [23]).
Figure 1.
Schematic illustration of the applied methodology (the figure was modified and adapted from Figure 2 in [23]).

Figure 2.
The developed hierarchy model when applying the analytical hierarchy process (AHP).


Table 1.
The characteristics of the office building.
| The efficiency of the ventilation fan | 60% |
| The efficiency of the heat recovery system | 76% |
| Indoor temperature | 18 °C to 22 °C |
| Air tightness [26] Occupancy activity Clothing resistance Artificial lighting Occupancy schedule The reflectance of interior surfaces [27] | 0.1 (ach) at a differential pressure of ± 50 (Pa) 1.2 (met) 0.5 (clo) in summer and 1 (clo) in winter Fluorescent electrical lighting with 9.9 (W/m²) power 07:00 to 18:00 on working days only Walls 60% Ceiling 80% Floor 20% |
Table 2.
Various building envelopes considered when using the incorporation.
| Building Envelopes | U-Value (W/K·m²) | Investment Costs (SEK ¹/m²) | Lifespan | Description |
|---|---|---|---|---|
| Windows [30] | ||||
| Type 1 | 0.9 | 4665 | 30 | VT ² = 65%, SHGC³ = 45% |
| Type 2 | 0.8 | 5830 | 30 | VT ² = 63%, SHGC³ = 43% |
| Type 3 | 0.7 | 6020 | 30 | VT ² = 60%, SHGC³ = 41% |
| External walls [31] | ||||
| Type 1 | 0.18 | 1403.6 | 30 | |
| Type 2 | 0.14 | 1433 | 30 | |
| Type 3 | 0.12 | 1505.7 | 30 | |
| Type 4 | 0.1 | 1530 | 30 | |
| Type 5 | 0.09 | 1599 | 30 | |
| Ground floor [31] | ||||
| Type 1 | 0.15 | 589.5 | 30 | |
| Type 2 | 0.12 | 711.4 | 30 | |
| Type 3 | 0.1 | 758 | 30 | |
| Type 4 | 0.09 | 880 | 30 | |
| Type 5 | 0.08 | 956 | 30 | |
| External roof [31] | ||||
| Type 1 | 0.13 | 389 | 30 | |
| Type 2 | 0.12 | 411 | 30 | |
| Type 3 | 0.1 | 426.2 | 30 | |
| Type 4 | 0.09 | 445.4 | 30 | |
| Type 5 | 0.08 | 463.4 | 30 |
¹ SEK: Swedish crowns; ² VT: visual transmittance; ³ SHGC: solar heat gain coefficient.
Table 3.
The numerical scale used in developing comparison matrixes.
| Scale | Description |
|---|---|
| 1 | jn is equally important to jm |
| 3 | jn is moderately more important than jm |
| 5 | jn is strongly more important than jm |
| 7 | jn is very strongly more importance than jm |
| 9 | jn is extremely more important than jm |
Table 4.
Random consistency index (RI).
| n | 1 | 2 | 3 | 4 | 5 | 6 | 7 | 8 | 9 | 10 |
|---|---|---|---|---|---|---|---|---|---|---|
| RI | 0 | 0 | 0.58 | 0.9 | 1.12 | 1.24 | 1.32 | 1.41 | 1.45 | 1.49 |
Table 5.
The variation of Hillu > 500 among seven reference points.
| Reference Points | Window Type 1 (h) | Window Type 2 (h) | Window Type 3 (h) |
|---|---|---|---|
| Second Floor, point 1 | 258.5 | 159 | 74.5 |
| Second Floor, point 2 | 55.5 | 25.5 | 4 |
| Second Floor, point 3 | 2619 | 2520.5 | 2400 |
| Third Floor, point 1 | 324.5 | 215 | 129 |
| Third Floor, point 2 | 53.3 | 29.5 | 13.5 |
| Third Floor, point 3 | 171.5 | 125 | 86.5 |
| Third Floor, point 4 | 173.4 | 126 | 89 |
Table 6.
Variation in the number of hours when daylight glare index exceeded 22.
| Reference Points | Window Type 1 (h) | Window Type 2 (h) | Window Type 3 (h) |
|---|---|---|---|
| Second Floor, point 2 | 229.5 | 164 | 112 |
| Third Floor, point 2 | 235 | 176 | 119 |
Table 7.
Trade-off design alternatives.
| Scenarios | First Scenario Visual Comfort Is the Most Important Objective When Applying AHP | Second Scenario Life Cycle Cost Is the Most Important Objectives When Applying AHP |
|---|---|---|
| First trade-off design alternative | Second trade-off design alternative | |
| Window | 1 | 1 |
| Ground floor | 5 | 1 |
| Roof | 5 | 3 |
| External wall | 5 | 2 |
| PPD | 6.20% | 6.50% |
| Et | 62.5 kWh/m2 | 64.7 kWh/m2 |
| Kn | 8.5 MSEK | 8 MSEK |
| Total investment | 5.75 MSEK | 5.2 MSEK |
© 2019 by the authors. Licensee MDPI, Basel, Switzerland. This article is an open access article distributed under the terms and conditions of the Creative Commons Attribution (CC BY) license (http://creativecommons.org/licenses/by/4.0/).
Share and Cite
MDPI and ACS Style
Jalilzadehazhari, E.; Vadiee, A.; Johansson, P. Achieving a Trade-Off Construction Solution Using BIM, an Optimization Algorithm, and a Multi-Criteria Decision-Making Method. Buildings 2019, 9, 81. https://doi.org/10.3390/buildings9040081
AMA Style
Jalilzadehazhari E, Vadiee A, Johansson P. Achieving a Trade-Off Construction Solution Using BIM, an Optimization Algorithm, and a Multi-Criteria Decision-Making Method. Buildings. 2019; 9(4):81. https://doi.org/10.3390/buildings9040081
Chicago/Turabian StyleJalilzadehazhari, Elaheh, Amir Vadiee, and Peter Johansson. 2019. "Achieving a Trade-Off Construction Solution Using BIM, an Optimization Algorithm, and a Multi-Criteria Decision-Making Method" Buildings 9, no. 4: 81. https://doi.org/10.3390/buildings9040081
Note that from the first issue of 2016, this journal uses article numbers instead of page numbers. See further details here.