1. Introduction
The building sector continues to be among the main sectors worldwide responsible for greenhouse gas emissions. Most of these emissions are caused by operational energy use in existing buildings, but new constructions, which is the focus of this paper, also make a considerable contribution in the form of emissions from the construction materials and related processes [
1]. In recent years, modern building energy codes for new constructions are pushing operational emissions toward zero. Meanwhile, the relative share of life-cycle emissions for these buildings gets shifted from the operational emissions to the production and transportation of building materials and other emissions related to the construction, maintenance, and end-of-life processes; the emissions that are often referred to as embodied emissions. A building’s life-cycle impact on climate change is normally estimated with life cycle assessment (LCA) methodology and the impact category global warming potential (GWP) with units kgCO
2e. [
2]. The results are often normalized by a floor area metric and by lifetime, to get comparable results.
When assessing the embodied emissions, different buildings may end up with similar results on the whole building level but for very different reasons. To identify the factors responsible for GWP impact, a high resolution on emission results and detailed information on study design and parameter values are prerequisites. Without this information readily accessible, it is impossible to know if the results are mainly affected by design and construction choices, or by the study design itself. In practice, however, such study results are mostly reported with low resolution and rarely with sufficient details about data used, system boundaries, calculation methods, or other information [
3,
4] crucial for evaluating the validity of the assessment. Such details are also needed for making use of the results for comparisons and statistical applications that may greatly benefit the efforts to reduce the carbon footprint of buildings.
In the LCA methodology, the product system is modeled by one of the three life cycle inventory (LCI) techniques: process analysis, environmentally extended input-output analysis (EEIOA), and hybrid analysis, which can lead to fundamentally different results. In process analysis the product system is broken down into the individual processes in the products life cycle, thus compiling an inventory of specific production processes. This allows for high accuracy by the use of product specific data, but the method has systemic incompleteness. Alternatively, EEIOA applies macroeconomic figures to assess the environmental flows, which allows for a systemically complete representation but relies on aggregated economic data. Combining the two previous approaches results in a variety of methods known as hybrid analysis which attempts to tackle these problems [
5]. The embodied energy has been found to be 3.92 times higher on average in studies using hybrid analysis compared to studies using process analysis [
6]. Although process analysis is known to suffer from the so-called truncation error, which has been shown to greatly underestimate the embodied environmental impacts of buildings [
6,
7,
8], it is the most widely used LCI technique, and thus the potential for statistical analysis is greatest for process analysis.
Many similar but slightly alternative approaches to building LCA are practiced today, which can lead to very different results [
9,
10,
11]. In a recent review article on the embodied energy of buildings, it is pointed out that previous embodied energy studies show considerable variation in reported values, owing both to methodological parameters such as differences in system boundary, calculation method, and energy units, as well as to data quality issues of parameters such as incompleteness, inaccuracy, and non-representativeness [
11]. In another literature review from 2010 of 20 journal articles [
3], the embodied energy in the assembly phase was found to range from 2 to 72 years equivalent of annual operational energy (embodied energy to total life cycle energy ranged from 2 to 51%), thus emphasizing the large spread in results. The study found that most of the journal articles that describe LCA of buildings are not providing sufficient documentation to be useful for comparison. In particular, unit processes and calculation procedures are rarely stated. In a similar study from 2013 [
4], where 206 cases were compared, variation of which life cycle stages were included, and arbitrary building lifetimes were put forward as comparability issues. Moreover, the authors emphasized the difficulty of comparing the studies due to lack of documentation and inconsistency in methodology. The missing information included which life cycle stages and sub-stages are included; whether primary or delivered energy is used; building area and area units; general description of the building such as location, use, and number of stories; features that would affect embodied energy such as structure type, wall, roof, floor, and windows; and features that would affect operational energy such as insulation levels, and type of energy used for heating and cooling. Although these studies concerned embodied energy, the methodology is similar for emissions. In buildings where operational energy efficiency has been given high priority, the fraction of embodied material emissions alone have been found in some cases to be as much as 75% of total emissions (3–6 kgCO
2e./m
2/year), as shown in one comparative study [
12], and 87% (6–21 kgCO
2e./m
2/year), as shown in another [
13]. This shift from operational to embodied emissions is due to lower operational energy consumption but also due to different/more material use [
14]. In terms of life cycle energy, low-energy buildings have lower total lifecycle energy demand but an increased embodied energy [
6,
15,
16]. The embodied energy from supplementary insulation will at some insulation level no longer be offset by thermal operational energy savings. One study using a hybrid approach found this threshold to be just above the current minimum energy efficiency requirement in Australia [
17]. The time at which emissions occur is also of relevance; a spike in short-term embodied emissions may be more damaging than emissions from future energy use because the decay of carbon in the atmosphere is relatively slow and future emissions intensities are more uncertain when considering technological advancements [
14,
18].
Furthermore, limitations of data quality and difficulties to assess uncertainty are acknowledged problems in LCA [
19], and uncertainty analyses are not included in most studies [
20]. Björklund [
20] listed different types of uncertainties appearing in LCA models, and ways to improve on this using uncertainty and sensitivity analyses. Khasreen et al. [
21] similarly highlighted the need for an internationally accepted framework, protocol, and conversion tools to improve comparability of building LCAs, as well as transparency and higher accuracy of data sets. Among the LCAs that were investigated, they concluded that “there are no two studies which could be directly compared, due to differences in goal and scope of the study, methodologies used to achieve these different goals, and data used.”
Traditional LCA methods are time-consuming and have to be specifically tailored to individual buildings [
21], with a need for large amounts of high-quality data for the specific building in question to make an accurate prediction. Even with all the necessary data available, differences in system boundary from project to project make them almost impossible to compare directly, and little can be stated about the uncertainties of individual analyses without extensive investigations. On a neighborhood scale, where complexity increases further, there is little knowledge, methods, and tools available to assess the embodied emissions, especially in an early stage [
9].
To compare LCAs with varying system boundaries, the results need to be stored with the highest available resolution for all building parts and materials, as well as for the lifecycle stages. In Norway, several embodied emission analyses of buildings have recently been performed in accordance with international and national standards such as NS-EN 15978 [
22] (LCA calculation method) and NS 3451 Table of building elements [
23] (building parts classification), making them more fit for comparison. To compare the LCA studies, systematic decomposition and classification of the buildings and their elements are needed; first, by categorizing the buildings by attributes such as physical dimensions, typology etc., and then, through a decomposition of the physical building parts, with an increasing level of detail according to NS 3451. A building has walls, roof, floors, foundation etc. that again consists of load-bearing and non-load bearing walls, windows and doors, and so on. In turn, each of these building parts is made up of a set of building materials and components that are bought from a manufacturer. Each of these materials’ and building components’ emission values is dependent on the system boundaries used for their individual lifecycles and the lifecycle of the building. When comparing study results, the comparison must be based on the same lifecycle phases and building elements; results for each lifecycle phase must, therefore, be stored for all building parts.
Several previous studies have characterized embodied emissions and embodied energy by a breakdown of a building into its sub-elements. For example, by a separation of buildings into “envelope,” “structure,” “finishings,” etc. [
24], or by a hierarchical characterization that further splits “structure” into sub-elements such as “foundations,” “columns,” “beams,” and “slabs” and splits “envelope” into “outer walls,” “windows,” and “roof” [
25]. Early phase parametric LCA approaches such as the one presented in [
16] are also dependent on a breakdown of buildings into sub-elements. However, as far as the authors are aware, a hierarchical model of building elements that encompass the entire building and its life-cycle stages and applies this for characterizing LCA results has not previously been presented in the literature.
This study presents a relational database tool that aims to systematize result data and study design for building LCAs. By systematically organizing studies of embodied emissions in buildings, the tool ensures accessible, comparable, and more reliable data. Accessible and reliable data are the foundation for many useful applications. The building LCA database tool (bLCAd-tool) can be used for applications such as benchmarking, comparative analysis, predictive statistics, LCA of neighborhoods and individual buildings, and transparent reporting. It allows for LCA results at different resolutions and across different system boundaries to be entered into the database and enables easy access to this data by restricting the output of data from the database to the studies that comply to some user-defined criteria. Consequently, because the data are made accessible and compatible, the utility of the existing data increases. The limitations of current practice described above call for a unified framework for systematically handling the data related to embodied emissions of buildings so that it can be applied in various decision-making processes related to climate change mitigation. Benchmark values for embodied emissions may soon become part of building code requirements [
26]. Furthermore, there is a need for decision support and simplified assessments in the early design stages of building and neighborhood projects, since the early design stages are when most influence toward emission reduction can be achieved. In the following, the tool is presented in
Section 2 and some selected applications are demonstrated in
Section 3. Thereafter follows a discussion in
Section 4 and finally a conclusion.
2. Materials and Methods
This section first describes the structure of the database, then describes the handling of the data and the calculation method. Thereafter follows a description of the data used in the statistical analysis in this paper.
2.1. Database Design
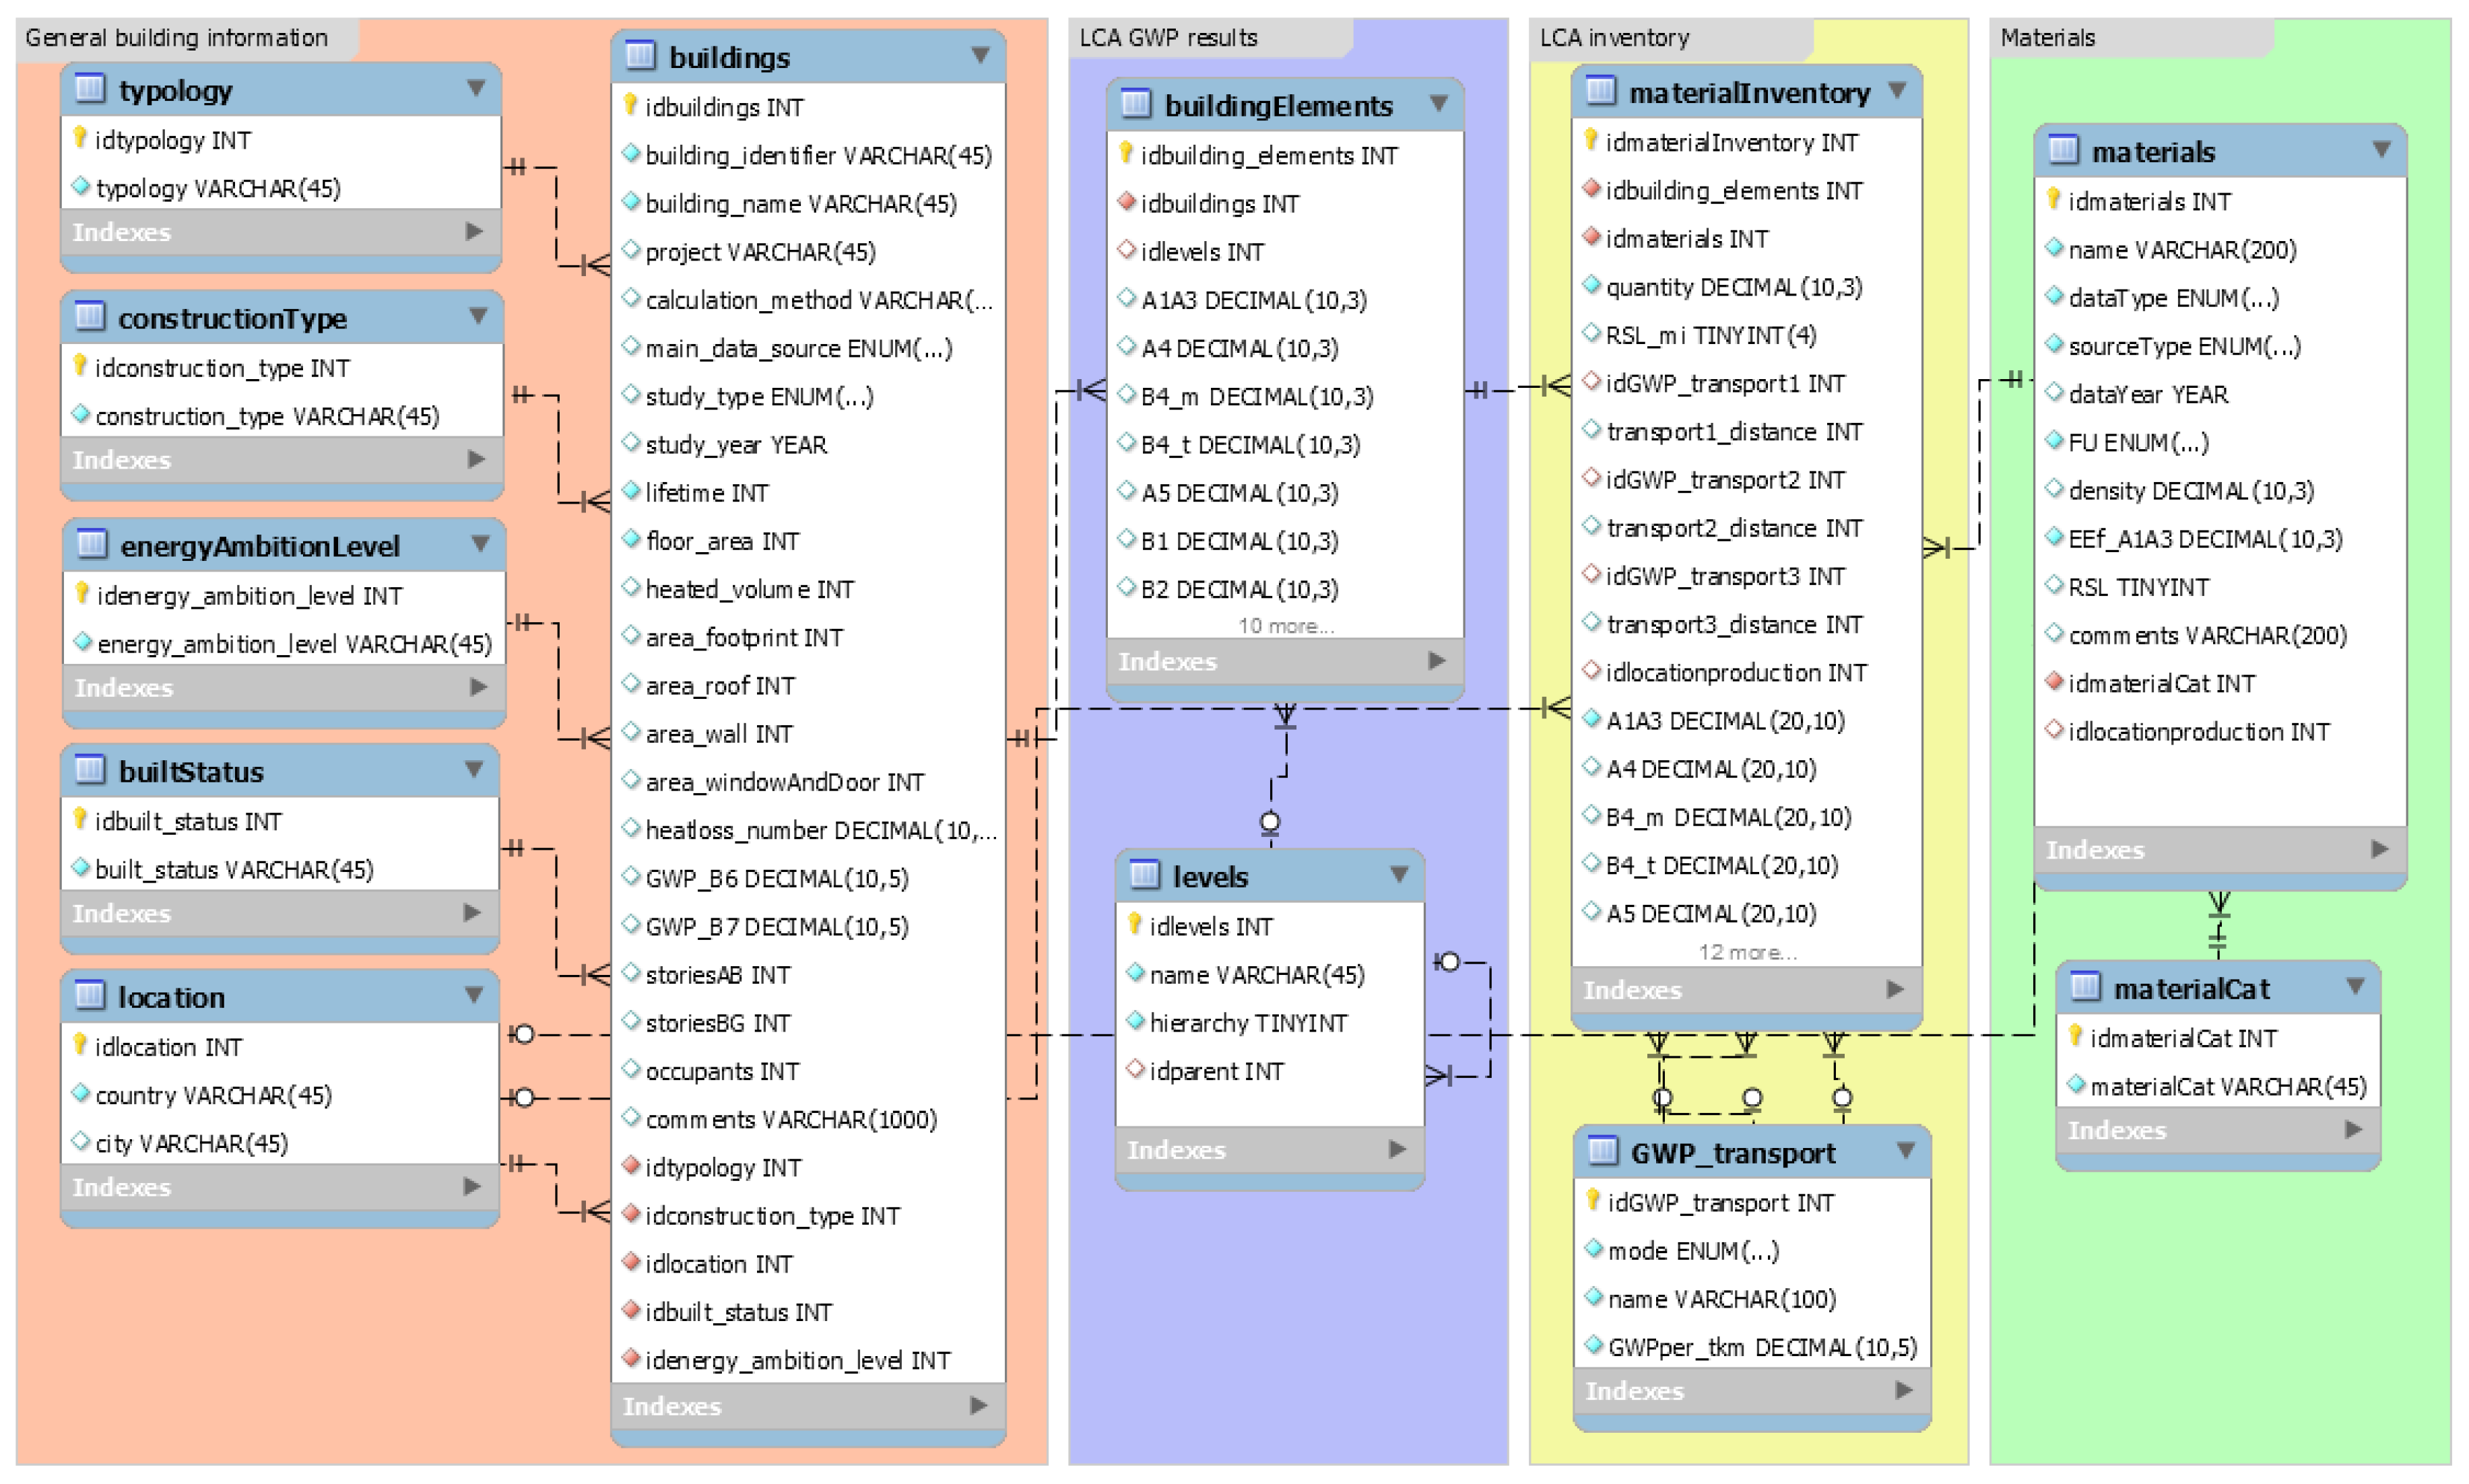
The building LCA database-tool (bLCAd-tool) is a relational MySQL database that can store results from existing, and calculate new, process-based life cycle assessments of buildings. It is designed to apply this data for the analytical purposes described in the introduction. The Entity-Relationship-Diagram (ERD) for the database design is shown in
Figure A1 in the
appendix. The database has three main components: a “building” component for storing attributional data about the building and study, a “material: component for storing information about the materials and products that make up the building, and a “results and inventory” component with modules for storing, calculating, and aggregating LCA results for the building. These three components contain information related to distinct parts of an LCA: the material component contains the background data on the unit processes used in the individual studies, serving a function similar to databases such as Ecoinvent [
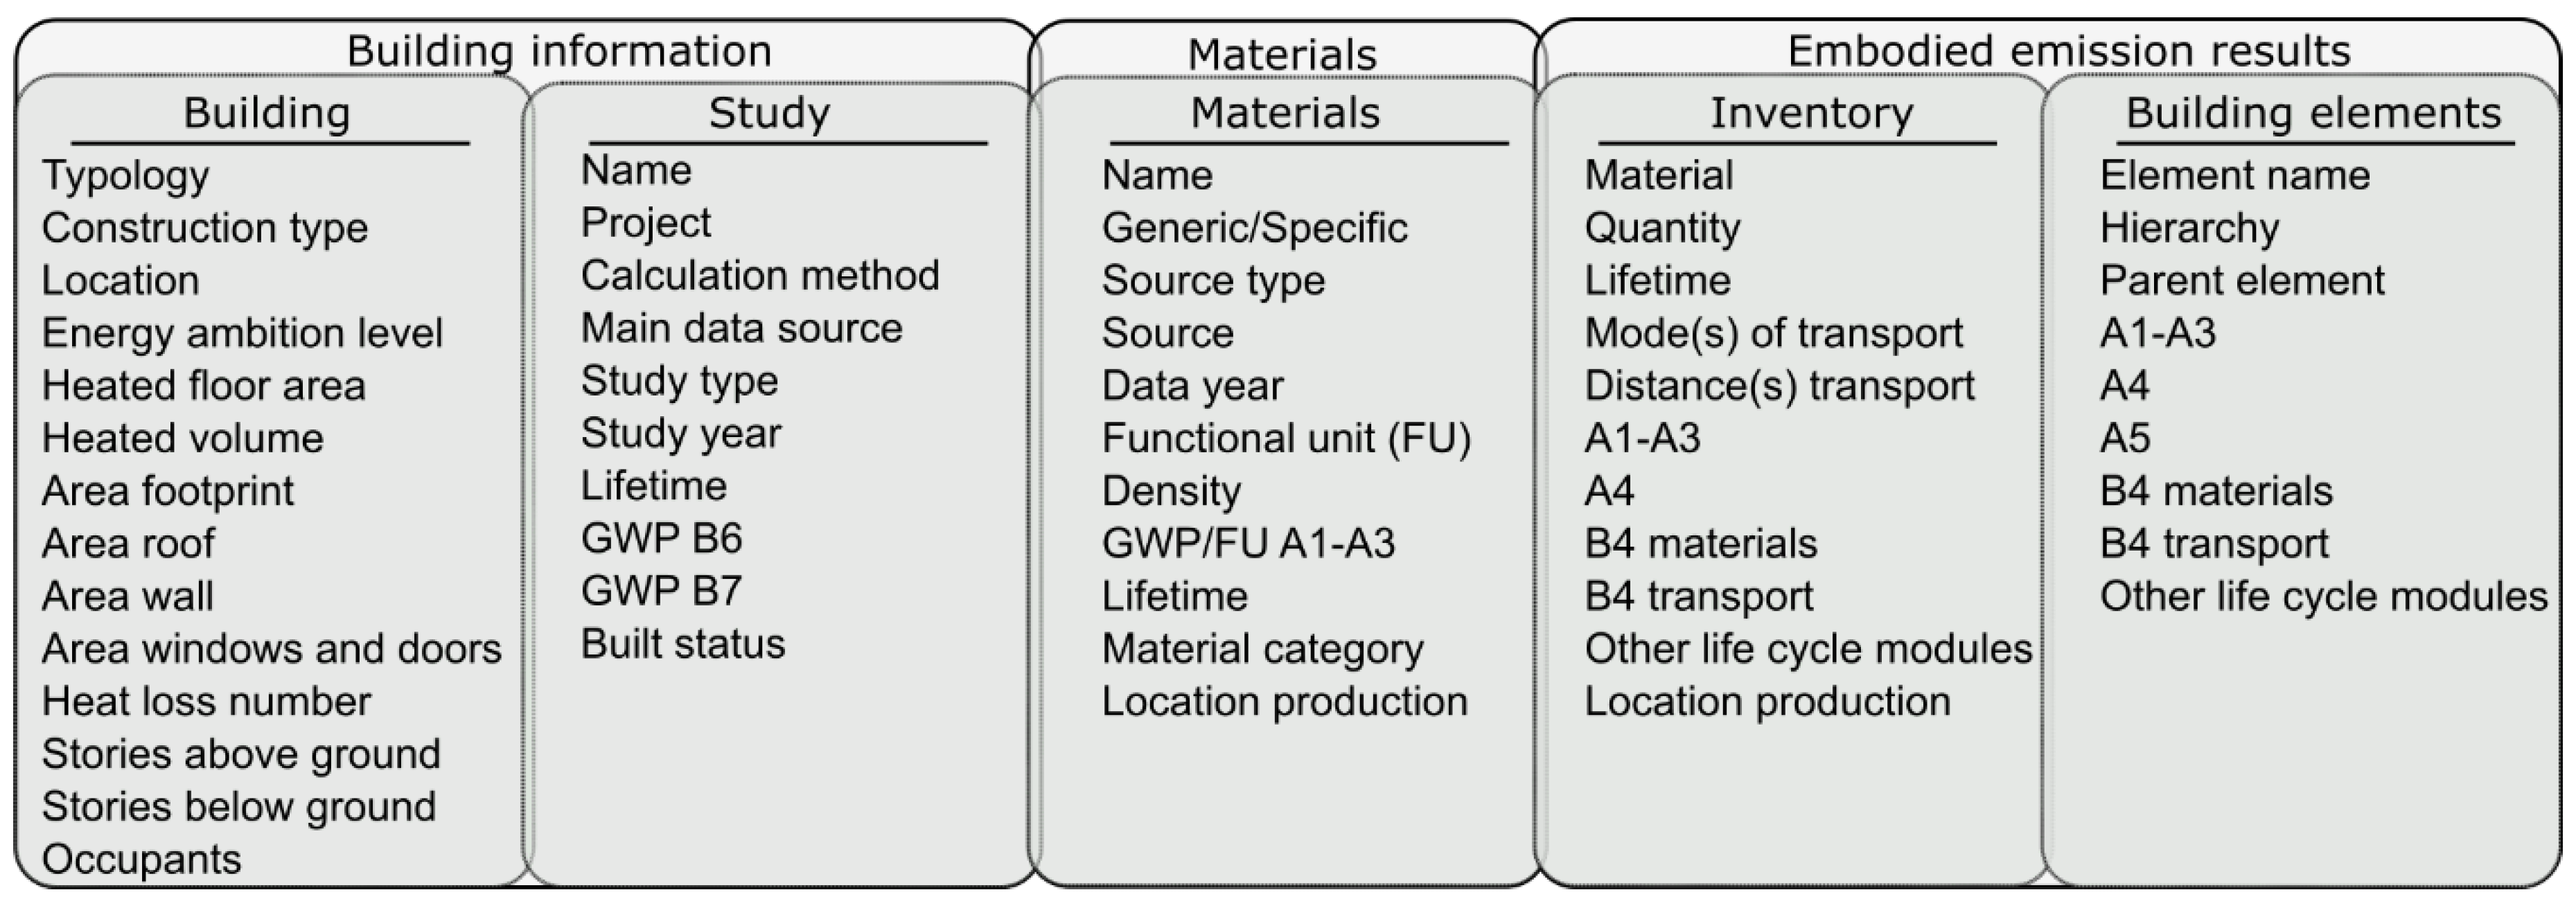
27]; the results and inventory component is calculating and storing the GWP results for each building element and inventory; and the building component classifies the buildings and the studies, with information relevant for interpreting the results. The information stored in these components are listed in
Figure 1.
The building component contains attributional information specific to the building and the study related to that building. Building information includes typology, construction type, location, energy ambition level, floor area, surface areas and volume, stories (above and below ground), and heat loss number, in addition to the number of occupants. The number of occupants in a building allows for a representation of embodied emissions per capita, which can be useful when comparing lifestyles or the area provided to fulfill functions such as housing and workplaces. Since larger houses in general are more energy efficient per m
2, embodied emissions per capita can be an important additional metric [
28]. Study information includes the calculation method, main data source (e.g., EPD), study type (e.g., scientific), year of assessment, study lifetime period, the built-status (e.g., design phase/as-built phase), and the yearly GHG emissions results from the operational phase of the building (life cycle module B6 and B7).
The materials component is independent of the buildings and stores information about materials and products, including source and emission data. These materials are the per unit GWP background data that was used in each study. This background data is typically sourced from LCA databases such as Ecoinvent, or from Environmental Product Declarations (EPDs), where the sources used are either Generic or Specific, i.e., average emission values for a typical representative product, or emission values from a specific supplier, respectively. Both the location of production and the lifetime of the material (reference service life (RSL)) can be stored for each material and for each inventory entry. This is because those parameters can come either together with the background data, or they can be set by the LCA practitioner if the background data are used as a proxy for the actual materials used in the building. The lifetimes of the materials are also highly dependent on their use case and must therefore often be set specifically for each material inventory.
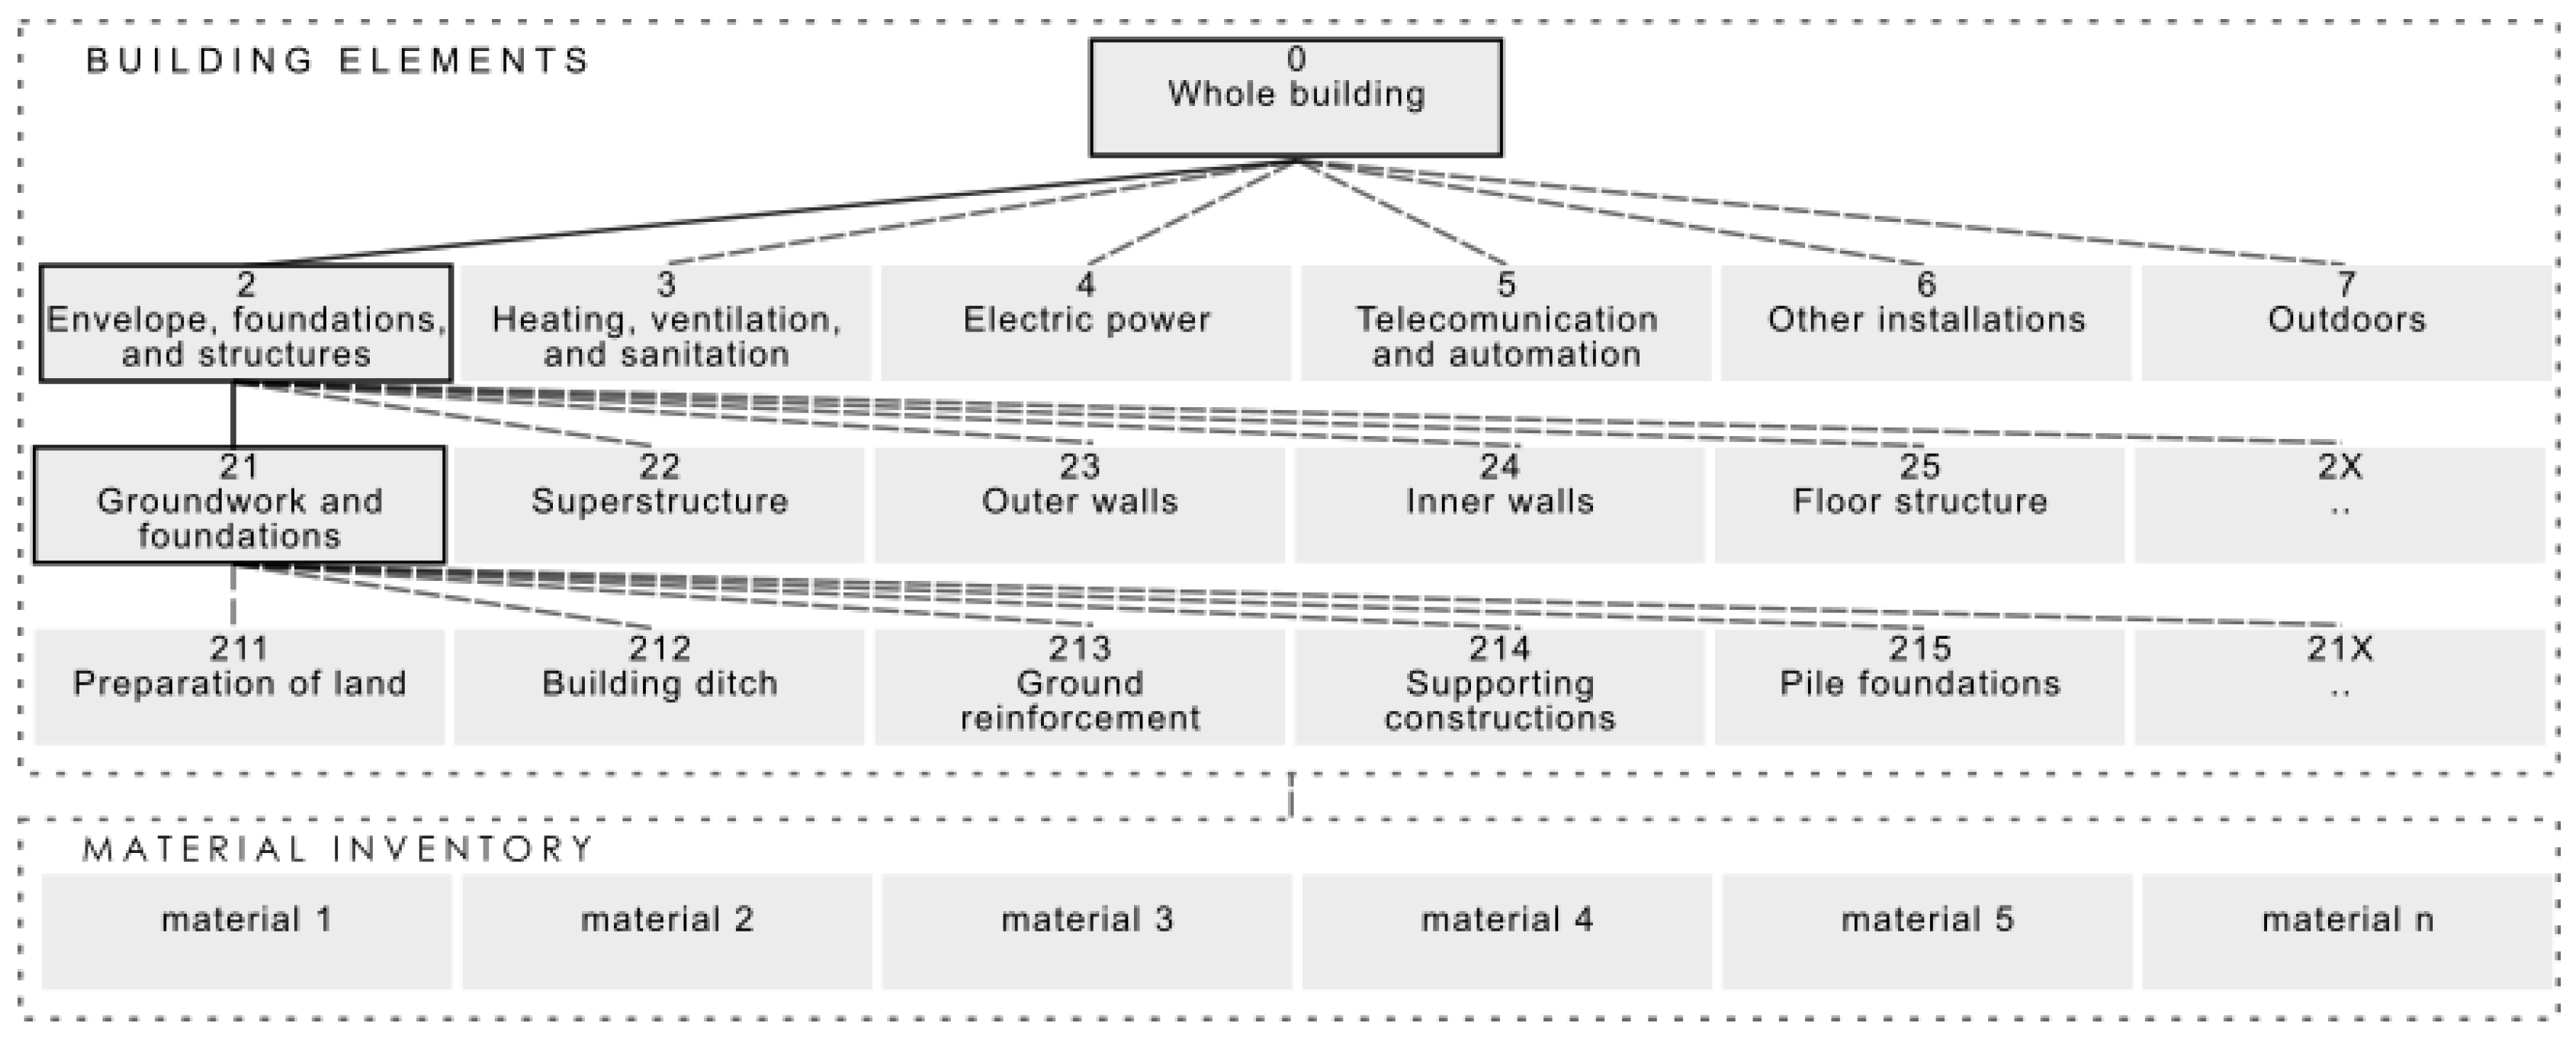
The third component, whose structure is illustrated in
Figure 2, consists of the building elements and the material inventory. Each building has GWP results from an LCA connected to it. These results are stored in a hierarchical building elements tree-structure, where the total result for the whole building is at the top level, with sub-elements that have increasing resolutions. This hierarchical structure is organized according to the Norwegian standard NS 3451 Table of building elements [
23], which has three sub-levels. This standard is widely used in the Norwegian context for assessing quantities, costs, and LCA organization of buildings. However, the tool is built for flexibility, and switching to a different category structure is trivial. These building elements are in turn optionally connected to material inventory entries, where each entry is associated with a material and include quantity, lifetime, transport distances and modes, and location of production. Furthermore, the emissions for each material inventory entry are calculated and stored in that entry.
Published research and other acquired study results come with varying data detail level. To be able to make use of these results regardless of the building element level at which they are reported, results can be added on a freely chosen level of resolution. Higher levels will be automatically calculated based on lower-level aggregation. Results with higher resolution reveal more information about where emissions arise and about study design. Consequently, a higher resolution is preferred but is not always available. To accommodate varying resolutions, there are two ways of entering GWP results: (1) entering results values directly into a chosen building element hierarchy level, or (2) entering material inventory data. The second option, which has the highest level of detail, involves selecting a material from the materials component, followed by entering material quantities, transport distances, and the expected service life of the materials. The material inventory entry will be associated with a chosen building element and building elements on all levels will subsequently be automatically calculated based on lower level aggregation. This last option is equivalent to conducting the LCA calculations from scratch and can also be used for this purpose.
In each case, the parent building elements are calculated as the sum of its subentries (where there exists any). If there are entries in the material inventory for a given building element, the material inventory emissions will overwrite any manually entered values in the building elements for that lifecycle phase. Likewise, if a value is entered into a building element, any values entered into a parent level of this building element will be overwritten for that lifecycle phase. In this way, entries on lower levels (higher resolution) have priority in the calculations and will overwrite entries on higher levels (lower resolution).
Results from building entries in the database may then be extracted with SQL queries, restricting the output to a chosen set of buildings, building elements, life cycle phases, inventories, and materials from studies that comply to some chosen set of parameters/criteria. In this way, the organization of the database makes it straightforward to query results and conduct analyses on the subset of entries where the chosen parameters/criteria apply.
2.2. Data Handling and Calculations Methodology
An emphasis has been put on making most data optional since data availability among building LCAs is a major concern. Although a full dataset is preferred, the lack of certain data should not exclude a building from being part of the database. Therefore, most attributional building data are optional. The same is true for materials. Likewise, a study can include a chosen selection of life cycle phases for the GWP results. These are organized according to the widely used European standard EN 15978 [
22] for life cycle assessment, which separates emissions into lifecycle modules A–D. However, most studies are using much narrower system boundaries, and many modules cannot be computed directly based on available data. This version of the database tool is, therefore, focusing on the life cycle modules that are most often observed in building LCAs, namely A1–A3 (material production), A4 (transportation to the building site), and B4 (material replacements throughout study lifetime period), which all can be calculated based on basic inputs. In addition, there is an option to manually enter emissions for the modules A5, B1, B2, B3, B5, C1, C2, C3, C4, D1, D2, D3, and D4 into the inventory entries and the building elements. The two remaining modules, B6 (operational energy use) and B7 (operational water use), are covered on the whole building level and are therefore stored in the buildings component. The minimum requirement for manually entered results is that they are separated into life cycle phases.
The LCA calculation method has two parts: first, the emissions from each material inventory are calculated from material emission factors, quantities, distances, etc., and then an aggregation of the inventory emissions is carried on through the building parts hierarchy.
If material inventory data exist, the GWP in the material inventory is calculated for the three phases A1–A3, A4, and B4. Module A1–A3 is the product of the unitary GWP emission factor for the material and the quantity of that material. Module A4 is the sum of emissions from up to three transportation modes, where each is calculated as the product of the emission intensity of the mode, the weight of the material, and the distance. Module B4 is calculated as the fractional number of replacements needed for that material throughout the study lifetime period, based on the estimated lifetime of the material which is provided as input. The transportation of these future materials to the building site is also calculated (in the same way as A4) and stored separately from the materials part. The building elements are then calculated as described in the section above.
The database is designed for flexibility and future needs, in that, categorical data can easily be altered and added by changing the rows of tables. The tool has been designed to detect and avoid several systematic errors, such as unit inconsistency, incorrect data entries, and similar, by controlling them before they are entered into the database. In addition, the tool benefits from the comprehensive error checking built into the MySQL language on which the database is based, which ensures data relations are correct when entering, altering, and deleting entries and prevents duplicate entries and incorrect data types.
2.3. Data Collection and Application
During a data collection period, 11 studies were acquired from various sources. Of these, five are from the Research Centre on Zero Emission Buildings [
29], and six are from two consultancy firms. All building projects are situated in Norway, where nine have been built, and two are concept buildings. Seven have full inventories entered into the database, while for the rest the results are entered at varying building element levels. There are three single-family residential buildings, two office buildings, five school buildings, and a swimming arena, all of which are designed with the goal of low lifecycle emissions. The buildings are in the following denoted by a letter (O: office, R: residential, S: school, SW: swimming arena) and a number, e.g., O1. The LCA calculation method applied in the collected studies was standardized and carried on to the calculation method in the bLCAd-tool which is described above.
3. Results
The building LCA database tool (bLCAd-tool) presented in this paper is designed to improve the transparency and reproducibility of embodied emission assessments of buildings by systematizing reporting, storing, and calculation procedures. This unified framework for systematically handling the data related to embodied emissions can, as already mentioned, be applied in various research and decision-making processes related to climate change mitigation. Some selected applications of the tool are presented and exemplified in this section. The capabilities of the tool presented in this section are
Transparent reporting of study results;
Comparing study results;
Benchmarking embodied emissions;
Exploring relationships between emissions and attributes;
The contribution from various building material categories;
Analyzing embodied emissions of neighborhoods.
3.1. Transparent Reporting
All data used in the studies are stored together with full resolution emission results and can also include detailed information about the building and study. Ideally, all this information should be made available for validation, replication, and further utilization of the results. In the cases where it is not, it should be specified what information is not available.
Table 1 lists the information that can be reported with the bLCAd-tool (refer to
Figure 1 or
Figure A1 for more details). The tool makes it straightforward to report this information in different formats such as csv, xml, json, sql, and html. This is done with an option for exporting entire tables or query results, where the query results can be any chosen composition of that information.
3.2. Comparing Study Results
The storage of emission results at a detailed resolution of building elements, and across life cycle stages, allows for comparison of multiple studies. While aggregated results are problematic to compare due to differences in system boundaries, results of individual life cycle stages for a certain building element allows for more representative comparisons.
Furthermore, the functional units (functions that are to be fulfilled by the buildings) vary (i.e., office/residential), and so does the requirements to obtain those functions (i.e., climate). Thus, grouping study results by building characteristics such as typology, geography, and energy ambition level, and then normalizing by morphological parameters such as areas and volumes, increase the validity of the comparisons.
Figure 3 shows the emissions attributed to material production (A1–A3) and replacements (B4) from the building element category labeled “Envelope, foundation, and structure” for 11 buildings, separated into sub-building elements. The emissions are normalized by each building’s heated floor area and a 60-year lifetime and are grouped by the typologies office, single-family residential, school, and swimming hall. All the buildings are designed for the Norwegian climate and all had the ambition of reducing embodied emissions.
Although the total emissions for “Envelope, foundation, and structure” are similar for some of the buildings, increasing the resolution of the results shows that there is large variation in how the emissions are distributed across sub-elements and life cycle phases, thus emphasizing the importance of adequate resolution when comparing study results.
3.3. Benchmarking Embodied Emissions
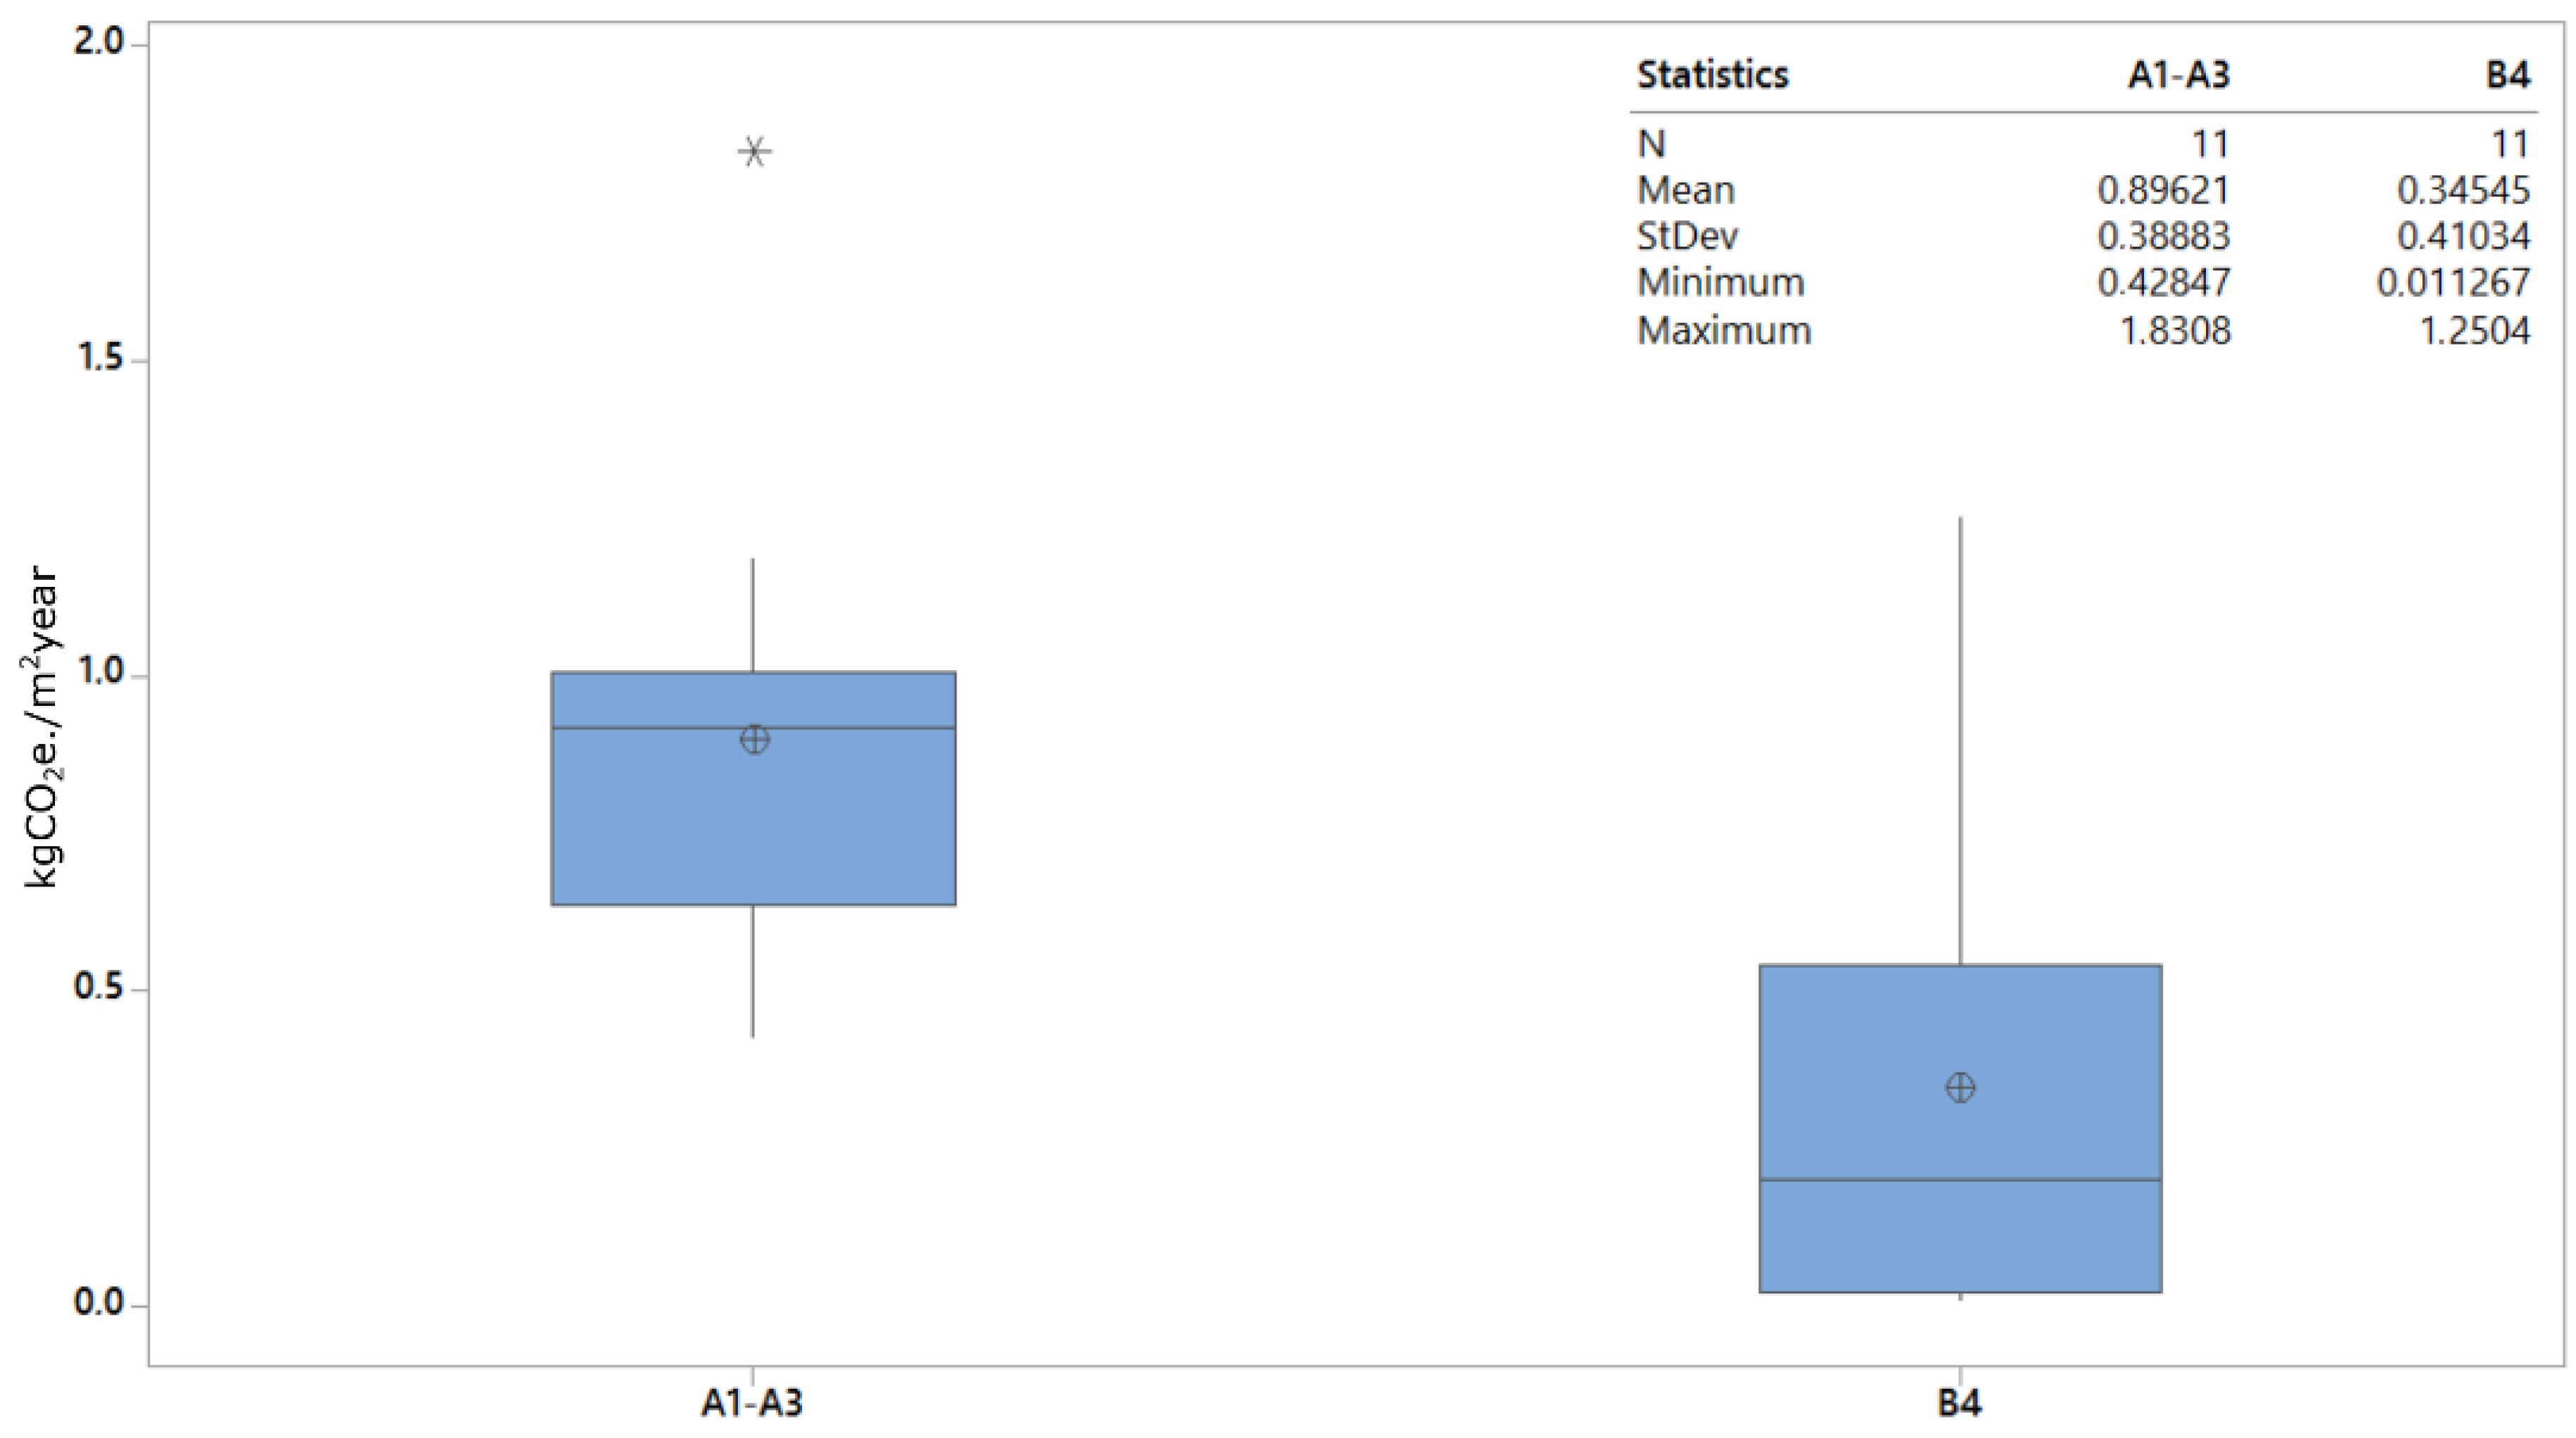
One way to establish embodied emission benchmark values is to base them on statistics from current industry practice. Although the current dataset used in this analysis is not sufficiently large for representative benchmarks on detailed building element levels, it is a first step toward practically useful benchmarks. With high-resolution results from a sufficient amount of representative buildings, embodied emission values can be standardized and used as benchmarks that other building projects can be compared against. In the same way as described above for comparing results, the buildings should also here be separated by their functions. This will make the benchmarks representative for specific typologies, geographies, etc. Likewise, emissions for each building element is dependent on different factors, some that can, and others that cannot be easily influenced during the design and construction phases of a building project. For example, the groundwork and foundation are dependent on the ground conditions at the site, which cannot easily be influenced, and the weight the foundation must be able to carry, which can be influenced by e.g., the building height and construction type. Ideally, benchmarks could be established based on such conditions for every building element. However, this implies a sufficient amount of data on these resolutions. When reliable benchmarks are available, building projects can use them as a frame of reference both on the building, building-element, and inventory level individually for each life cycle phase.
Figure 4 shows an example of the distribution of the embodied emissions per floor area and lifetime for the building element “Outer walls,” including all buildings in the database.
3.4. Exploring Relationships between Emissions and Attributes
There are many factors that affect the embodied emissions of buildings. The relationships between variables in the database and the resulting emissions can be explored with statistical methods. Examples of such relationships are how the emissions of building elements (e.g., outer walls) relate to corresponding areas (e.g., outer wall area), how emissions from the foundation relate to the weight of the building, or how well the total quantities of different materials (e.g., metals, timber) can predict their corresponding emissions. The weight of each material inventory entry is another such variable. In
Figure 5, the weight of the items in the inventory of the database is plotted against the emissions from life cycle phase A1–A3. The relationship between the two variables is explored through a regression model that, for such a simple model, has relatively high predictive power. This example was chosen because the inventory dataset in the database had a sufficient size (
n = 326). One outlier was removed, which related to an unusually large amount of concrete ground reinforcement. The data points in the figure are unevenly distributed but serves to demonstrate the purpose. With a more complete dataset, more complex relationships with multiple explanatory variables such as building attributes, material categories, etc., as described above can be explored.
3.5. Contribution from Building Materials
In addition to emissions from building elements, practitioners should also be aware of which materials and components that normally have the highest carbon footprint. This is useful in the design phase when making choices between construction types and materials, and during the construction phase to reduce waste. The lifetimes of the materials and components are important, since choosing long-lasting products is an effective way of reducing the lifecycle carbon footprint.
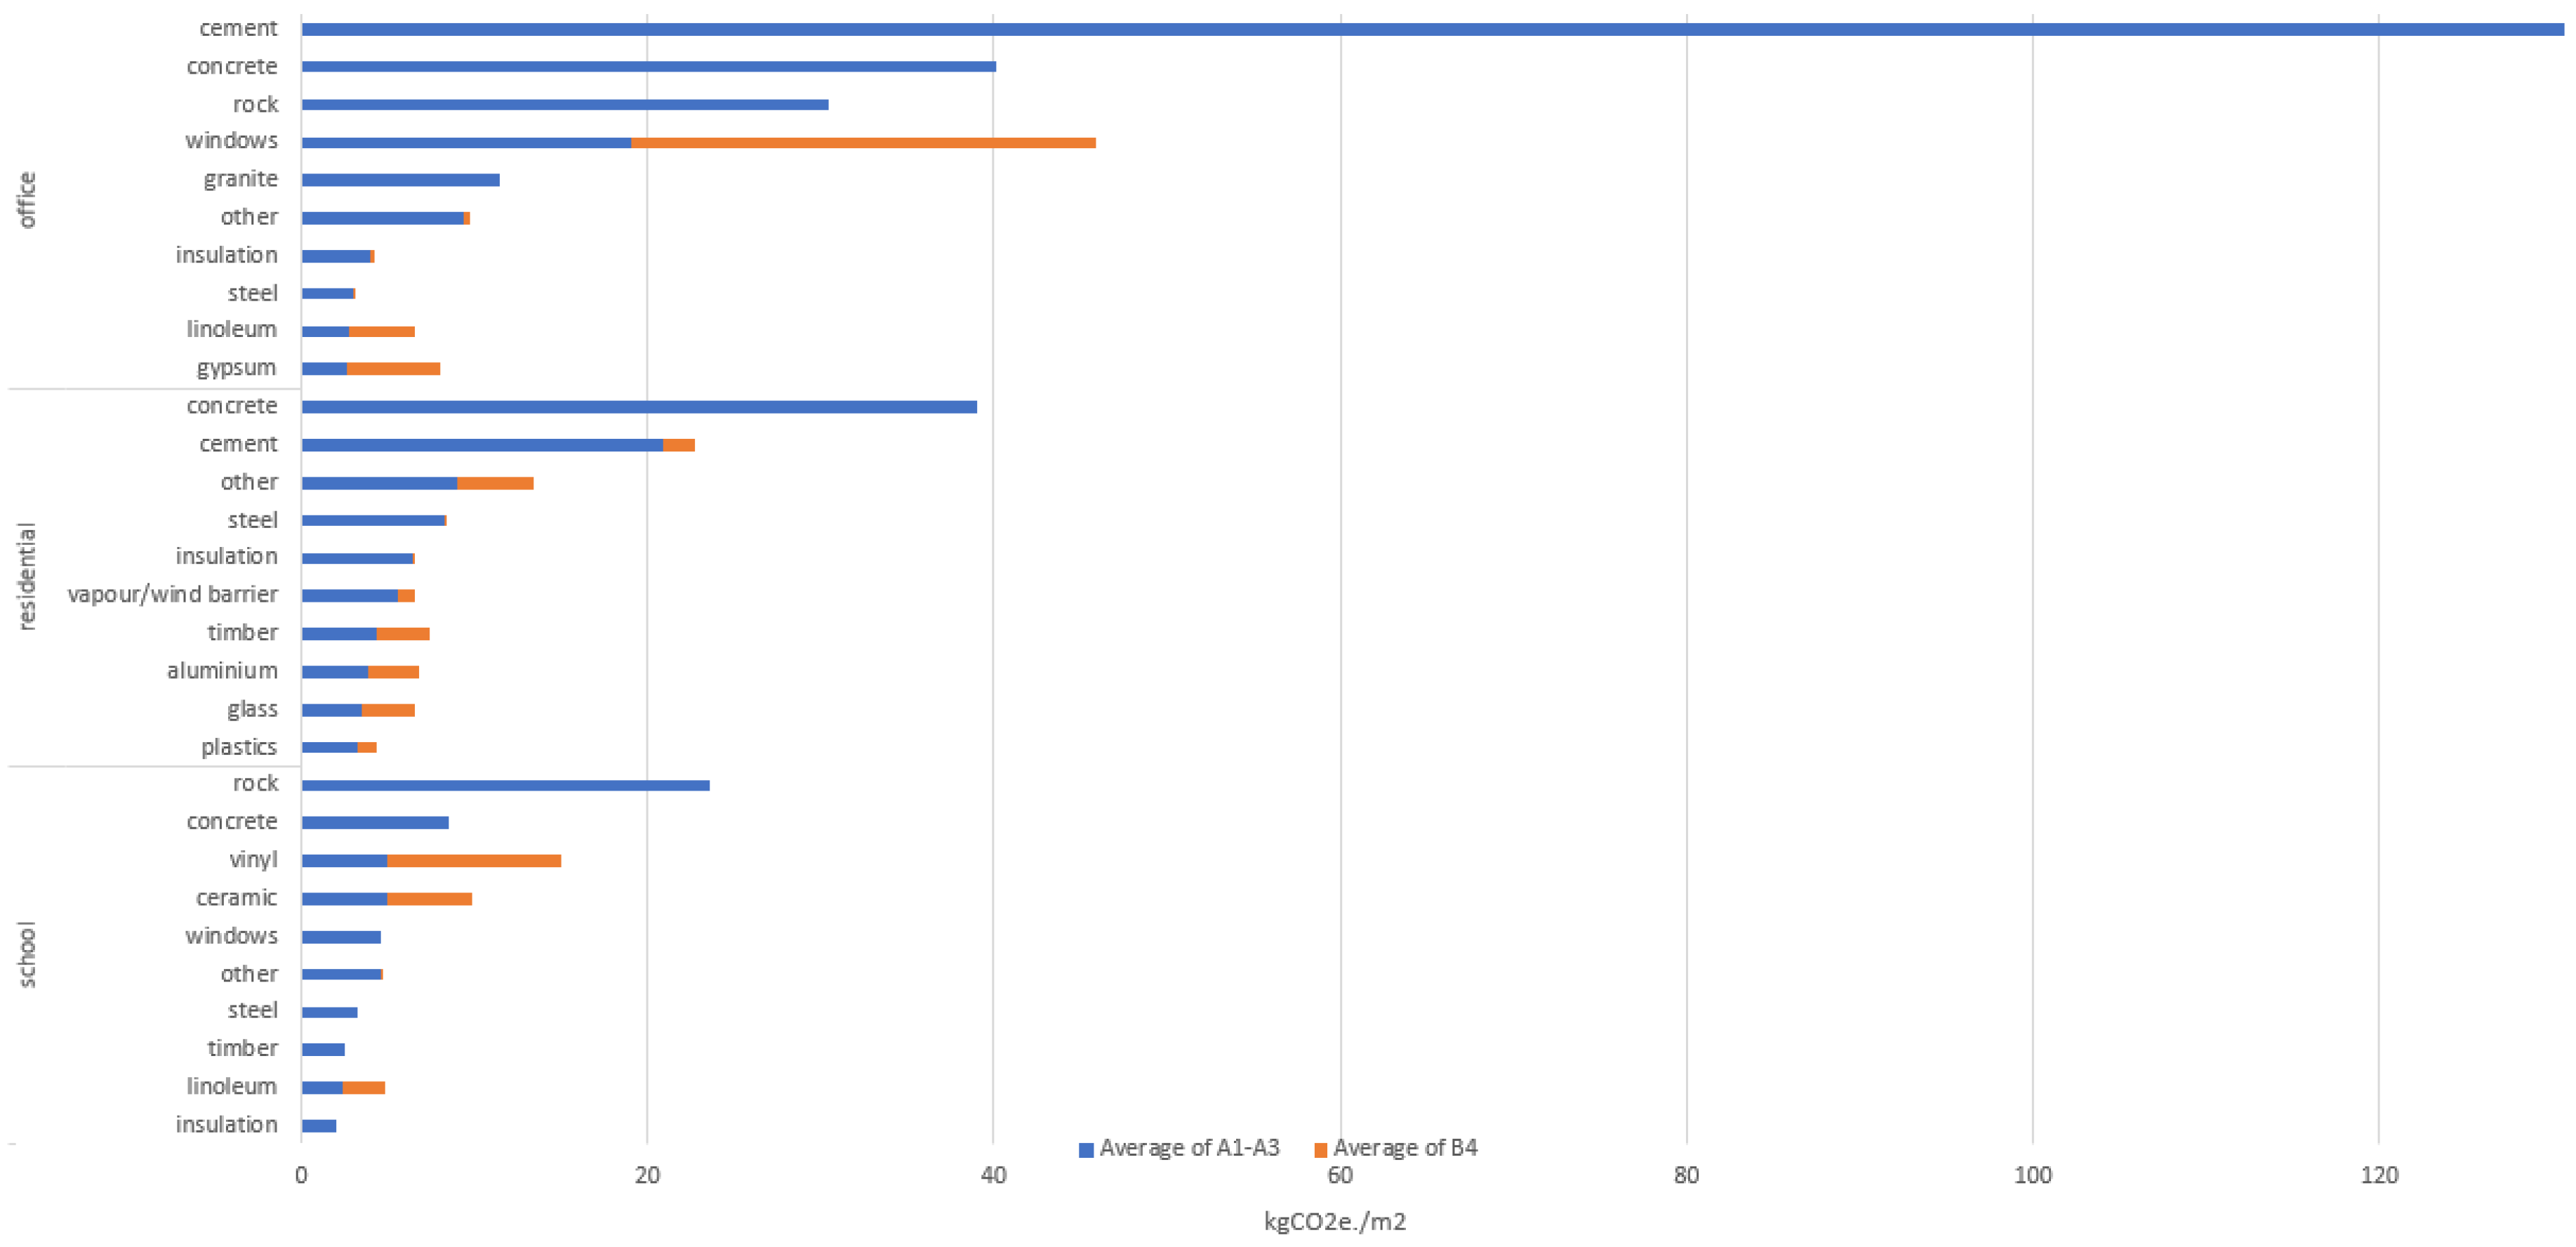
Figure 6 shows the ten types of material groups within each typology that on average have the largest embodied emissions from their production per floor area, for the building element “Envelope, foundation, and structure,” based on the buildings collected in this study. A1–A3 shows the initial emissions, while B4 shows emissions from replacements needed over a 60-year period. Alternative materials or materials from clean manufacturers should be considered for material groups with high impact from A1–A3. Long-lasting products should be sought after for material groups with high impact from B4.
3.6. Embodied Emissions of Neighborhoods
One of the important components of neighborhoods in terms of emissions are the buildings, while other components include infrastructure, roads, open spaces and public areas, and the transportation system. In the present version of the bLCAd-tool, the focus is on the buildings. The tool can be further developed so that neighborhood objects other than buildings, such as roads and infrastructure, vehicles, public spaces, and more, can be included.
In an LCA of a whole neighborhood, the data rapidly becomes very complex. The standard solution to reduce this complexity would be to aggregate the results for each building. However, this reduction of resolution reduces the usefulness of the results. The advantage of a tool such as the bLCAd-tool in a neighborhood application setting is that all buildings in the neighborhood are stored together with full results and data source resolution and are compatible. Information about the buildings, GWP results, materials, and data sources can thus easily be compiled in any preferred composition, and analysis can be directly performed. The functions served by the neighborhood such as total housing, workplace, school, and kindergarten floor areas and volumes can easily be extracted. The total roof area is available for solar potential estimation. The aggregated heat loss number for the whole neighborhood can be calculated, and the simplified total annual emissions from the operation are available for different energy standards. Furthermore, the embodied emissions for all buildings can be simultaneously investigated, such as the emissions associated with individual building parts or emissions from transportation of materials to the construction site and how it relates to the distances to the production sites. Materials can also be analyzed at the neighborhood level, based on quantities, material categories, and emission factors. In cases where material inventories are not available for a building, estimates based on the other buildings can be used as a proxy for its embodied emissions.
Some development projects have a stated goal of becoming a “Zero Emission Neighborhood” by offsetting embodied emissions with renewable energy production on-site so that the net emissions reach zero over a set study period. As this “carbon budget” includes the whole neighborhood rather than individual buildings, it is beneficial to have aggregated numbers easily available. The bLCAd-tool can be used to analyze such an area. As an example, the data from the buildings in the current database have been used to demonstrate the application of such an analysis on the neighborhood level. The distribution of emissions across typologies, buildings, and the life cycle phases included in each study are shown in
Figure 7a, which shows the distribution of emissions for a thought neighborhood setting with the buildings in the database.
Figure 7b shows emissions from material production in initial construction (A1–A3) and replacements (B4) grouped by material group, which can be used to determine the largest potential for emission reduction.
4. Discussion
This paper has presented a database tool that systematizes embodied emission assessments of buildings by characterizing buildings as a hierarchical set of building elements, themselves composed of materials, to offer a high-resolution breakdown of their embodied emissions. In addition, the emissions are separated into lifecycle stages according to the European EN 15978 standard. Using this approach on a number of buildings will help produce systematic data that can then be used in statistical analysis to produce more reliable embodied emissions figures. Such applications were then demonstrated based on 11 previously conducted LCAs of Norwegian buildings. This systematization helps address the current inconsistency in reporting embodied environmental flows of buildings.
The characterization of emissions follows a logical structure based on adopted standards. The hierarchical structure of building elements is based on the Norwegian standard NS 3451 which by no means is the only way to perform such a breakdown. It is suitable in the setting of this study since the collected LCAs conform to this standard, however, alternative categories might be better suited for other geographical regions or other contexts. The hierarchical categories can easily be altered and are likely to be developed to suit different needs in the future, among them the inclusion of infrastructure to model neighborhoods. The breakdown of the lifecycle stages is done in accordance with EN 15978, where all modules A–D are implemented. Although many of these modules are excluded in most LCA studies, there is a possibility to include them in cases where this data exists.
Although previous studies have adopted a similar logic of a breakdown of a building’s environmental flows into sub-elements and life cycle stages [
16,
24,
25], as far as the authors are aware, no such database model for a complete characterization of all building elements and life cycle stages has previously been presented. In particular, in contrast to previous studies, the database model presented here has a focus on standardization and integration of existing studies into a common format to increase consistency and comparability.
Going forward, an extension of the model to include infrastructure is necessary to realistically model neighborhoods. This will be achieved by extending the hierarchical structure of building elements to also include the remaining neighborhood elements. In addition, the database component for storing building information must be extended to also include information on the infrastructure.
The SQL database used in this paper is a relational database that in addition to storing entered data also stores empty fields where data is not available. Considering the incompleteness of LCA data the proportion of empty fields is notable. Currently this is not a problem since the number of studies collected is limited, however, if the amount of studies increases significantly, a non-relational database may be considered as to save memory and increase performance.
The current database tool is able to store process-based LCAs while input-output and hybrid LCAs are outside the scope of this work. Most studies to date are applying the process-based LCI technique; the database thus has a large potential to utilize this pool of existing studies and future studies applying this technique. However, since process analysis is known to underestimate results, future work should consider an additional integration of the other LCI techniques. Such an integration of hybrid analysis can be made possible by the inclusion of the cost of materials and input-output based environmental impacts of materials and processes.
Life cycle assessment involves a great number of parameters and choices made by the analyst. In such contexts, mistakes will occasionally happen; either systematic errors, random errors or simply unreasonable choices made in the study design and throughout the process. Such mistakes will inevitably happen when a data-intensive method like LCA is carried out manually. Such errors were found in some of the collected studies and were corrected for in the bLCAd-tool. Random errors from variations in parameters as well as unreasonable choices made in the study design are also detectable with the tool. Outliers can be identified by comparing the results with representative materials, quantities, and buildings in the database, where anomalies can be further investigated.
The current database design is customized for the context of the collected studies but is built for flexibility. The categorical data can easily be customized to different needs, while the general database structure is likely to evolve. Although the collected studies are performed according to the Norwegian context, there is no limitation on the integration of studies from other geographical regions, as all that is needed is a sufficient data resolution to enable a breakdown into building elements and life cycle phases. The tool is especially well suited to handle large quantities of assessments. The database scales seamlessly, and as the size of the database increases, its utility increases with it. The flexibility of the query structure makes the access to the data a big advantage. Data can be assembled and pivoted across building attributes, building elements, inventory, and materials to access the information relevant to a specific purpose.
In this study, the dataset was limited to 11 buildings that span many buildings types. It follows that the analysis should not be taken as representative of buildings in general; rather, it expresses the results found in the collected studies and the variations between them. The results in the applications presented here are indications based on this sample, and results are likely to change considerably as the sample size increases.
The deployment and systematical use of such a database must ultimately happen through adoption by practitioners. This can take place as standards and buildings regulations adopt reporting schemes for embodied emission results. These reporting schemes should require high resolution on results such as presented in this paper, in a digital, universally compatible format. To facilitate this deployment, the data entering process of the database must in future work be streamlined and simplified, taking into consideration the time-constraints of practitioners. This roadmap will enforce a standardization of embodied emissions results for buildings.


