Article

Study on the Leaves Densities as Parameter for Effectiveness of Energy Transfer on the Green Facade

1
Department of Architectural Design, Vocational School, Diponegoro University, Semarang 1269, Indonesia
2
Department of Mechanical Engineering, Faculty of Engineering, Diponegoro University, Semarang 1269, Indonesia
3
Department of Architecture, Faculty of Engineering, Diponegoro University, Semarang 1269, Indonesia
4
Department of Physics, Faculty of Mathematics and Sciences, Diponegoro University, Semarang 1269, Indonesia
*
Author to whom correspondence should be addressed.
Buildings 2018, 8(10), 138; https://doi.org/10.3390/buildings8100138
Submission received: 30 August 2018 / Revised: 27 September 2018 / Accepted: 29 September 2018 / Published: 1 October 2018

Abstract

:
This research involves the study of two models of green facades and a model of bare wall. A house miniature was used as thermal lab. The aim of the project is evaluating the performance of energy transfer based on the various leaves densities on the green facade. Heat calculation was used to calculate heat transfer on the wall surface. There are two kinds of leaves densities, 50% and 90%. The data measurement show that the green facade has a significant cooling effect and more visible for the facade with higher leaves densities. Respectively, from experiment I to experiment III, the average of heat fluxes are 22.35 W/m2, 8.76 W/m2, and 0.60 W/m2 where in experiment III, the negative heat flux occurred during day time due to interior surface temperature is higher than exterior surface temperature. Lastly, higher leaves densities possibility can create a better cooling effect but also has the risk of creating higher relative humidity, especially for the interior air layer.

1. Introduction

Recently, greenery aspects on the buildings started to take important place due to their concept as mitigation in urban heat island [1,2]. Even though it is not a new innovation, it still has not been recognized as an energy saving system, especially in the urban environment.
Chen et al. [3], resume three technologies relate to vertical greenery systems, as following:
  • Green facades refer to applying climber plants which are planted directly in the ground or in planter boxes, and are managed to grow directly on building surfaces or by using wire or trellis frameworks as supporting materials [4,5,6].
  • Living wall constructed from modular panels along with a watering system. The vegetations placed in the substrate inside the modular panel and attached on the walls. Usually, living walls use small vegetations such as small shrubs and grass that naturally do not grow higher [4,5,6,7].
  • Bio wall is a kind of vertical greenery system that applied on the interior wall surface [5,6].
In the previous studies, a number of outstanding public and private benefits can be provided by vertical greenery system, such as aesthetics, acoustic, social, ecological, and environmental benefits [1,8,9,10,11,12,13].
From the previous researches related to the potential of vertical greenery system as a passive cooling design, it can be concluded that the most interesting parameters are the cooling period, the species of vegetation used, the orientation of the facade, the leaves densities or the percentage of foliage coverage and the air temperature between the greenery layer and the building facades [1,14,15,16,17,18].
The benefit of plants on the building facade is important, especially for better sustainability in the built environment. Compared to synthetic materials such as plastic or metal, a vegetative facade does not radiate back the heat of solar radiation into surroundings of the building and makes the surroundings of the building cooler [19]. Hunter et al. [4], also proved that green facades, like other green technologies are more and more being considered as a future design to cooling down building temperature, saving energy consumption of the building and mitigating urban adaptation to an area that has warm climate. Photosynthesis and evapotranspiration use solar radiation that can effectively prevent temperature increase [6].
Series of studies have been conducted to prove the effect of vertical greenery systems on the building. An initial study established in Singapore by Wong et al. [20], proved that facades with vertical greenery system has maximum temperature decrease compared with bare wall. Further result also discover that the position of plants on the vertical greenery system will affect the temperature decrease.
In Sailor [21], model with vegetated facade can save 5–10% in the consumption of electricity. However, when all facades were using vertical greenery systems, possibility can improve energy saving from 35% to 90% [22]. These results are similar with a previous study by Hoyano [23], where the potency of solar radiation reduction in the veranda was reaching up to 60% for sun shading and 1–3 °C on air temperature reduction from a climbing plant type vine. A comparative study by Sunakorn and Yimprayoon [24], also proved that in the building with natural ventilation, climbing plants have potential to decrease indoor air temperature and remain cooler than the control room during daytime.
A more interesting study conducted by Wong et al. [1], using eight different vertical greenery systems, one of the results said that the effect of temperature reduction depended on the foliage densities. There is a correlation between leaves densities and temperature reduction. However, these results cannot be generalized as a conclusion for the effect of leaves densities to temperature reduction because the study is done in a different construction system and there is no further description related to leaves densities.
In previous research by Laopanitchakulet al. [17], three chambers were used to observe the effect of leaves densities in green facade on temperature decrease. The result is the higher leaves densities has better quality in temperature reduction. Further discussion also expandin the effect of distance toward effectivity of climbing plant in reducing heat transfer inside building. Still, the calculation on the heat flux seem do not explain yet.
In particular, similar studies were also done by Perez et al. [25], where the reduction of shadowed area of double skin facade can reach up to 5.5 °C in sunny times in August and reach maximum value of 15.2 °C on the facade facing South-West in September in Mediterranean continental climate. Perini et al. [26], achieved average reductions of 2.7 °C and Koyama et al. [27], also discovered average reductions of 3.7–11.3 °C with foliage coverage between 15% and 54%.
Related to the benefit of vertical greenery system for building energy saving, originally, this concept service occurred due to sun shading provided by plants canopies. Highlights from these previous studies are the relation between the shadow effect, densities of leaves, and temperature reduction. Although, the previous studies have used leaves densities in order to characterize the potential of vertical greenery system as a passive tool energy saving, the data available are still rare, especially in tropical area where reduced heat is crucial for keeping the spaces in comfortable conditions.
Particularly, this research is discussing the thermal performance of vertical greenery systems in buildings. The study compares two models of green facades and a model of a bare wall. The model was built to look alike houses and can be called house miniatures. The objective of the study is evaluating the performance of energy transfer on the building facade based on the various leaves densities of the green facade. The evaluations include performance of wall surface temperature, air temperature, and heat flux on the wall.
In addition, the paper tries to establish an easy method to calculate leaves densities in the green facade, so that it can be applied in further research and architectural projects. Heat calculation was used to calculate heat transfer on the wall surface.

2. Methodology

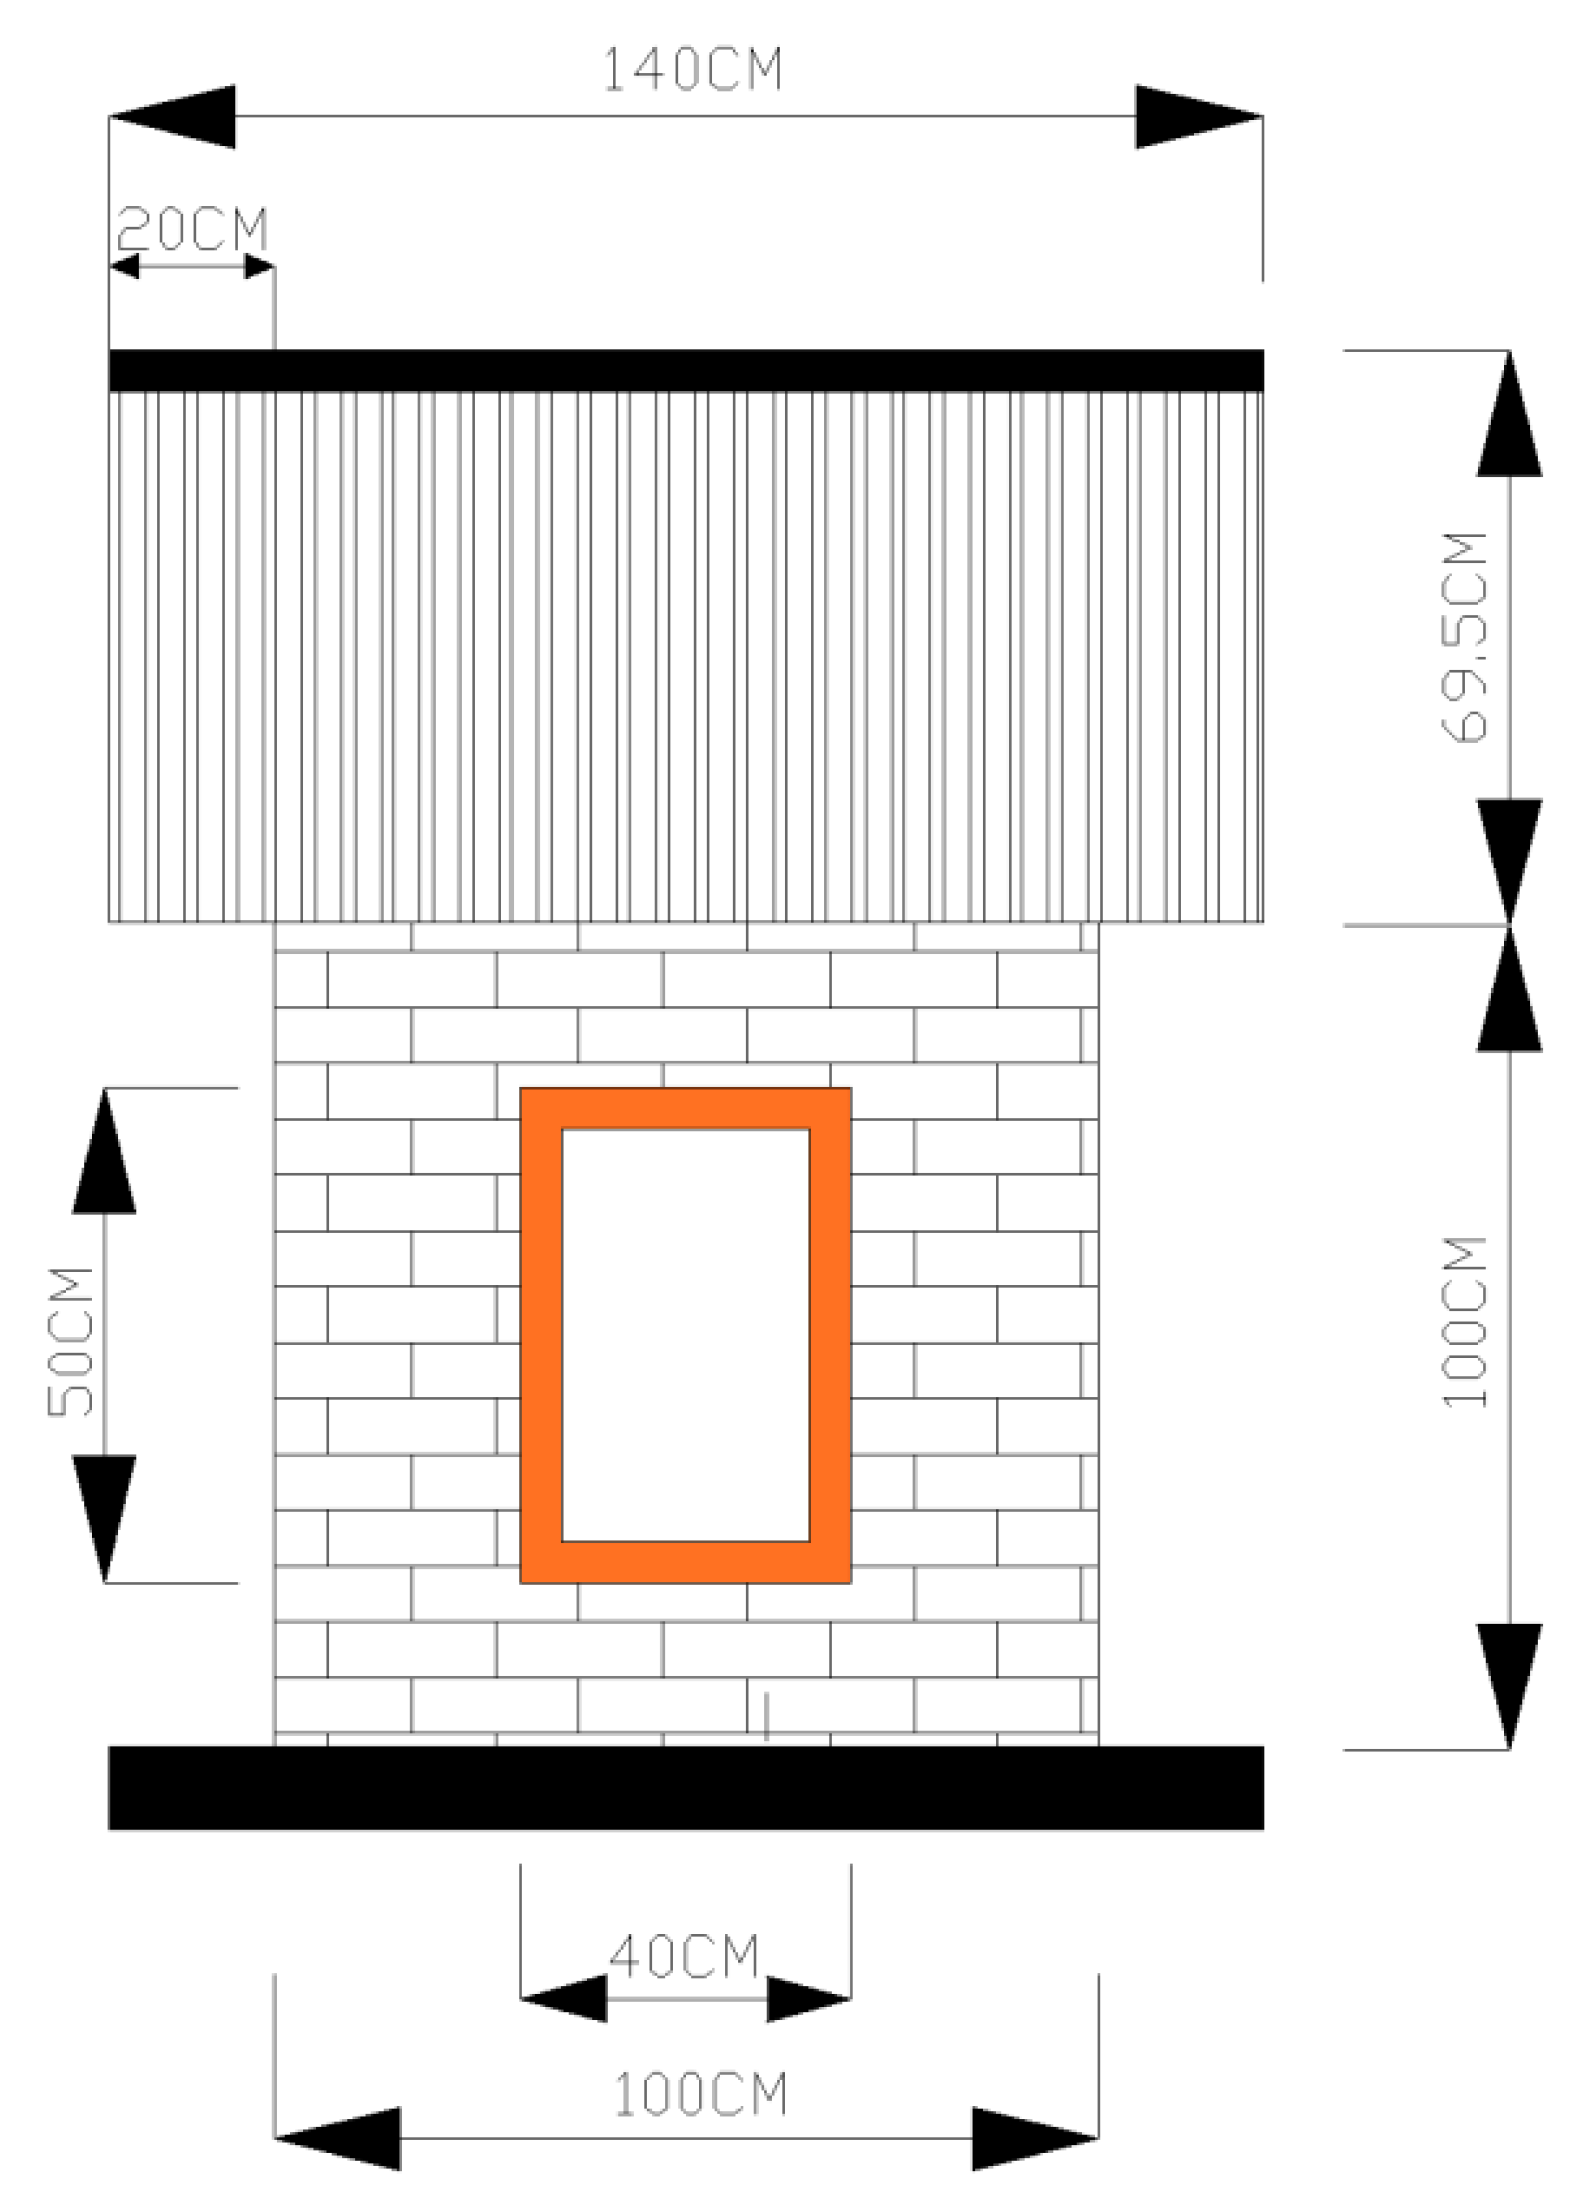
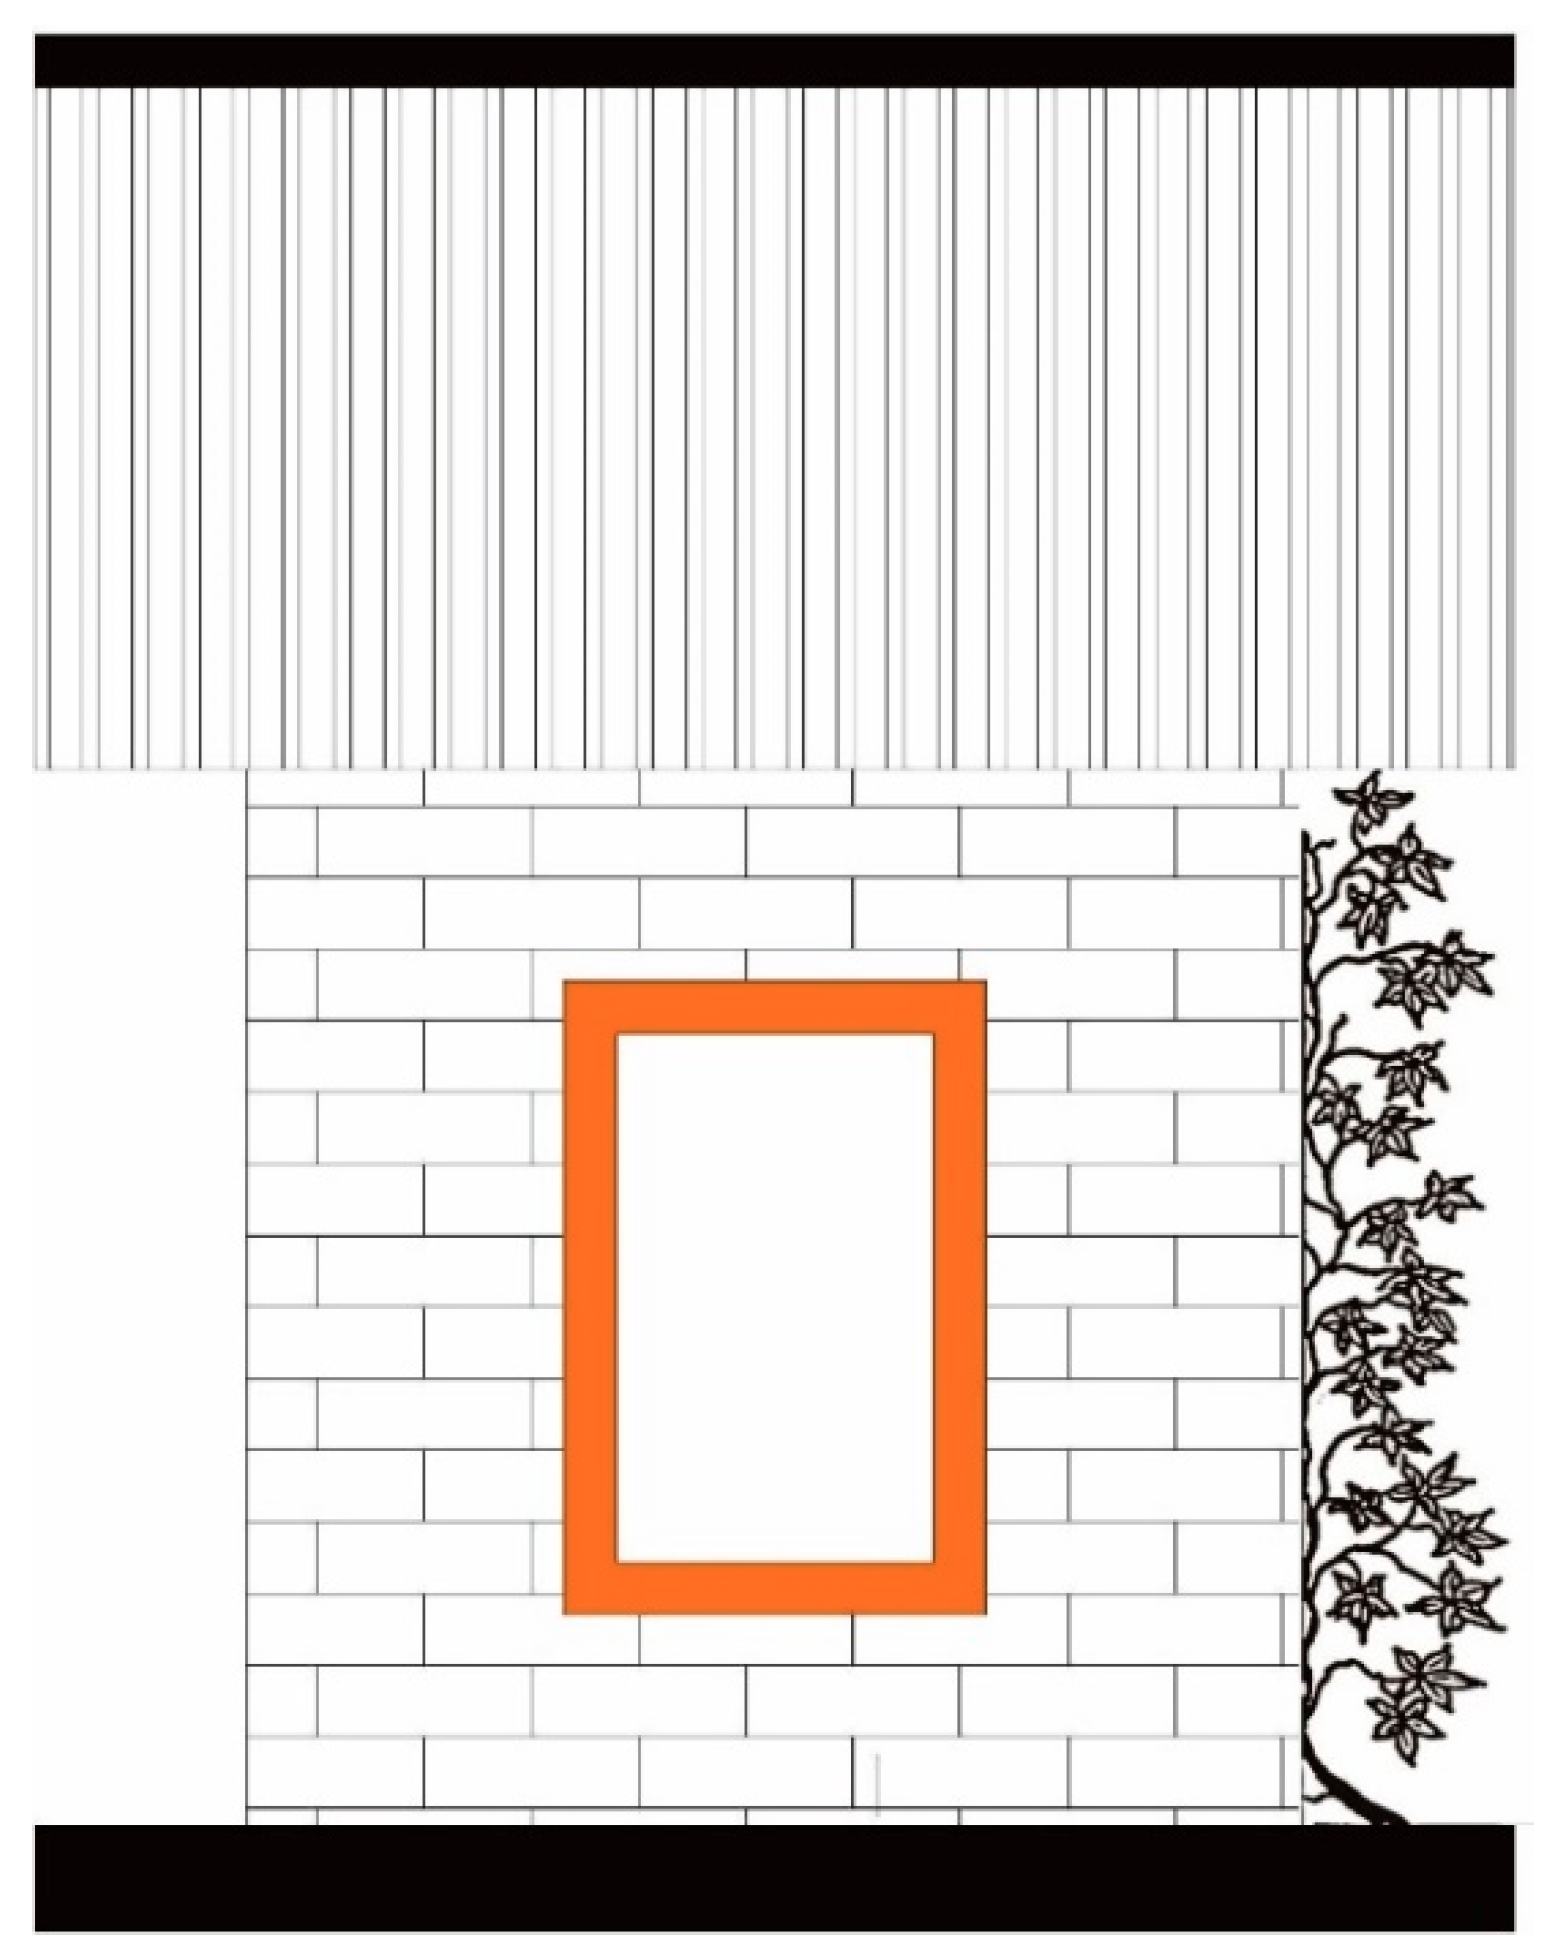
2.1. Design of Model

An experimental approach is used in this research. A miniature house was used as thermal lab can be seen in Figure 1. The walls were built from bricks and the roof of the model was built using tile roof. The model has two small windows as inlet and outlet that allow air circulation and heat inside the model.
Compare to real building, the scale of model is 1:4. Walls as measurement object have dimension 1 m × 1 m. For the details of dimension of the model, can be seen in Figure 2. While the details of building material can be seen in the Table 1.
As for the detail of physical and structural parameters of miniature house are shown in Table 2.
The east wall is attached with green facade using climbing plants: Passifloraflavicarva and Pseudocalymmaalliaceum. These are evergreen species and based on the observation these species have wide leaves surface so the leaves densities are denser than other climber plants species in this area. Possibility, it will influence the amount of solar gain for thermal balance in the building. Therefore, studies in the area with different seasons of the year, using deciduous species are important to consider [28]. East wall chosen as object measurement because this part get more solar radiation in the morning and high solar radiation directly during afternoon [18]. It will influence the increasing temperature in the building and as consequence, this part needs more protection.
Three series of data measurements were done during December 2013, namely experiment I, II and III. The different among experiments are in the leaves densities of green facade. First, for model without green facade (leave density 0%), second for model with green facade 50% (experiment II), and third for model with green facade 90% (experiment III).
There are no detailed assessments related to the proportion of the vegetation distribution in each experiment. However, based on the observation, both Passiflora Flavicarva and of Pseudocalymma alliaceum have balanced distribution. Due to dissimilar condition with previous studies, it is very unsafe to compare the results from previous studies to the results in this study directly.
Because of limited model, experiment I, II and III were done using one model that simulation in three experiments. There is 2 days different for each experiment. One day for set up the green facade and one day for adapting green facade on the model. Detail of configuration in each experiment and the average of local climate condition during each data measurement based on the Maritime Meteorology Station of Semarang City can be seen in Table 3. The different in each data measurement are 2% for humidity, 0.52 °C–1.4 °C for air temperature and 0.2 m/s–0.5 m/s for air velocity. Those days was sunny and there are no much different in local climate condition.

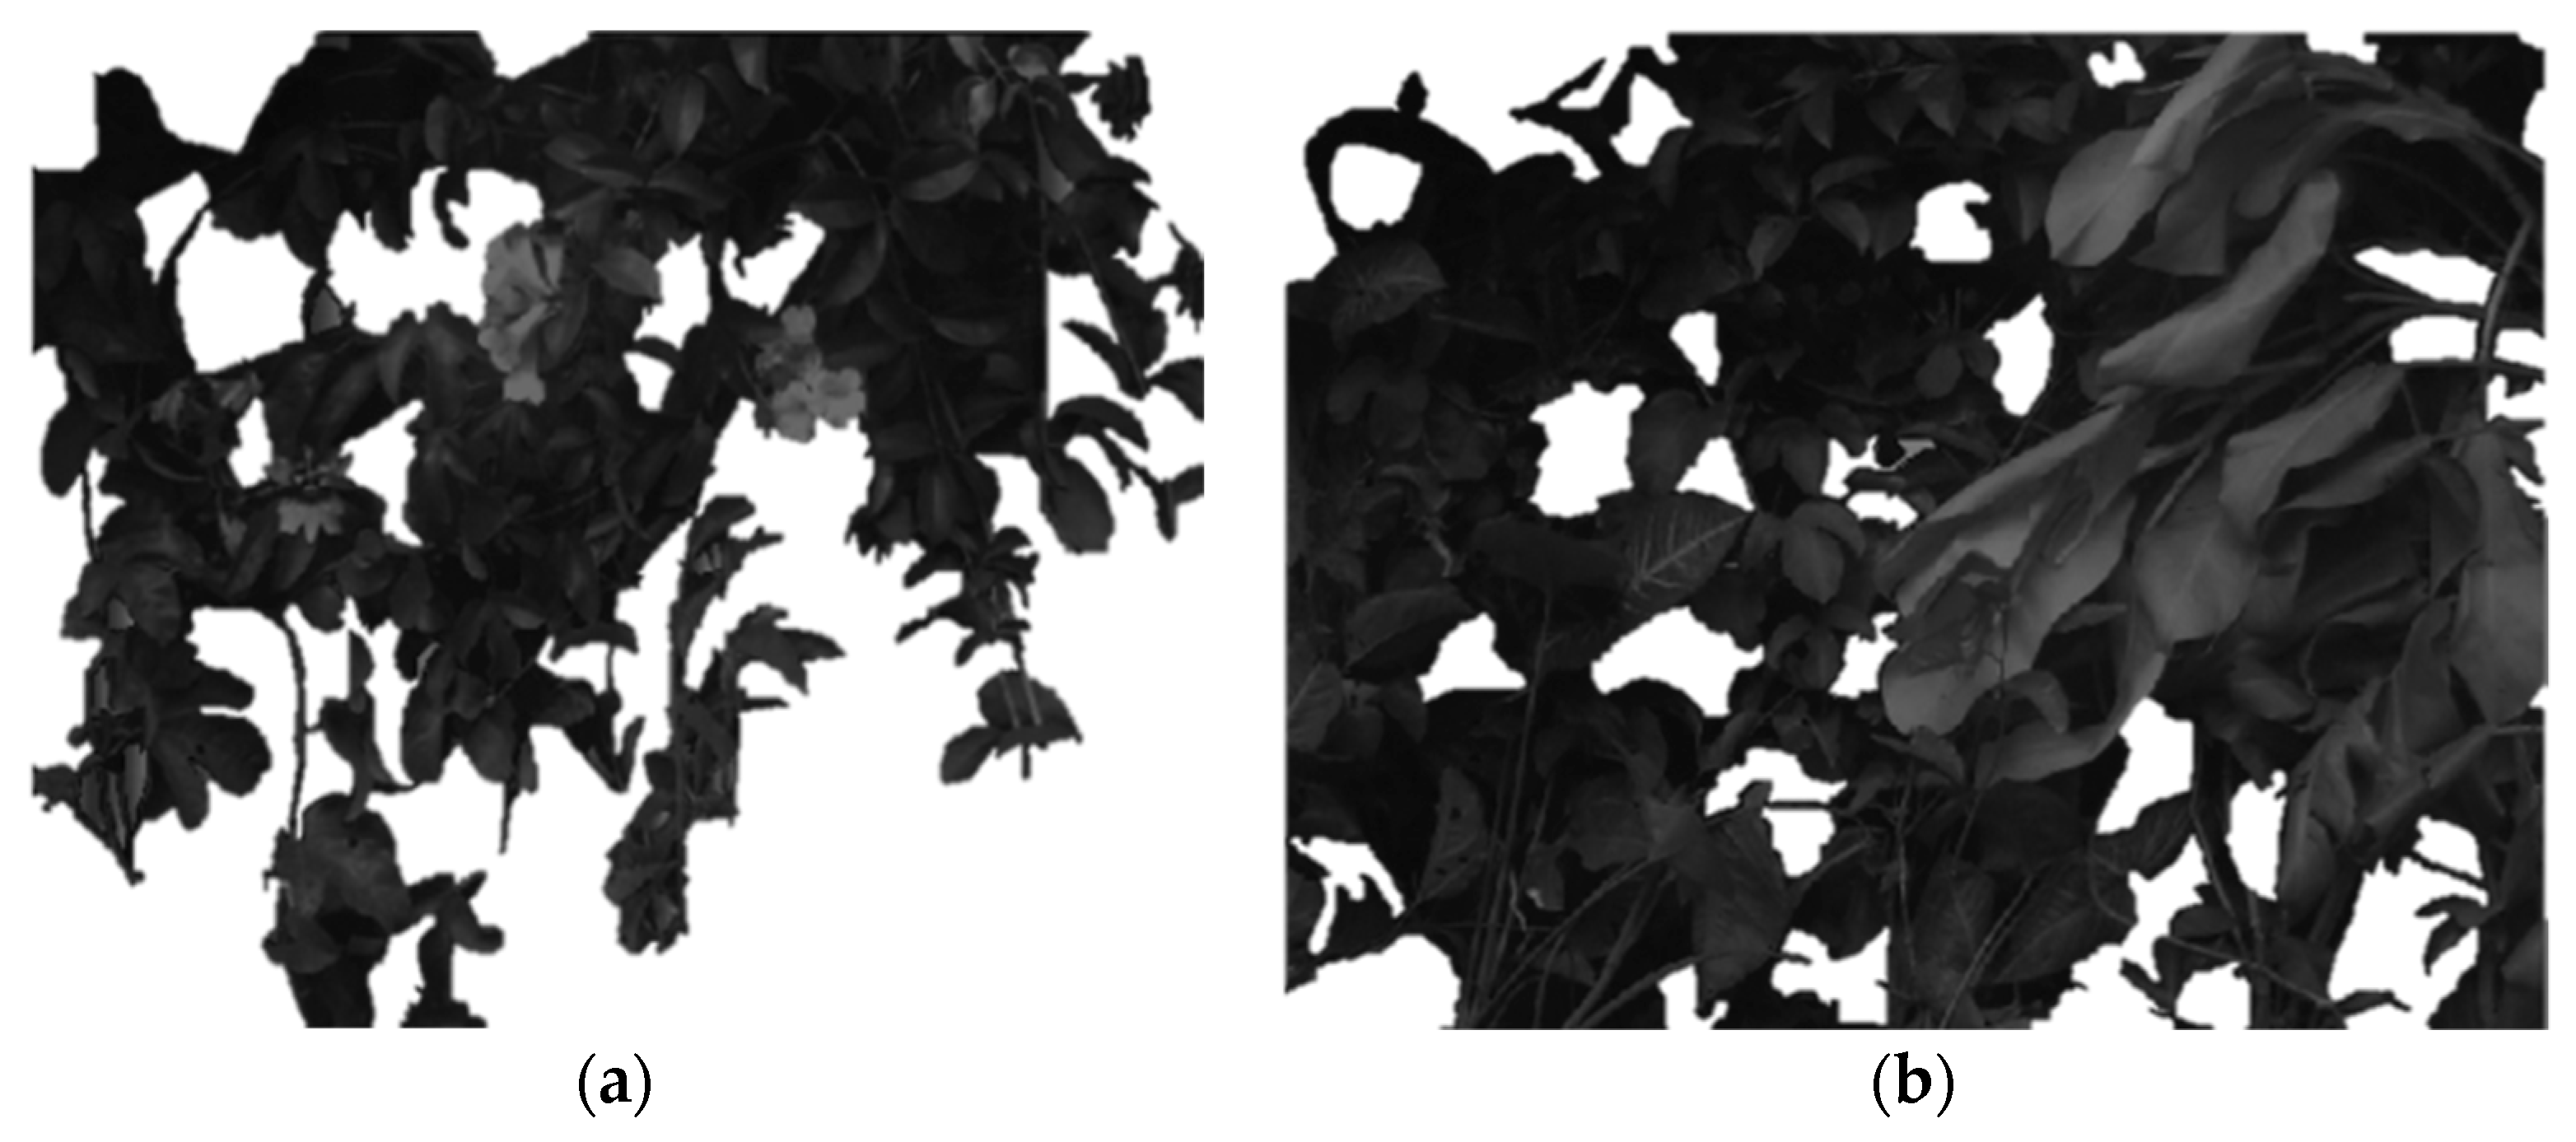
2.2. Leaves Coverage Calculation

In this research, we studied leaves coverage area which determine in 2 levels: 50% and 90%. Two different plant species, Passifloraflavicarva and Pseudocalymmaalliaceum were planted in the box planting for three months before used for the experiment.
In every week, the documentation of green facade will be taken as an initial simulation to arrange the leaves densities. From the simulation, there are 10 variations of leaves densities from 0%–100%. To determine the area that covered by green facade, a calculation using AutoCAD was done. Simple calculation for leaves densities (LD) was done based on the domination theory by Odum [29], as follows:
LD = L 1 × 100 % L 2  
where LD = Leaves Densities, %; L1 = The area that covered with green facade, m2; L2 = Entire area of object measurement, m2.
In the previous study, observation on the green facade with coverages area 50% and 90% has been done by Laopanitchakul et al. [17]. Then, the latest study in Beijing was conducted by Qin et al. [30] also measured in situ coverage area on the green walls with 100% greenery coverage ratio. A computational fluid dynamics (CFD) simulation was done as a validation [30].
In this works, we compared performance for reducing heat transfer between models with and without green facade. Different with previous studies, the chosen coverage areas are 37%, 64%, and 87.5%, can be seen in the Figure 3.

2.3. Heat Flux Calculation

The aim of heat flux calculation is to express quantity of energy (q) that passing through a material per area (m2). Previously, heat flux calculation also used in the study conducted by Mazzali et al. [31], with three kinds of vertical greenery system as study object. However, in the study there is no calculation related to leaves densities.
The heat flux formula, qc (W/m2) is obtained by the coefficient of convective heat transfer (h) and the temperature difference between the air and the surface (TaTw) according to Newton’s cooling law:
q c = h ( T a T w )  
where Ta is the air temperature, °C; Tw is the wall surface temperature, °C. While for convective heat transfer coefficient calculation is the sum of components from heat convective (hc) and heat radiant (hr), respectively calculated based on the EN ISO 6946:2008 [32] as in the following relations:
h c = 4 + 4 v
h r = ε 4 θ T m 3  
where v is the wind velocity, m/s, ε is the surface emissivity, for bricks wall is 0.45, θ Stefan Boltzmann constant and Tm mean thermodynamic temperature of the surrounding surfaces, °C.

2.4. Climatic Condition

Location of the experiment is in Semarang City (6°58′0.0012′′ S and 110°24′59.9904′′ E) under tropical monsoon climatic condition defined according to Koppen-Geiger climate classification as the climate that has a driest month with rainfall less than 60 mm, but more than 1/25 the total annual precipitation [33].
Further specific conditions according to Maritime Meteorology Station of Semarang City, this region has high relative humidity with annual average 78%, except in July to August where the average of humidity only 58%. In special months around December-January, the average of humidity will reach 97%. The annual of air temperature is 26.7 °C. The warmest condition occurred during October with air temperature can reach 27.6 °C. However, the lowest air temperature is in January 25.9 °C.

2.5. Experiment Description

The model built in Architecture Department, Diponegoro University. Climber plants used as green facade attached on the building wall, as can be seen in Figure 4. While the study based on the data from an experiment conducted during December 2013. At the time, the position of sun on the south of equator and solar radiation intensity is low [34].
The aim of the data measurements was conducted to validate the effects of leaves densities on green facade to the thermal profile of the model. In the following are detail of data measurement:
  • Measurement of surface temperature on the interior and exterior model facade.
  • Measurement of air temperature in the exterior and interior of model.
  • Measurement of air humidity in the exterior and interior of model.
There are fifteen measurement points on the facade surface. Five on the bottom, five on the middle and five on the top, as can be seen in Figure 5. The data of surface temperature are the average from the nine measured points. Whereas for indoor air temperature and indoor air humidity, the measurement tools placed in the middle of a miniature house. As for the shape of the roof that has long overhang, that give more shading effect on the facade made the result of data measurement on the A row has cooler temperature than B and C rows.
Some of measuring instrument was used in this research:
  • Hygro thermometers are used to measure air temperature and air humidity in exterior and interior of miniature house. The exterior air temperature and humidity are represent the thermal condition around measuring wall. Both for bare wall and green facade. The measurement instrument measured the thermal condition with or without greenery system. While for interior space, the measurement instrument placed in the middle of the miniature house.
  • Infrared surface thermometer is used to measure surface temperature, both exterior and interior of facade. The measurement instrument measured the wall surface. As for bare wall in can be done directly, while for green facades are directed under greenery system.
  • 4 in 1 environment tester LM-8000 is used to measure wind speed.
All data are acquired at 1 h intervals. Selected data for analysis chosen from data measurement on clear days.

3. Results and Discussion

3.1. Comparison between Surface Temperature of Bare Wall and Green Facade

Walls as part of the building receive direct heat from solar radiation. Generally, in the bare wall, all the heat will receive directly by exterior walls. While in the green facade, direct solar radiation will be blocked by the greenery layer.
Figure 6 shows the comparison of exterior and interior surfaces temperature. Trends from both surface temperature of the green facade is lower than the bare wall. In other words, the bare wall gains more heat during day time. Fluctuation of exterior surface temperature on the experiments II and III is smaller and tend to overlap, especially from 13:00 to 22:00. During that time, possibility exterior surfaces lost their heat to interior surfaces and ambient temperature around the green facade. The bigger heat lost occurred on the experiment III with denser leaves densities.
Compared to the bare wall, significant temperature reduction occurred on the model with green facade, respectively, 12.34% for exterior surface in experiment II and 14.34% for experiment III. The same result also found in interior surface temperature where temperature reduction in experiment II is 12.38% and in experiment III is 13.72%. This resultshas similar trend with a previous study conducted by Laopanitchakul et al. [17]. It means denser leaves densitieshasstronger cooling effect.
Based on the mean temperature value in Table 3, experiment III has the lowest temperature. The different of exterior surface temperatures between bare wall and green facade are 6.8 °C for experiment II and 7.8 °C for experiment III. While on the interior surface, the different are 6.7 °C for experiment II and 7.3 °C for experiment III. The result presents a good thermal reduction behaviour throughout the day.
The quantity of thermal stress on the green facade creates a different in the occurrence of maximum and minimum surface temperature. In experiments II and III, both the maximum and minimum temperature of exterior facade occurred at the same time. As seen in Table 4, the period is longer than bare facade and similar result also found on the interior surface. At this point, the composition of leaves densities on the green facade improve thermal performance of building envelope and possibility can reduce energy consumption for cooling load.

3.2. Comparison between Exterior and Interior Space Temperature of Barewall and Green Facade

During the data measurement, ambient temperatures were lower and humidity of the air higher with significantly wetter days. Still, generally, data measurement of both exterior and interior space temperature for experiment II and III are lower than experiment I, as seen in Figure 7.
Exterior space temperature represents ambient air temperature around measuring walls. Throughout the observation, the maximum reduction of exterior space temperature opposed with the average of outdoor environmental conditions shown by experiment III with the thickest leaves densities, from 0.3 °C to 3.0 °C. Compared to the ambient air around experiments II and I, the reduction of exterior space temperature, respectively, are from 0.0 °C to 2.3 °C and 0.0 °C to 1.3 °C. The trend of this outcome is similar with the finding given by Wong et al. [1], about the microclimate created by green facade. However, the difference on the thermal performance due to leaves densities did not mention.
After sunset (6:00 p.m.), due to the absence of solar radiation and no effect of shadow from green facade, both for exterior space temperature of experiment I and II decreased. However, in experiment III, the ambient around green facade still absorbed more heat energy during night (7:00 p.m.–5:00 a.m.) to remove the heat store from the interior space during daytime while trying to achieve a balanced point. The lowest differences of exterior space temperature among the three experiments are from 6:00 a.m. to 8:00 p.m.
The effect of leaves densities is more visible in the interior air space temperature. As seen in Figure 7, during data measurement, interior space temperature in experiment I was always higher than experiments II and III. While the interior space temperature in experiment III was always lowest. The average of temperature reduction from experiment I to experiment II is 1.97% and from experiment I to experiment III is 3.4%.
Similar to exterior space temperature, in experiment III, since 2:00 p.m. to 5:00 a.m. the interior space temperature tended to increase. That means during that time, air temperature received heat from exterior and possibility of air circulation being blocked by foliage in the greenery system. The trend of this result resembles Wong et al. [1], even though the point of discussion is distance, where at the certain distance the ambient temperature around vertical greenery system was slightly warmer because the greenery system blocked air circulation.
Nevertheless, as can be seen in Table 5, the duration of the maximum temperatures in experiment II are beyond expectations. In this case, further study needs to be done.

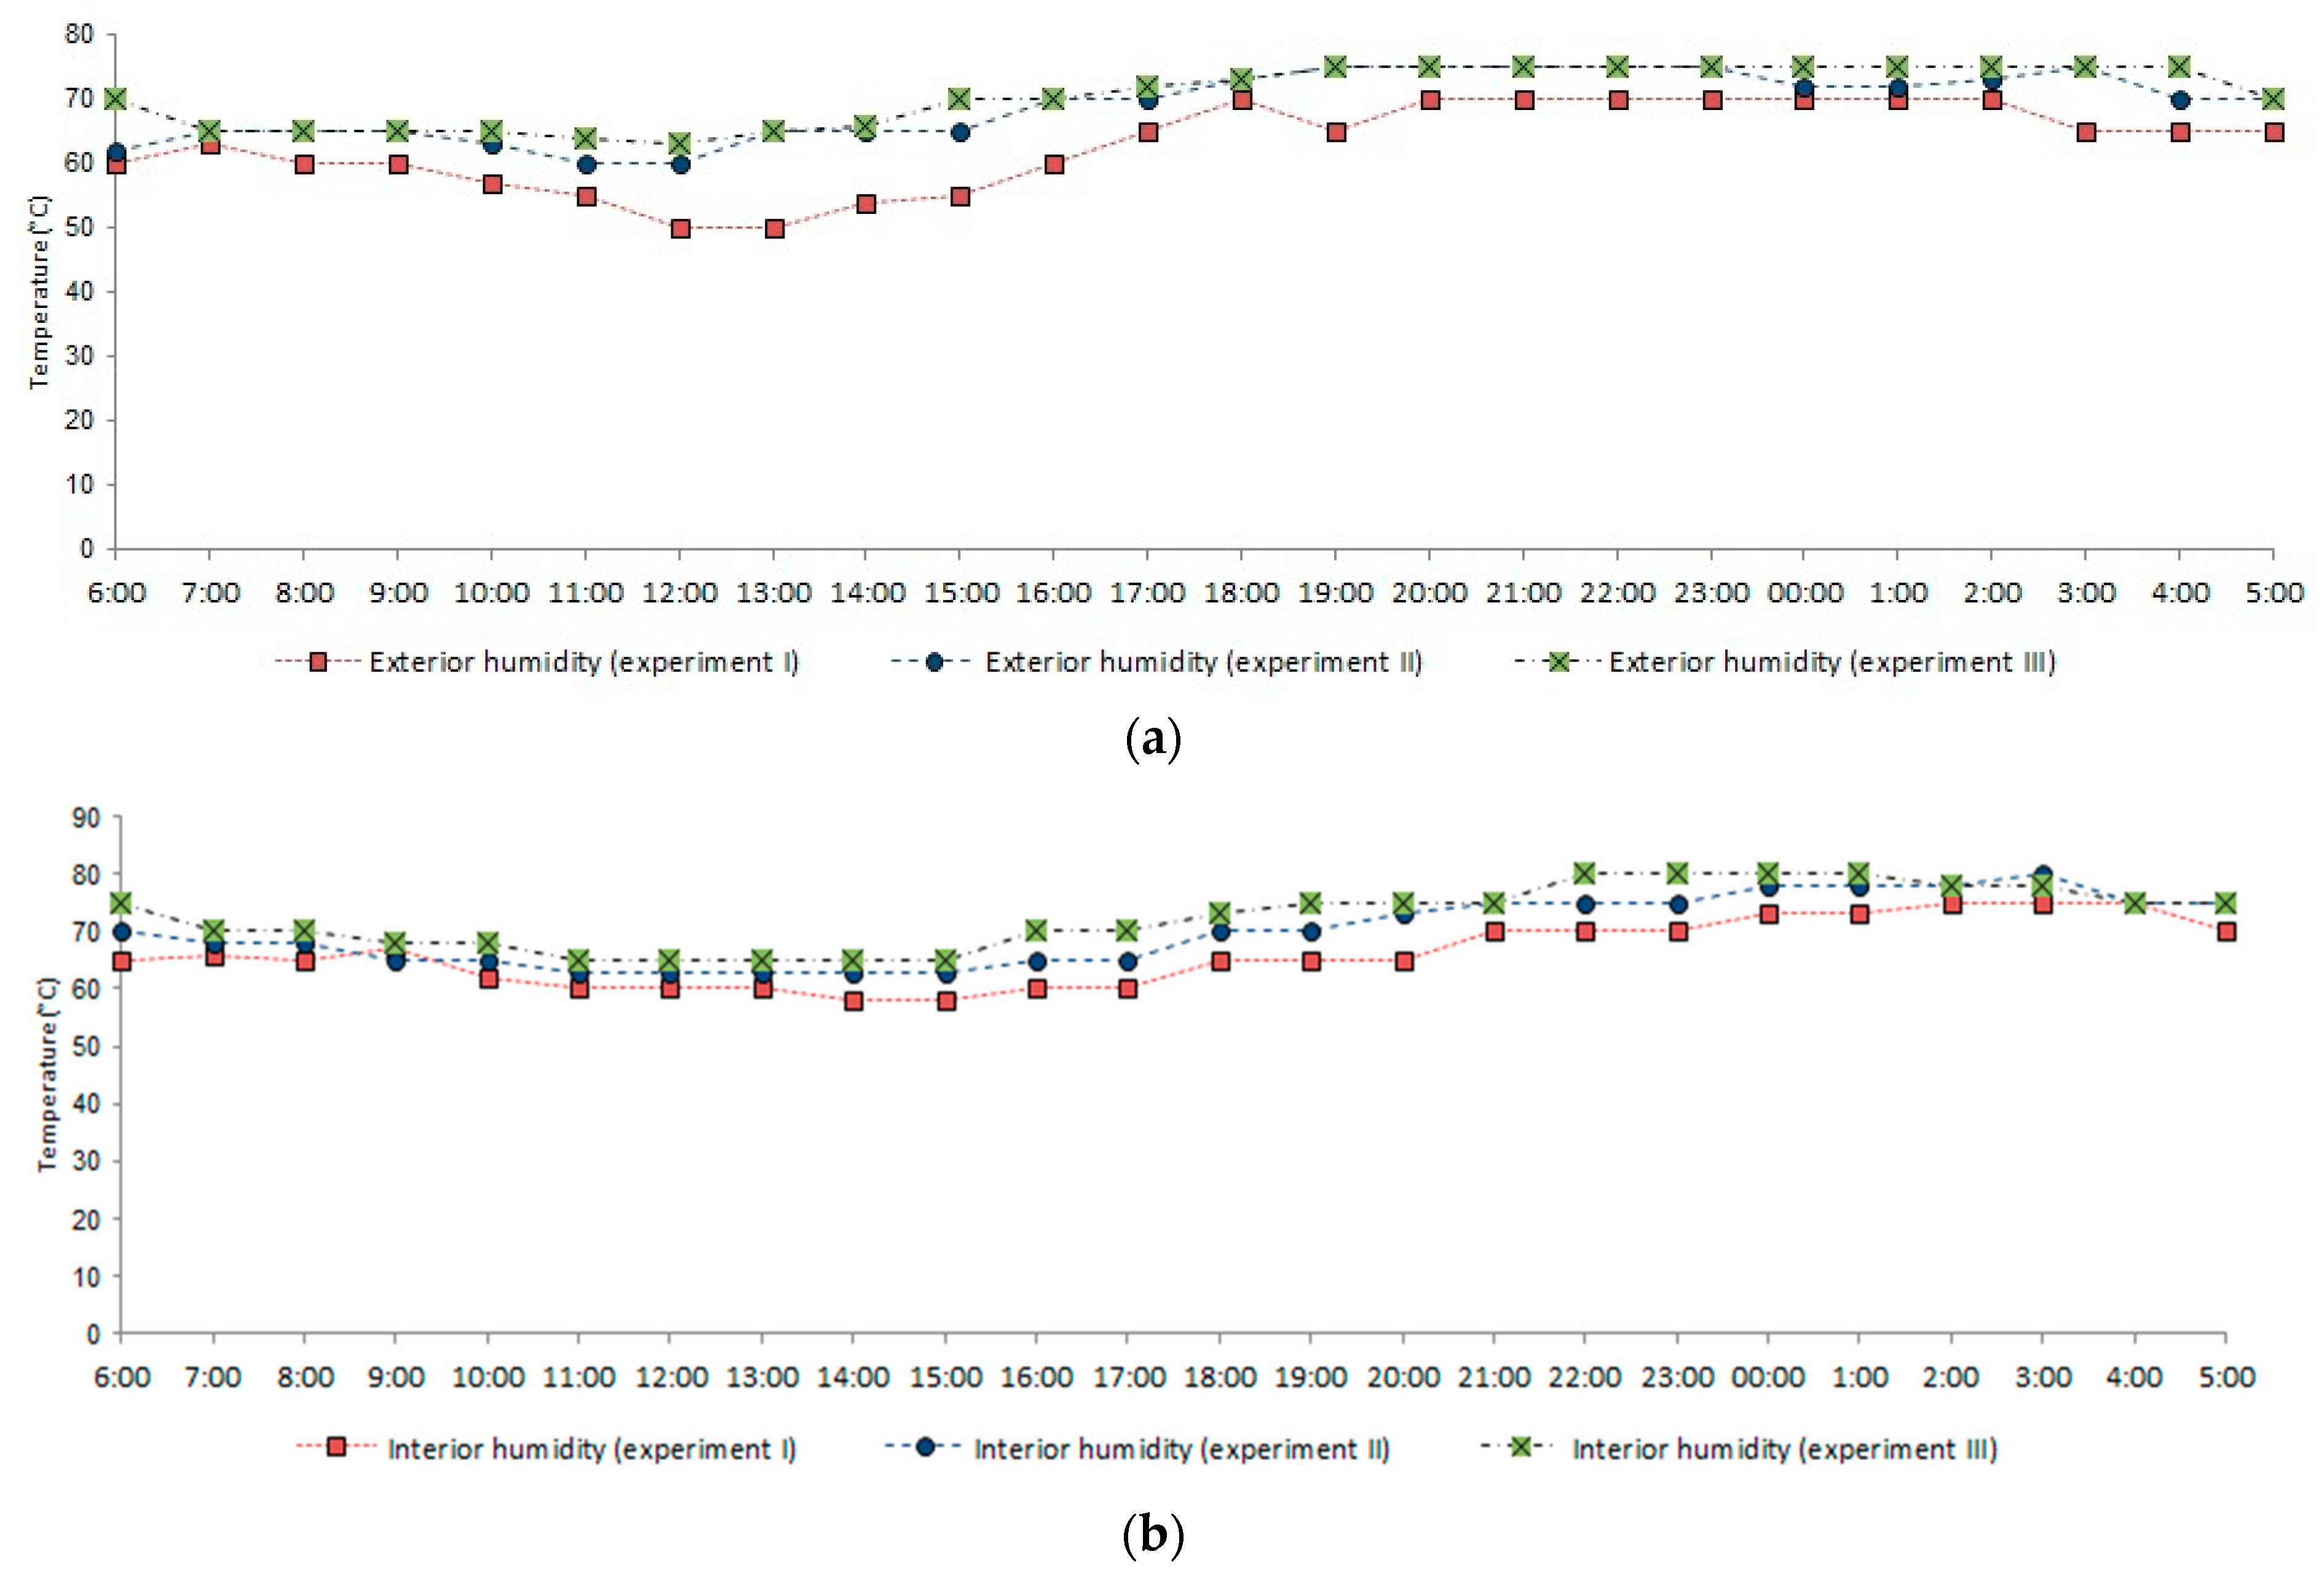
3.3. Humidity between Bare Wall and Green Facade

It is normal when there is a lot of vegetation around a building, the outdoor and indoor humidity will increase. Through evapotranspiration, the vegetation not only can decrease the temperature but also increase the humidity [35]. However, according to Chen et al. [3], the effect just influences the small distance. Furthermore, when the building used well insulated material, the effect on the indoor humidity possibility can be neglectable. In addition, the humidity state in the air layer around the facade is more important because it directly influences the indoor relative humidity.
As seen in Figure 8, both exterior and interior humidity had a similar trend. In experiment III, the humidity is higher than in experiments I and II. During the night, the humidity increased. Possibly, it is due to the absence of solar radiation. Greenery foliage also increased water vapour. The denser leaves densities, the more air circulation is blocked by greenery and so does the water vapour. Moreover, the data measurements were conducted during December when the average of relative humidity is 78%. Therefore, except greenery factor, ambient condition also affected.
The mean relative humidity of all experiments respectively for outdoor air humidity are 62.9% (experiment I), 69.0 (experiment II), and 70.5% (experiment III). The differences with bare wall are 4.61% for experiment II and 5.75% for experiment III. While for interior space humidity, respectively, the averages are 66.1% (experiment I), 70.1% (experiment II), and 72.5% (experiment III). The differences with bare wall are 2.94% for experiment II and 4.60% for experiment III. A possibility is that infiltration through the wall would increase interior space humidity. However, experiments II and III tend to have smaller fluctuation than experiment I.
Based on the data measurement, it can be concluded that though higher leaves densities in experiment III can improve the cooling effect, it also increased the air humidity. This result is similar to Chen et al. [3], where increased humidity is not good for the building because it can increase latent heat to the indoor space. To face the high humidity, good design in natural ventilation is needed.

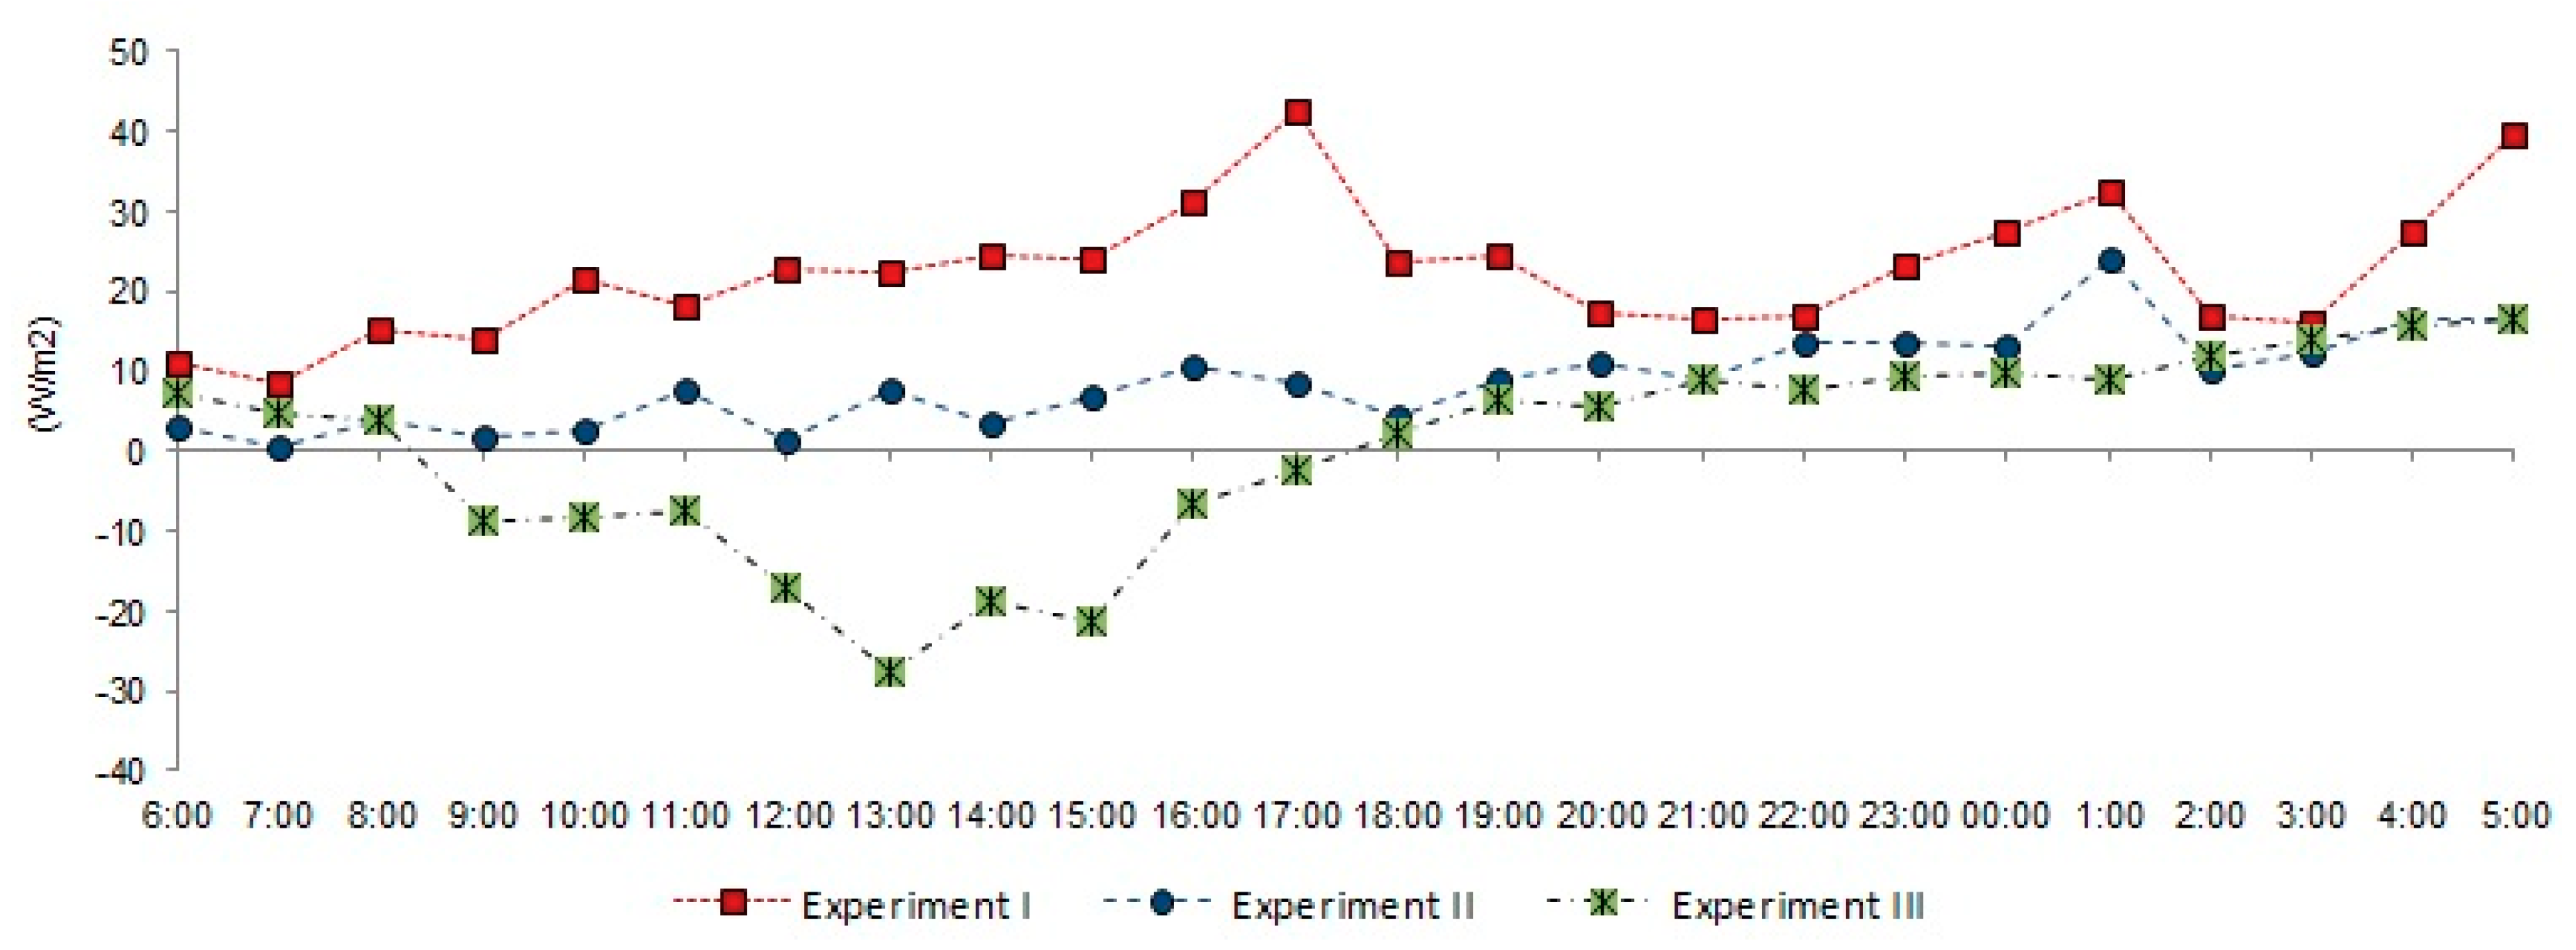
3.4. Heat Flux Calculation between Bare Wall and Green Facade

As seen in the Figure 9, there is a similar thermal behavior to all three experiments. It seems the results have relevancy with surface temperature where the lowest different between the average of exterior and interior surface temperature is in experiment III, 0.30 °C. While for experiment I and experiment II are 0.60 °C and 0.80 °C.
The negative results on the heat flux occurred during day time on the experiment III. Start from 8:00 a.m. to 6:00 p.m. the movement of heat flux on the experiment III was negative. It occurred because interior surface temperature is higher than exterior surface temperature. However, in the night the movement of heat flux started to become positive, yet was still below experiment I and II. Though the result is beyond the expectation, it can be explained as the response of leaves densities to solar radiation and potentially reduce cooling load during day time. Compared to other experiments, experiment III had the lowest heat flux profile. Respectively, from experiment I to experiment III, the average of heat flux are 22.35 W/m2, 8.76 W/m2, and 0.60 W/m2.
Based on the discussion, on the surface sections with covered by plant, heat flows are lower compared with those of the bare surface sections, which are unprotected from direct solar radiation. The leaves densities in the green facade reduce significantly the unwanted heat quantities that distribute from the exterior to the interior on the building. It will stabilize the indoor environment by decreasing both outdoor and indoor temperature.
However, it still needs further discussion for the appropriate proportion of leaves densities to create better heat flow to avoid extreme heat flux.

4. Conclusions

This research studies the thermal behavior of the green facade in the tropical climate through three series of experiments focused on the observation of leaves densities in the green facade to create a microclimate around a building facade.
The experiments used a model of a miniature house. The scale is 1:4. The green facade applied in the east wall with three kinds of leaves densities as the parameter as follows: 0% as bare wall model; 50% leaves densities; and 90%. The experiment was conducted during December 2013.
The major findings are:
  • Compared to the bare wall, the green facade had a notable cooling effect and was more visible for the facade with higher leaves densities. The difference of exterior surface temperatures between bare wall and green facade was 6.8 °C for experiment II and 7.8 °C for experiment III. While on the interior surface, the difference was 6.7 °C for experiment II and 7.3 °C for experiment III.
  • In interior space, the effect of leaves densities is more visible compared to exterior space. Experiment I was always higher than experiments II and III. While experiment III is the lowest. The average temperature reduction from experiment I to experiment II is 1.97% and from experiment I to experiment III is 3.4%. However, at a certain time, both exterior and interior space temperatures tended to increase. It means during that time, air temperature received heat, and cannot release it because the air circulation was blocked by foliage in the greenery system.
  • Both exterior and interior humidity had a similar trend. The denser leaves densities, the more air circulation was blocked by greenery. In experiment III, the humidity is higher than in experiments I and II, especially during the night when there is no solar radiation, the humidity will increase. Furthermore, the data measurements were conducted during December when the average relative humidity is 78%.
  • The result of heat flux has relevancy with surface temperature. Compared to other experiments, experiment III had the lowest heat flux profile. Respectively, from experiment I to experiment III, the average of heat flux were 22.35 W/m2, 8.76 W/m2, and 0.60 W/m2. The result in experiment III with the negative result in the heat flux calculation was beyond expectation. It occurred because interior surface temperature is higher than exterior surface temperature.
This research gives new perception about the positive and negative effect of green facade on the microthermal behaviour in the building. However, additional research is needed to determine the appropriate proportion of leaves densities to create effectiveness of the green facade.

Author Contributions

Conceptualization, R.W.; Methodology, R.W., E.P., and W.S.B.; Formal Analysis, R.W., E.P., and W.S.B.; Investigation, R.W.; Data Curation, R.W.; Writing-Original Draft Preparation, R.W.; Writing-Review & Editing, W.C.; Visualization, R.W.; Supervision, W.C., E.P., and W.S.B.; Project Administration, R.W.; Funding Acquisition, W.C.

Funding

This research is fully supported by LPDP scholarship (Indonesia Endowment Fund for Education), within batch program V in 2014, with the register number 0038543/TK/T/3/lpdp2014. The authors fully acknowledged Indonesian Ministry of Finance for the approved fund which makes this important research works.

Acknowledgments

We gratefully thank Department of Architecture, Diponegoro University, for giving the license to conduct this research using miniature house as measurement object.

Conflicts of Interest

The authors declare no conflict of interest.

References

  1. Wong, N.H.; Tan, A.Y.K.; Chen, Y.; Sekar, K.; Tan, P.Y.; Chan, D.; Chiang, K.; Wong, N.C. Thermal evaluation of vertical greenery systems for building walls. Build. Environ. 2010, 45, 663–672. [Google Scholar] [CrossRef]
  2. Gill, S.E.; Handley, J.F.; Ennos, A.R.; Pauleit, S. Adapting cities for climate change: The role of the green infrastructure. Built Environ. 2007, 33, 115–133. [Google Scholar] [CrossRef]
  3. Chen, Q.; Li, B.; Liu, X. An experimental evaluation of the living wall system in hot and humid climate. Energy Build. 2013, 61, 298–307. [Google Scholar] [CrossRef]
  4. Perini, K.; Ottelé, M.; Haas, E.M.; Rossana, R.R. Vertical gardens, a process tree for green facades and living walls. Urban Ecosyst. 2013, 16, 265–277. [Google Scholar] [CrossRef]
  5. Francis, R.A.; Lorimer, J. Urban reconciliation ecology: The potential of living roofs and walls. J. Environ. Manag. 2011, 92, 1429–1437. [Google Scholar] [CrossRef] [PubMed]
  6. Dunnett, N.; Kingsbury, N. Planting Green Roofs and Living Walls; Timber Press: Portland, OR, USA, 2004. [Google Scholar]
  7. Hunter, A.M.; Williams, N.S.G.; Rayner, J.P.; Aye, L.; Hes, D.; Livesley, S.J. Quantifying the thermal performance of green facades: A critical review. Ecol. Eng. 2014, 63, 102–113. [Google Scholar] [CrossRef]
  8. Ottelé, M.; Perini, K.; Fraaij, A.L.A.; Haas, E.M.; Raiteri, R. Comparative life cycle analysis for green facades and living wall systems. Energy Build. 2011, 43, 3419–3429. [Google Scholar] [CrossRef]
  9. Stec, W.; Van Paassen, A.; Maziarz, A. Modelling the double skin façade with plants. Energy Build. 2005, 37, 419–427. [Google Scholar] [CrossRef]
  10. Bass, B.; Baskaran, B. Evaluating Rooftop and Vertical Gardens as an Adaptation Strategy for Urban Areas; NRCC-46737, Project Number A020, CCAF Report B1046; Institute for Research and Construction, National Research Council: Ottawa, ON, Canada, 2003.
  11. Peck, S.W.; Callaghan, C.; Bass, B.; Kuhn, M.E. Research Report: Greenbacks from Green Roofs: Forging a New Industry in Canada; Canadian Mortgage and Housing Corporation (CMHC): Ottawa, ON, Canada, 1999.
  12. McPherson, E.G. Preserving and restoring urban biodiversity: Cooling urban heat islands with sustainable landscapes. In The Ecological City; Platt, R.H., Rowntree, R.A., Muick, P.C., Eds.; University of Massachusetts Press: Amherst, MA, USA, 1994; pp. 151–172. [Google Scholar]
  13. Pope, A.C.; Ezzati, M.; Dockery, D.W. Fine-particulate air pollution and life expectancy in the United States. N. Engl. J. Med. 2009, 360, 376–386. [Google Scholar] [CrossRef] [PubMed]
  14. Köhler, M. Green facades—A view back and some visions. Urban Ecosyst. 2008, 11, 423–436. [Google Scholar] [CrossRef]
  15. McPherson, G.E.; Herrington, L.P.; Heisler, G.M. Impacts of vegetation on residential heating and cooling. Energy Build. 1988, 12, 41–51. [Google Scholar] [CrossRef]
  16. Dinsdale, S.; Pearen, B.; Wilson, C. Feasibility Study for Green Roof Application on Queen’s University Campus; Queen’s Physical Plant Services: Kingston, ON, USA, 2006. [Google Scholar]
  17. Laopanitchakul, V.; Sunarkorn, P.; Srisutapat, A. Climbing-plant on solid wall for reducing energy in tropical climate. In Proceedings of the Sustainable Building Conference, Soul, Korea, 21–25 September 2008. [Google Scholar]
  18. Kontoleon, K.; Eumorfopoulou, E. The effect of the orientation and proportion of aplant-covered wall layer on the thermal performance of a building zone. Build. Environ. 2010, 45, 1287–1303. [Google Scholar] [CrossRef]
  19. Papadakis, G.; Tsamis, P.; Kyritsis, S. An experimental investigation of the effect of shading with plants for solar control of buildings. Energy Build. 2001, 33, 831–836. [Google Scholar] [CrossRef]
  20. Wong, N.H.; Chen, Y.; Ong, C.L.; Sia, A. Investigation of thermal benefits of rooftop garden in the tropical environment. Build. Environ. 2003, 38, 261–270. [Google Scholar] [CrossRef]
  21. Sailor, D.J. A green roof model for building energy simulation programs. Energy Build. 2008, 40, 1466–1478. [Google Scholar] [CrossRef]
  22. Alexandri, E.; Jones, P. Temperature decreases in an urban canyon due to green walls and green roofs in diverse climates. Build. Environ. 2008, 43, 480–493. [Google Scholar] [CrossRef]
  23. Hoyano, A. Climatological uses of plants for solar control and the effects on the thermal environment of a building. Energy Build. 1988, 11, 181–199. [Google Scholar] [CrossRef]
  24. Sunakorn, P.; Yimprayoon, C. Thermal performance of bio façade with natural ventilation in the tropical climate. Procedia Eng. 2011, 21, 34–41. [Google Scholar] [CrossRef]
  25. Pérez, G.; Rincón, L.; Vila, A.; González, J.M.; Cabeza, L.F. Behaviour of green façades in Mediterranean Continental climate. Energy Convers. Manag. 2011, 52, 1861–1867. [Google Scholar] [CrossRef]
  26. Perini, K.; Ottelé, M.; Fraaij, A.L.A.; Haas, E.M.; Raiteri, R. Vertical greening system sand the effect on air flow and temperature on the building envelope. Build. Environ. 2011, 46, 2287–2294. [Google Scholar] [CrossRef]
  27. Koyama, T.; Yoshinaga, M.; Hayashi, H.; Maeda, K.; Yamauchi, A. Identification of key plant traits contributing to the cooling effects of green facades using free standing walls. Build. Eniron. 2013, 66, 96–103. [Google Scholar] [CrossRef]
  28. Pérez, G. Façanesvegetades: Estudi del seu potencial com a sistema passiu d’estalvi d’energia, en climame diterrani continental. Ph.D. Thesis, Universitat Politècnicade Catalunya, Barcelona, Catalonia, Spain, 12 July 2010. [Google Scholar]
  29. Odum, E.P. Dasar-Dasar Ekologi; Universitas Gajah Mada Press: Yogyakarta, Indonesia, 1993. (In Bahasa) [Google Scholar]
  30. Qin, H.; Hong, B.; Jiang, R. Are green walls better options than green roofs for mitigating pm10 pollution? CFD simulations in urban street canyons. Sustainability 2018, 10, 2833. [Google Scholar] [CrossRef]
  31. Mazzali, U.; Peron, F.; Romagnoni, P.; Pulselli, R.M.; Bastianoni, S. Experimental investigation on the energy performance of living walls in a temperate climate. Build. Environ. 2013, 64, 57–66. [Google Scholar] [CrossRef]
  32. NSAI. ENISO6946. Thermal Resistance and Thermal Transmittance Calculation Method (ISO 6946: 2017); The National Standards Authority of Ireland (NSAI): Ireland, Dublin, 2017. [Google Scholar]
  33. Kottek, M.; Grieser, J.; Beck, C.; Rudolf, B.; Rubel, F. World map of the Koppen-Geiger climate classification updated. Meteorol. Z. 2006, 15, 259–263. [Google Scholar] [CrossRef]
  34. Lippsmeier, G. Tropenbau Building in the Tropics. In Bahasa: Bangunan Tropis by Syahmir Nasution, 2nd ed.; Indarto, P.W., Ed.; Erlangga: Jakarta, Indonesia, 1994. [Google Scholar]
  35. Scudo, G.; Ochoadela Torre, J.M. Spazi verdi urbani.; Sistemi Editoriali: Napoli, Italy, 2003. [Google Scholar]
Figure 1. Miniature house as measurement object.
Buildings 08 00138 g001
Figure 2. Detail of miniature house.
Buildings 08 00138 g002
Figure 3. Chosen of leaves densitieson the green facade: (a) Leaves Densities50%; (b) Leaves Densities 90%.
Buildings 08 00138 g003
Figure 4. Placement of green facade.
Buildings 08 00138 g004
Figure 5. Location of measurement points for the surface temperature.
Buildings 08 00138 g005
Figure 6. Comparison between: (a) exterior surface temperature and (b) interior surface temperature of bare wall and green facade.
Buildings 08 00138 g006
Figure 7. Comparison between: (a) exterior space temperature and (b) interior space temperature of bare wall and green facade.
Buildings 08 00138 g007
Figure 8. Comparison between: (a) exterior space humidity and (b) interior space humidity of bare wall and green facade.
Buildings 08 00138 g008
Figure 9. Comparison between heat flux of experiment I, experiment II, and experiment III.
Buildings 08 00138 g009
Table 1. Detail of miniature house.
Detail of Miniature HouseSpecification
Model size1 m × 1 m × 1 m
Roof materialAsbestos
Roof shapeGable roof
Wall materialBrick
Inlet outletPorosity 30%
Floor materialWhite ceramic
Ceiling materialAsbestos
Position of openingInlet in the front and outlet in the back
Table 2. Detail physical and structural parameter of miniature house.
Physical and Structural ParameterSpecification
Wall thickness12 cm
U value0.31 W/m²K
Layer materialNo layer material
Table 3. Configuration of the green facade in each experiment.
DateThermal LabAverage of Local Climate Condition
HumidityTemperatureAir Velocity
Experiment 1December 10Model without green facade (0%)78%26.0 °C4.7 m/s
Experiment 2December 13Green facade 50%80%25.48 °C5.0 m/s
Experiment 3December 16Green facade 90%80%24.6 °C5.2 m/s
Table 4. Comparison of surface temperature in each experiment.
Exterior (°C)Interior (°C)
MaxTimeMinTimeAverageMaxTimeMinTimeAverage
Experiment 135.714:0026.606:0031.032.219:0028.006:0030.2
Experiment 231.410:0021.020:0024.225.417:0021.603:0023.6
Experiment 325.810:0021.020.0023.225.723:0020.020:0022.9
Table 5. Comparison of space temperature in each experiment.
Exterior (°C)Interior (°C)
MaxDurationMinDurationAverageMaxDurationMinDurationAverage
Experiment 129.03 h23.01 h26.227.02 h26.07 h26.4
Experiment 230.04 h23.02 h25.926.05 h24.51 h25.3
Experiment 328.02 h23.05 h25.025.11 h24.35 h24.6

