1. Introduction
Sustainable cities are generally planned, designed and erected for preservation of ecological system balance. Efforts to upgrade the current landscape and buildings of world cities and to transform them into livable and sustainable cities is of high importance [
1,
2,
3,
4,
5,
6]. Life cycle analyses have demonstrated that the majority of energy in a building is consumed in operational energy or during the post occupancy phase of the building life [
7,
8,
9]. In the current case of Australia, the building sector alone contributes to 20% and 23% of Australia’s annual energy consumption and greenhouse gas (GHG) emissions, respectively [
10,
11]. The Australian commercial building sector accounts for 8–10% of GHG emissions [
12,
13].
Many new buildings are designed to incorporate low carbon emission features, which enhance the building environmental performance. However, new buildings only represent a small percentage of the entire buildings stock. Upgrading existing buildings to meet lower carbon emission targets presents a huge opportunity for building owners, designers and contractors [
14]. Nowadays, new buildings proved that it is possible to reduce the carbon emissions by more than 50% when compared with buildings constructed 5–10 years ago. However, new buildings’ share in the current buildings sector is less than 2%. Therefore, the opportunity of reducing worldwide carbon emissions rests with upgrading existing buildings [
15].
The current per capita carbon footprint of Australia is 23.1 equivalent tons of carbon dioxide (CO
2-e), which is approximately five times higher than the global average due to rapid population and economic growth [
16,
17]. Reducing carbon emissions of an existing building is possible when energy being used in existing buildings is fully understood [
18,
19,
20]. Energy performance simulations involve the use of computer models to simulate the performance of a building in determined conditions. For a simulation to be effective as a tool for building performance prediction, it must prove itself to be robust, limit uncertainty and identify sensitivity [
21]. A series of building simulation software packages are available commercially or freely distributed [
22,
23]. For the redevelopment of a commercial building, thermal and energy implications of heating, ventilation, and air conditioning (HVAC) systems and building constructions on energy performance and rating, also, require critical evaluation [
24,
25,
26].
Research on building rating stated clearly the difference between a low performance building that may use energy inefficiently and a high performance building that may use very efficient systems to provide a higher level of services [
27,
28]. Evaluating the energy performance of a building requires some sort of a comparison or a benchmark [
29,
30,
31]. It is increasingly common to carry out evaluations based on normalized whole building energy consumption based on floor area (kWh/m
2/annum). Consequently, recommendations to achieve energy ratings in accordance with, for example, the National Australian Built Environment Rating System (NABERS) should be provided [
32].
The energy bill in Jordan represents 20% of the country’s gross domestic product (GDP), which forms a driving force toward energy savings in buildings in order to reduce their operating cost [
33]. The green buildings sector in Jordan has shown progress over the last 5–10 years by establishing a national green building council of Jordan [
34,
35,
36]. The council is in charge of monitoring the green building sector in Jordan in a similar fashion to the green building council of Australia. Jordan has a semi-arid climate, a lack of energy resources and a scarcity of water, which put the green building sector on a challenging track. Due to high energy prices, work has been focused on improving the energy efficiency of different industrial sectors [
37,
38,
39,
40].
The current study has been carried out in an effort to demonstrate the possibility of reducing carbon emissions resulting from renovating an old commercial building and utilizing an energy-efficient HVAC system. This has been achieved by utilizing virtual environment integrated environmental solutions software (VE-IES) [
41]. The simulation analysis followed the National Australian Built Environment Rating System (NABERS) energy guide to building energy estimation [
42], which outlines strict requirements with regards to the methodology of the energy simulation technique and sensitivity analysis. The required sensitivity analysis included one off-axis scenario incorporating the simulation of a number of system failures and departures from standard building operation.
2. Methodology
The methodology used in the current simulation is based on guidelines provided by NABERS Energy [
42]. NABERS Energy awards stars based on the greenhouse performance of rated space, with a higher number of stars for better performance. The number of stars awarded by NABERS Energy is determined from the normalized emissions figure in kgCO
2/m
2, which is calculated from the type and quantity of energy consumed and the rated area, normalized for hours of use, equipment density and climate. NABERS Energy-based building rating rates the greenhouse performance of the building owner operated services in an office building. The key items of information required for the simulation are listed below and detailed in the following sections:
The net lettable area of the office space being rated, less exclusions for non-office or otherwise non-assessable items.
The energy consumed by the base building.
Hours of occupancy.
Input data, such as: climate data, building form, shading, glazing, carpark, lighting, equipment, occupants, HVAC system and energy coverage.
Metering requirements.
Simulation results.
Interpretation of the results.
2.1. National Australian Built Environment Rating System (NABERS)
The Australian Building Greenhouse Rating (ABGR) scheme [
43,
44] is the world’s first initiative developed by the Australian Federal Government and is administered by various state governments. NABERS uses the ABGR methodology to provide star ratings for the broad environmental impacts of buildings: energy, water, waste, indoor environment and site impacts. In 2008, the ABGR tool was re-branded as NABERS Energy for offices to complement the other NABERS tools. NABERS is a national program managed by the NABERS National Administrator, NSW Government’s Office of Environment and Heritage, and overseen by a National Steering Committee [
32]. NABERS ratings for offices can be used to measure the performance of a tenancy, the base building or the whole building. The tenancy rating includes only the energy or resources that the tenant controls. A base building rating covers the performance of the building’s central services and common areas, which are usually managed by the building owner. NABERS is a performance-based rating system for buildings. NABERS provides a star rating to a building or a tenancy that represents its actual operational performance, using 12 months of measured performance information, such as energy or water bills. The program compares the performance of a building or a tenancy to benchmarks that represent the performance of other similar buildings in the same location. The rating takes into consideration: the climactic conditions in which the building operates, the hours of its use, the level of services it provides, the energy sources it uses, its size and occupancy. The adjusted data are then compared to the NABERS benchmark data, and a star rating reflecting the building performance relative to other buildings is calculated. The NABERS Energy tool for offices measures performance on a rating scale from 0–6 stars with ½ star increments being awarded as listed in
Table 1.
2.2. Building Description
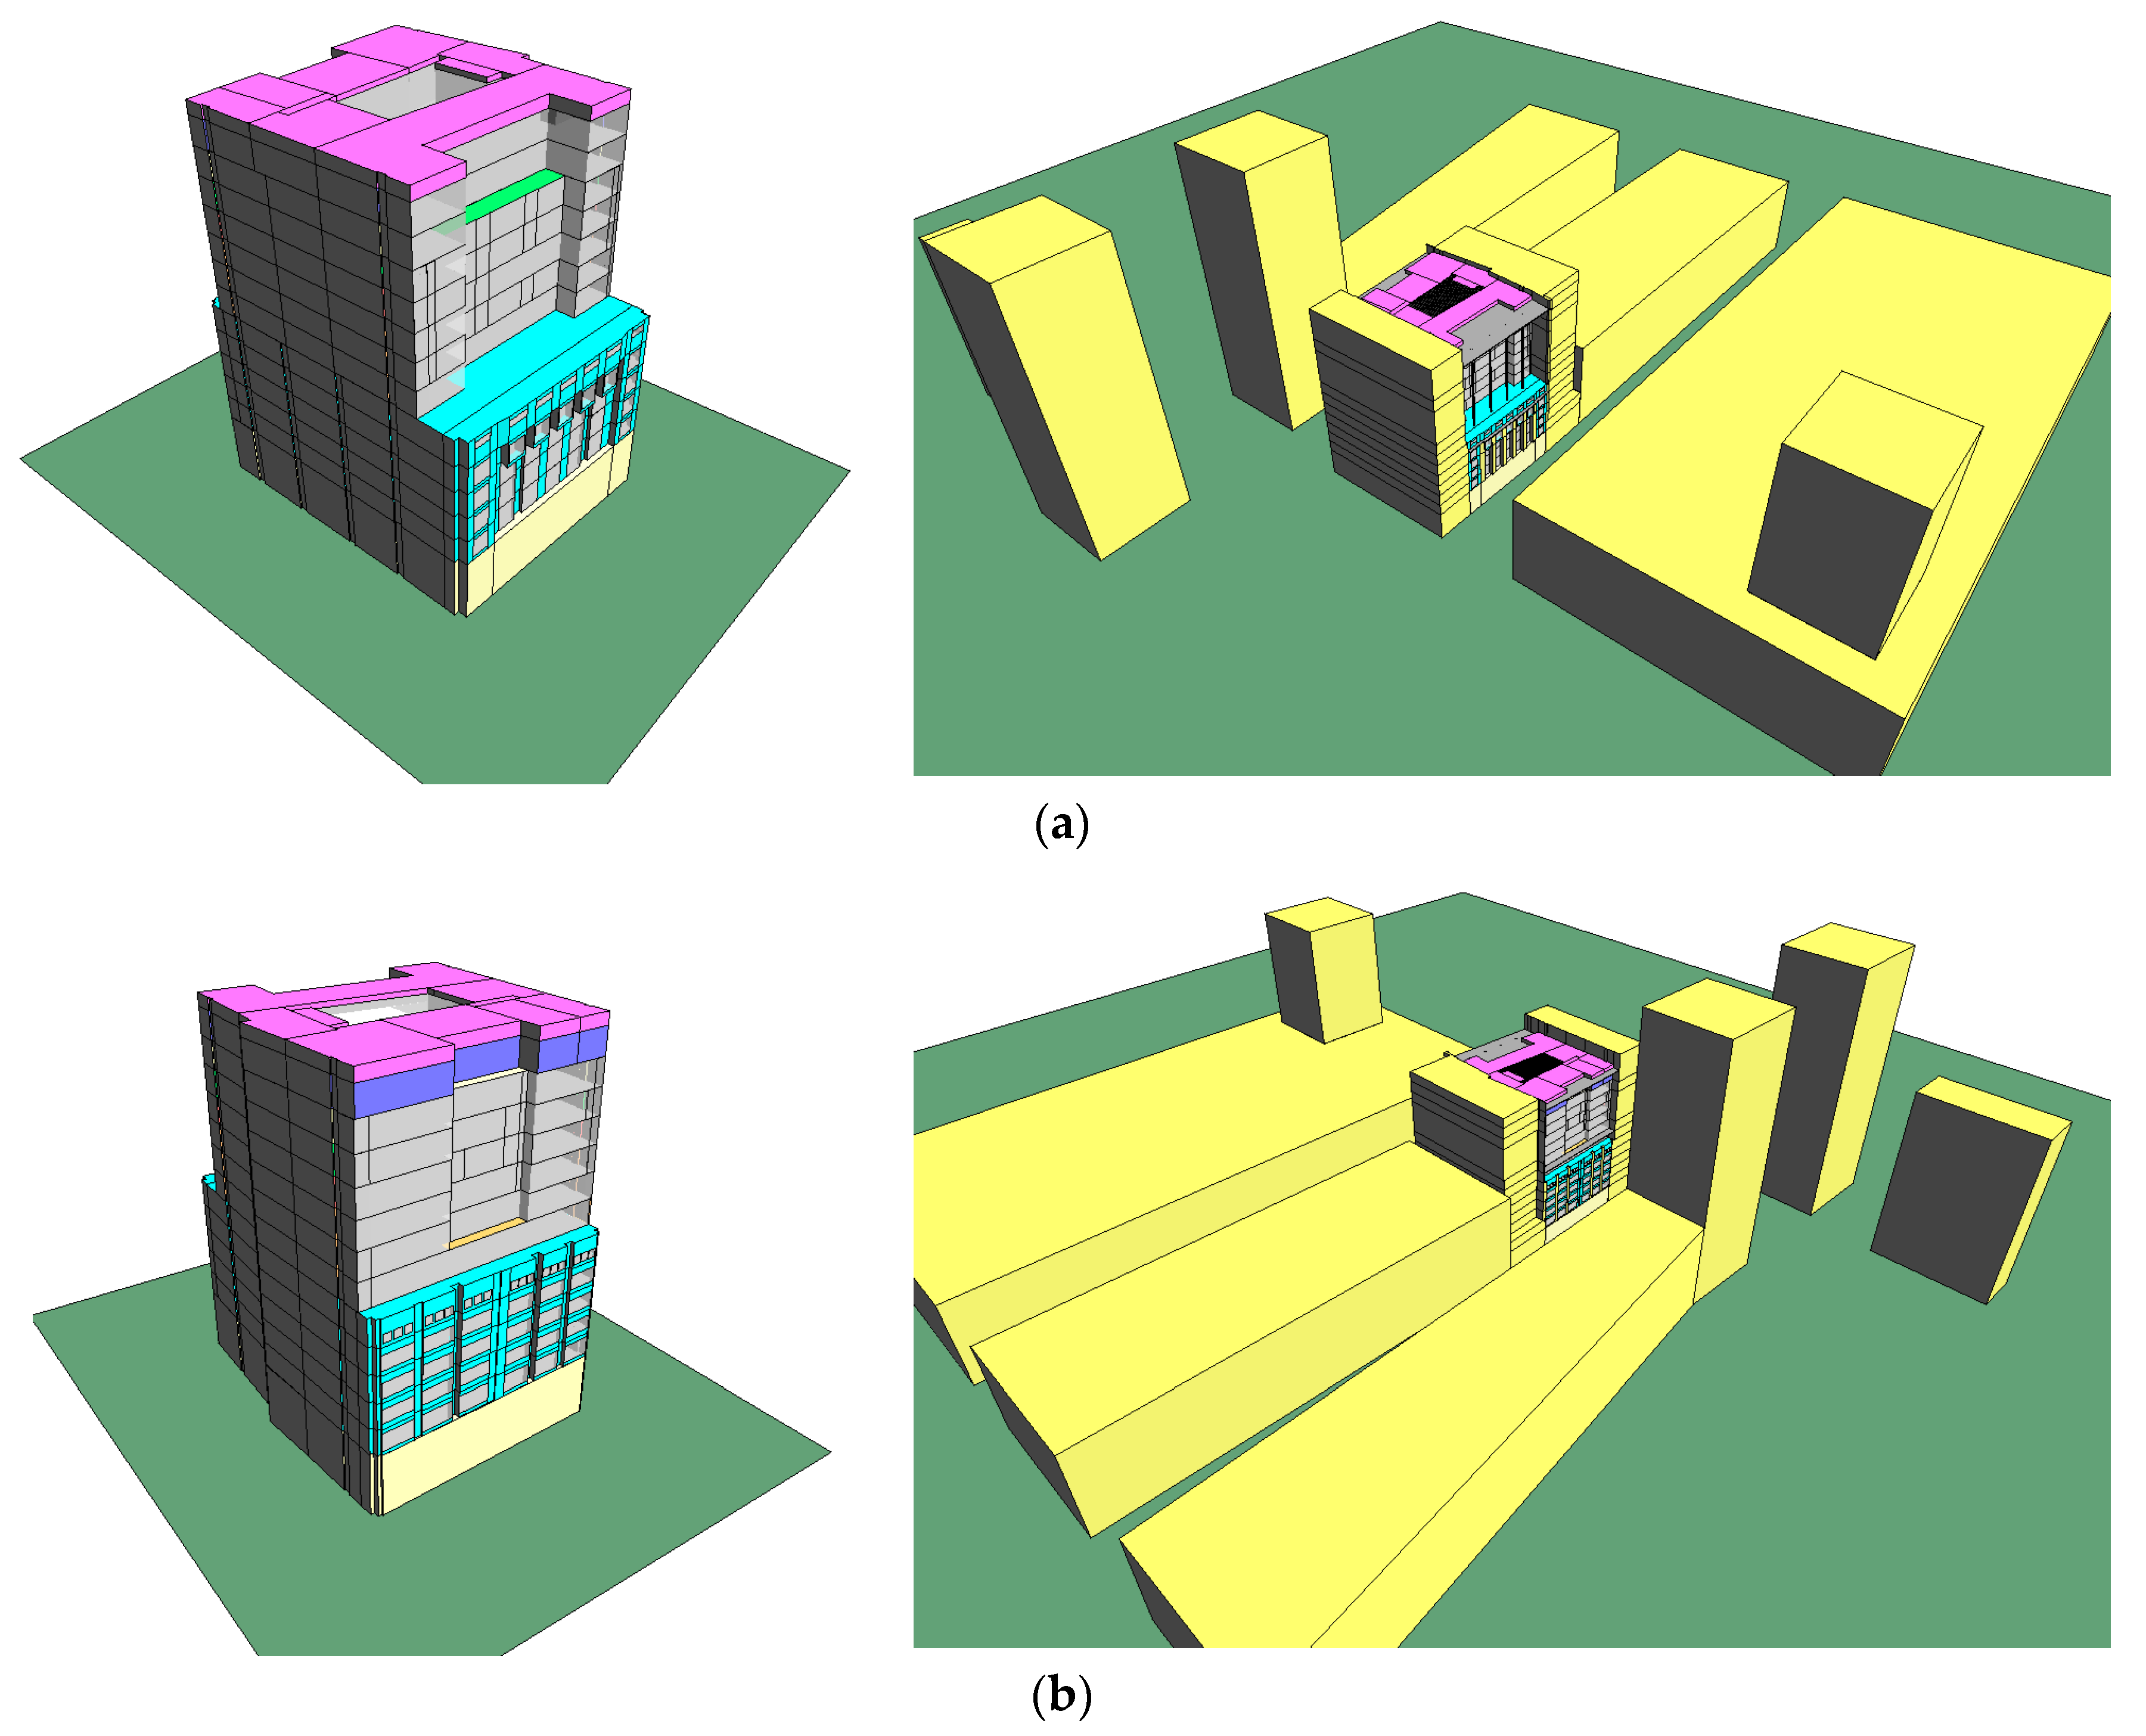
The commercial building under investigation is a six-floor office block with street frontages on two streets located in downtown Sydney, Australia. The proposed redevelopment involved adding an extra six floors on top of the existing floors and providing a full height internal atrium into the space as shown in
Figure 1. On the lower floors, two levels of retail spaces are to be provided, which may incorporate food outlets or general retail outlets. Furthermore, there is no basement car park within the facility; however, an on-site loading dock is to be provided in the basement.
The proposed HVAC system consisted of chilled ceiling and chilled beam systems served by a water centrifugal chiller located in the basement. East and west perimeter zones of the building are served by active chilled beams, which are served by a single roof-mounted air handling unit (AHU). The core zones are served by passive chilled ceilings located above a perforated ceiling construction. Outdoor air is provided to core zones via a dedicated roof mounted AHU. The relieved and returned air is forced to flow via the atrium. Heat rejection from the chiller is dissipated to the atmosphere via cooling towers located within the roof plant room.
2.3. Input Data Validation
Energy analysis has been undertaken in accordance with NABERS energy and water for offices-rules for collecting and using data for the purpose of predicting the building’s energy consumption. The following input data were utilized:
The climate data used were of Sydney, NSW, located at 42 m above sea level [
41,
42].
The insulation level on both the roof and floor were modeled as 50 mm and 20 mm polystyrene, respectively.
The model utilized double glazed windows with the overall heat transfer coefficient (U) and shading coefficient (SC) of the glazing as [
45]:
Levels 2–6: 13 mm low emissivity (LE) clear laminated (U = 4.1 W/m2·K, SC = 0.4)
Levels 6–12: 6-12-6 mm LE70 double-glazed low emissivity solar performance on green (U = 1.8 W/m2·K, SC = 0.38)
Skylight: 12.38 mm Grey Interlayer Solar plus TE/TS Series-Laminate (U = 5.6 W/m2·K, SC = 0.32). The TE/TS series reflect the type of coating used.
The net lettable area (NLA) values used for the assessment of the building are listed below. Figures do not include the ground floor retail tenancies, and it is slightly different from the actual net lettable areas due to inaccuracies in developing the computer model. However, for the purposes of determining the energy performance of the building on a per meter squared basis, the difference is immaterial.
The average lighting density was assumed to be 12 W/m
2 in the tenancies, of which 100% was assumed to be transmitted directly into the room as sensible load [
46,
47]. In the simulation, it was assumed that the lighting controls have limited control, and the lighting hours in
Table 2 are used. The off-axis analysis increased the overnight operation from 15–25%.
The electrical energy required for lighting, small power, lifts and domestic hot water was calculated based on the assumption of hours of operation of the building spaces in accordance with the NABERS energy simulation protocol. Lighting, equipment and occupant profiles have been integrated into the model according to the NABERS Energy and Water for Offices-Rules for collecting and using data.
The equipment load, for energy consumption, is a diversified load with an average of 11 W/m
2 [
43]. The assumed equipment hours are presented in
Table 3. For plant design capacities, the equipment load was taken to be 20 W/m
2. The equipment load of 11 W/m
2 has been averaged over the various zones made up from a random distribution of the following load figures: 5 W/m
2, 7 W/m
2, 11 W/m
2, 15 W/m
2 and 19 W/m
2 in the following proportions: 1, 2, 2, 1 and 1 [
48,
49]. The off-axis analysis increased the overnight operation from 50–75%.
The average occupant density, for energy consumption, was specified at 10 m
2/person, and the occupancy hours were set to the default schedule reproduced in
Table 3. For plant design capacities, the occupancy was taken to be 1 person per 10 m
2 [
50,
51].
2.4. heating, ventilation, and air conditioning (HVAC)
The HVAC system operating for 50 h/week was assumed to be the default hours in the NABERS Energy and Water for Offices-Rules for collecting and using data of occupancy. The 3rd floor was assumed to be operational from 9 a.m.–12 p.m. on Saturdays as listed in
Table 3. The HVAC system consisted of chilled water cooling and gas fired hot water heating systems. The chilled water plant consisted of a high efficiency centrifugal chiller and a low load rotary screw chiller with a total capacity of 2000 kW. Chilled water was recirculated to the AHUs and chilled ceilings via a primary and secondary pumping system.
Chillers have been selected to provide the maximum efficiency through extra-large evaporator vessel selection and depressed wet bulb operation. Chillers operated at extended chilled water temperatures of 7 °C supply and 14 °C return. The combined chillers’ simulated capacities are listed below with corresponding coefficients of performance (COPs) listed in
Table 4 Heat rejection was via roof-mounted cooling towers that have been sized to provide return water at 28 °C on a design day. An allowance of 12.0 kW for cooling tower fans and pumps has been made for the separate tenant condenser water system. Heating was provided by an atmospheric gas-fired boiler providing 60 °C supply and 40 °C return water to the AHU heating coils. The boiler modulation yields an efficiency of 75% at all part-loads. The air handling plant has been sized to provide air change rates necessary to serve the occupancy.
The HVAC system was modeled to provide for four zones per floor: two perimeter zones and two core zones. Each zone on each floor was provided with chilled beams or chilled ceilings to provide locally-controlled cooling. The perimeter zones were provided by a mix of active and passive chilled beams. The lower six floors were provided with active chilled beams, whereas the upper 7 floors were provided with passive chilled beams. All of these zones were provided with conditioned air providing the primary supply. The core was served with passive chilled beams and a separate AHU providing 100% conditioned outdoor air. The AHU that provided outdoor air to the core zones served all of the occupied floors. The AHU that served the perimeter active chilled beams on both the east and west facades of the occupied floors served all levels. The control strategy of the two AHUs, serving the core and perimeter zones, was based on two modes:
Heating mode:
Chilled ceiling reduces capacity to maintain room dry-bulb temperature at 22.5 °C ± 1.5 °C.
AHUs increase supply air temperature proportionally up to 27 °C in response to the zone that has the highest call for heating.
Cooling mode:
The chilled ceiling increases capacity to maintain room dry-bulb temperature at 22.5 °C ± 1.5 °C.
AHUs reduce supply air temperature proportionally down to 16 °C in response to the zone that has the highest call for cooling.
The simulated emergency diesel generators have full load capacity of 275 kW, fuel consumption of 55 L/h, annual operating hours of 4 h and annual oil usage of 220 L.
2.5. Metering Requirements
The metering arrangements assumed in this analysis are presented in
Table 5.
2.6. Virtual Environment Integrated Environmental Solutions
The VE-IES is an integrated suite of a dynamic thermal modeling applications linked by a common user interface and a single integrated data model [
41,
52]. Within the suite, the simulator could control the precision of the model within all steps of model production, manipulation and simulation. The VE-IES suite consists of different integrated modules: the “APLocate” database for the hourly weather profile of the investigated location, “ApacheSim” for thermal simulation, “ApacheHVAC” for modeling HVAC systems and control, “SunCast” for solar shading analysis and “MacroFlo” for modelling natural ventilation and mixed mode systems. Furthermore, the VE-IES suite utilizes “ModelIT” as the application used for the input of the three-dimensional building detailed geometry.
Building constructions, building occupancy patterns, local hourly weather data, building HVAC systems and natural ventilation openings data, described earlier, could all be input via prebuilt databases or created by the user through a graphical user interface. The VE-IES suite has been used widely and has undergone the most rigorous validation studies with the most powerful modelling capabilities [
22,
53,
54,
55]. It is worth mentioning that differences between simulation results and actual measured data could be attributed to [
56]:
Differences between actual and simulated weather conditions
The actual heat and mass transfer mechanisms operative in individual components and the algorithmic representation of those mechanisms in the simulation software
The actual interactions of heat and mass transfer representation in the simulation software.
3. Simulation Results
14 January was deemed as the design day since the peak dry bulb temperature recorded on that day in Sydney was 34 °C whilst the level of cloud cover did not exceed 1 Okta (0 Okta means completely clear sky and 8 Okta means completely overcast sky). The energy consumption for the building was calculated for the entire year, whilst the suitability of the installed plant was assessed using the design day as listed in
Table 6.
Two main scenarios were simulated in the current study in accordance with the NABERS requirements: the base case and the off-axis. The energy usages for the building based on the base case and off-axis scenarios are listed in
Table 6. For the base case, the total electricity consumption of the building was around 3,035,319 kWh. However, not all items are required for NABERS analysis. The tenancy lighting and equipment are not required. This reduced the amount of consumed electricity to around 1,006,753 kWh, which was used in the rating test. For the off-axis scenario, the total electricity consumption of the building is around 3,045,918 kWh. The reduced amount of consumed electricity was around 1,017,352 kWh, which was used in the rating test.
The off-axis scenario was used to illustrate that accurate initial commissioning and diligent system management during its operation are critical to the effectiveness and energy efficiency of the system. The off-axis scenario incorporated the following changes to the base case scenario strategies, including:
AHU serving perimeter floors supplies constant temperature air at 20 °C
AHU serving core zones supplies constant temperature air at 20 °C
The economizer cycle provides 14,000 L/s or return air all the time
No dead bands on the heating and cooling coil operation on the 5th floor
After hours equipment loads set to 75% from 50%.
Lighting loads out of hours set to 25% from 15%.
3.1. Atrium Conditions
Daytime natural ventilation with a maximum air velocity cannot bring the indoor average temperature below the outdoor level regardless of the fenestration’s orientation. It has been reported that the natural ventilation could reduce the difference in outdoor and indoor temperatures by 80% and 50% during daytime and nighttime, respectively [
58]. The temperature distribution within the atrium under forced mechanical ventilation is shown by
Figure 2 for the design day (14 January). The air temperature at all levels was maintained below the design limit of 24 °C as shown by
Figure 2. However, the radiant temperature was found to be higher than 24 °C at the upper 2 levels. This is related to the building orientation, shading effects and Sun’s location in the sky.
The building orientation is crucial for reducing the incident solar radiation on the building envelope surfaces [
59,
60,
61,
62]. It has been found that the solar radiation could increase by 7.7% when the broader side of the building faced east. This is the case here for the simulated building. The only difference here is the effect of surrounding high rise buildings as shown by
Figure 1 and
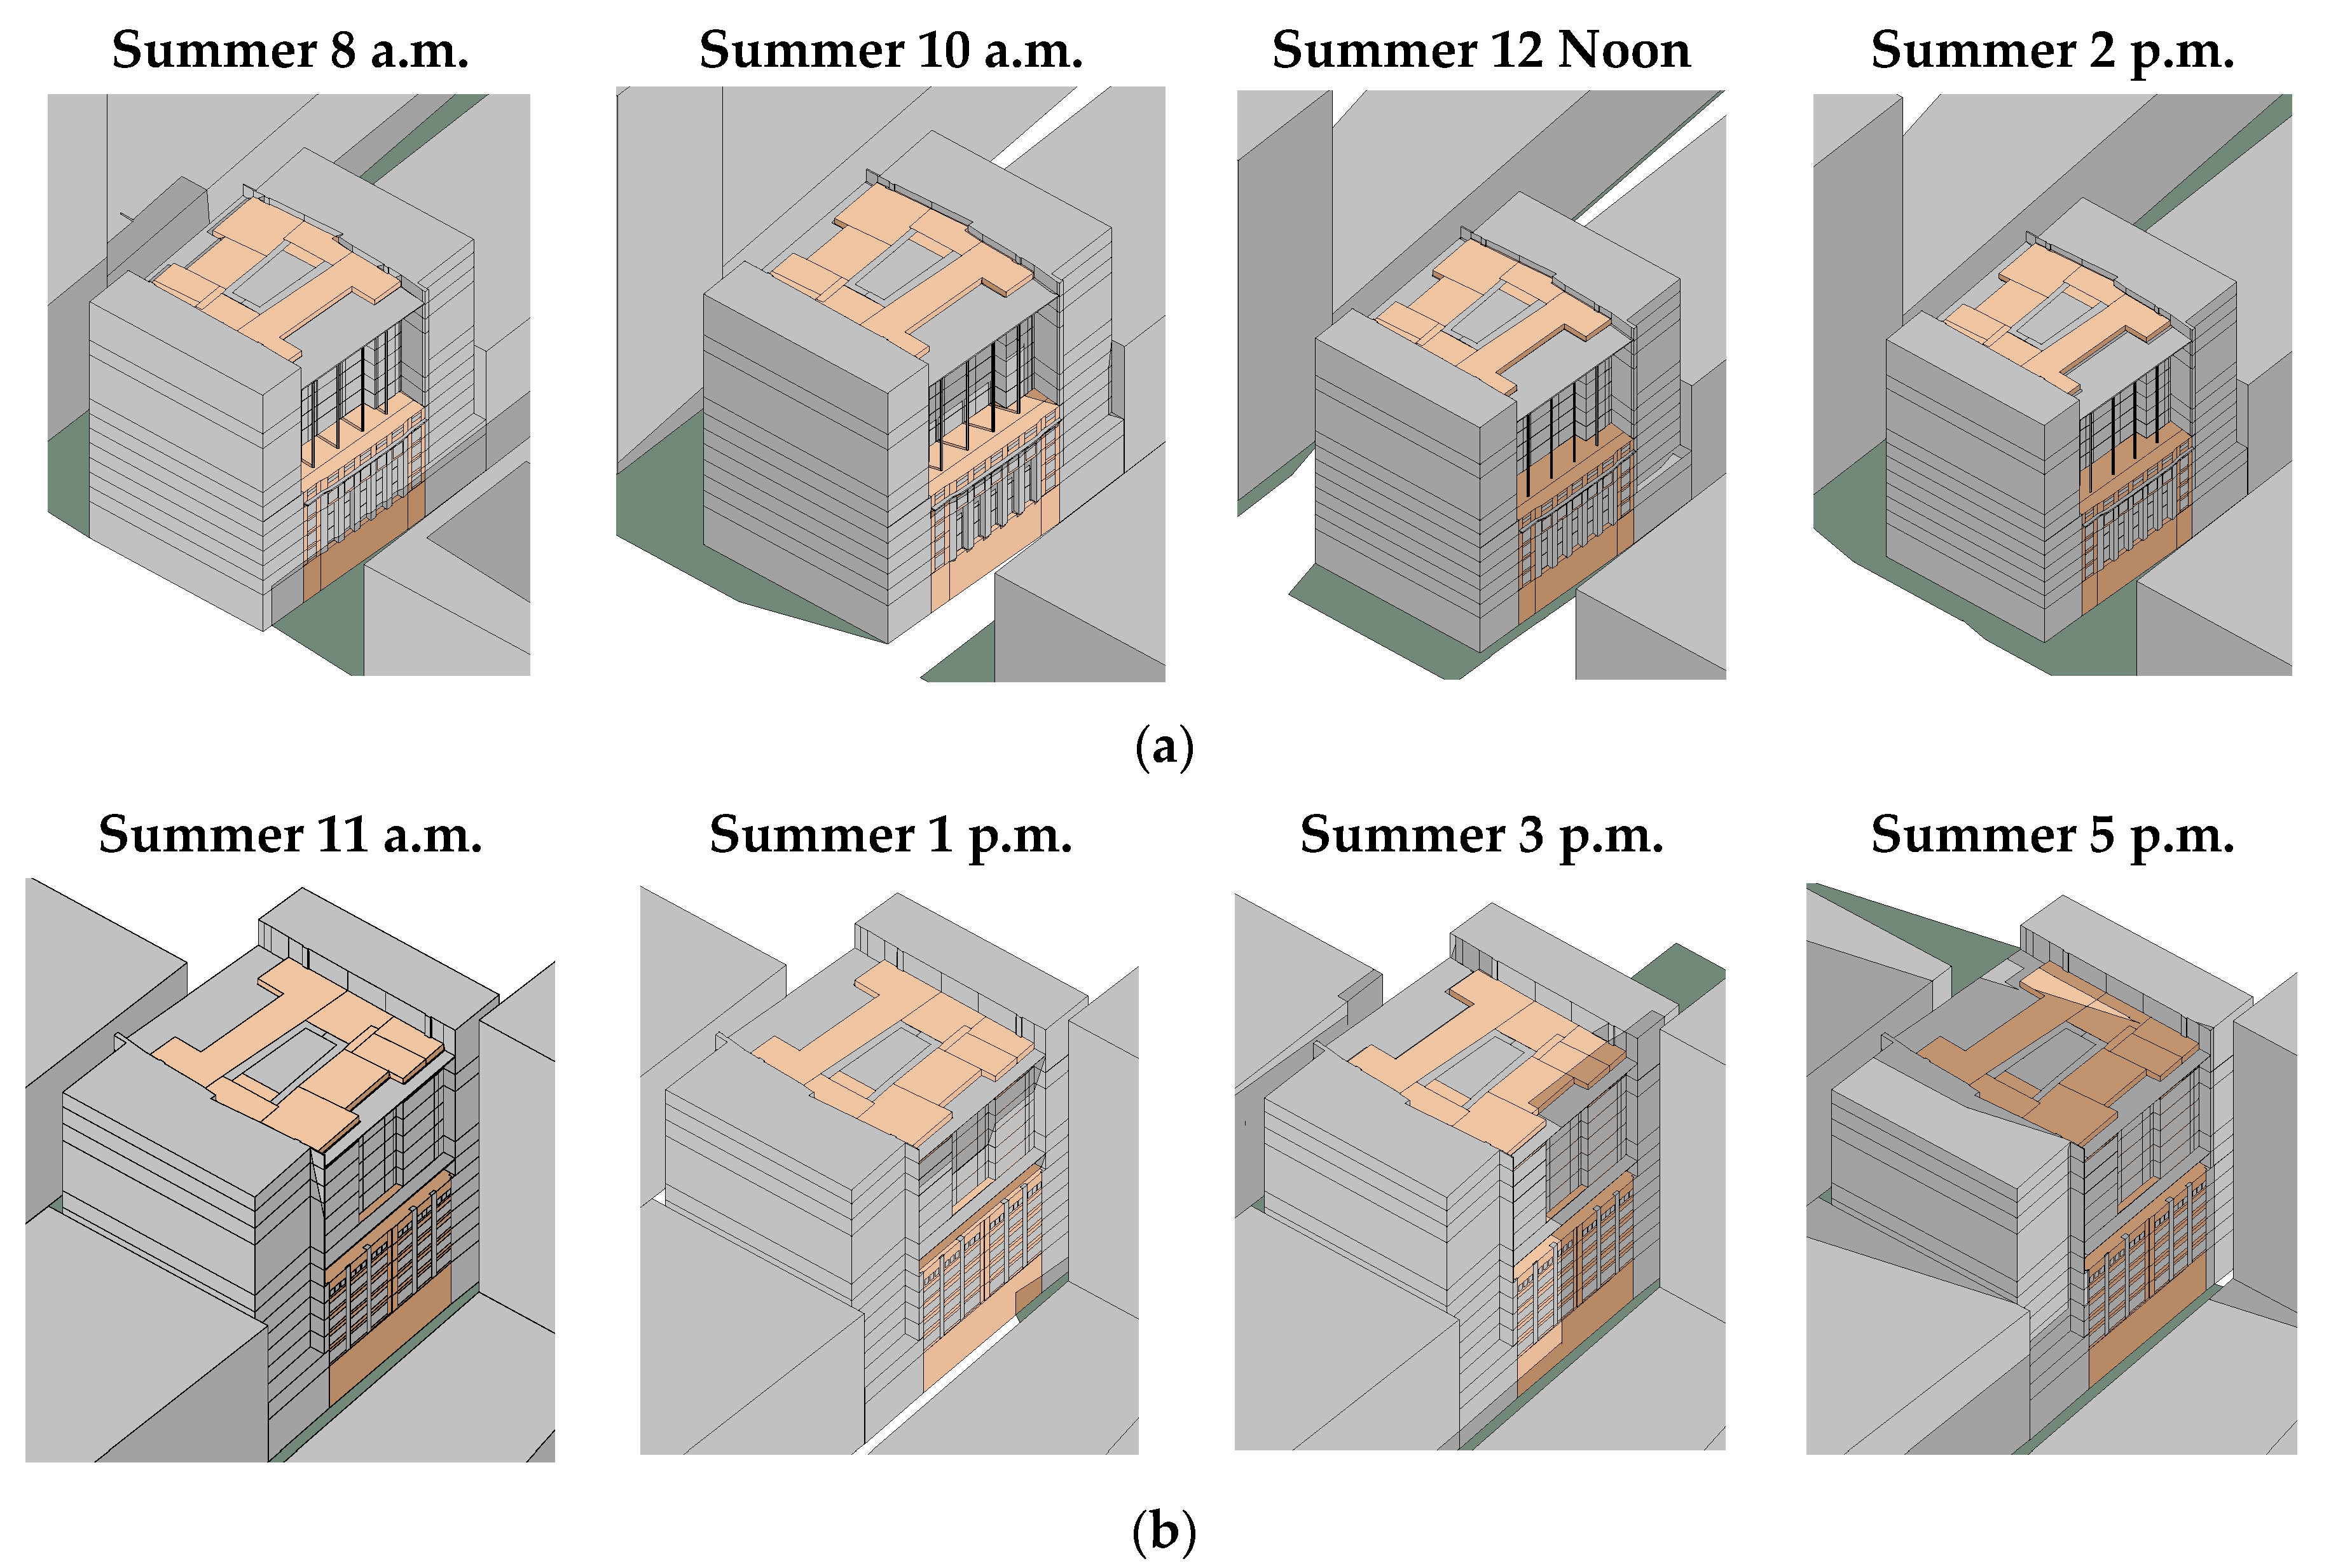
Figure 3. The direct Sun radiance hits the lower eastern facade (lower six floors) for three hours at most during the day. Apparently, the external shading elements are performing well as per their design goal. The upper six floors are more exposed to sun radiance, and the surrounding buildings have minimal effects. The western facade is exposed for even less hours, and the effect of surrounding buildings are more significant compared to the eastern facade. Therefore, the main reason behind the high mean radiant temperature in the atrium comes from the skylight located at the rooftop of the atrium.
On a typical Sydney summer day, the solar altitude angle of the Sun is almost at 80°. This means that the Sun radiation penetrates the atrium skylight almost vertically during the midday period as shown by
Figure 3. Therefore, the floor temperature at Level 2 is affected by Sun radiance. As a result, the air temperature at Level 2 is higher than the other lower levels. At the higher levels of the atrium, the Sun radiance hits the floors and the walls surrounding the atrium. Therefore, the heat resulting from the radiation was relatively higher than the radiation at lower levels.
3.2. Atrium Skylight
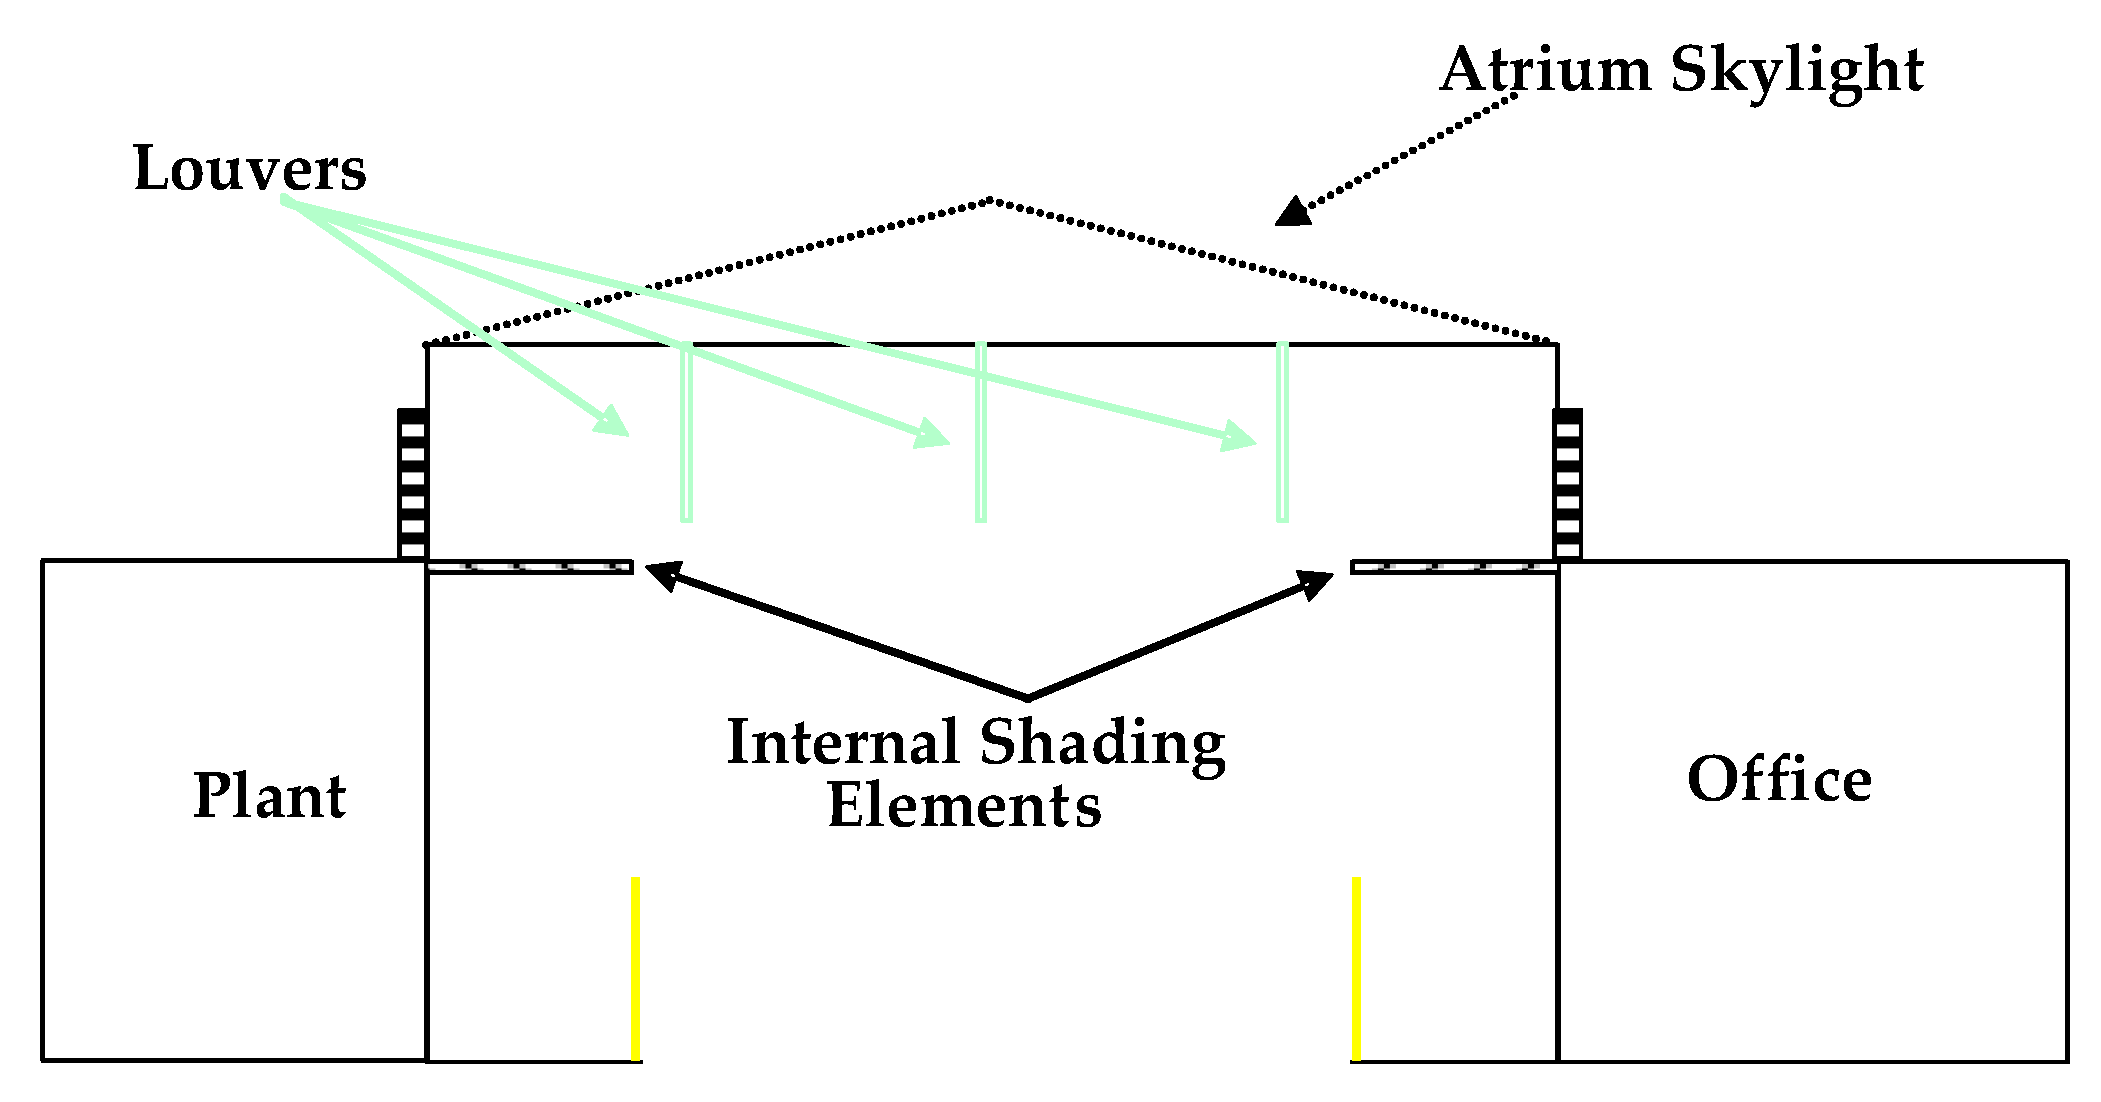
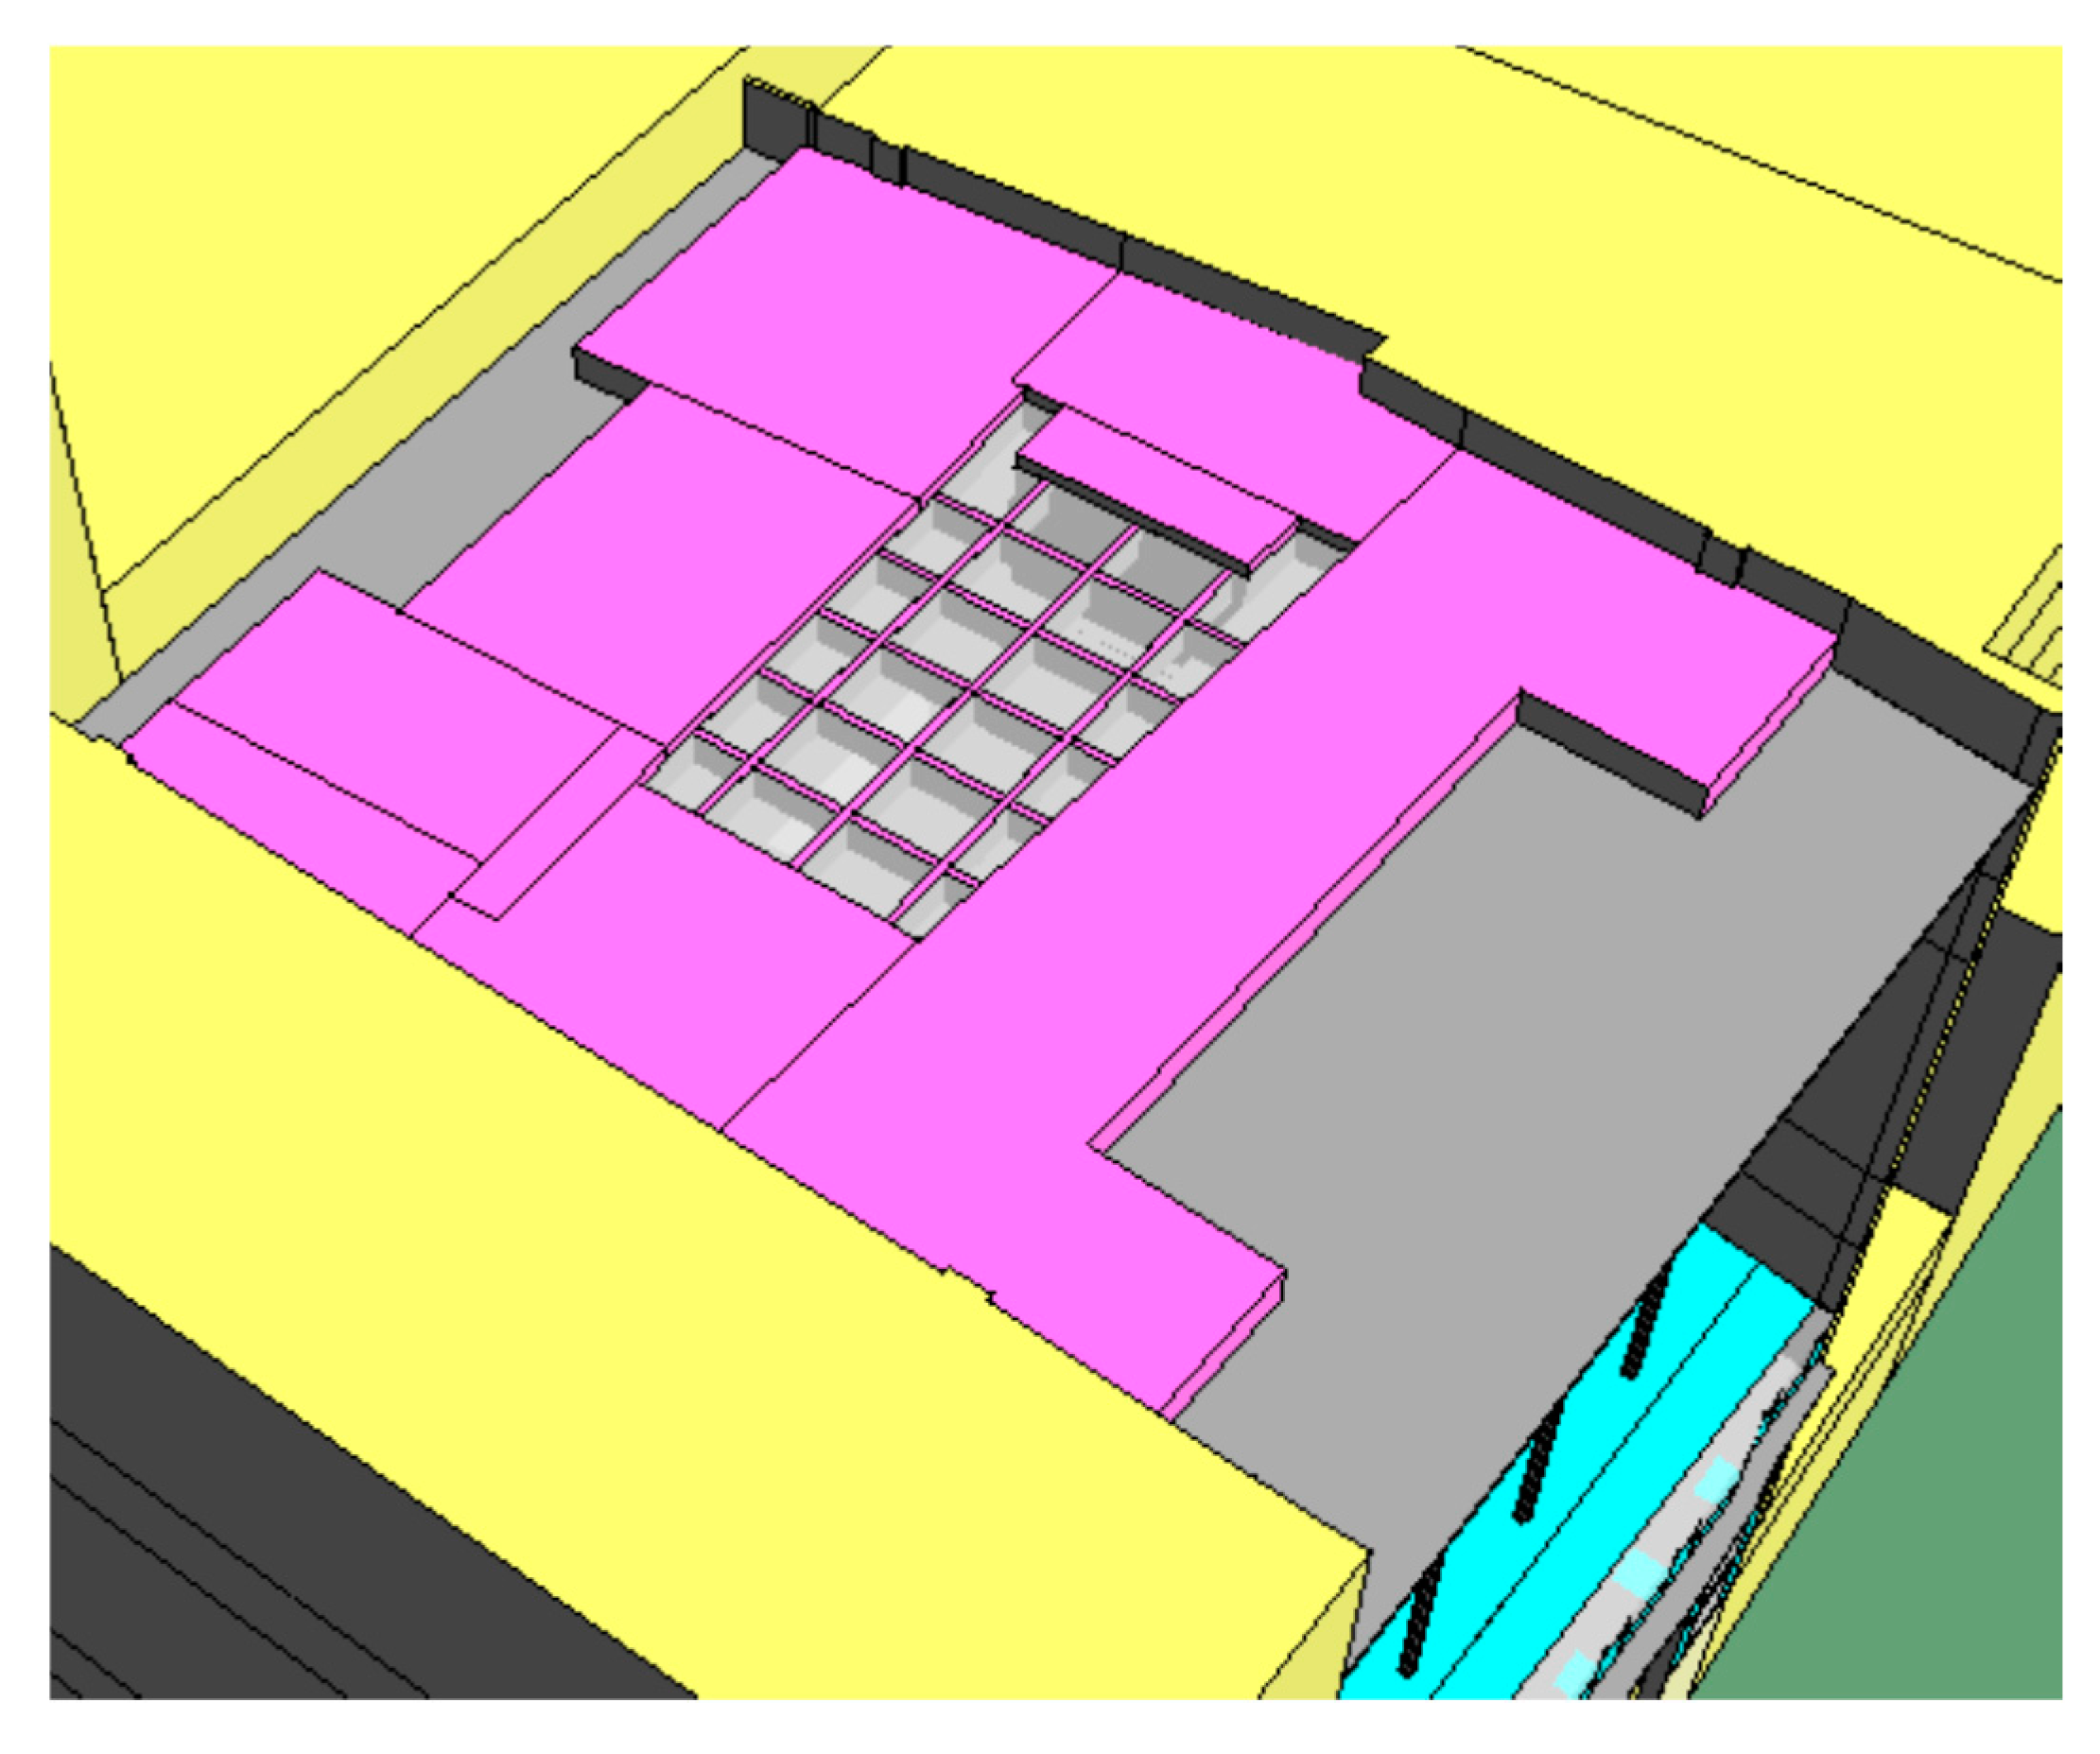
The glazing type of the skylight is important to the indoor air temperature and the satisfaction of the people occupying the space. Different glazing types have been considered and the corresponding effects of each of them have been outlined in this section. To reduce the effect of direct solar radiation on the atrium environment, internal shading louvers have been utilized. The purpose of these louvers is to enlarge the shading ratio, especially on windows, to keep spaces conditioned, lower energy demands and reduce glare levels near windows [
63]. For the investigated cases, the recommended internal louvers have been implemented as shown by
Figure 4.
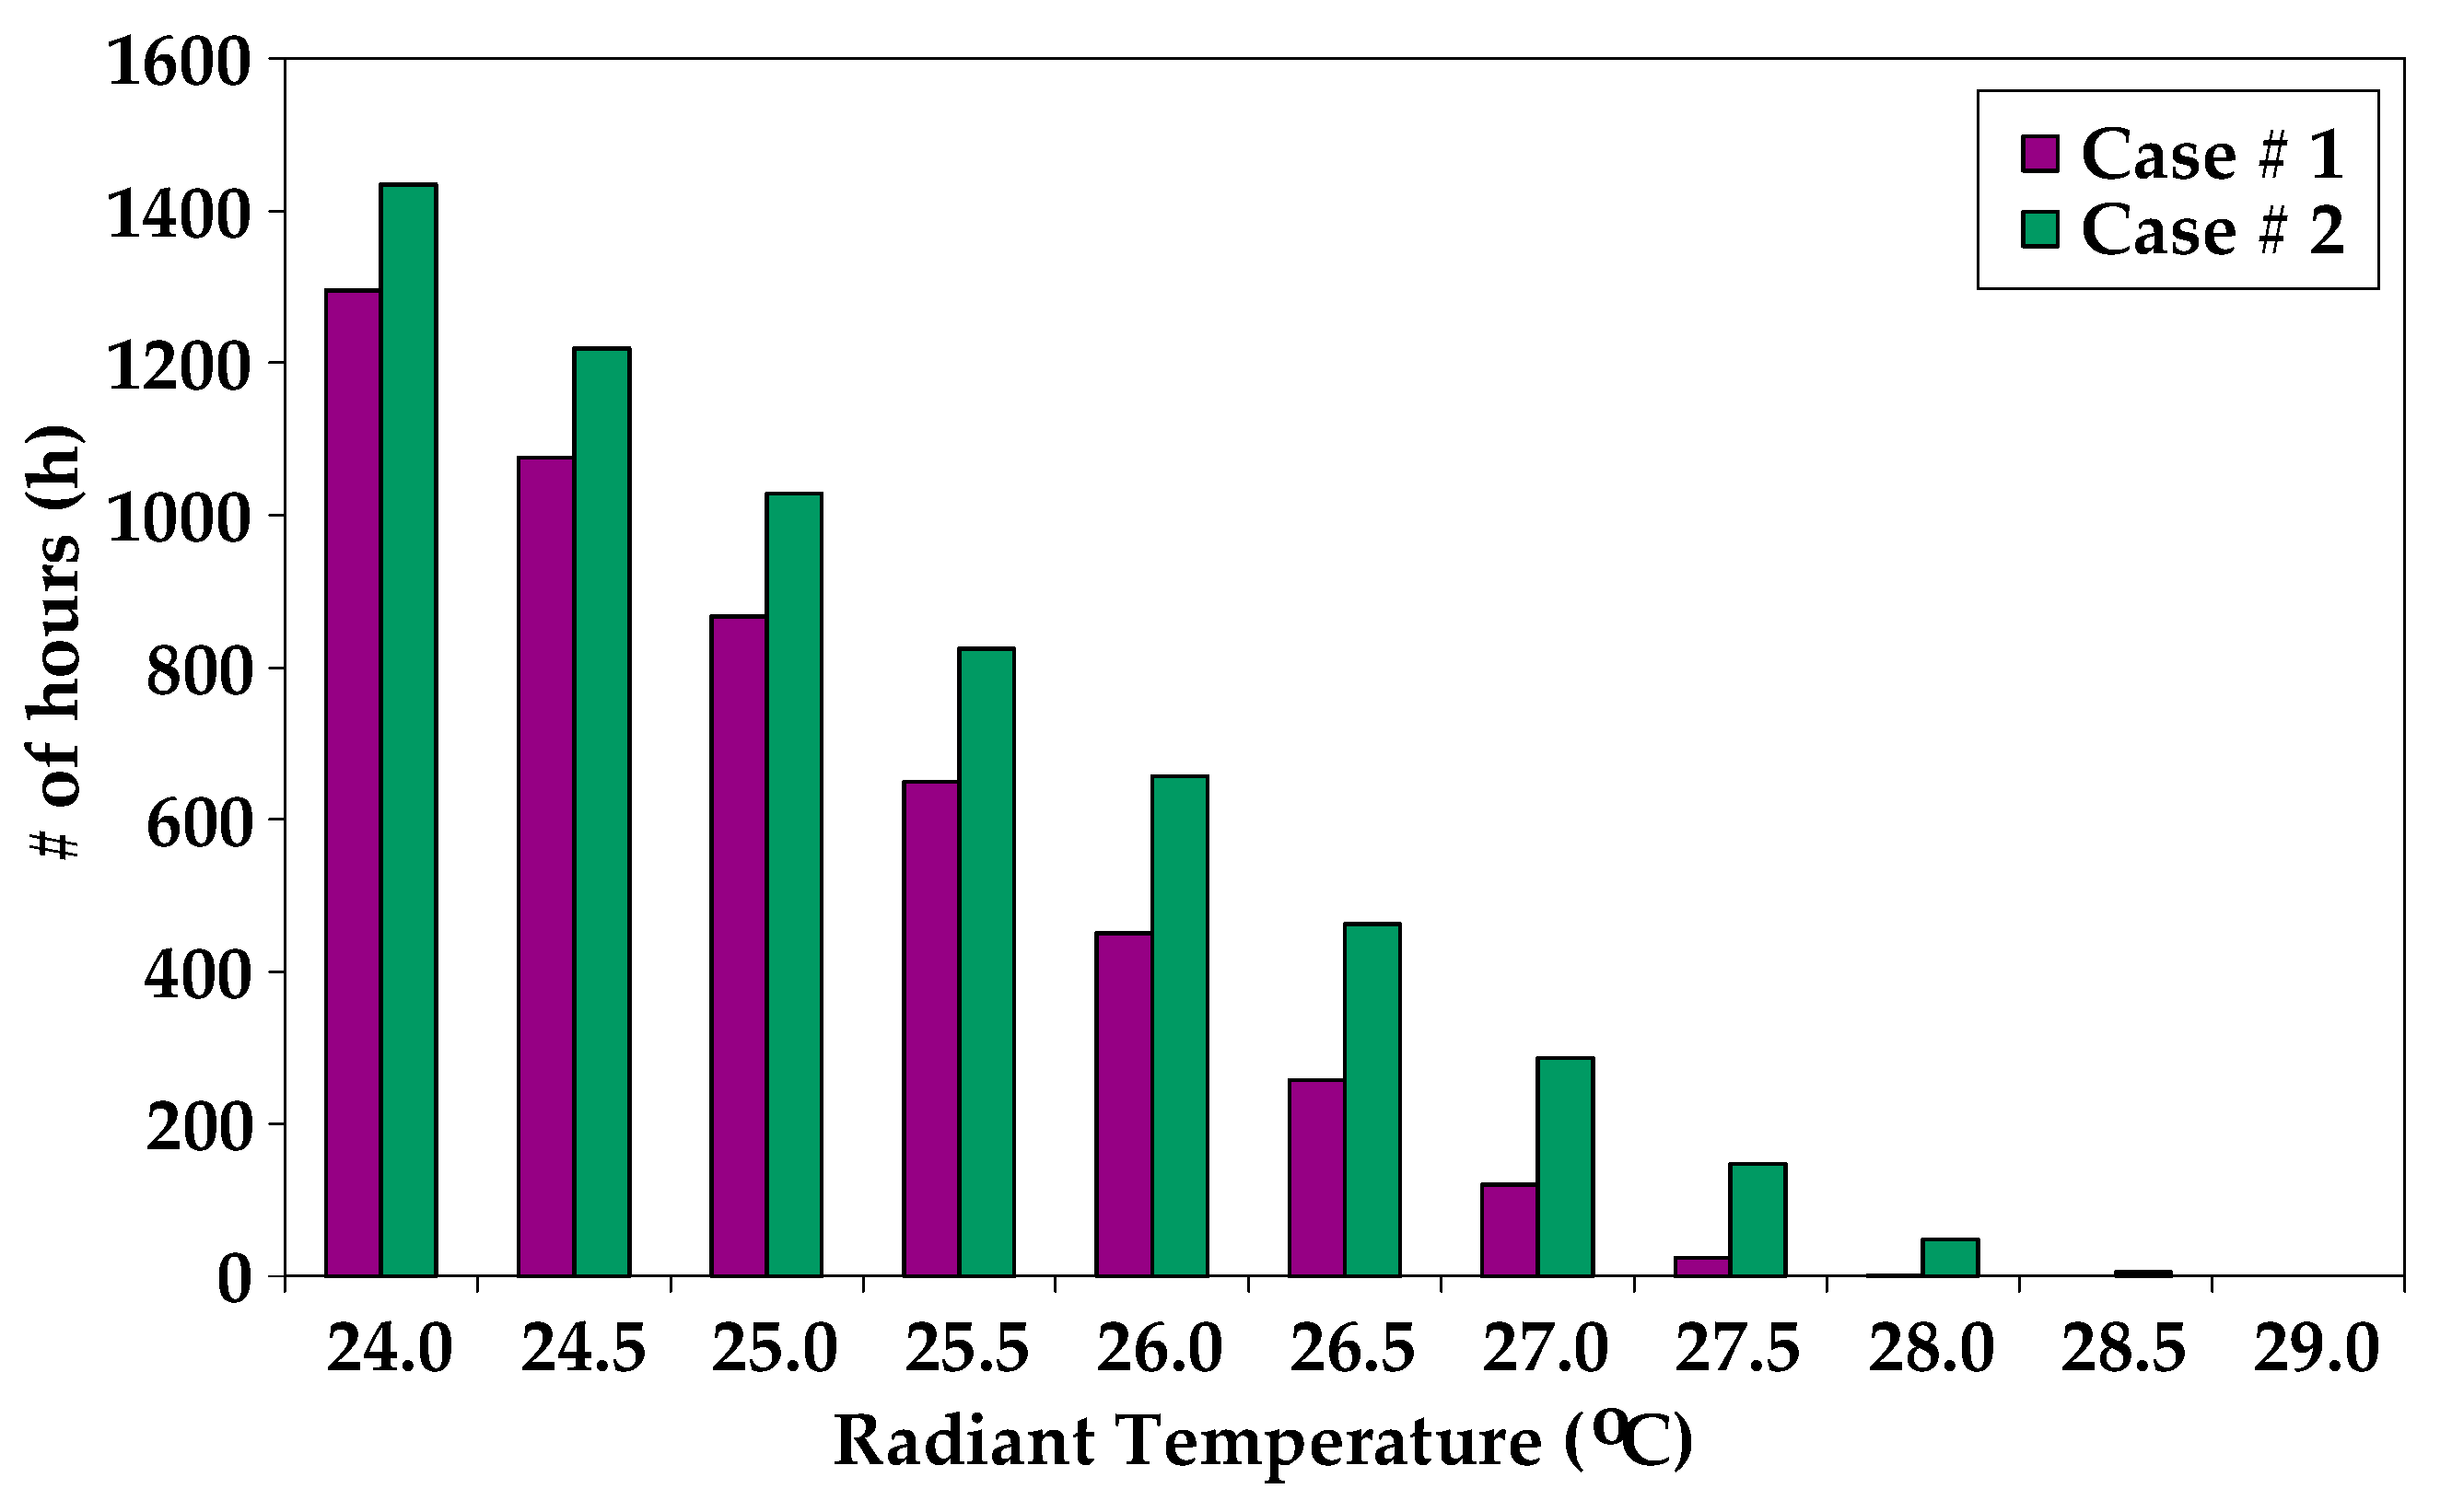
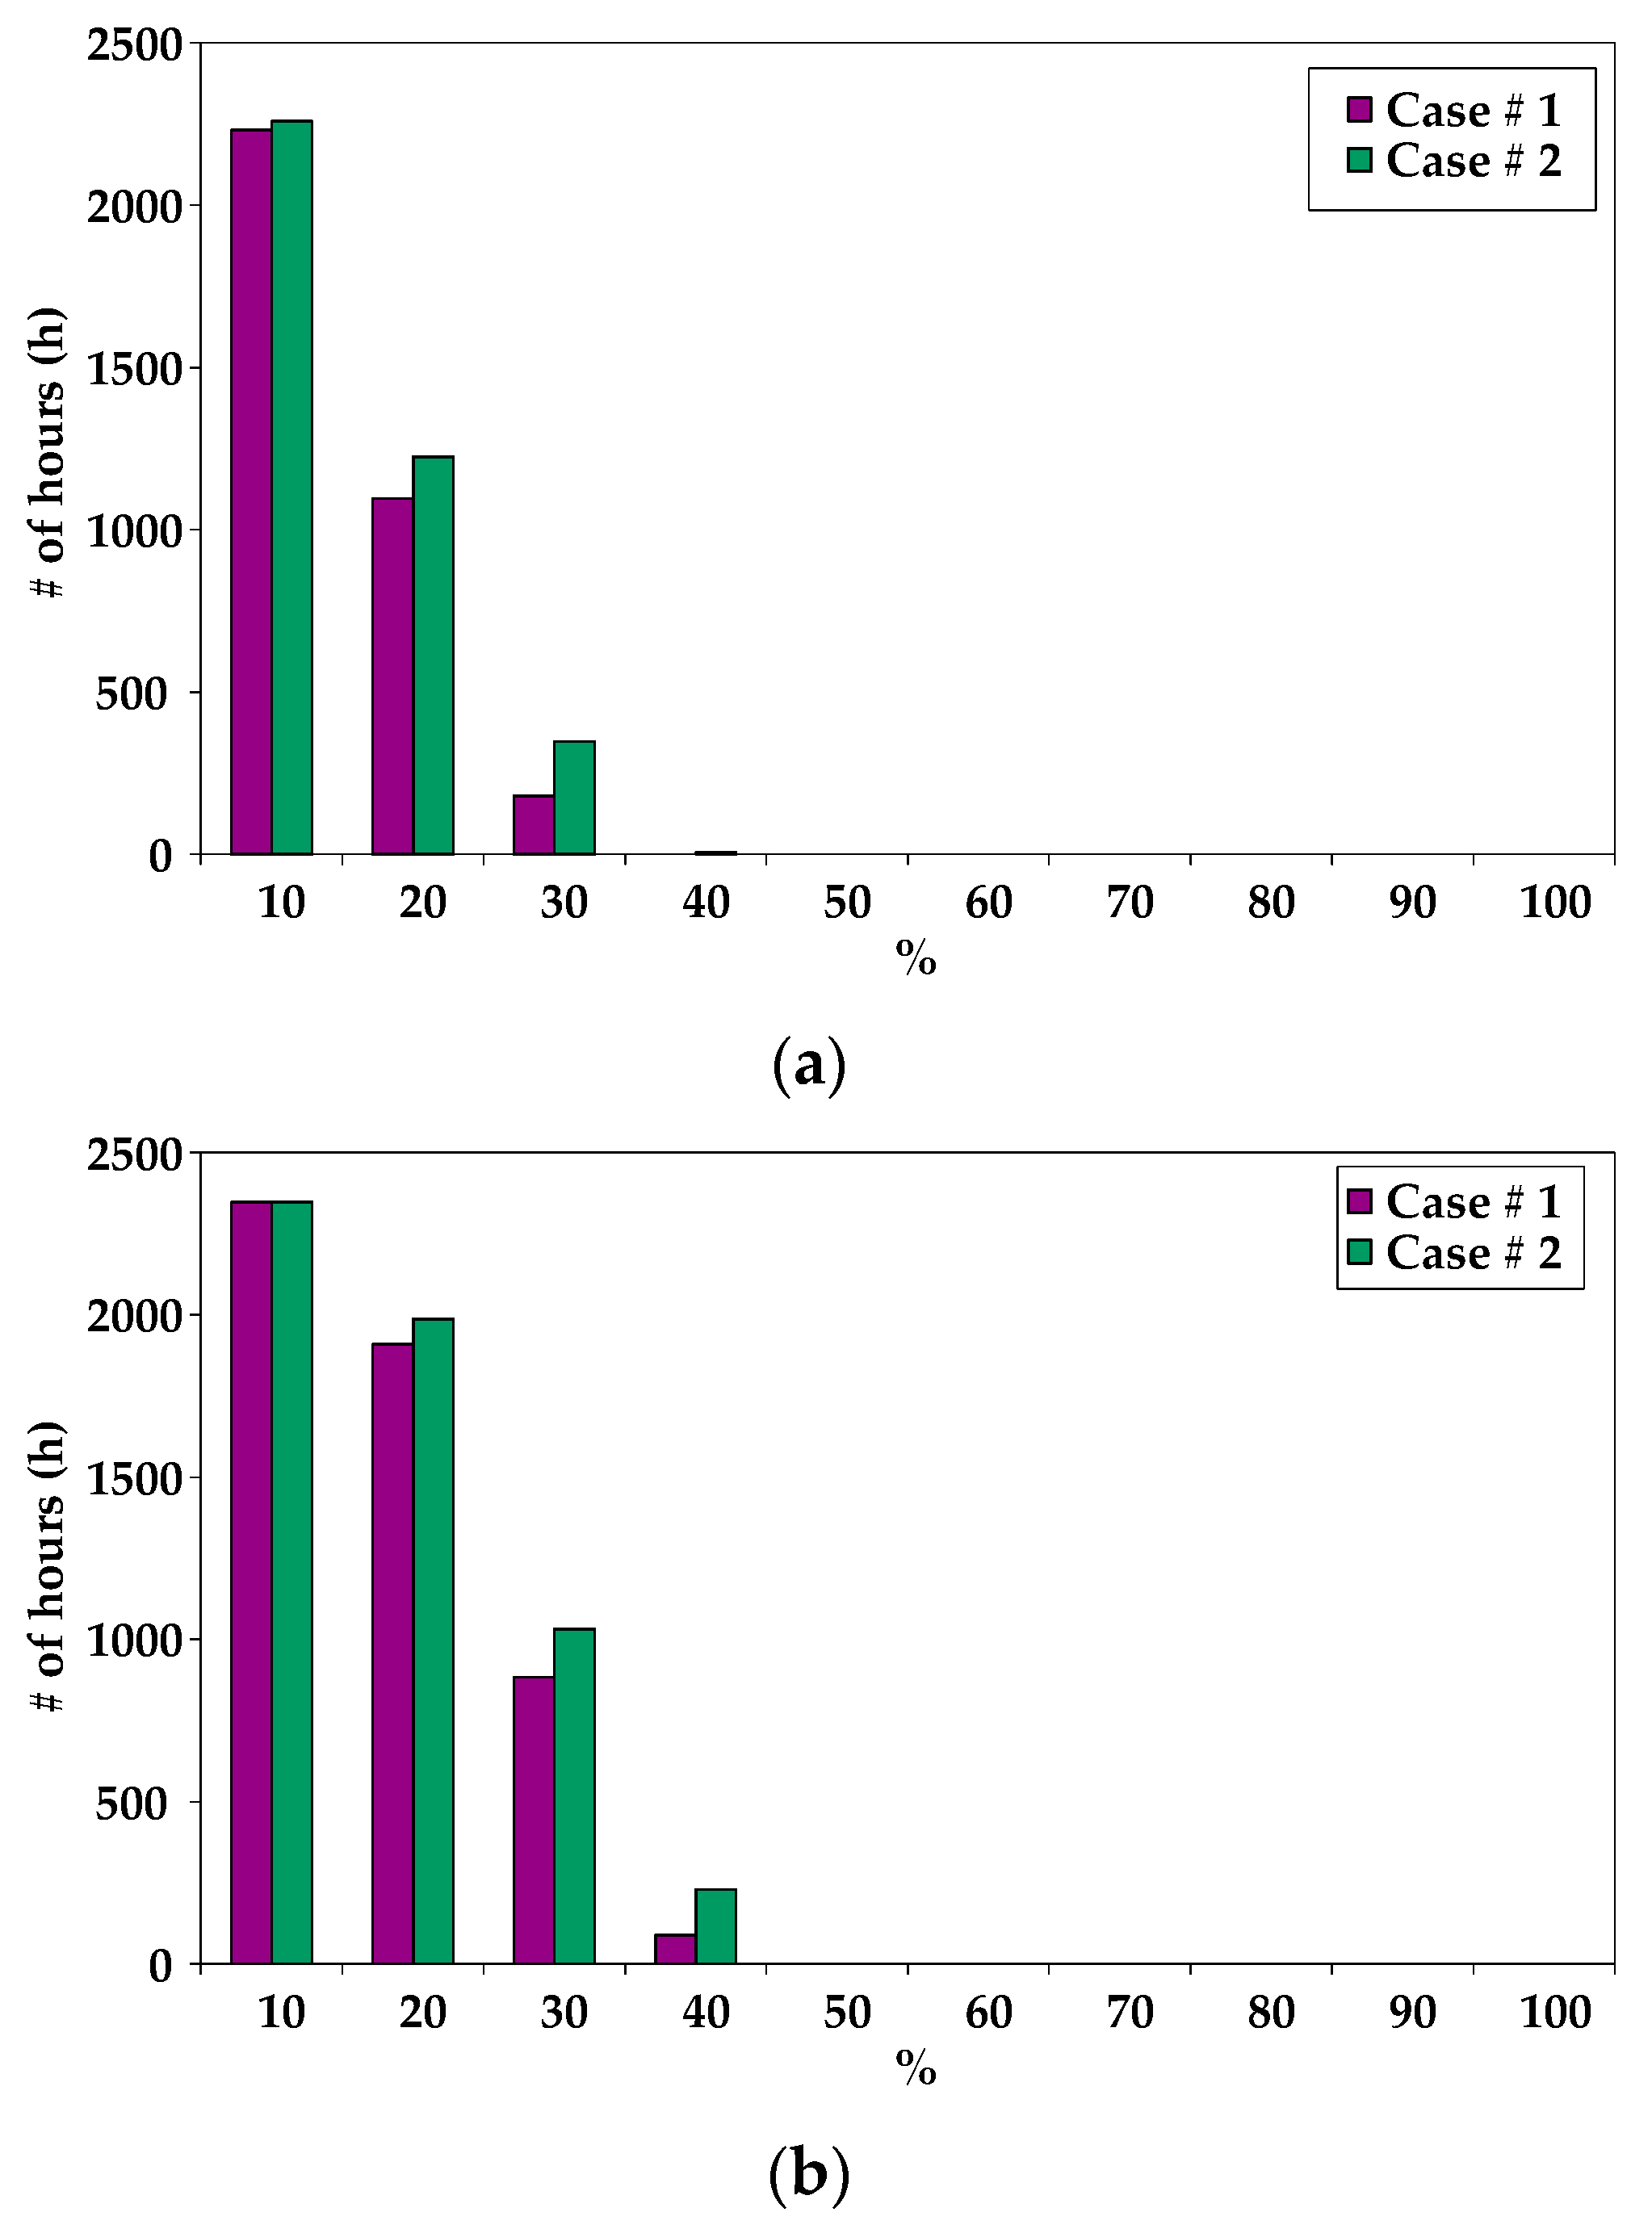
The glazing type has been differentiated by the use of the shading coefficient factor of the given glazing used in the skylight. The investigated options for the skylight glazing were:
Case # 1, SC = 0.25 another type of glazing
Case # 2, SC = 0.30: a new type of glazing.
The air temperature within any modelled zone is maintained at or below 24 °C throughout the current analysis. The air temperature by itself is not fully sufficient to reflect the thermal comfort of occupants. The effects of thermal radiation on occupant comfort is important and must be integrated [
64,
65,
66]. This could be achieved by utilizing the mean radiant temperature (MRT) [
67,
68].
Figure 5 shows the mean radiant temperature within the corridor area at Level 13 for SC of 0.25 and 0.3. The corridor area has been modelled as an area open to the skylight and the atrium. An acceptable range of the radiant temperature of occupied areas lays between 3 °C greater or lower than the air temperature of a given space. Although the glazing with SC = 0.25 has performed better than the glazing with SC = 0.3, both cases have failed in providing a comfortable indoor environment as shown by
Figure 6. As a result, further modifications need to be considered to further reduce the effect of the radiant temperature within the space.
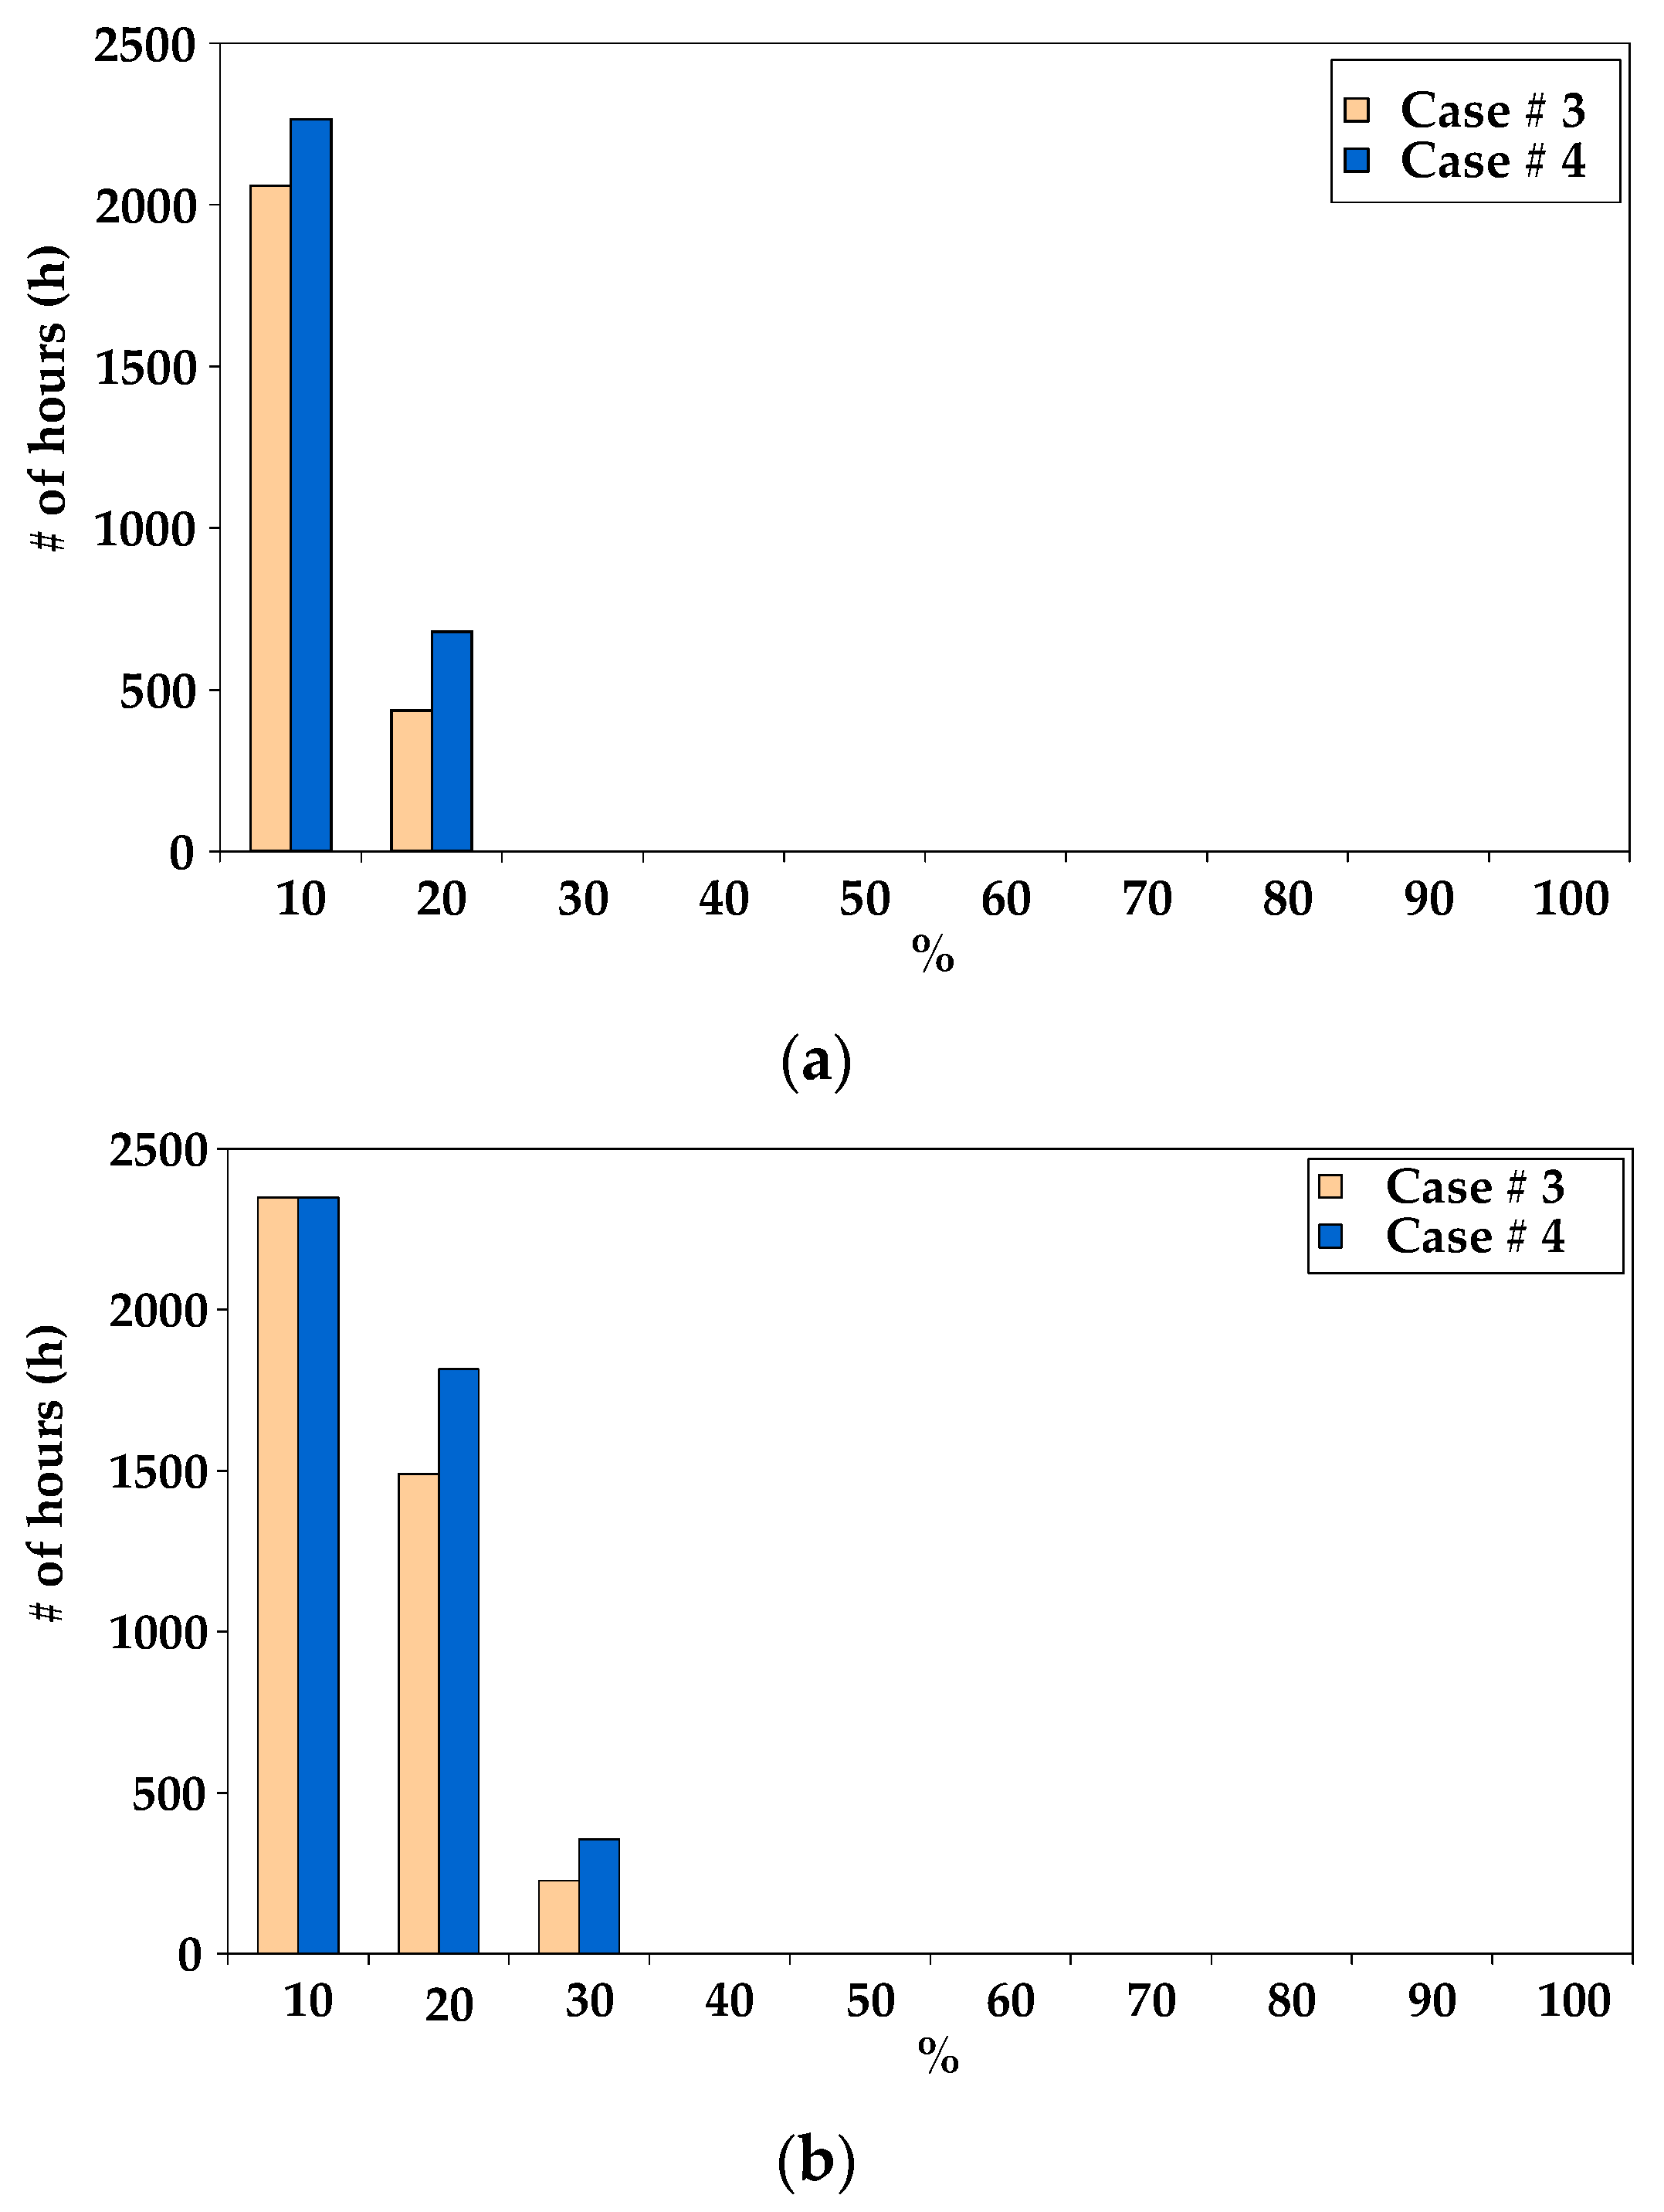
In the original analysis, it has been proposed that a passive chilled ceiling be provided within the corridor at Level 13. The effect of the new SC of 0.3 with passive chilled ceilings installed has been considered as shown by
Figure 7 (Case # 3). A significant improvement in the indoor air temperature has resulted as shown by
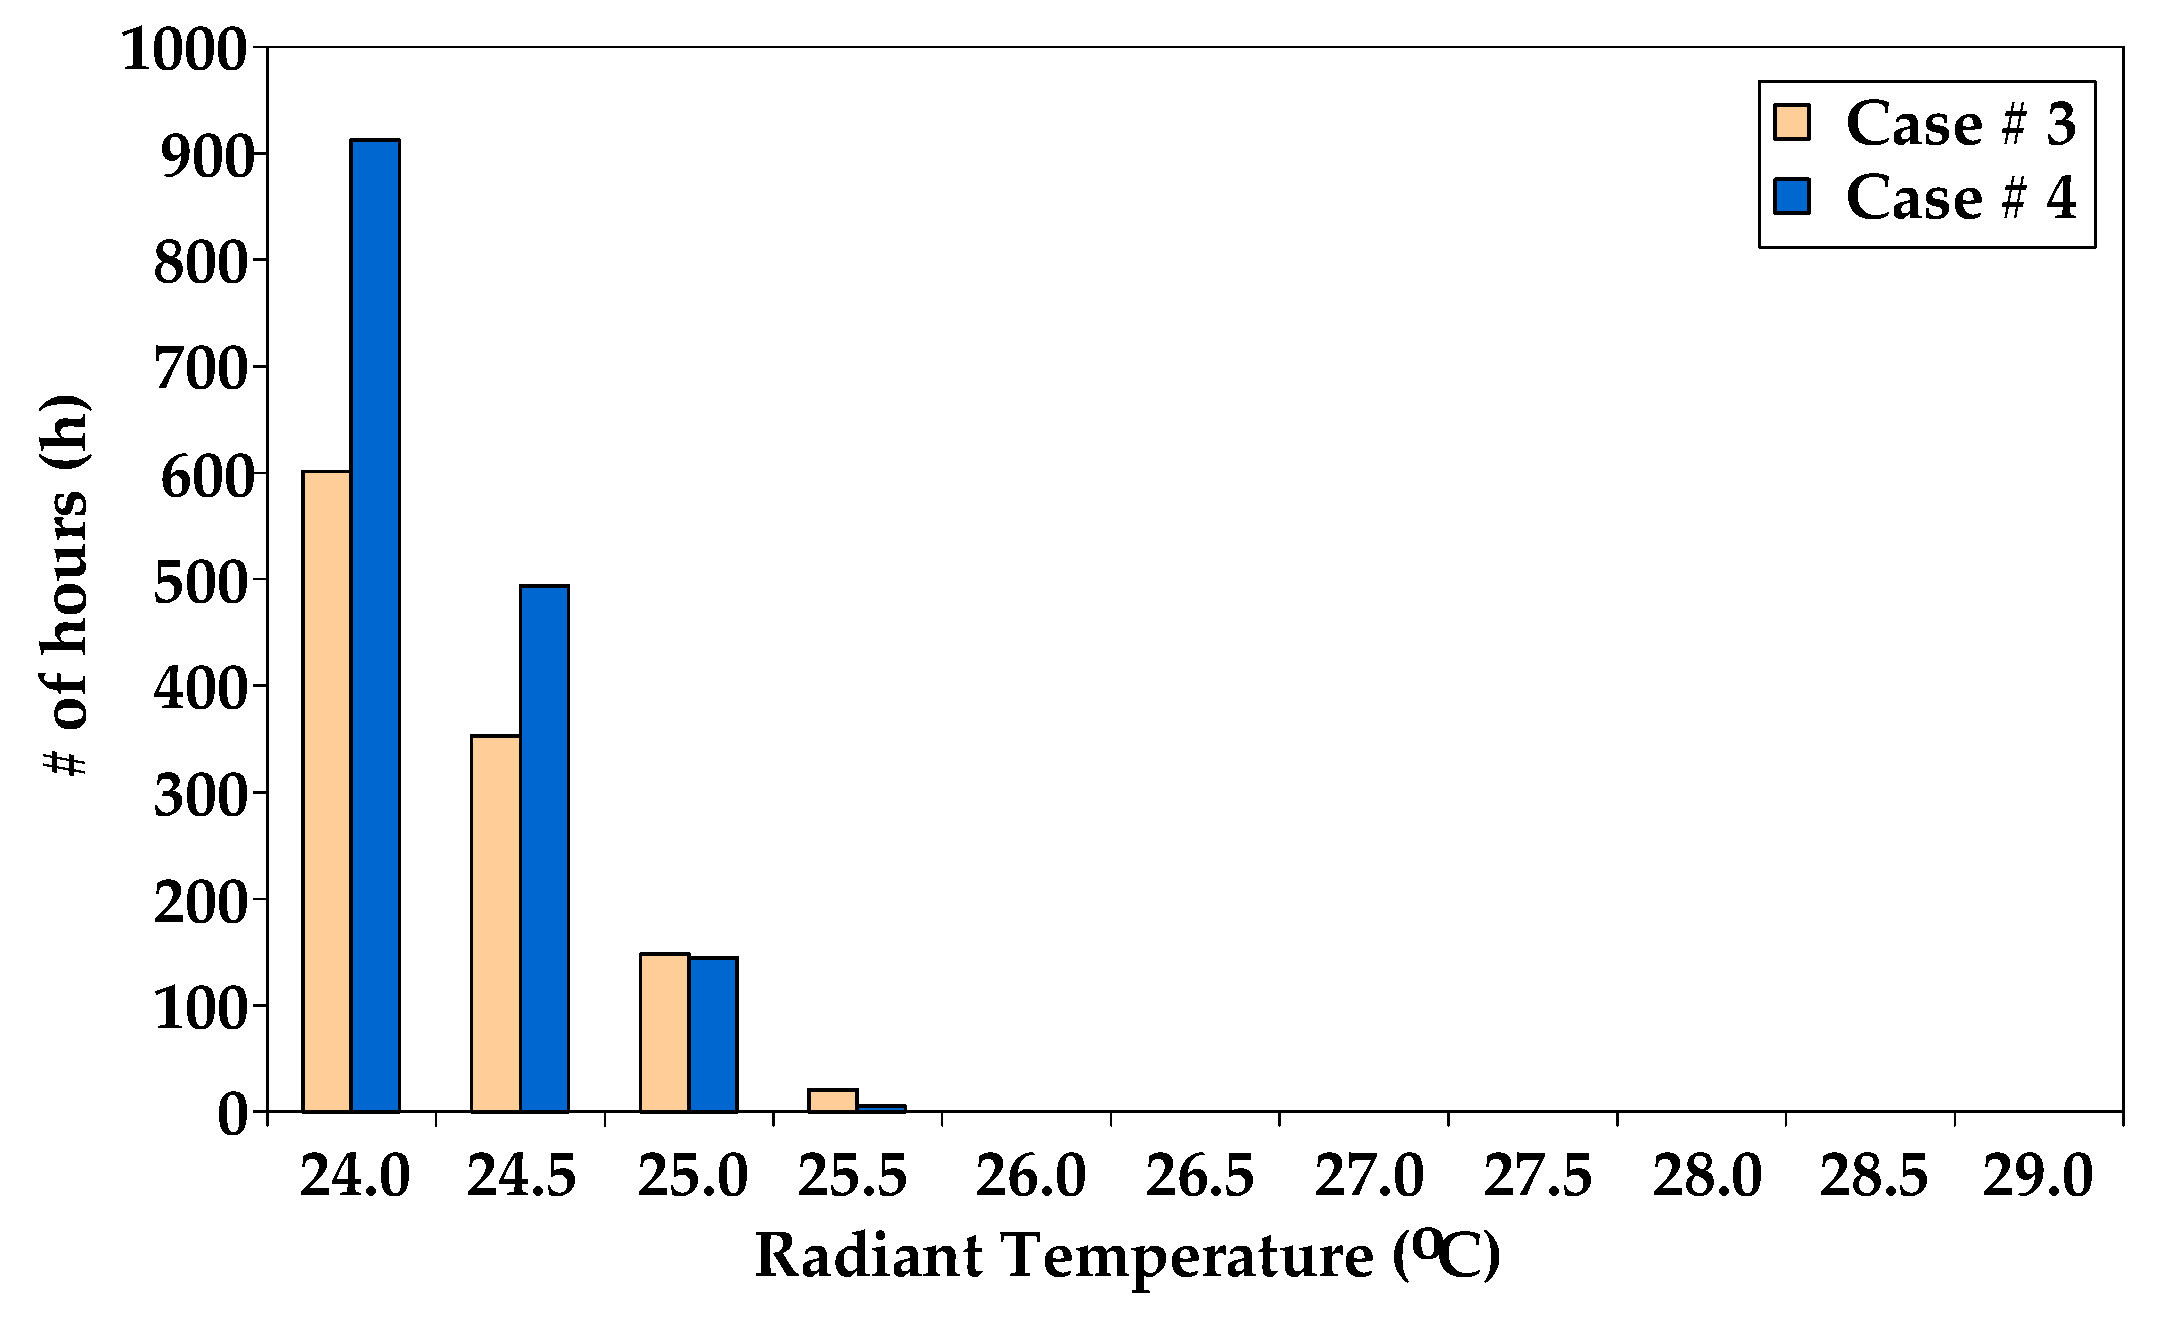
Figure 8. The radiant temperature shown by
Figure 8 is less than 26 °C for Case # 3, which is considered comfortable, as confirmed by
Figure 9. This option is considered to be a strong candidate from the comfort point of view. From the energy and economical point of view, it is considered an expensive option. Therefore, a simple internal shading element has been considered to replace the chilled ceilings and to reduce the cost and the energy consumed by the chilled ceiling for the corridor area of Level 13 (Case # 4). As a result, the use of a skylight glazing with an SC of 0.3 is a valid option provided that shading elements are provided for the corridor area at Level 13.
3.3. Interpretation of Results
The simulation analysis demonstrated that the chilled ceiling system serving all the building NLA held temperature for the design day as expected. The air dry bulb temperature in each of the respective spaces did not exceed the designed condition of 24 °C. The expected energy ratings based on NABERS performances are presented in
Table 7. These results could be translated as the building has demonstrated excellent greenhouse performance. Furthermore, the building has reflected excellent design and management practices, high efficiency systems and equipment and/or energy sources with low emissions.
Despite achieving a theoretical 5 star NABERS rating, it is recommended that if a commitment agreement is undertaken, a 4.5 star rating can be sought. Achieving an actual 4.5 Star rating will require diligent commissioning and operation to ensure that the building is finely tuned.
3.4. Risk Assessment
Table 8 lists the risk factors that may impinge upon the achievement of the nominated estimated performance. The potential impact of these risks and suggestions as to how these risks might be mitigated are included.
3.5. Findings and Recommendations
The modelling analysis undertaken has concluded that a theoretical 4.5 star rating is achievable. However, the energy analysis has proven that achieving a 4.5 star rating will not be easy, and great care is needed during the design stage, construction stage and, most importantly, the commissioning stage to ensure that the building operates at its peak performance. To achieve the required performance, the following recommendations are made:
Internal blinds are required on all external facades to reduce the occupied spaces’ radiant temperature and provide occupant glare control.
The economy cycle must be provided to the active perimeter zone. AHUs need to modulate between 0 L/s and maximum outdoor air to maintain the supply temperature as long as the return air temperature is greater than the outdoor air.
All fans must operate on building management system (BMS) time-switches to shut them down after normal operating hours.
High efficiency chillers with extended evaporator vessels are recommended. These units must operate at 7 °C/14 °C supply/return water temperature.
Cooling towers should be selected to return 28 °C condenser water to the chillers during a peak design day. Cooling towers should be operated such that the condenser water return temperature is modulated to maintain the maximum chiller performance at all times.
The loading dock ventilation system should be provided with the CO monitoring system to control ventilation fans.
All hot water heating pipe work and valves must be fully thermally insulated and sheathed.
All lighting including tenant, common loading dock, plant room and external lighting should be controlled via the building management system (BMS) to shut off after hours.
Extensive sub-metering is recommended to allow the building manager to log and benchmark all energy-consuming plant items.
Variable speed drives should be fitted to the tenant condenser water loop pump(s) and solenoid valves to all water cooled condensing units to shutdown condenser water flow when the units are not in operation.
The retail tenancies must be conditioned using water cooled packaged units which are powered off the respective tenancy switchboards.
Miscellaneous plant room ventilation fans must be operated on time switches overridden by temperature sensors.
All AHUs must be provided with filter over static alarms.
The atrium skylight is recommended to be provided with a 50% frit directly above the walkways 2.5 m from the edge. The glazing is recommended to be provided with a shading coefficient of no more than SC 0.25.
4. Conclusions
The current thermal and energy study has been undertaken to predict the energy rating and determine the requirements to achieve a 4.5 star rating in accordance with the NABERS Energy for a commercial buildings. The energy simulation study was undertaken in accordance with the NABERS Energy and Water for Offices-Rules for collecting and using data.
As part of the energy consumption simulation, a sensitivity analysis was carried out in accordance with the NABERS Energy and Water for Offices-Rules for collecting and using data. This analysis simulated the inherent sensitivity of the building services to demonstrate areas of risk that might prevent the building from achieving the predicted star rating. The proposed design as outlined has achieved a theoretical 5.0 star rating.
In addition to providing chilled ceiling technology, high efficiency chillers and low energy lighting, it is recommended that the building be extremely well tuned during the commissioning period. This will require a significant amount of on-site time during the defects liability period. It is recommended that an independent commissioning contractor be employed.
Further analysis has been undertaken within the atrium to determine the most appropriate shading devices for the purposes of maintaining comfortable conditions at all periods of the year. It has been found that the effect of solar radiation is very high, which cannot be overcome by simply installing a low shading coefficient glazing type at the atrium skylight. The same conclusion could be drawn for the skylight at Level 7 of the building.


