Article

Thermal Conductivity of Straw Bales: Full Size Measurements Considering the Direction of the Heat Flow

1
Arts et Metiers ParisTech, LaBoMaP, Cluny 71250, France
2
Architecture et Climat, Université catholique de Louvain, Louvain-la-Neuve B-1348, Belgium
3
Institut de Conseil et d’Etudes en Développement Durable, Namur 5000, Belgium
4
Université de Liège, ArGenCo, GeMMe, Liège 4000, Belgium
5
Unité de mécanique et construction, Université de Liège, Gembloux 5030, Belgium
*
Author to whom correspondence should be addressed.
Buildings 2017, 7(1), 11; https://doi.org/10.3390/buildings7010011
Submission received: 6 December 2016 / Revised: 20 January 2017 / Accepted: 25 January 2017 / Published: 5 February 2017
(This article belongs to the Special Issue Insulation Materials for Residential Buildings)

Abstract

:
The thermal conductivity of straw bales is an intensively discussed topic in the international straw bale community. Straw bales are, by nature, highly heterogeneous and porous. They can have a relatively large range of density and the baling process can influence the way the fibres are organised within the bale. In addition, straw bales have a larger thickness than most of the insulating materials that can be found in the building industry. Measurement apparatus is usually not designed for such thicknesses, and most of the thermal conductivity values that can be found in the literature are defined based on samples in which the straw bales are resized. During this operation, the orientation of the fibres and the density may not be preserved. This paper starts with a literature review of straw bale thermal conductivity measurements and presents a measuring campaign performed with a specific Guarded Hot Plate, designed to measure samples up to 50 cm thick. The influence of the density is discussed thoroughly. Representative values are proposed for a large range of straw bales to support straw-bale development in the building industry.

1. Introduction

Straw bale building is constantly developing in Europe and elsewhere. More than a thousand buildings, from dwellings to public buildings, were enumerated, as discussed, in the recent European Straw Bale Gathering [1]. The straw bale community is well-organised and straw bale building techniques are still evolving. Among new developments in prefabrication, building certification, fire resistance, and moisture transfer validations, the thermal behaviour of straw bale walls is one of the key topics in market development.
Despite the straw variability inherent to vegetal materials, the heterogeneous nature of this efficient insulation material is not seen as an obstacle to its development. A rational analysis of the parameters that influence its thermal conductivity can support a rigorous assessment of the energetic and environmental benefits of choosing straw bale building techniques. Straw bales have a larger thickness than most of the insulating materials that can be found on the building market. Measurement apparatus for thermal conductivity is usually not designed for such thickness, and most of the thermal conductivity values that can be found in the literature are defined based on samples in which straw bales are resized according to standard EN ISO 10456 [2] . During this operation, the orientation of the fibres and the density may not be preserved. A specific Guarded Hot Plate was designed in Belgium [3] to measure samples up to 50 cm thick, according to the reference standard ISO 8302 [4].
This paper starts with a literature review of straw bale thermal conductivity measurements and presents a measuring campaign performed with this apparatus. The influence of each analysed parameter is discussed thoroughly. Representative values are proposed for a large range of straw bales to support straw bale development in the building industry.

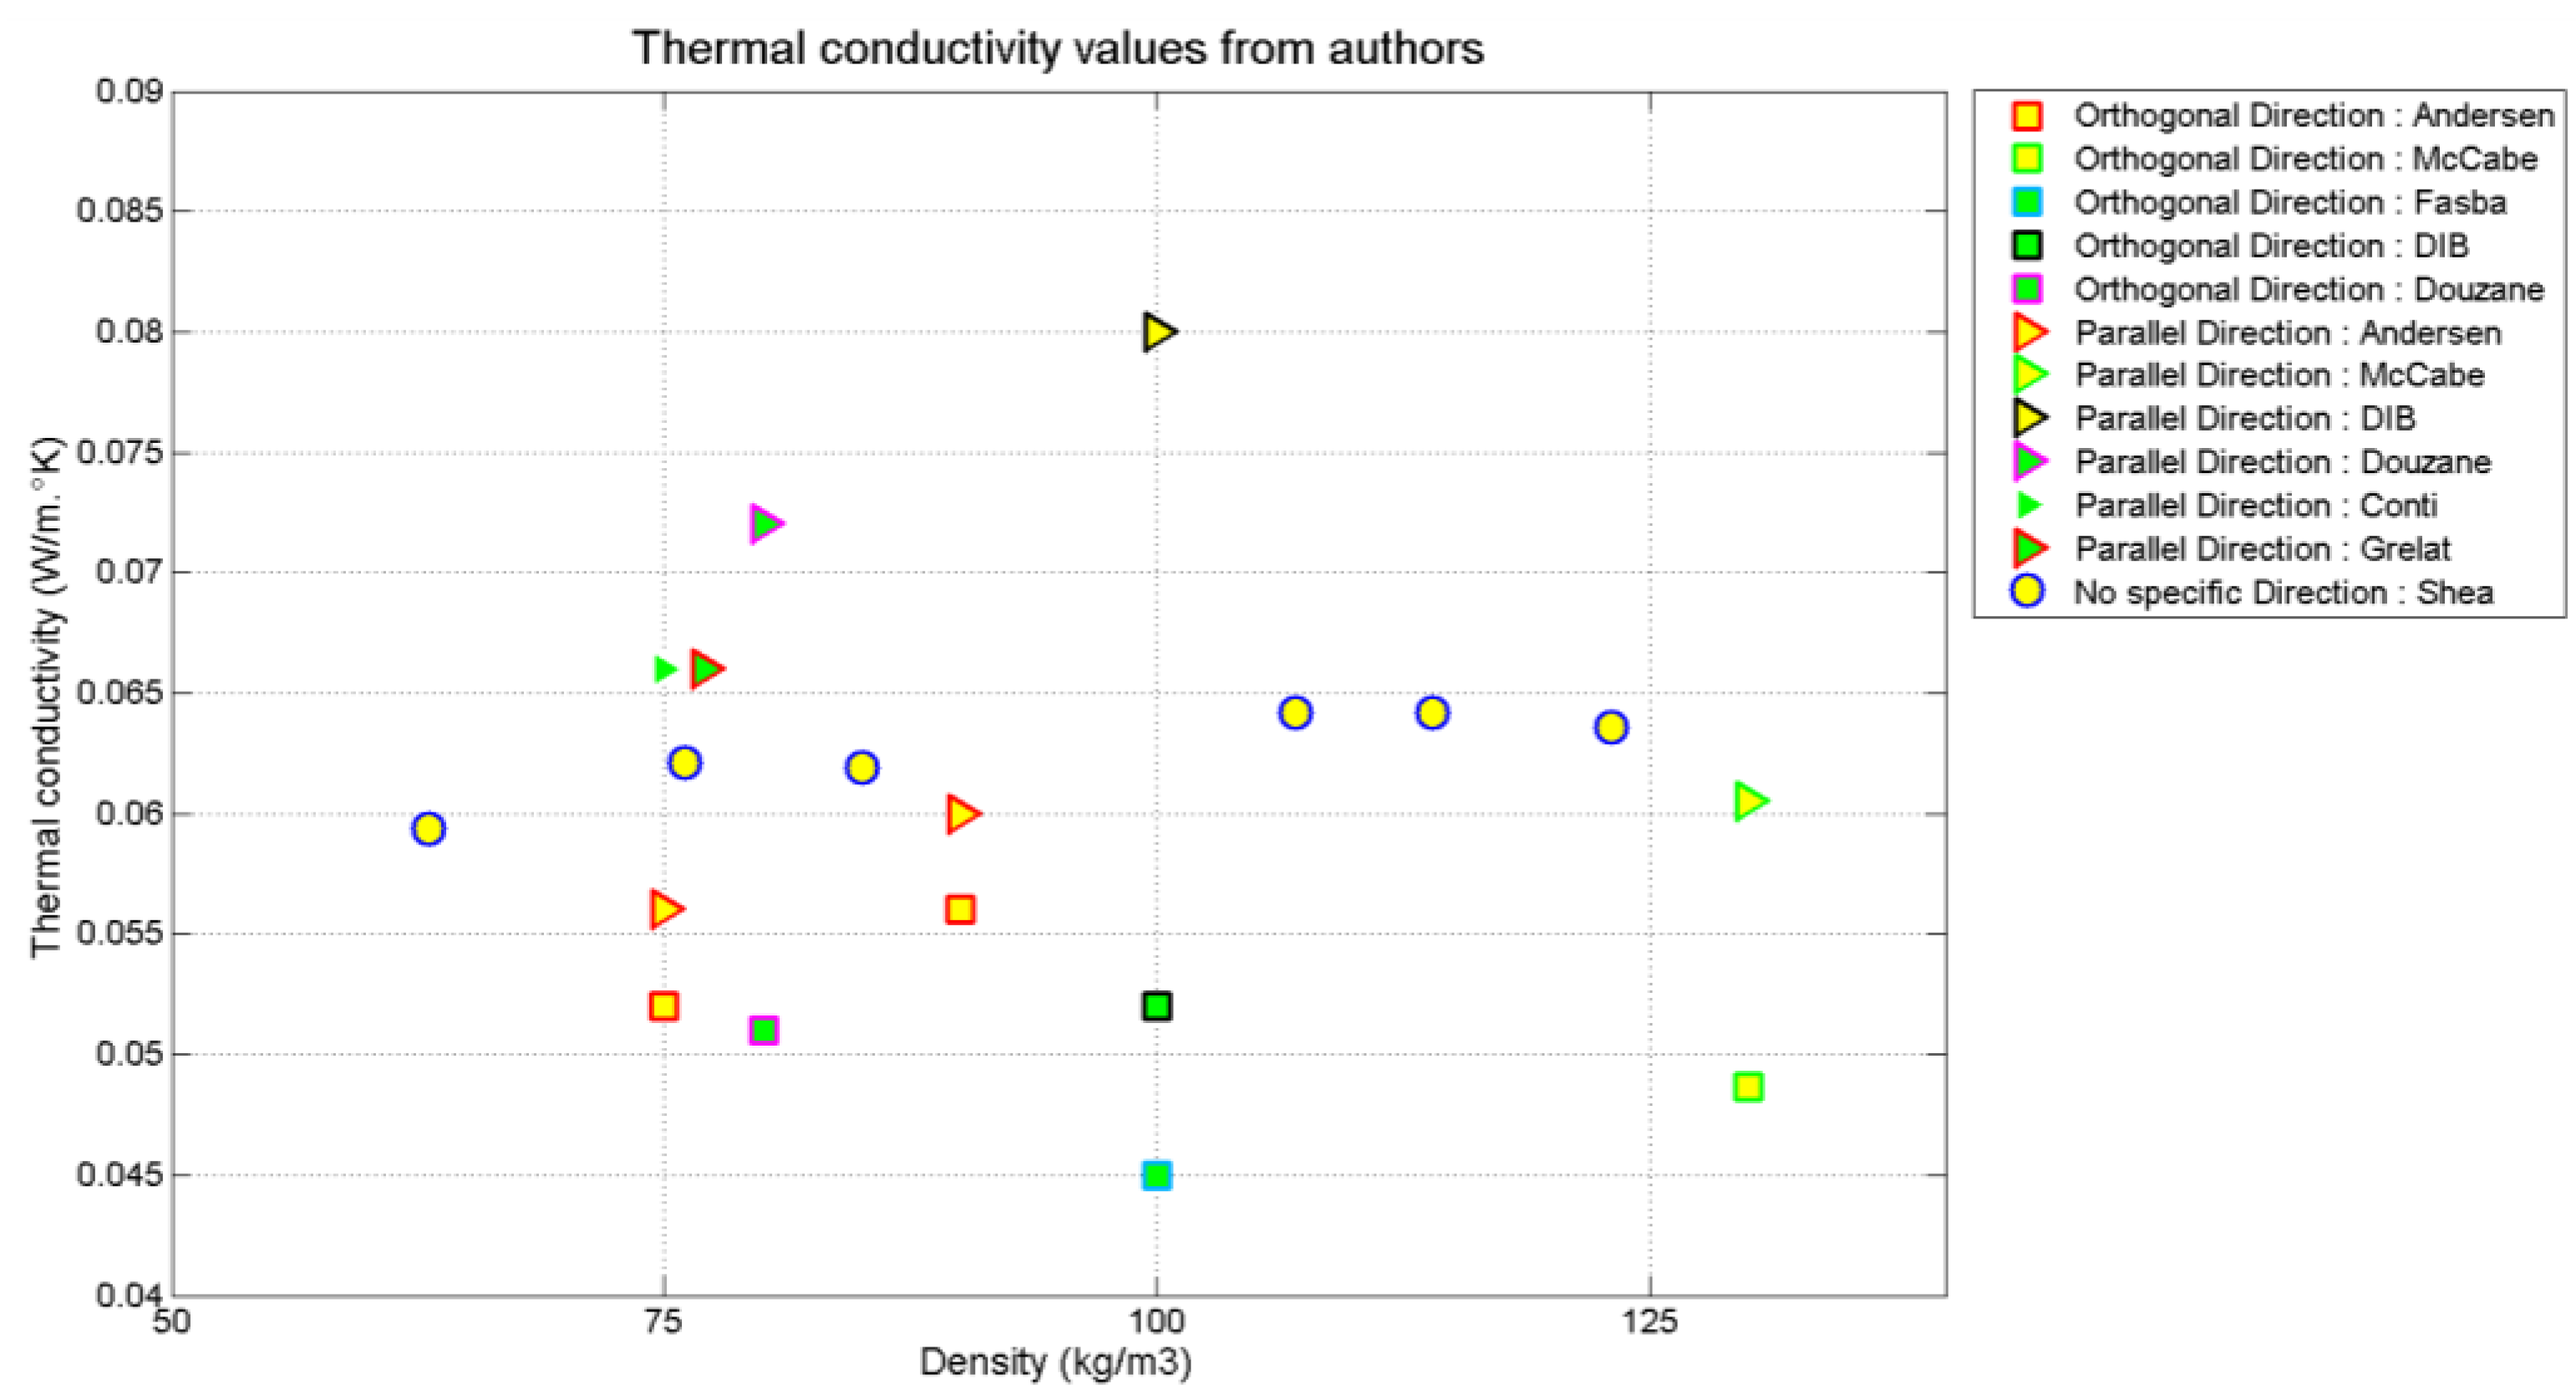
1.1. Overview of Thermal Conductivity Measurements on Straw Bales

In most of the available literature, two distinct values for the thermal conductivity of straw bales can be found. The first one gives the thermal conductivity when the straw fibres are perpendicular to the heat flow. The second one gives the measured value when the fibres are parallel to the heat flow.
The next paragraph focuses on this specific aspect. It must be noted that this distinction was set up by McCabe [5] in one of the first well-referenced works relating to straw bale thermal conductivity. In this work, McCabe showed, based on measurements made with a device akin to a hot plate, that the thermal conductivity of the straw bales is 0.048 W/mK when the heat flow is perpendicular to the fibers and 0.061 W/mK when parallel.
After this work was published, many similar experiments were conducted, such as that performed by as Andersen [6] and Shea [7]. Andersen studied the influence of the density on the thermal conductivity. They studied two sets of samples, one with a density of 75 kg/m3 and the other with a density of 90 kg/m3. The thermal conductivity of the first set of samples was 0.052 W/mK when measured perpendicular to the fibres and 0.056 W/mK when parallel to the fibers. The thermal conductivity obtained for the second set of samples was slightly higher; 0.056 W/mK when perpendicular and 0.06 W/mK when parallel. These values point out the first result regarding the evolution of the thermal conductivity with the studied parameters. When the density is 75 kg/m3 and the investigated direction evolves from perpendicular to parallel, the measured thermal conductivity increases by 0.004 W/mK; for a 90 kg/m3 density and measurement directions evolving from perpendicular to parallel, the same variation of magnitude is observed for the thermal conductivity. Consequently, the thermal flux measured by these authors can be modeled considering the density and the flux direction independently.
Shea studied the thermal conductivity with a flow meter on various samples of straw with a thickness of 25 cm, compressed to reach a large range of densities. In this particular experiment, the straw fibers in the samples did not have a specific orientation. The measured thermal conductivities ranged from 0.059 W/mK for a density of 63 kg/m3 to 0.064 W/mK for a density of 123 kg/m3. Shea proposed a reference value of 0.065 W/mK. FASBA, the German association for straw bale buildings, led numerous researches on straw bales and obtained in 2010 very good thermal conductivity, around 0.045 W/mK, when the heat flow was perpendicular to the fibers [8].
Many other data on thermal conductivities can be found in the literature. Among them, the value validated by the German Centre of Competence for Construction (DIB) [9] is often used as a reference in many countries. The thermal conductivity is there considered to be 0.052 W/mK, when the heat flow is perpendicular to the straw fibers, and 0.080 W/mK when it is parallel. Although reliable measurements are usually obtained using steady state methods such as the ‘guarded hot plate technique’, Dubois [3] underlined that most of the data derives either from transient methods or from steady methods with low thickness rebuilt bales. Douzane [10] presents the results of thermal conductivity measured on straw bales, obtained through a steady state method. A guarded hot plate apparatus was used to evaluate the thermal conductivity of the straw bales. As the apparatus was a commercial device, the samples were prepared by cutting off straw bales to low thicknesses (10 cm). Two kinds of samples were investigated in relation to the orientation of fibers. The average values of the thermal conductivity at 10 °C were, respectively, 0.072 W/mK and 0.051 W/mK in parallel and perpendicular orientations. Conti [11] developed a thermal conductivity measurement system for straw bales that was also based on a steady-state method. The designed hot-box is mainly composed of a metering chamber and a heater inside a climate chamber. Authors found a thermal conductivity around 0.066 W/mK in the case in which the thermal flux was considered parallel to the fibers.
The effect of relative humidity on straw conductivity is found to be significant by several authors; according to Wei [12], conductivity increases with moisture content due to the porous structure of the fibrous insulation materials. Wei measured an increase of the thermal conductivity of rice straw when the moisture content was varied; 0.0514 W/mK for 10% of moisture content and 0.0519 W/mK for 18% of moisture content. The same results were obtained by Grelat [13] for straw bales. Measurements with 0%, 50%, and 90% relative humidity (0%, 15%, and 22% water content) showed a significant increase of the conductivity; from 0.064 W/mK for 0% RH to 0.069 W/mK for 22% RH. Palumbo [14] investigated the thermal conductivity of a board composed of barley straw (81%) and corn starch (19%). Observations also lead to a significant linear increase of the thermal conductivity when the relative humidity varied from 10% to 90%.
Table 1 gives a synthetic view of these results. The Figure 1 and Figure 2 display the distribution of the thermal conductivity values found in the literature, respectively along with the density of the bales and the direction of the thermal flow.
Some immediate conclusions can be brought out; considering a given thermal flow direction, these observations show a rise in thermal conductivity when the density is increasing. When the direction of the heat flow is considered, the measured conductivity values show a decrease when the direction is varying from parallel to perpendicular. The case observed by Shea (no specific direction—represented by a blue circle in Figure 1) can be considered as a mix of parallel and perpendicular fiber directions. Consequently, it was chosen to display the values along the x-axis in Figure 2, between the parallel and perpendicular directions.
If many values are given for perpendicular or parallel heat flow directions, not a lot of information can be found on how the fibers are truly oriented in the straw bales. Figure 3 shows the average results obtained when analyzing five slices of a single straw bale. This visual assessment accounted for each slice; 50 fibers of a minimum 8 cm long.
As presented in Shea’s paper [7], it can be observed that, in the studied straw bales, the straw fibers appear to be randomly oriented. Following the directions defined in Figure 3 and detailed in Section 1.2, the results presented in Figure 4 show that a slight majority of fibers oriented toward direction 2 can be observed.
This observation goes against the belief that the thermal conductivity of straw bales is lower when the bales are laid on edge.
In addition, due to the way the straw is processed in the balers, one can easily observe that, if the heat flow follows direction 3, the fibers can globally be assumed to be perpendicular to it.

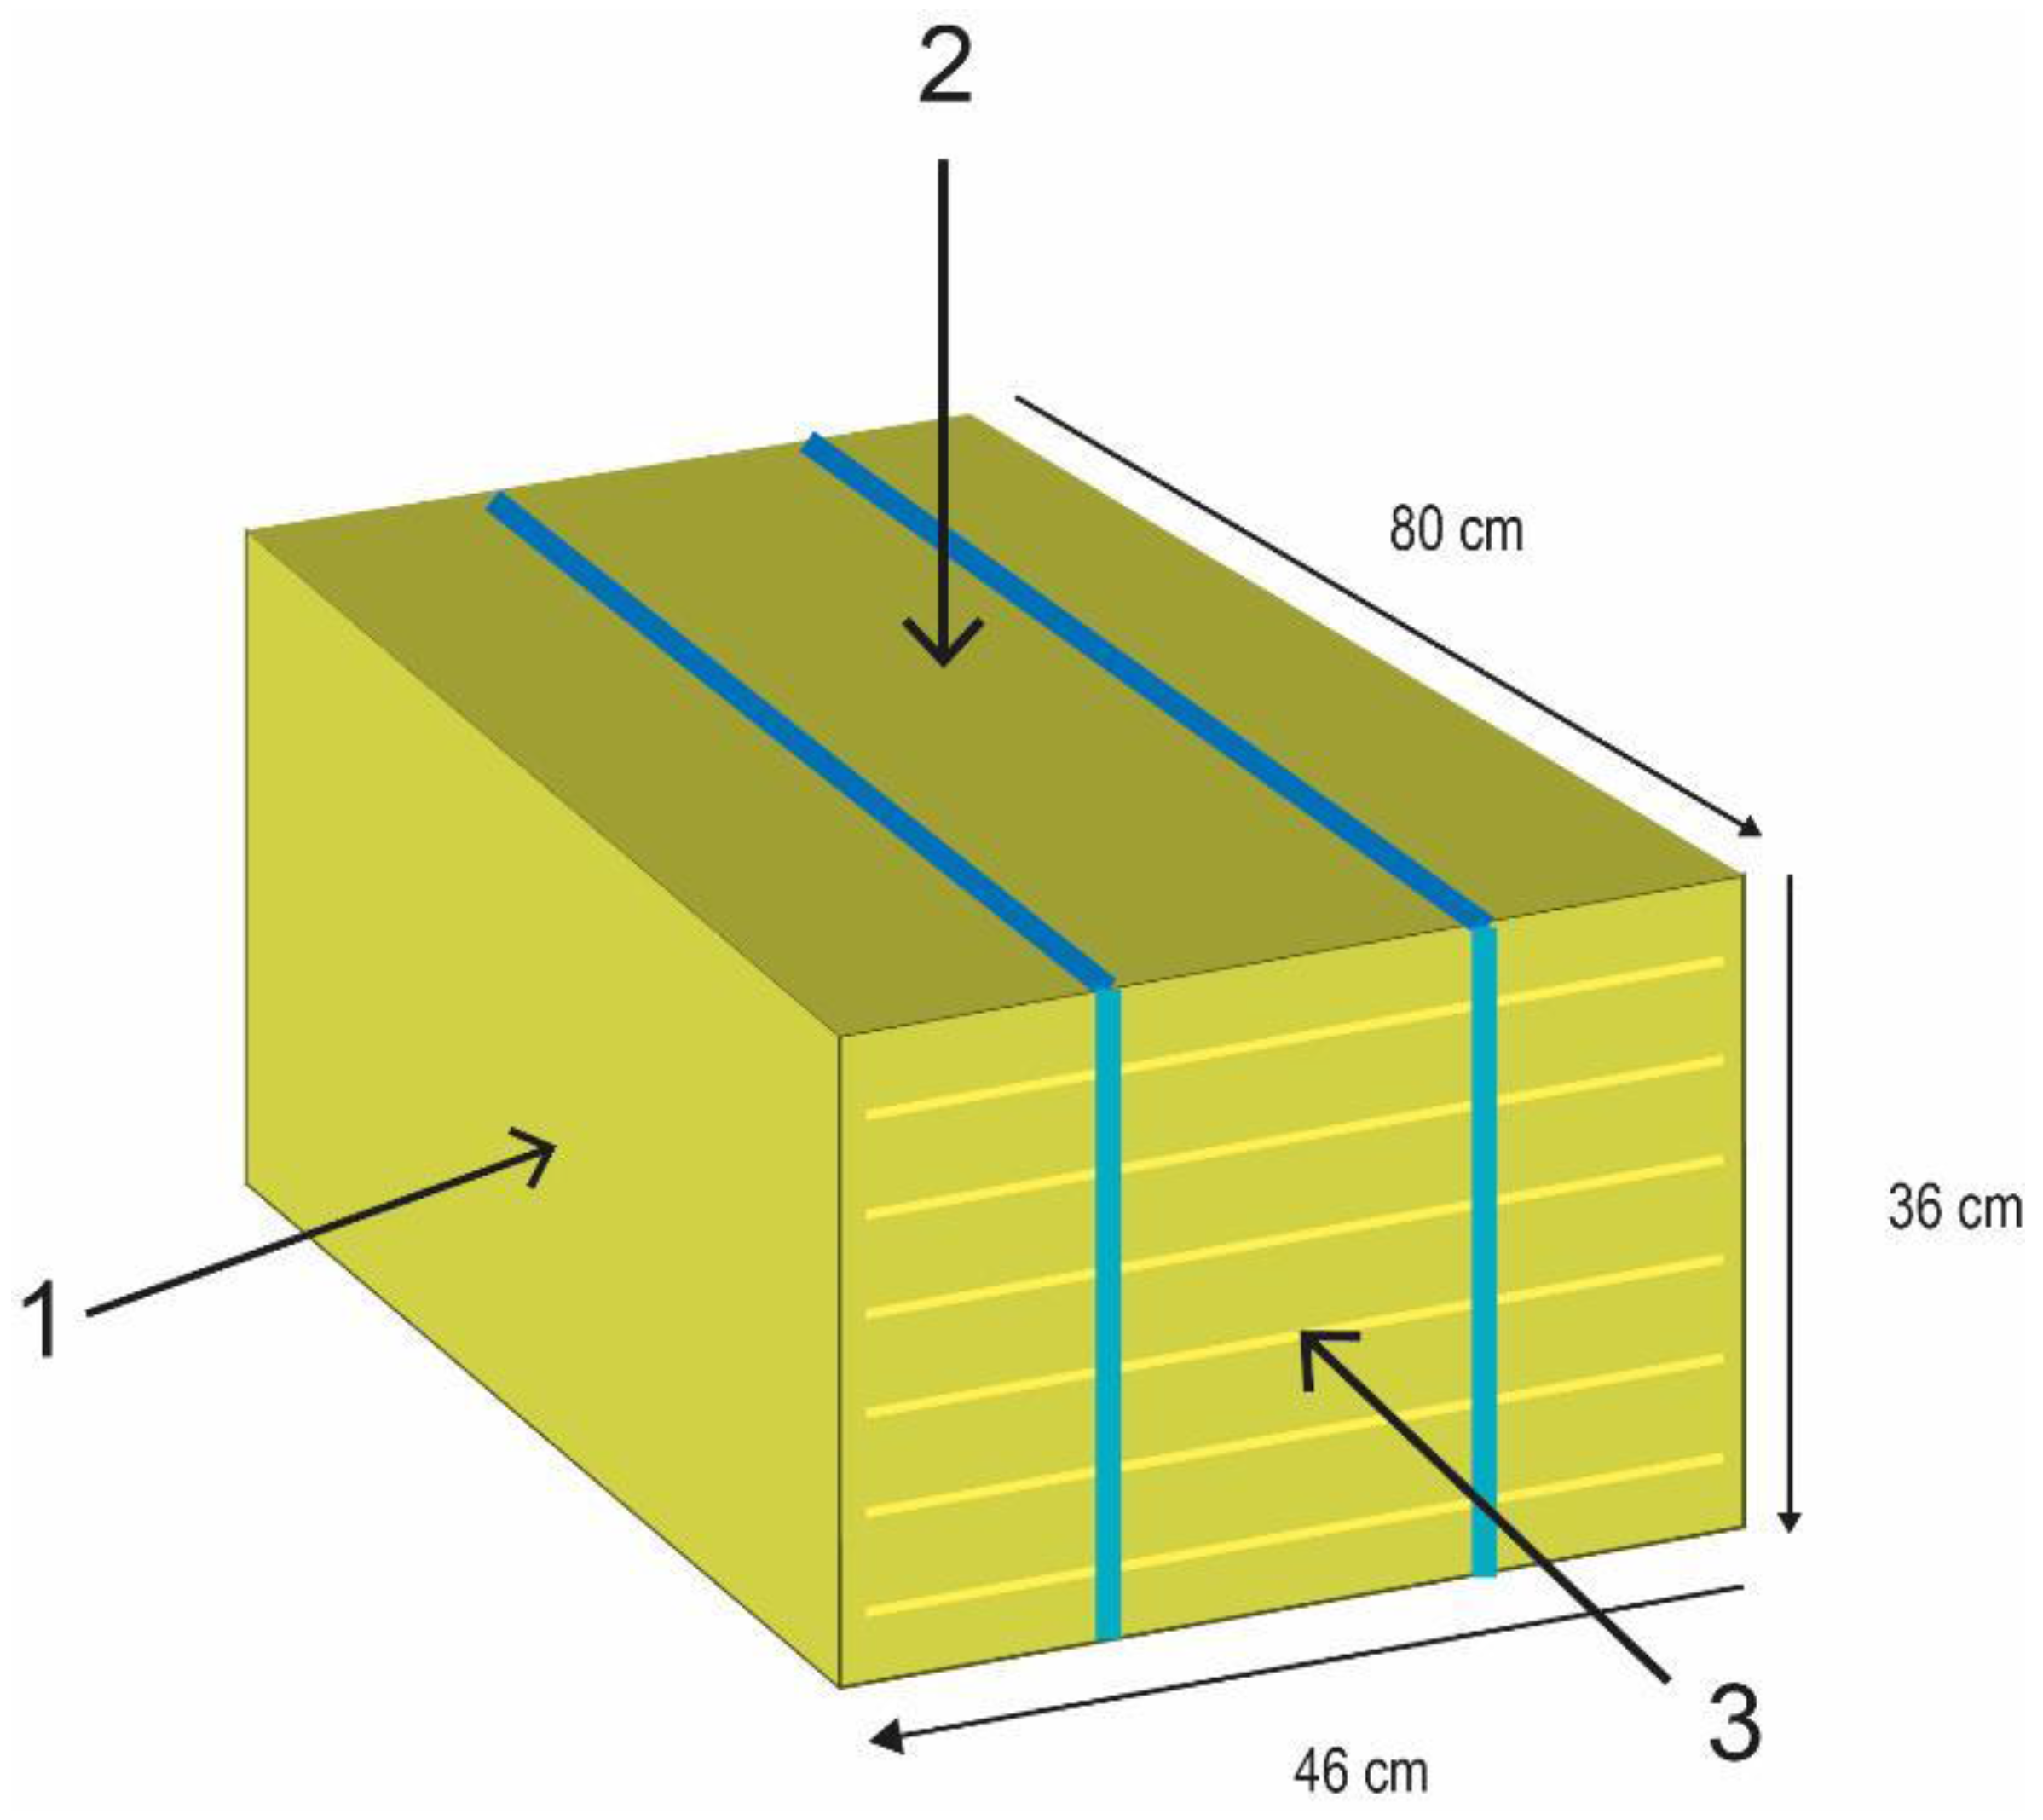
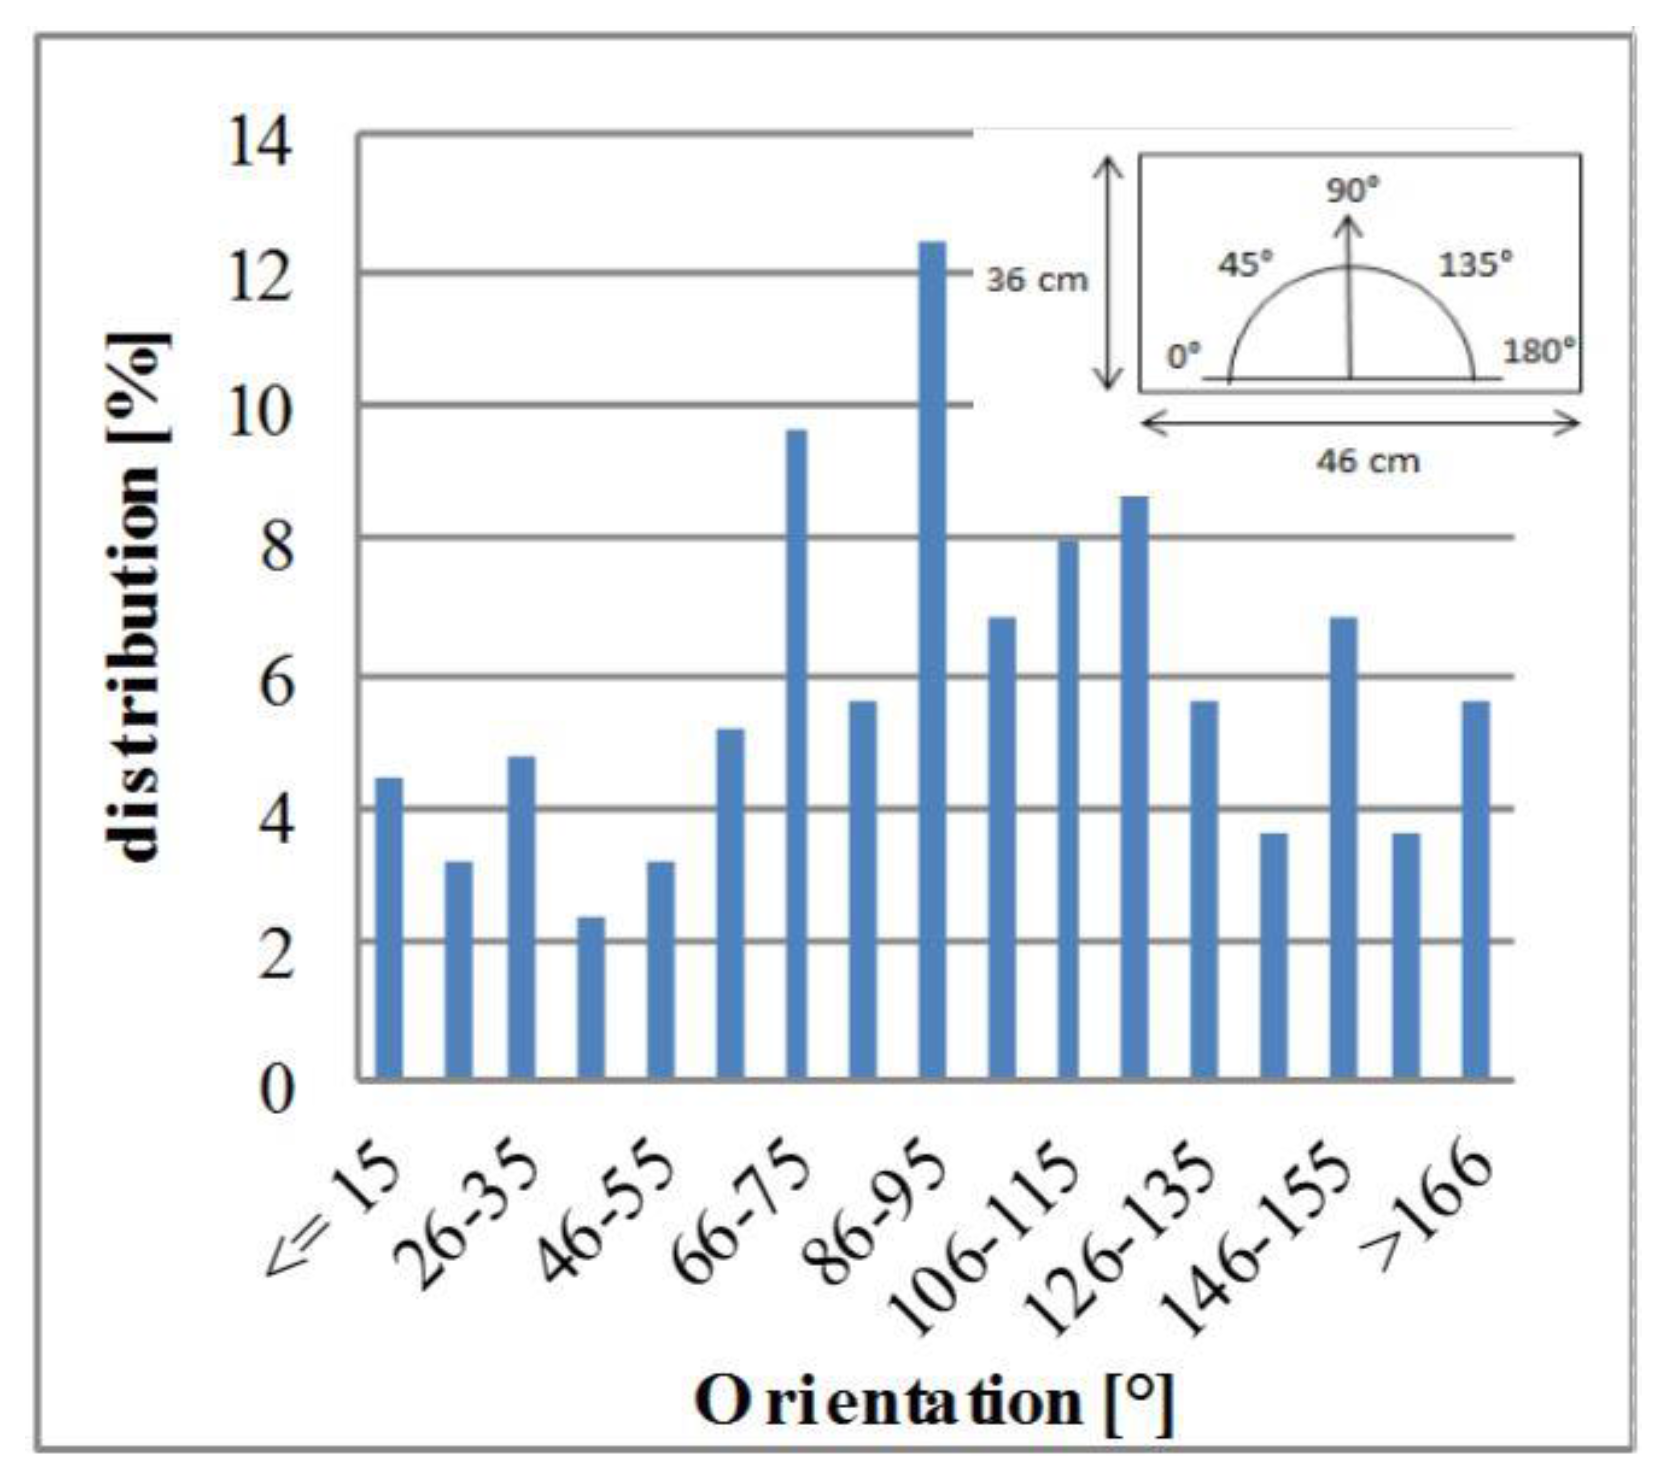
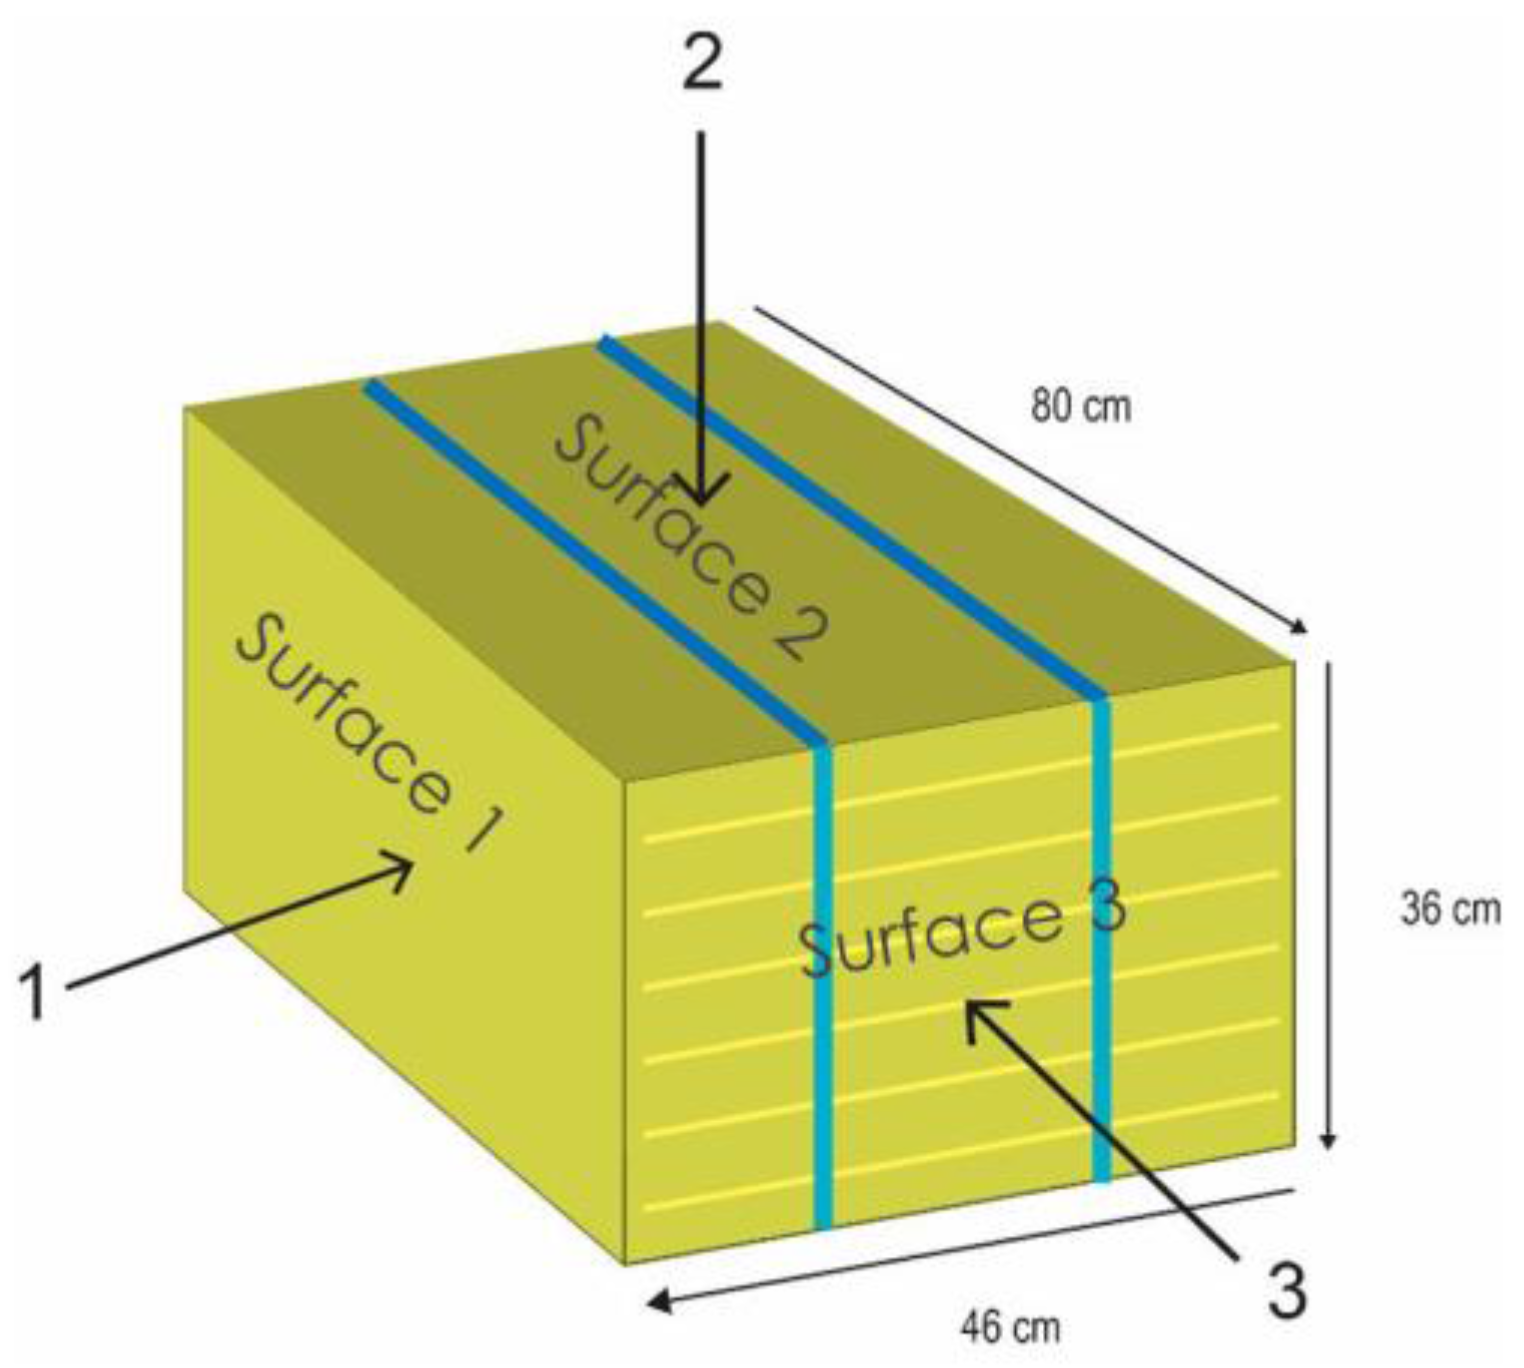
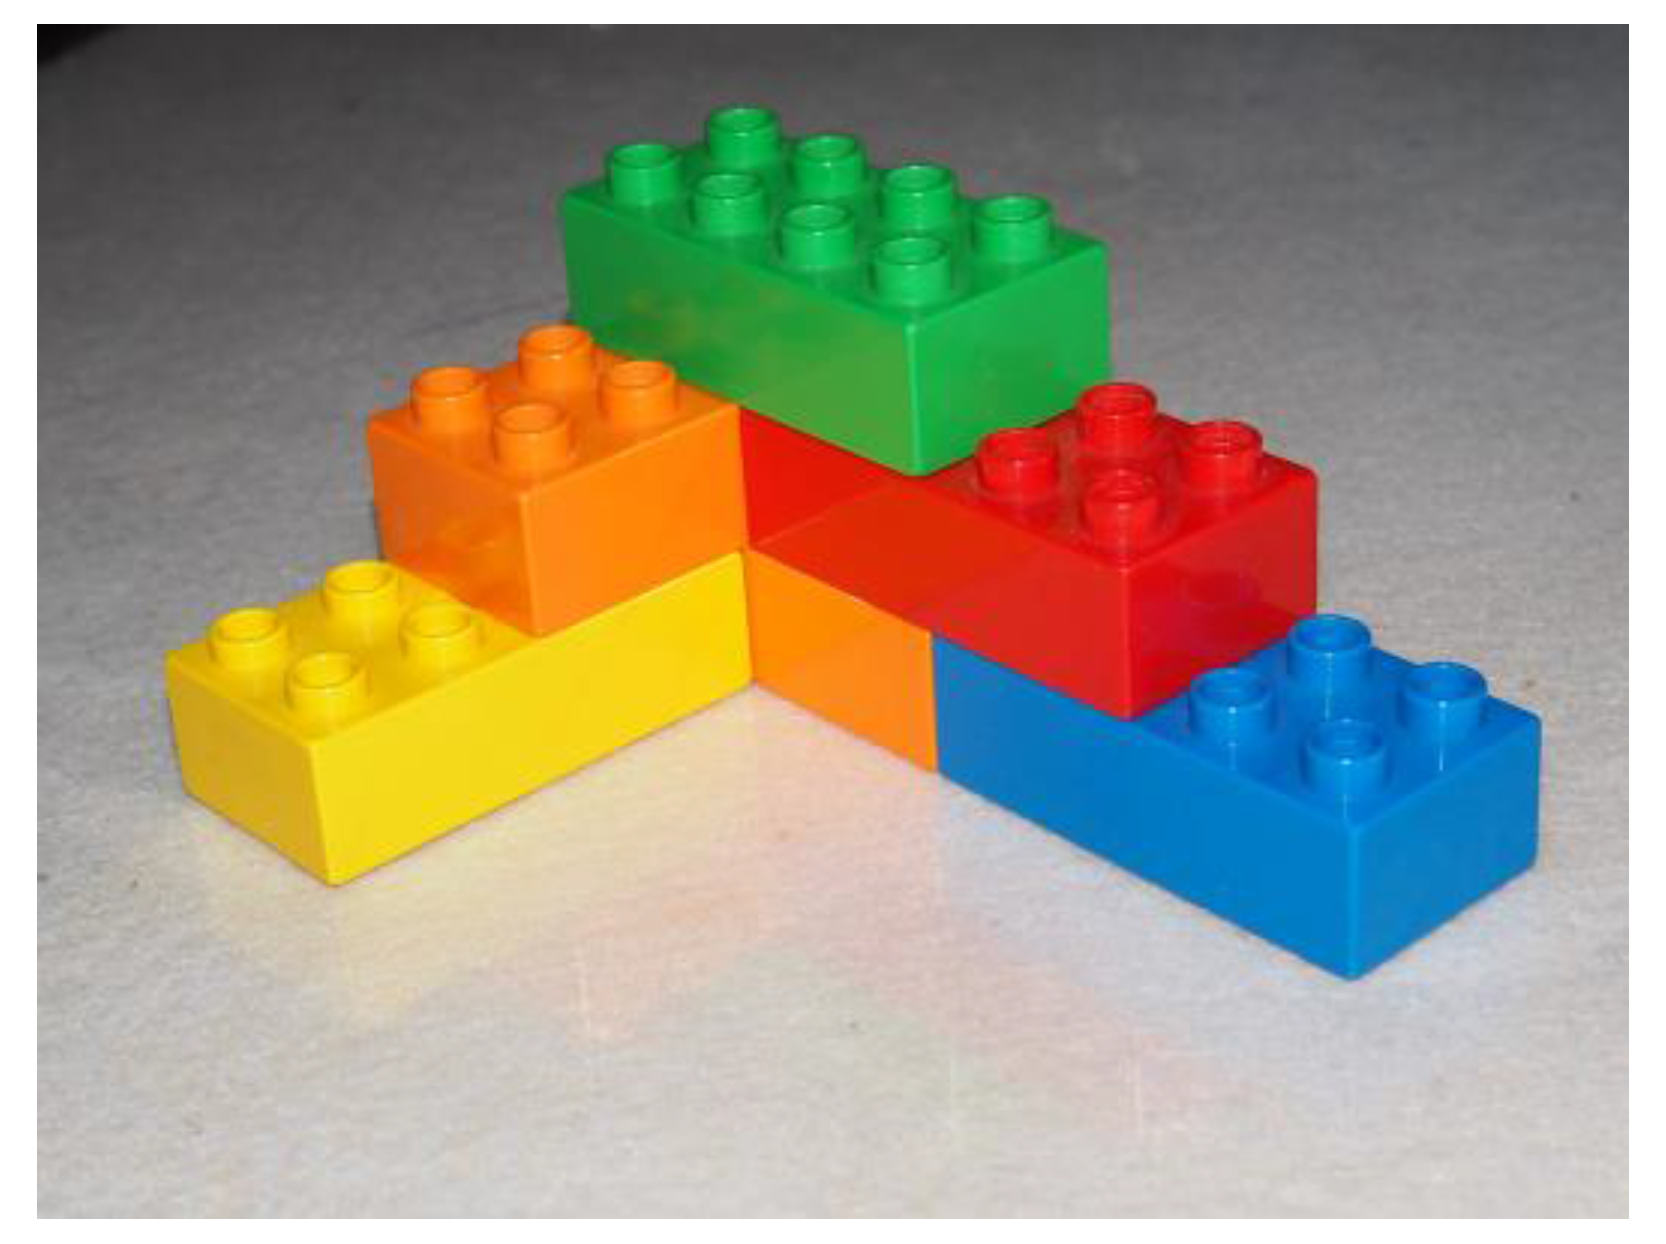
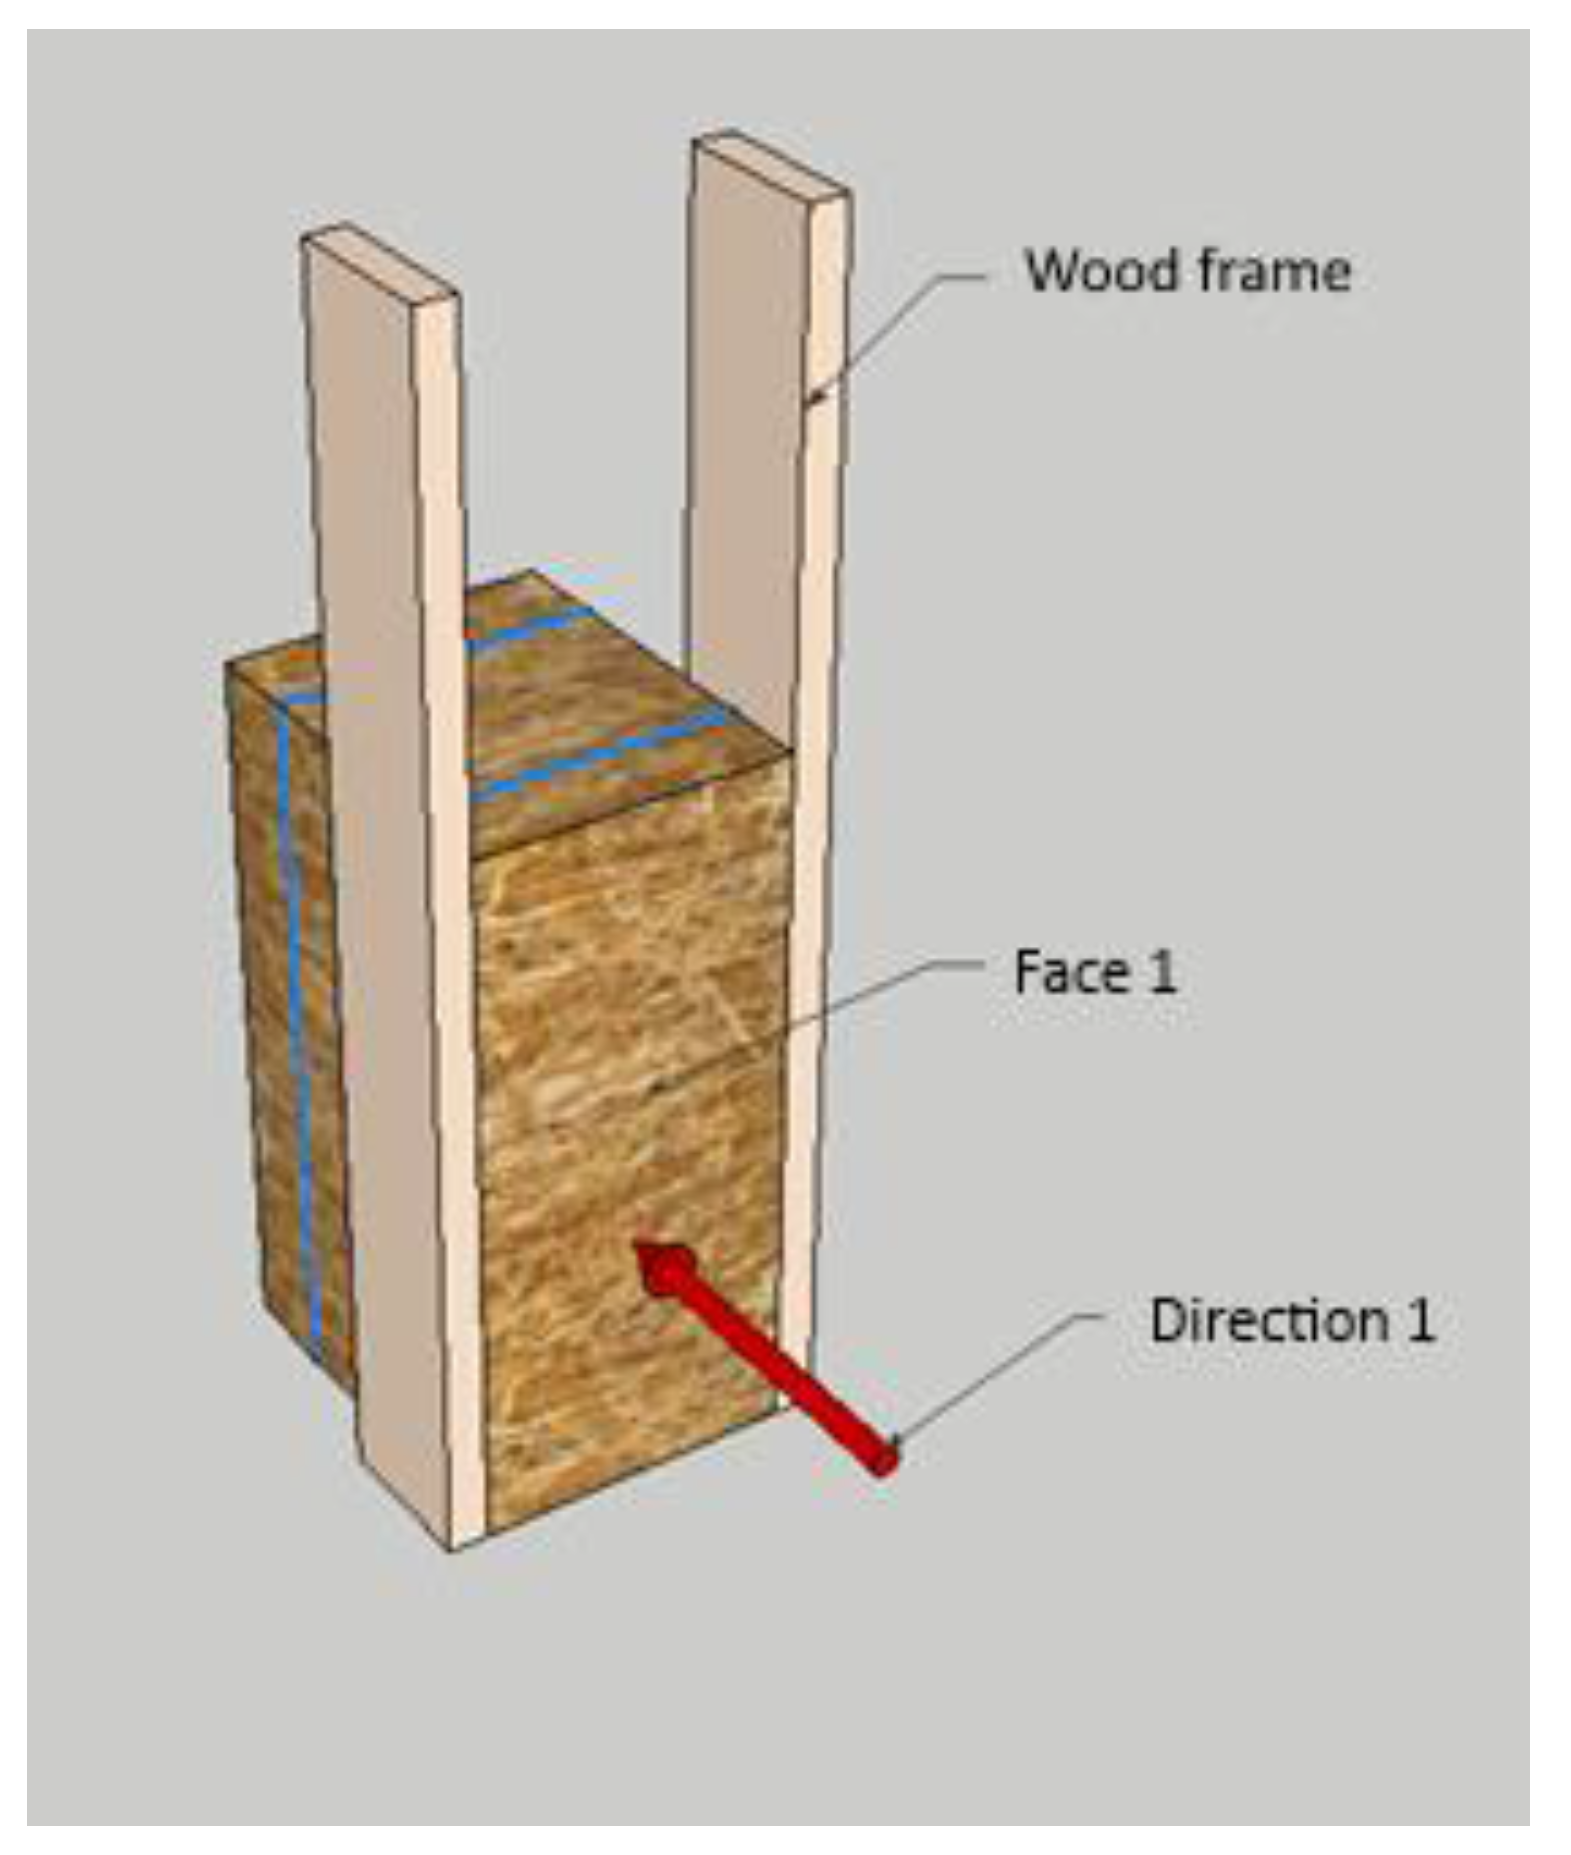
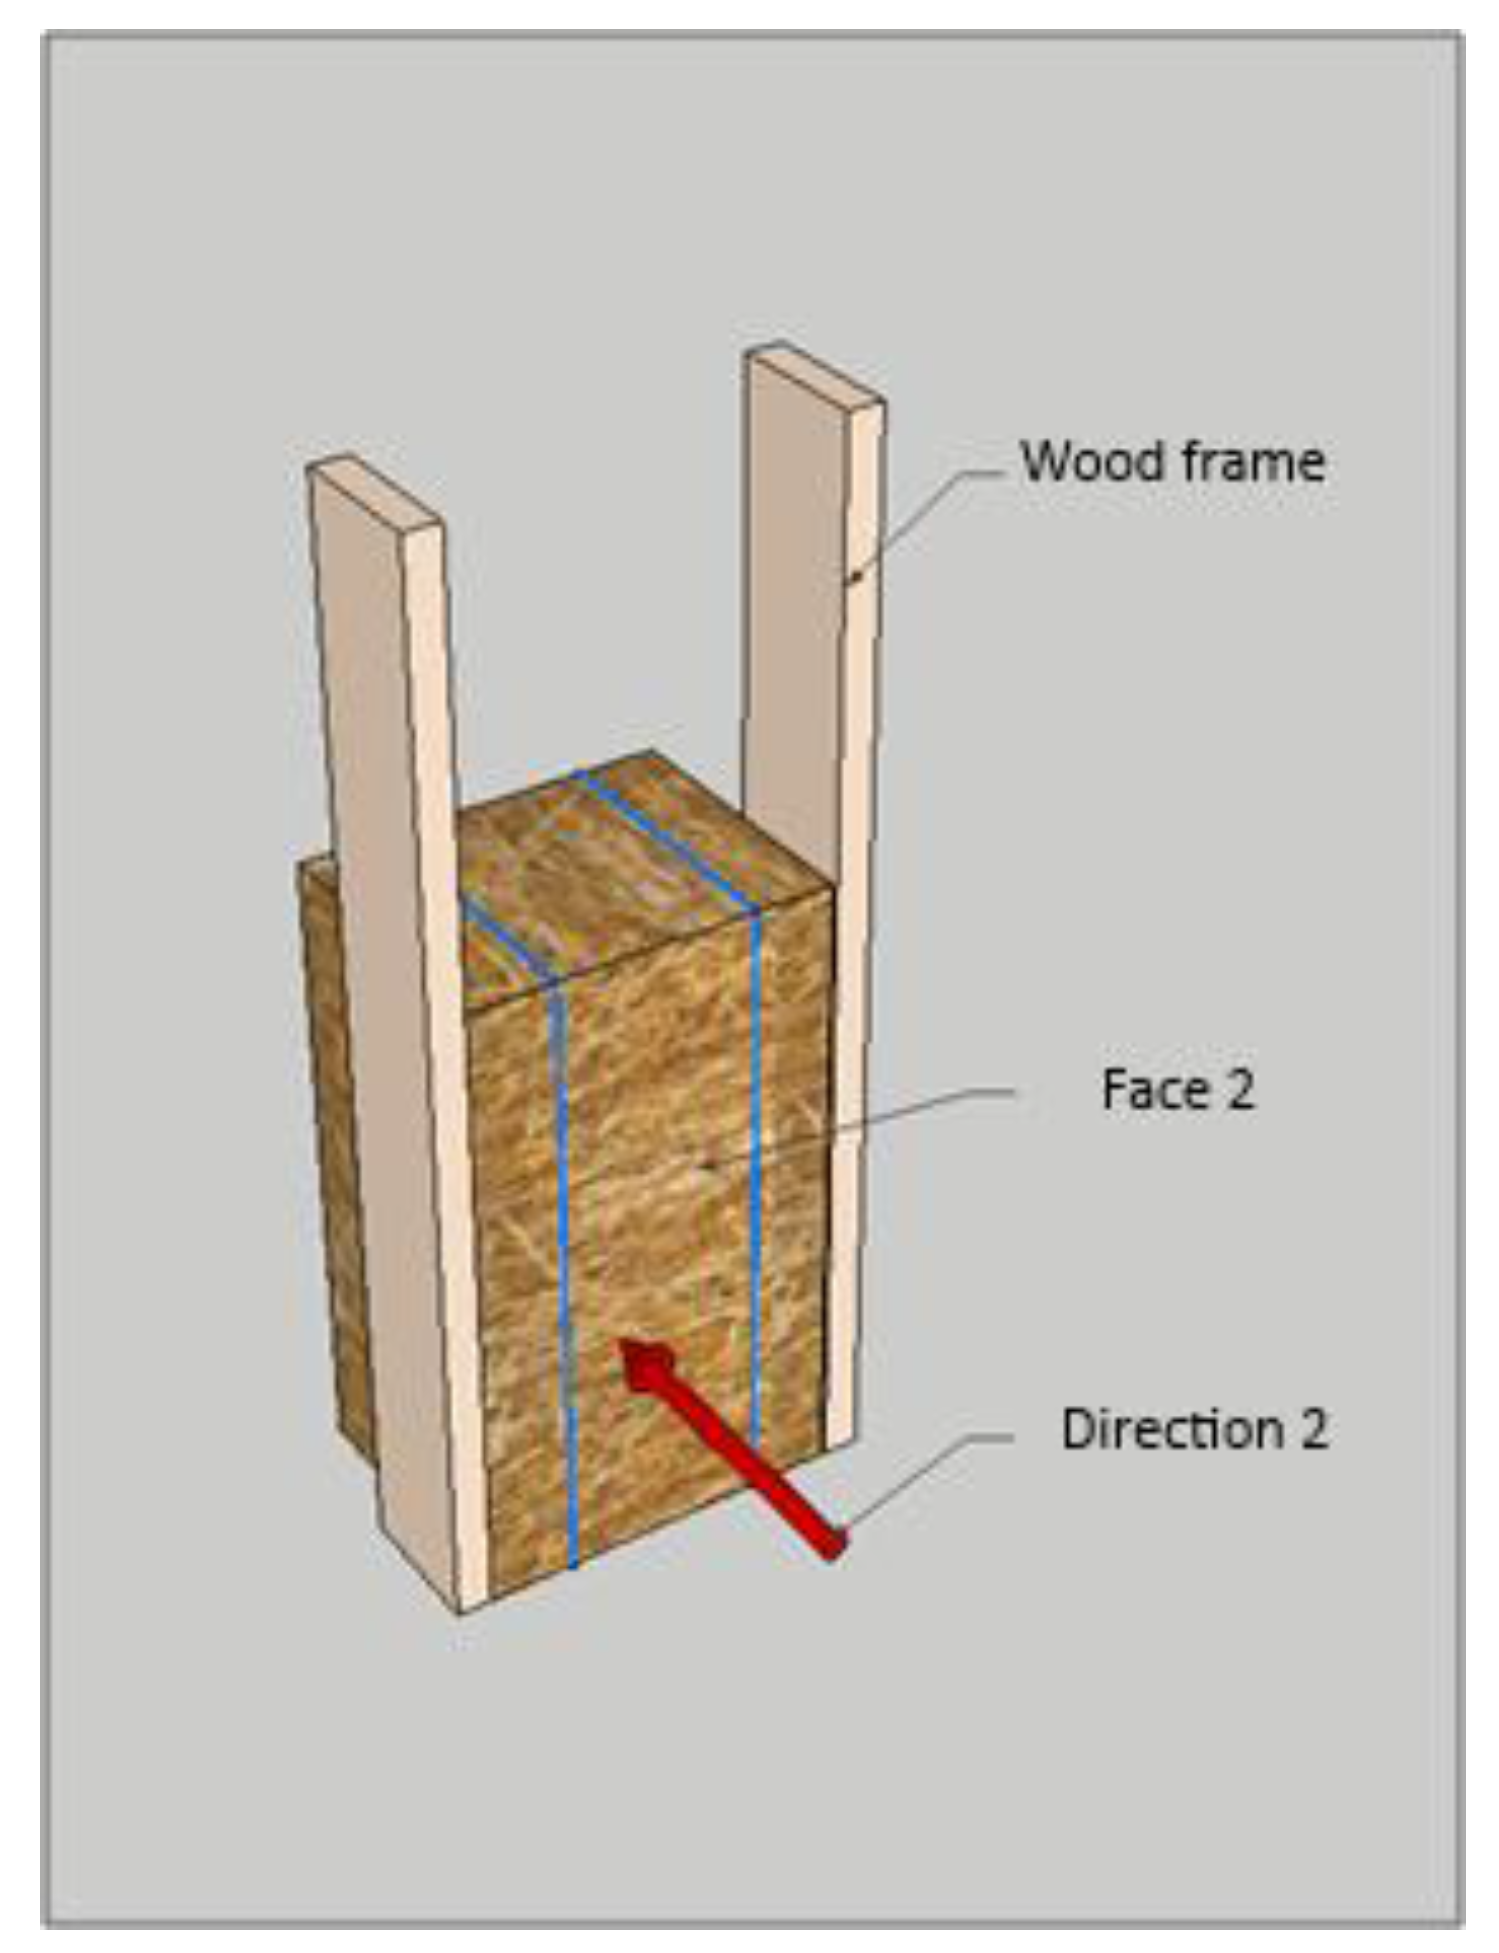
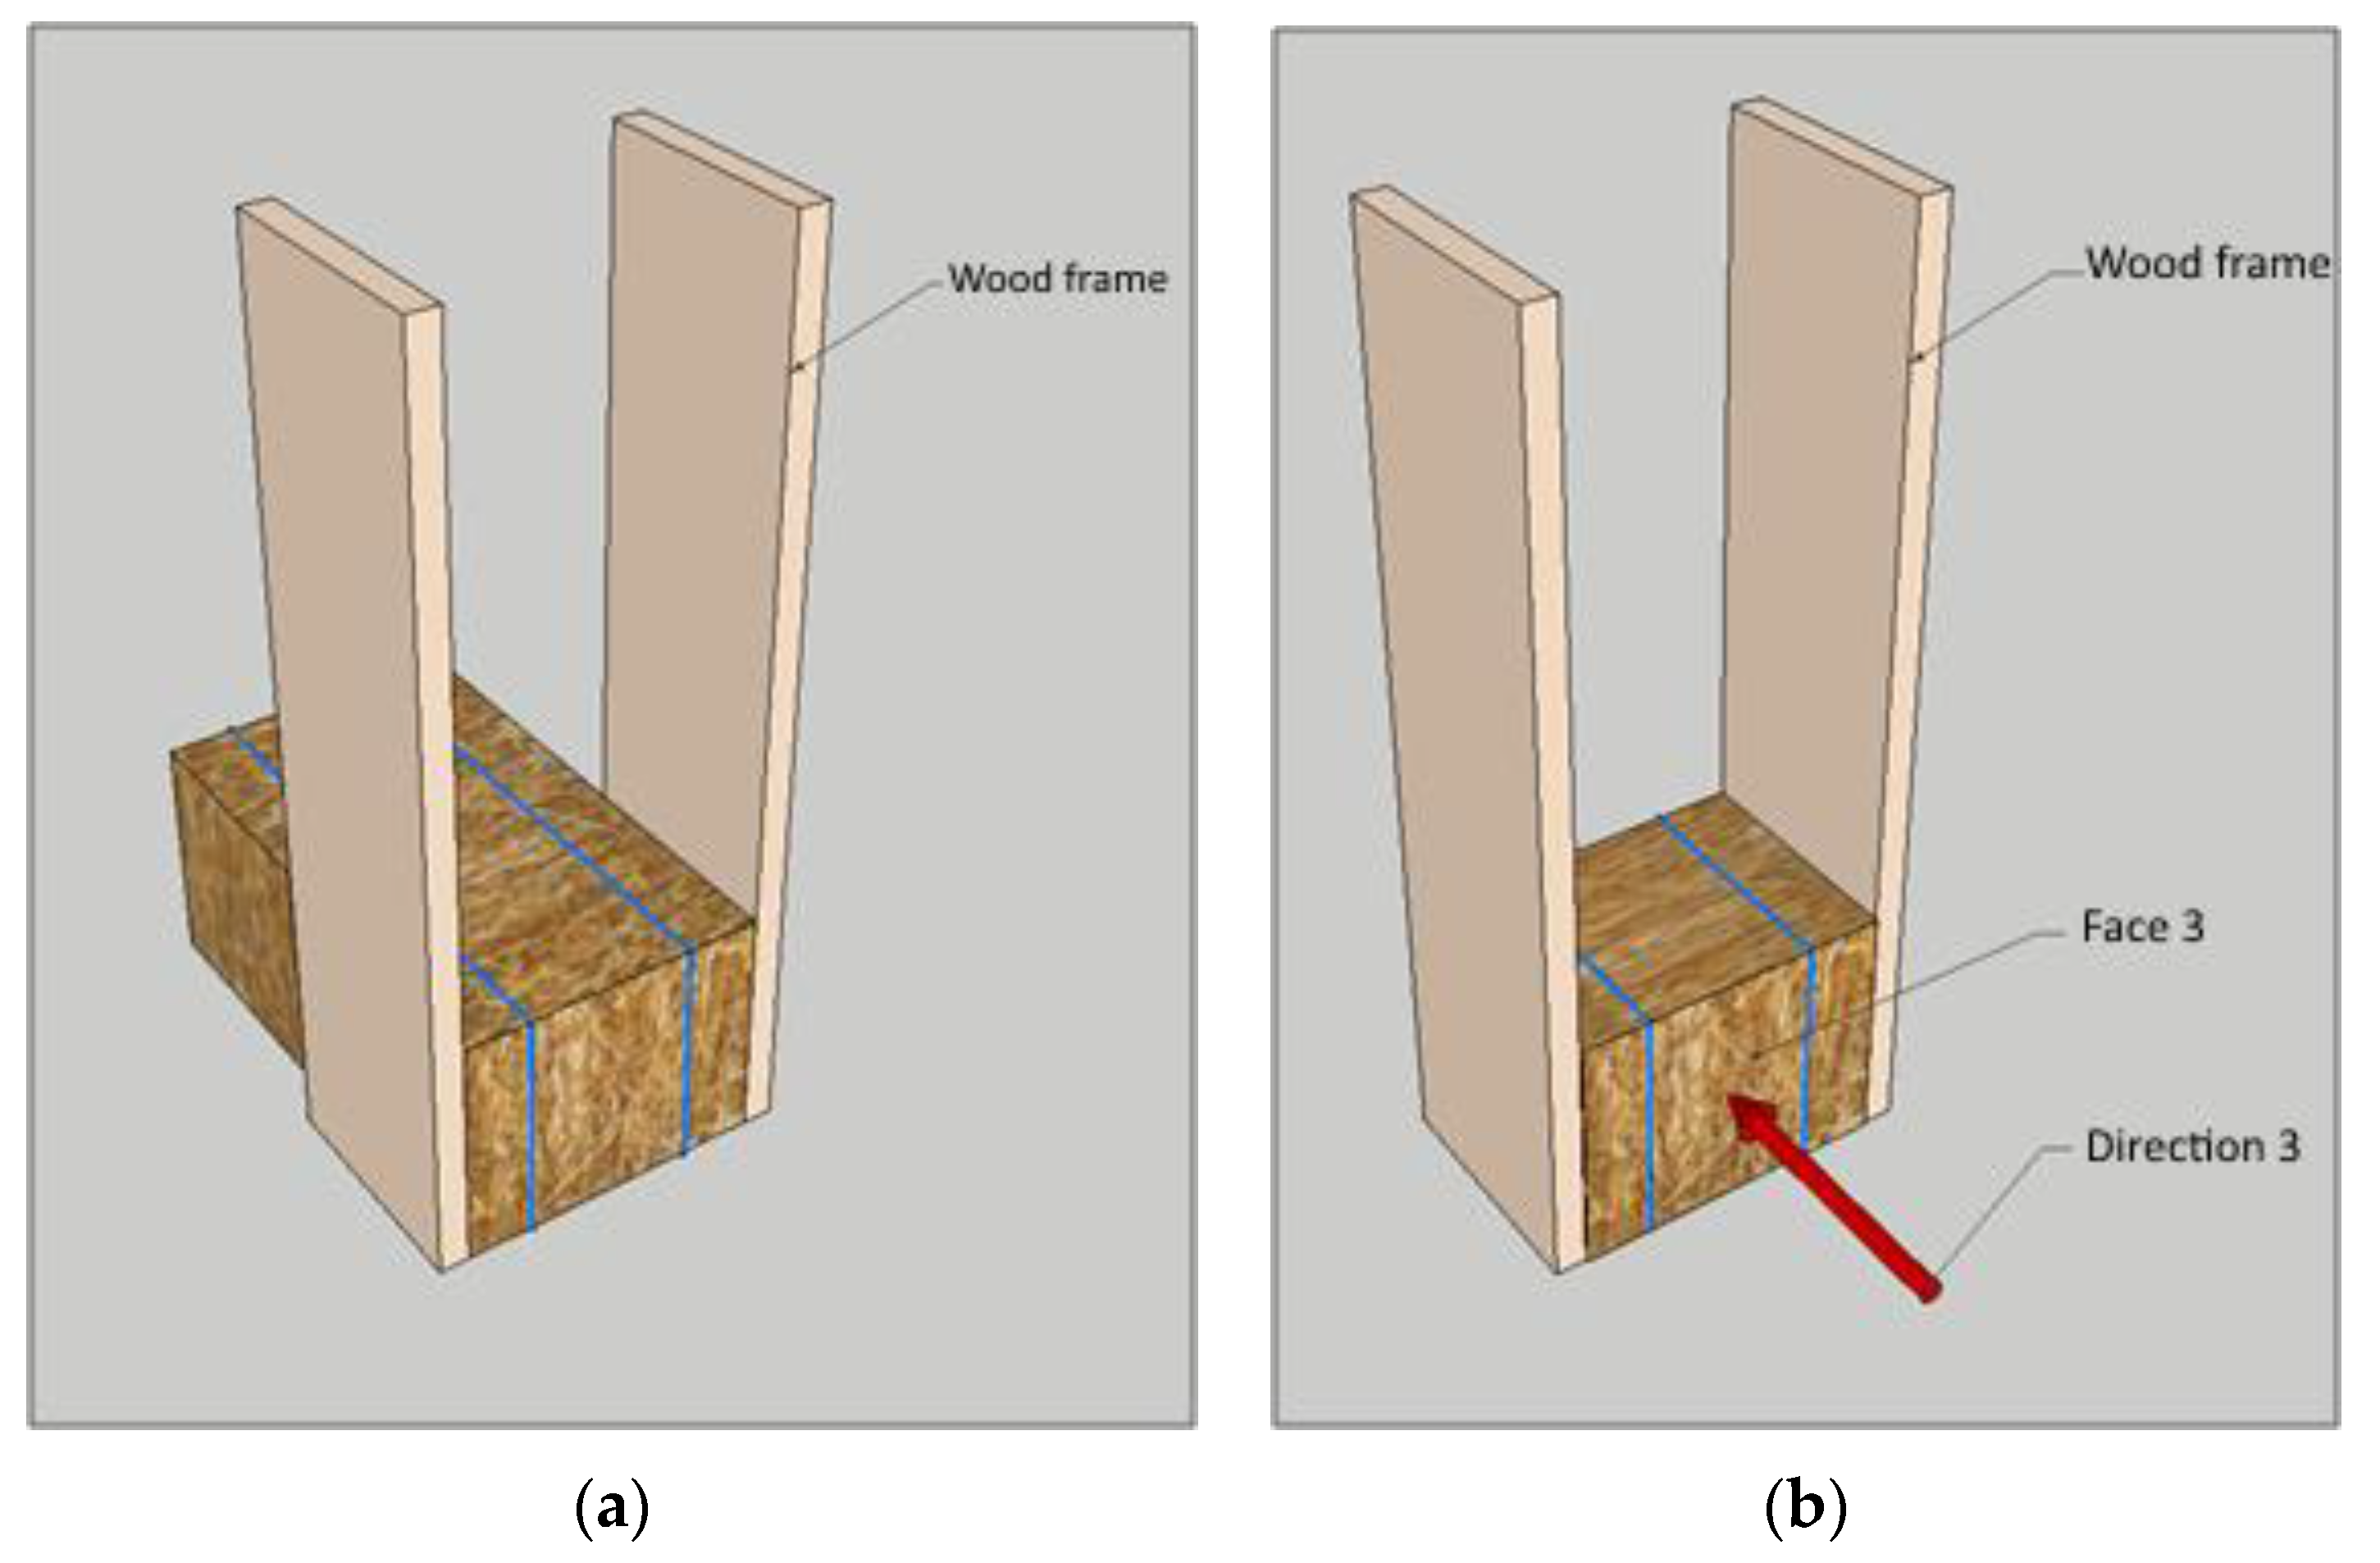
1.2. Straw-Bale Orientation in Vertical Walls

To clarify what is meant by referring to straw bales ‘laid on edge’ or ‘laid flat’, it is proposed to name the surface of the straw bale that can be seen when the bale is installed in the wall, based on the heat flow direction.
Figure 4 illustrates the three directions of heat flow. If, in a vertical wall, the bale is laid ‘flat’, the heat flow follows direction 1. If the bale is laid ‘on-edge’, the heat flow follows direction 2. Direction 3 is almost never encountered in building assemblies.
‘Surface 1’ (36 cm × 80 cm) is thus defined to be the surface of the bale seen when the bale is laid ‘flat’ and where the heat flow will follow direction 1. ‘Surface 2’ (46 cm × 80 cm) is the surface that can be seen when the bale is laid ‘on-edge’ and where the heat flow will follow direction 2. ‘Surface 3’ (36 cm × 46 cm) is the ‘header’ of the straw bale, which can be seen if the bale is laid with its long side perpendicular to the wall surface, and where the heat flow follows direction 3. Figure 5 illustrates these definitions.
In many cases, e.g. load bearing and GREB techniques, the straw bales are laid flat like most classic brick or stone walls, as illustrated in Figure 6. The bales are then lying on surface 2, which is horizontal in this case. Surface 1 can be seen when the wall is completed. The insulation layer is 46 cm in this case, and, due to the way the bales are processed in the balers, surface 1 is a good substrate for rendering and plastering (with good mechanical cling). The heat flow follows direction 1. If there is a load bearing structure, the minimum spacing between the vertical posts is 80 cm.
Figure 7 shows a variant where the straw bales are laid on surface 3. Again, the insulation layer is 46 cm thick and the heat flow follows direction 1. The surface of the wall (surface 1) is a good substrate for rendering and plastering. The minimum spacing between the vertical posts of a load bearing structure is 36 cm.
The bale can also be laid ‘on-edge’ (i.e., on surface 1). The insulation layer is then 36 cm thick and the heat flow follows direction 2. This position is sometime used in the GREB technique. It is usually chosen to avoid walls that are considered to be too thick. The minimum spacing between the vertical posts of a load bearing structure is here 80 cm. The variant presented in Figure 8 illustrates another wall with a 36 cm thickness, in which the straw bales are laid on surface 3 and where the heat flow follows direction 2. The minimum spacing between the vertical posts of a load bearing structure is thus here 46 cm.
Figure 9a,b present a variant in which the straw bales are laid on surface 2. This orientation is not common on building sites. This theoretical orientation of straw bales in the wall is presented because it may have an interesting thermal performance, as the results on thermal conductivity measurements will show. In this case, the straw bales are laid on surface 2 and the heat flow follows direction 3. The Figure 9a shows that, without reducing the length of the straw bales, the wall would be 80 cm thick. The Figure 9b shows a more realistic proposal where the straw bales are produced (or adapted) to obtain a wall about 36 cm thick. The minimum spacing between the vertical posts of a load bearing structure is then 36 cm. Specific attention must be paid in these two cases if a rendering or plastering is to be applied on the wall because surface 3 may not be a good substrate (bad mechanical cling).
These few examples show the diversity of building techniques that can be designed when using strawbale walls. It also shows that the position and orientation of straw bales in the wall will influence the direction of the heat flow within the bales.

2. Results

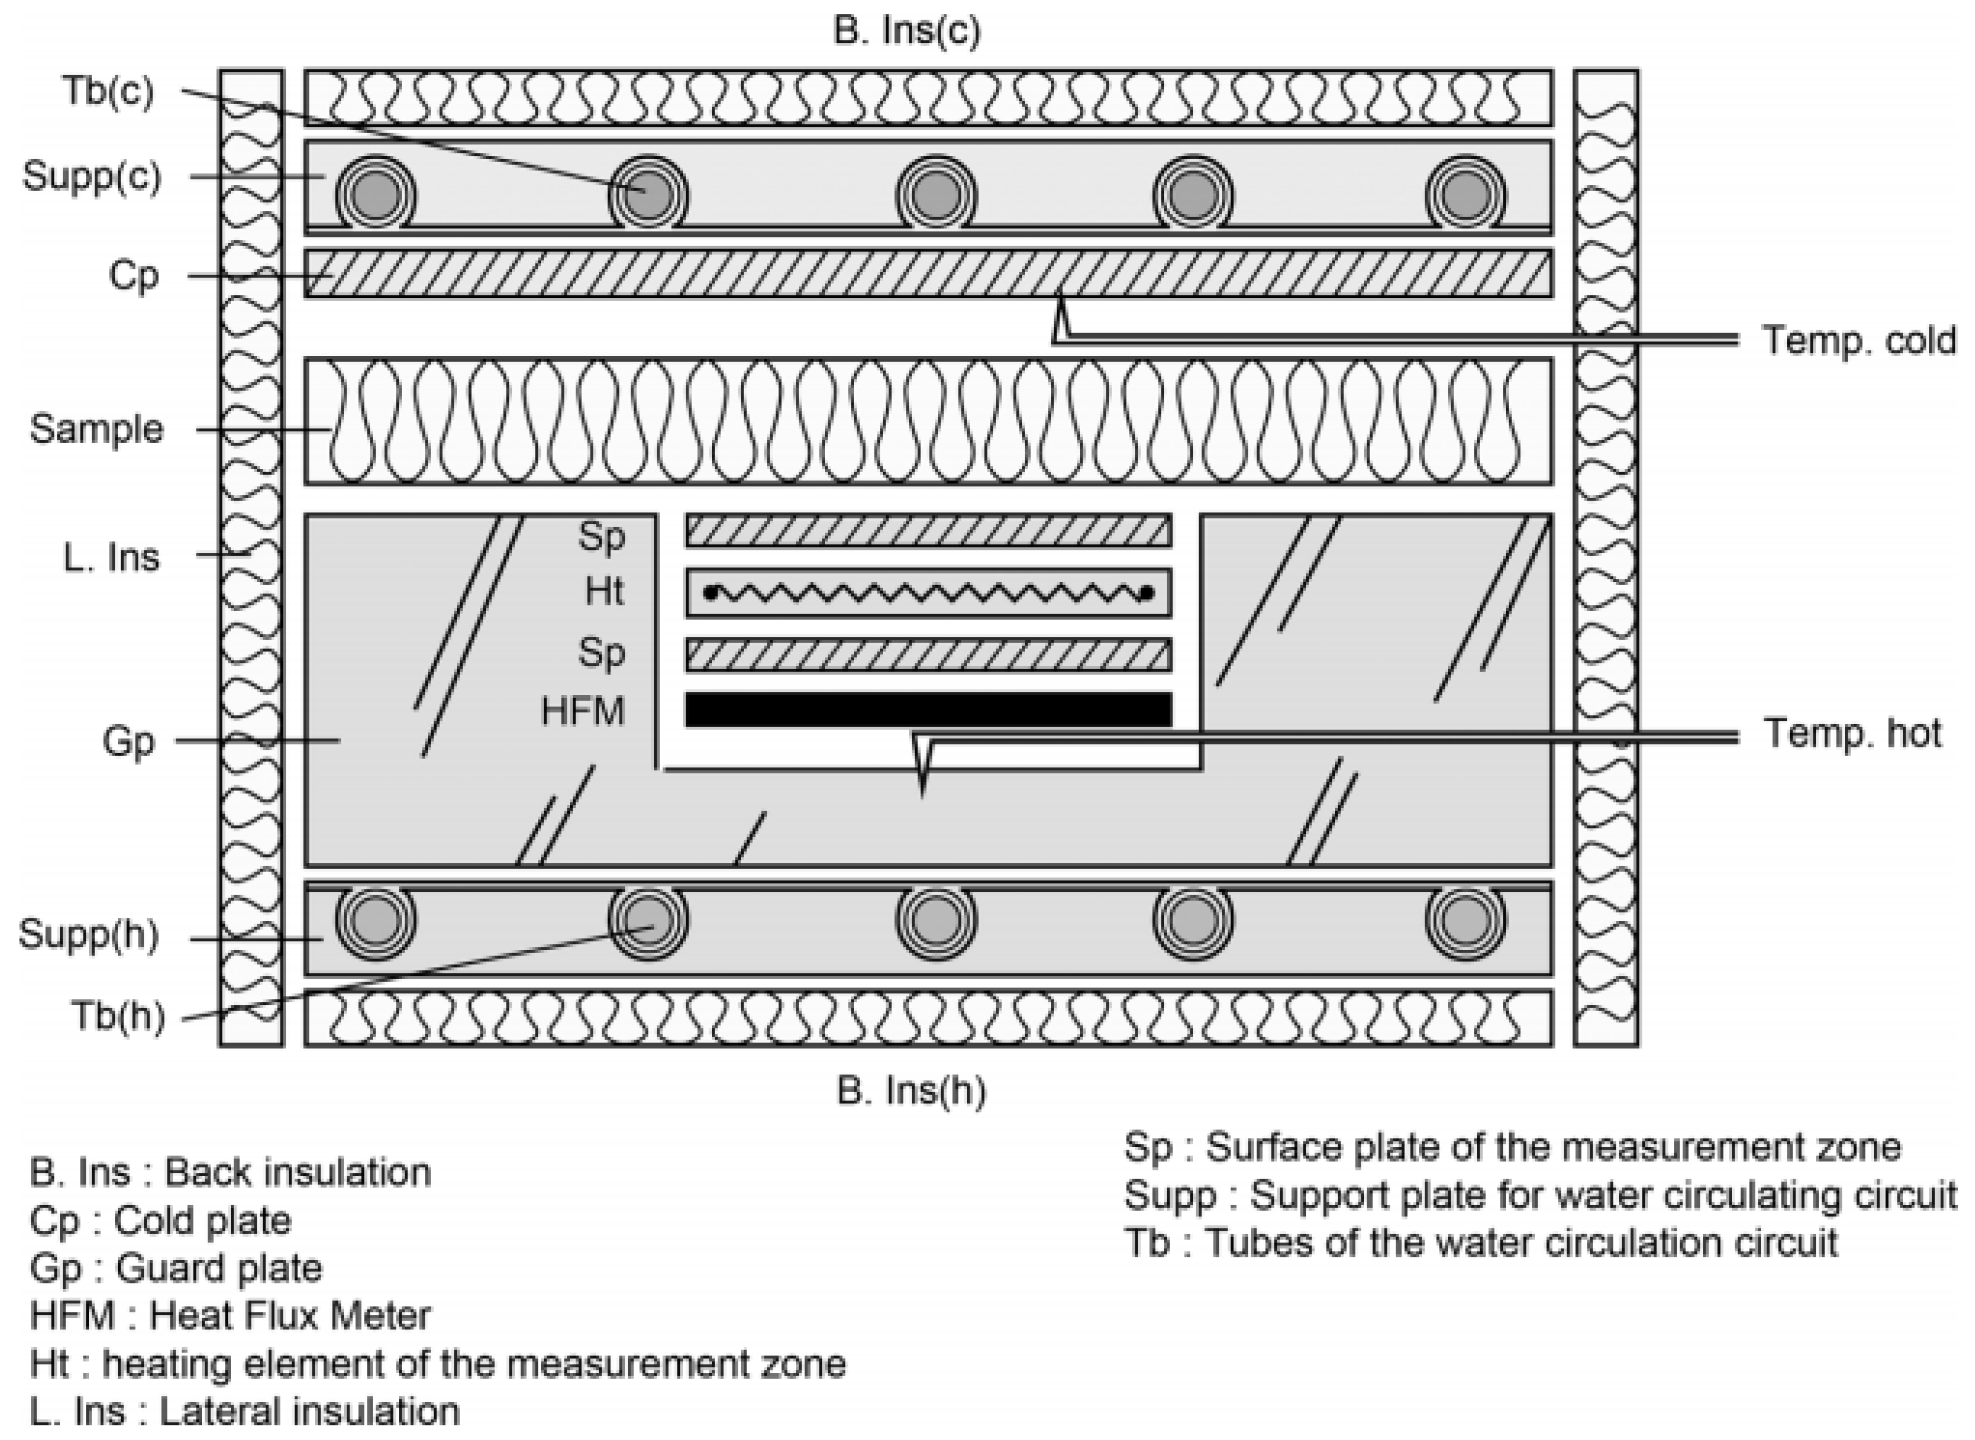
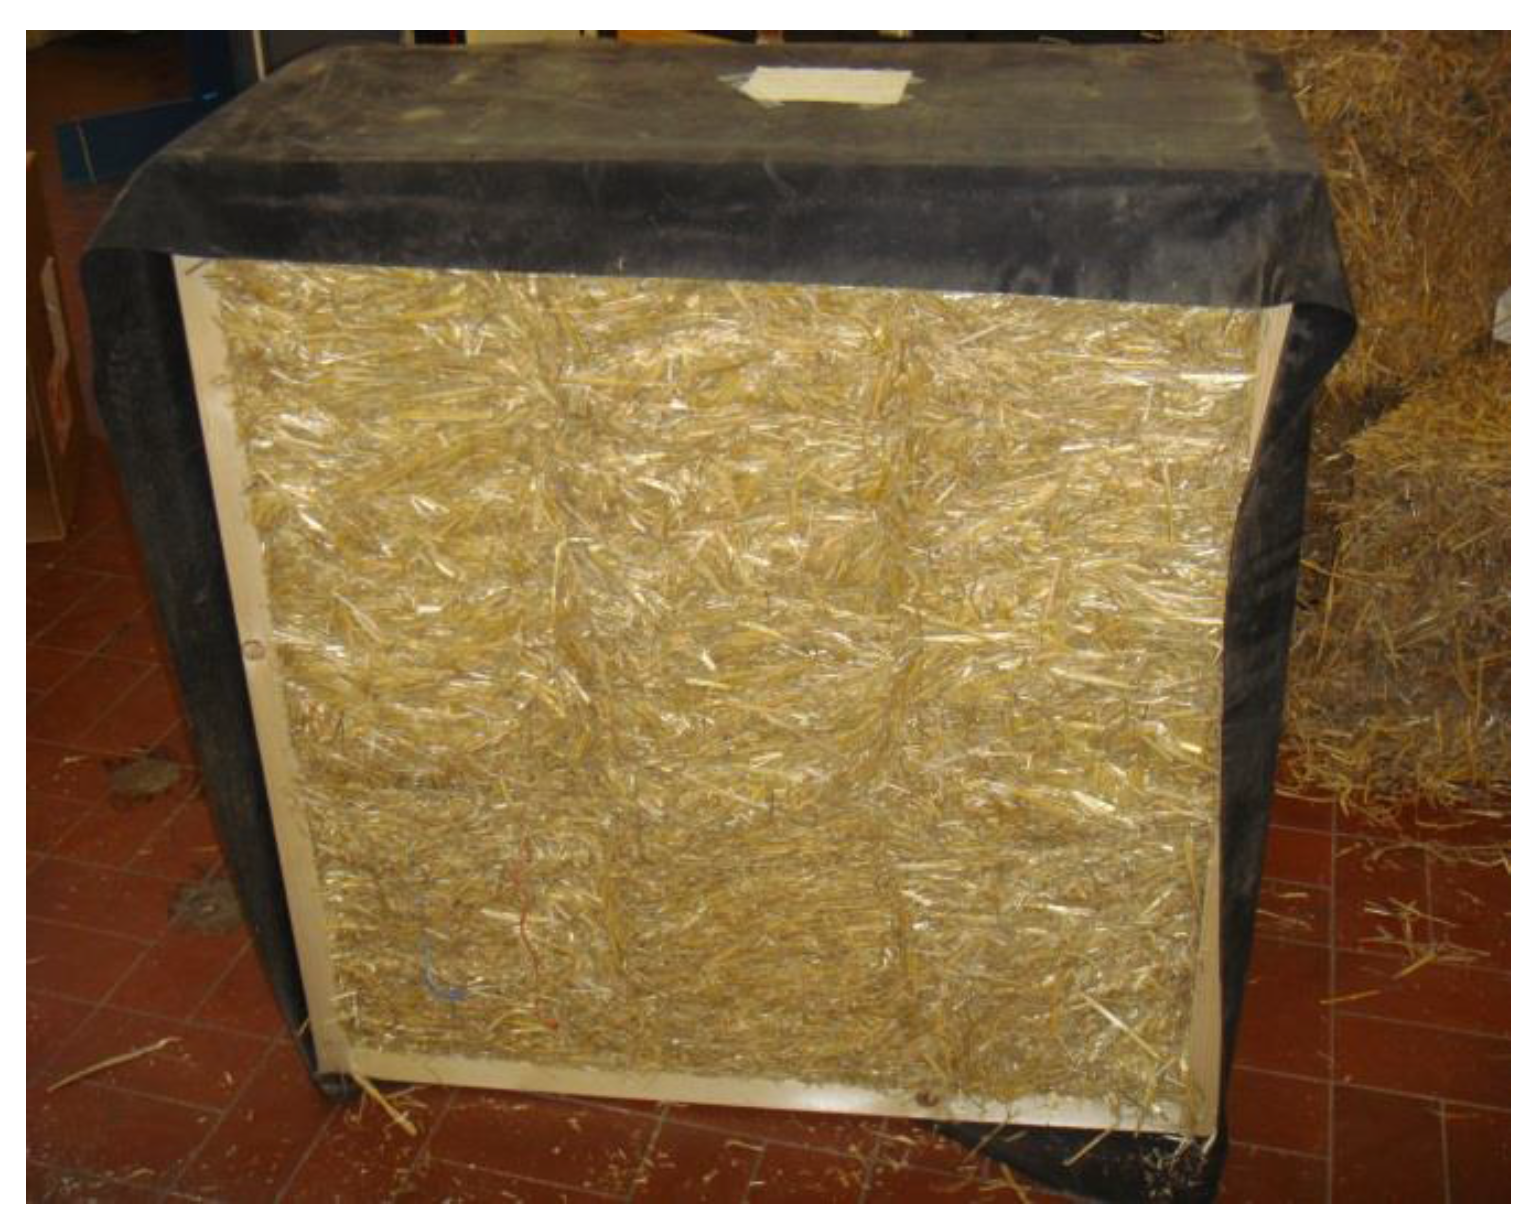
2.1. Measurements and Method

The specific Guarded Hot Plate (GHP) developed in this research and detailed in Dubois [3] was placed in an environment at 10 °C (hot plate at 15 °C, cold plate at 5 °C), while the test samples were stored in an environment at 23 °C and 50% RH before measuring, according to EN ISO 10456. The guarded hot plate technique is a stationary method that requires thermal equilibrium and thus a significant measurement time. Its principle is to reproduce the uniform, unidirectional, and constant thermal flux density existing through an infinite, homogeneous, slab-shaped specimen caught between two infinite isothermal planes. The analyzed specimen is sandwiched between a heated hot plate maintained at temperature Tb(h) and a cold plate maintained at a lower temperature Tb(c) as presented on Figure 10. The heat dissipated in the hot plate would travel to the cold plate through the sample but also backwards and laterally on the edges of the hot plate. Back and lateral ‘guard zones’ are then necessary to neutralize these leaks.
When the temperature is the same in the guard and measurement plate and the edge of the sample is well insulated or far enough from the heater plate, it can be assumed that all the electrical power dissipated in the electrical heater flows vertically through the sample. The heat flow meter allows the flow of heat that goes from the measurement plate area to the guard zone and vice versa to be controlled. Specific numerical simulations were conducted in order to design properly the geometry and size of the GHP components (measurement area, size insulation) as well as the effect of the room temperature and the sample thickness on the intrinsic error.
Several tests were then conducted on polystyrene, tested beforehand with a certified apparatus. For each test, the intrinsic error was calculated based on the ratio of the heat flux and the ‘leak’ fluxes measured by the heat flux meter sandwiched between the guard plate and the heater. The obtained intrinsic error for polystyrene was 0.5%. The straw bales were also tested with thicknesses varying from 20 cm to 45 cm. Preliminary tests showed that when the room temperature was well controlled during the measurement, the device error remains in the same range whatever the specimen thickness (below 2%).
This apparatus was used to measure full size samples of wheat bales of approximately 1 m2 with a wood frame filled with 3 compressed straw bales, as presented in Figure 11. A vapor tight membrane and a layer of insulation are placed around the frame to prevent heat and moisture exchange between the room and the sample itself.
The standard dimensions of straw bales used in Belgian buildings were used; 36 cm × 46 cm × 80 cm, as presented in Figure 4. The length is usually around 80 cm, but it can be set to another value, ranging from 36 cm to 120 cm or 150 cm, if necessary. When the length is too small, more handling is needed; when it is too long, there may be problems of cohesion and the bale may be too heavy to handle easily.

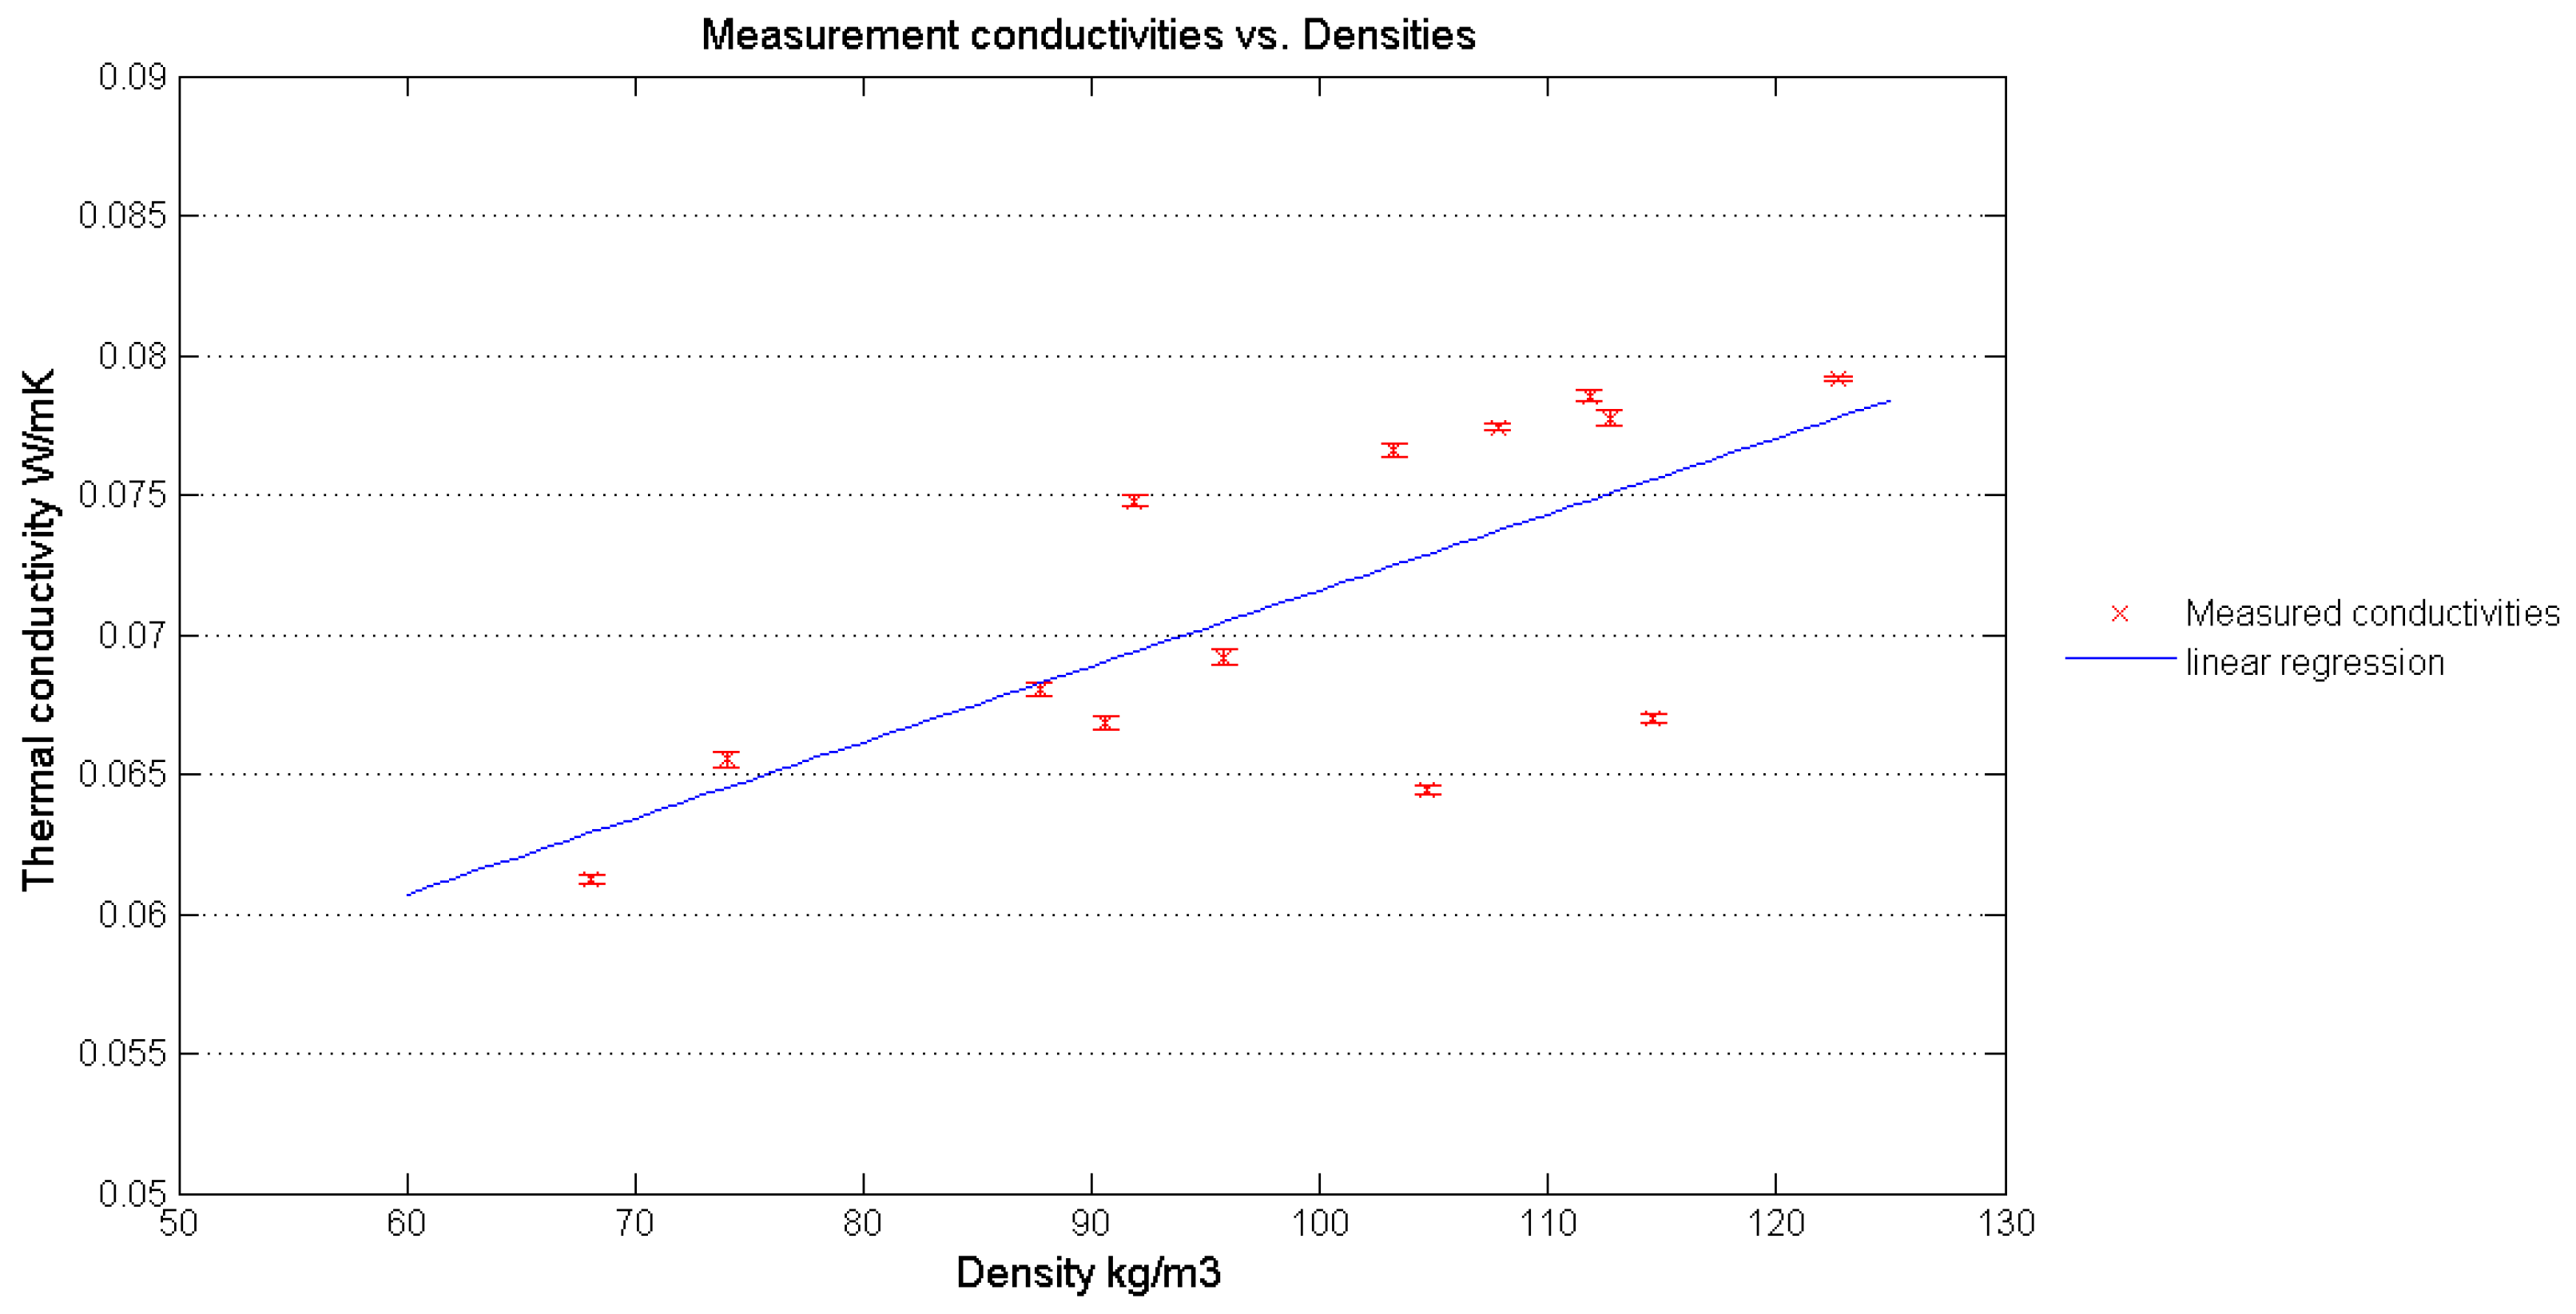
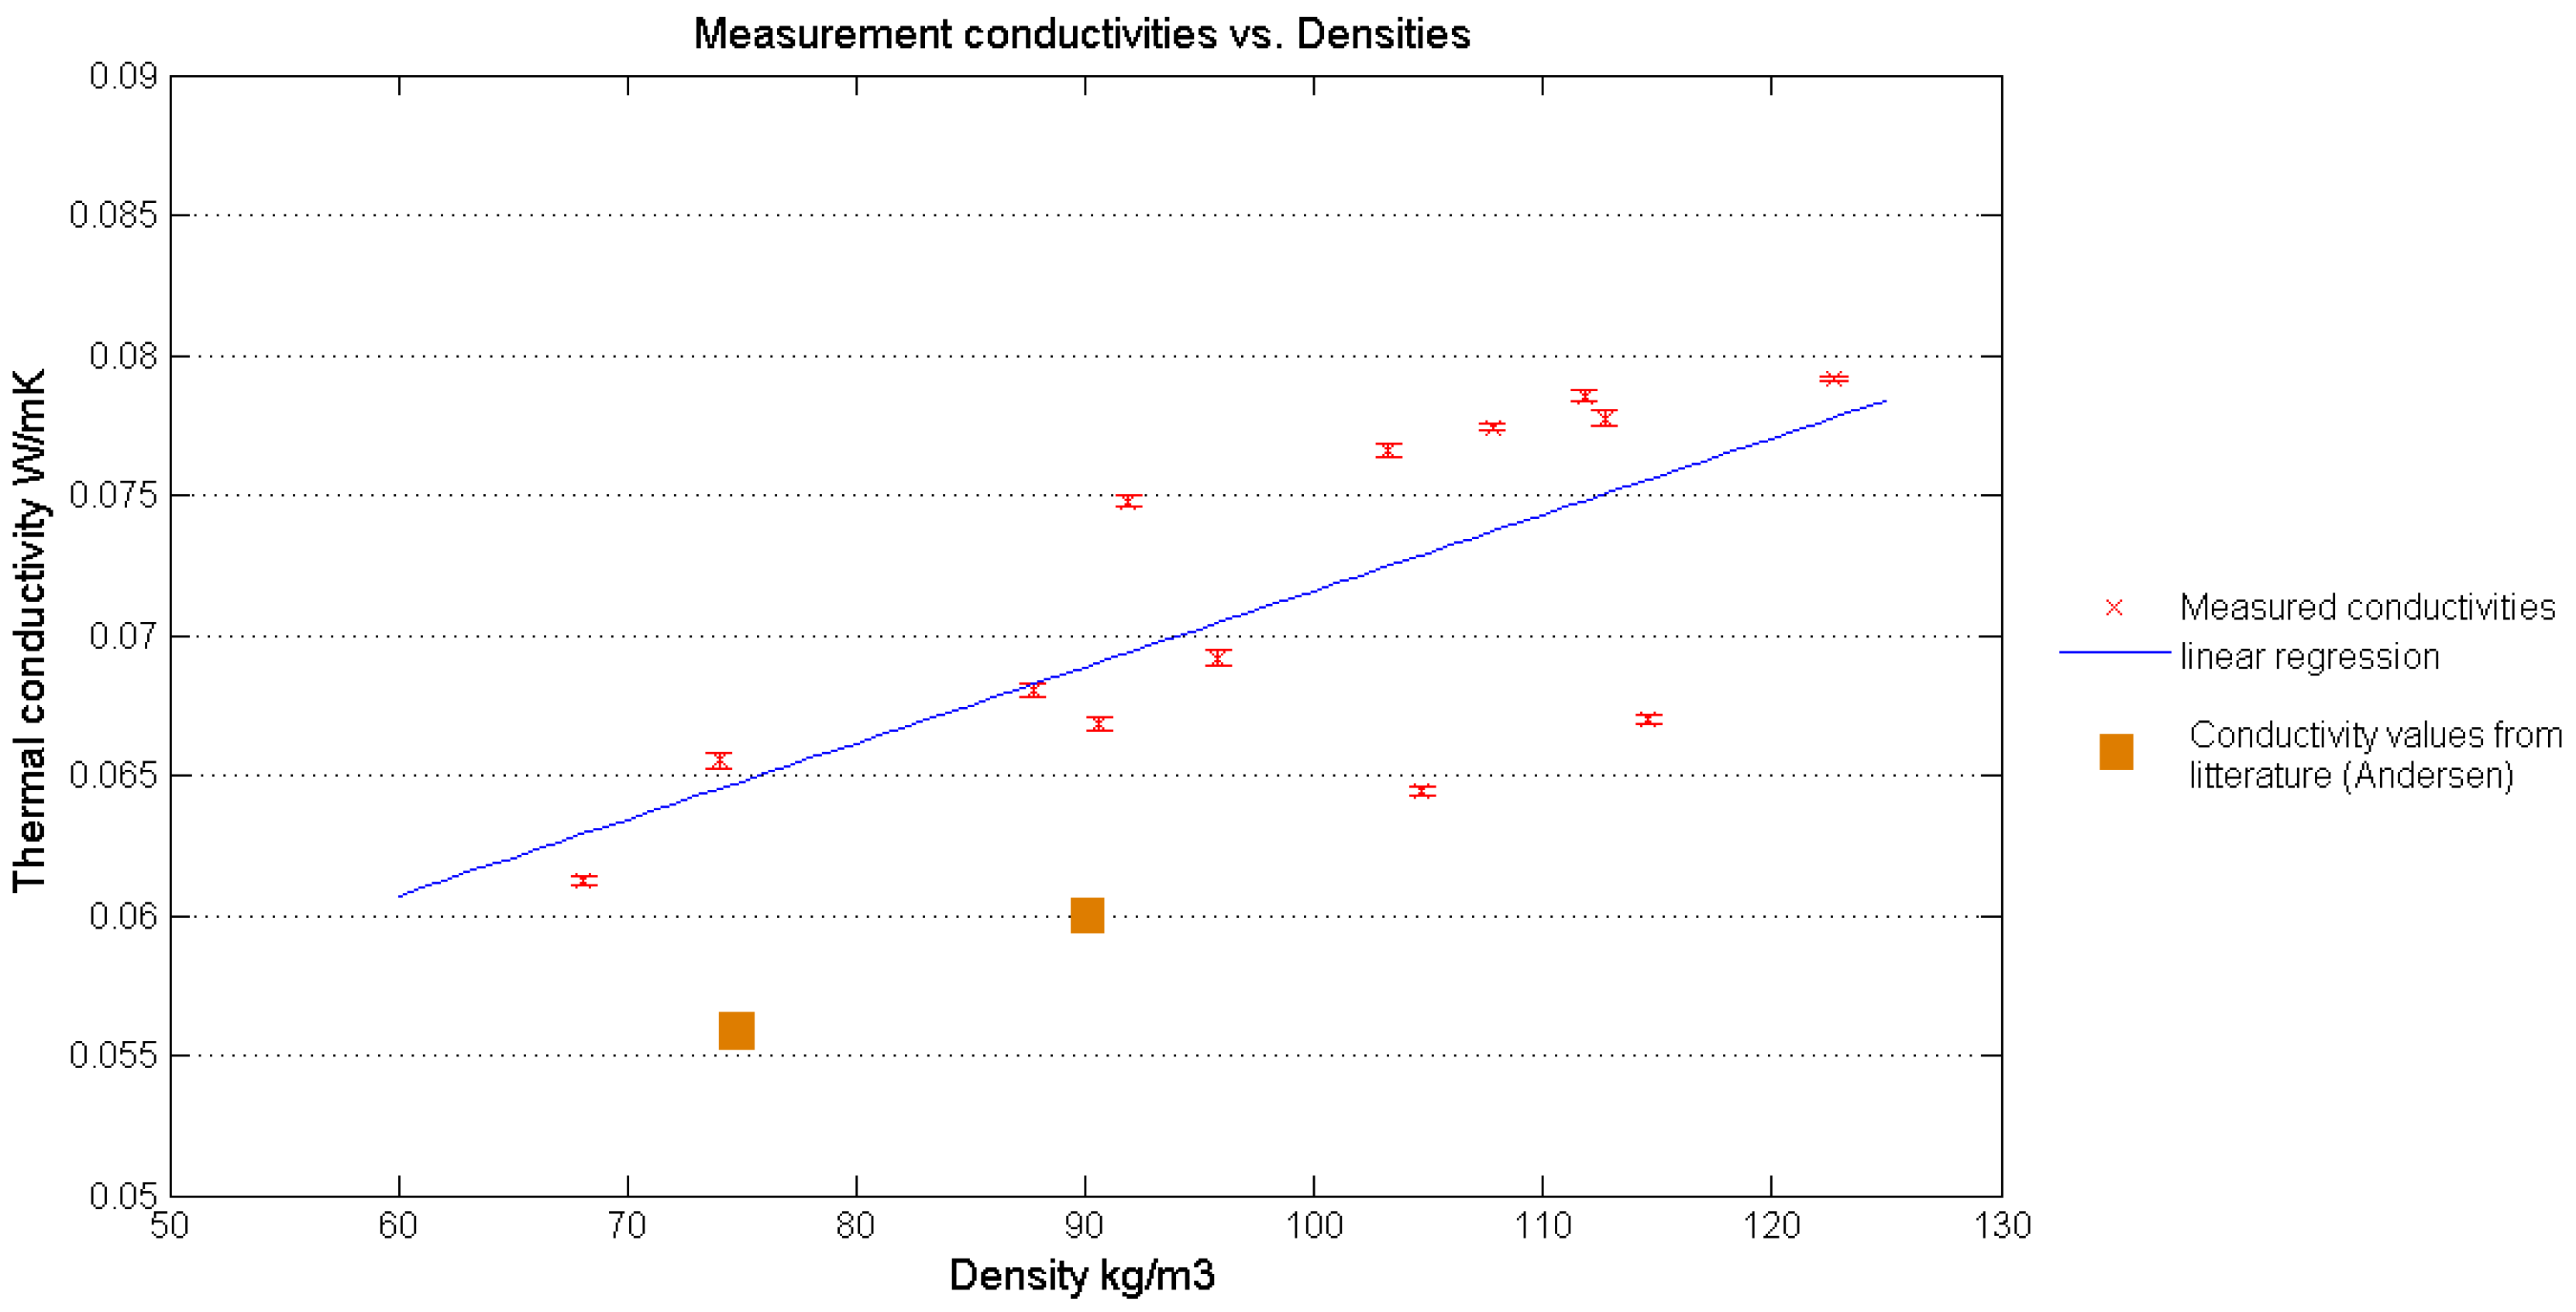
2.2. Thermal Conductivities

13 straws bales were measured with the Guarded Hot Plate device. This experimental campaign yields 65 conductivity values, since each measurement on a specimen was repeated 5 times.
The straw bales had varying properties; the density range started from 68 to 123 kg/m3 and the thickness from 30 cm to 49.5 cm. The density and thickness values for all the measured specimens are detailed in the Table 2.
A linear multiple regression was performed in order to model the effects of the investigated parameters on the thermal conductivity.
The resulting model can be expressed as:
λ = 4.81 × 10⁻² + 2.9 × 10⁻⁴d − 1.13 × 10⁻²t
where:
  • λ = thermal conductivity (W/mK)
  • d = density (kg/m3)
  • t = thickness (m)
R2, the coefficient of correlation, and r, the Pearson coefficient of the model, were respectively 0.48 and 0.69. These statistical results indicate with 5% uncertainty that the proposed regression model is reliable and that the model explains 48% of the total variance of thermal conductivities. In order to go further, a variance analysis was applied to the model and its three coefficients; namely, the constant, density, and thickness coefficients. The variance analysis yielded the following results; the measured effect for the density is significant while no effect for the thickness could be found. Consequently, a simple linear regression is applied to the measured conductivity, considering the density only. Again, this analysis includes all the 65 measurements. The resulting model and its regression equation are displayed in the Figure 12.
The linear regression model obtained through this linear analysis can be expressed as:
λ = 4. 44 × 10−2 + 2.72 × 10⁴d
where:
  • λ = thermal conductivity (W/Mk)
  • d = density (kg/m3)
As previously determined for the case of the multiple regressions, a variance analysis with a 5% uncertainty was applied. The variance analysis shows that the coefficient effects, related to the density 2.72 × 10⁻⁴, are statistically significant. The proposed model, as described in Equation (2), shows that the density explains about half (48.8%) of the total variance of the thermal conductivity. It results in the conclusion that 51.2% of the thermal conductivity model is not explained by the density. Some hypotheses may be proposed here in decreasing order: first, the high variability inherent to natural material is a high source of deviation; secondly, the natural variability of the measurement and the measurement noise provided by the guarded hot plate device may also affect the conductivity value.
A practical conclusion regarding the model sensitivity is that a 10% variation on the density gives an almost 4% thermal conductivity variation. The comparison of the thermal conductivity modeled values with the measurements gives an average relative error about 4.5%.
The Figure 13 displays the measured values and the proposed model based on the linear regression; additionally, the conductivity values given by Andersen are plotted on the graph.

3. Discussion

Based on the proposal of the modeled thermal conductivity law presented earlier, the effect of the density of the bales in relation to the thermal transmission of a straw bale wall are investigated in this section. The bale density is set by the spring acting on the conveyer of the baler. The medium density straw bales (70–150 kg/m3) are historically the most common bales used by farmers and in straw building. 150–220 kg/m3 is the range of high-density bales; these types of bales are heavy and difficult to handle. A density lower than 60 kg/m3 results in a loss of coherence of the bales and a higher risk of damage during the storage, transport, and building processes. Most biosourced insulating panels, like fiber, wood, or hemp panels, are processed industrially. While mechanical loads or shocks are limited during the manufacturing process for these types of panels, straw bales with low densities might undergo severe damages during harvesting, transport, and storage. Moreover, for low-density straw bales, the fire reaction of the bales should be examined carefully. The German agreement Z-23.11-1595 [15] advises a bale density in the range of 90 kg/m3 to 110 kg/m3. In the following discussion, bales with a maximum density of 150 kg/m3 and a minimum density of 60 kg/m3 will be examined. The discussion focuses on the straw consumption analysis in a theoretical wall. It is assumed that the wall has no finishing. In order to introduce economical and environment considerations, the mass of straw used in a square meter of the apparent wall will be preferred to the density in the analysis. Additionally, the width of the wall will be considered according to the equation:
Mass1m2wall = Densitywall × Widthwall
The considered wall widths are 36, 40, and 46 cm.
The straw wall densities in grey on the left and the right of the Table 3, showing values outside the 60 to 150 kg/m3 range, will not be considered further in the discussion. For values in the range of 60 kg/m3 to 150 kg/m3, the thermal conductivities are calculated using Equation (2).
Then, the thermal resistance and thermal transmission coefficient are obtained. Thermal conductivity, thermal resistance and thermal transmission values for each case are presented respectively in Table 4, Table 5 and Table 6. For each column, the percentage gains of λ, R, and U for a given mass of straw in the wall are calculated when the density is varying, i.e., when the wall width is changing.
The lowest reachable thermal conductivity within the range of acceptable bales densities is near 0.06 W/mK. Lower values could be obtained with densities lower than 60 kg/m3. Consequently, a first conclusion is that, for the cases of bales oriented with directions 1 and 2 (in such a way that the heat flow is partially ‘parallel’ to the fibers), the best reachable thermal conductivity is near 0.06 W/mK.
Secondly, for each wall mass scenario, a 7.4% decrease of the thermal conductivity value is observed, on average, when the density is decreasing within the acceptable density limits. It’s quite relevant to notice that this significant gain is obtained with the same mass of straw consumed in the wall. In other words, the thermal conductivity is significantly improved with less mass consumption and, consequently, less additional environmental impact.
Then, the percentage values calculated along the lines of the table show an average decrease of 25% on the thermal conductivity. This average value is obtained when, for a given width of wall, the density is decreasing from the maximum (150 kg/m3) to the minimum (60 kg/m3), which corresponds to a decrease of the straw mass hold in the wall.
Based on the values of thermal conductivity obtained from the presented model, the same types of analysis are performed on the calculated thermal resistance R (m2K/W) and on the thermal transmission factor U (W/m2K). These results for each combination of wall widths and straw mass cases are presented in the two following tables.

4. Conclusions

In this paper, the thermal conductivity of straw bales measured by the international straw bale community over decades are presented and discussed. Tests on some conductivity values found in the literature are conducted using small samples, while straw bales have a larger thickness than most of the insulating materials. Consequently, measurement apparatus for thermal conductivity is usually not designed for such thickness. In order to guarantee reliable measurements, the authors present a specific guarded hot plate to measure samples up to 50 cm thick. Then, the different ways in which the bales are oriented and installed in vertical walls are presented and discussed. The influence of density and thickness on the thermal conductivity of the samples has been investigated. The results analysis shows that the observed deviations in the thermal conductivity values are mainly due to the density variations. Then, the thermal conductivity is modelled through a linear equation with respect to the density. Based on this model, different strategies using straw bales walls are discussed, regarding their predicted thermal performances and the straw material consumption. As expected, the highest thermal performances are obtained with the lowest densities. Calculated performances for each wall strategy show that, for a given wall width, the thermal conductivity λ, as well as the thermal transmission coefficient U, may be improved by about 25%, according to the density of the bale. For an average density about 100 kg/m3, the calculated thermal transmission coefficient varies between 0.2 to 0.15 W/m2K, according to the bale width, i.e., the way the bale is installed. This noticeable performance of straw bales is quite relevant, considering the fact that this high performance is reached with a low environmental impact. This is an important result regarding the perspectives of improvement of straw bale wall performances.

Acknowledgments

The research project aPROpaille was supported by the Walloon region with the partnership of ICEDD (Institut de conseil et d’étude en développement durable), Université de Liège, and Paille-Tech, coordinated by Université Catholique de Louvain. The contribution of the first author of this paper was founded by the Burgundy Region

Author Contributions

Arnaud Evrard supervised the aPROpaille project. The guarded hot plate device was designed by Samuel Dubois and Frédéric Lebeau. Thermal conductivities measurements were executed by Amaury Daras, supervised by Frédéric Lebeau and Luc Courard. The thermal conductivities values were analysed by Jean-Philippe Costes, Benjamin Biot, Arnaud Evrard and Gauthier Keutgen.

Conflicts of Interest

The authors declare no conflict of interest.

References

  1. European Straw Bale Gathering—ESBG: Montargis, France, 20–25 August 2015. Available online: www.esbg2015.eu (accessed on 10 September 2016).
  2. EN ISO 10456:2007 Building Materials and Products—Hygrothermal Properties—Tabulated Design Values and Procedures for Determining Declared and Design Thermal Values; ISO: Geneva, Switzerland, 2007.
  3. Dubois, S.; Lebeau, F. Design, Construction and Validation of a Guarded Hot Plate Apparatus for Thermal Conductivity Measurement of High Thickness Crop-Based Specimens. Mater. Struct. 2015, 48, 407–421. [Google Scholar] [CrossRef]
  4. ISO 8302:1991 Thermal Insulation—Determination of Steady-State Thermal Resistance and Related Properties—Guarded Hot Plate Apparatus; ISO: Geneva, Switzerland, 1991.
  5. McCabe, J. Thermal Resistivity of Straw Bales for Construction. Master’s Thesis, University of Arizona, Tucson, AZ, USA, 1993. [Google Scholar]
  6. Andersen, B.M.; Munch-Andersen, J. Halmballer og Muslinger som Isoleringsmaterialer; Report 2001-06–21; Statens Byggeforskningsinstitut: Copenhagen, Denmark, 2001. [Google Scholar]
  7. Shea, A.D.; Wall, K.; Walker, P. Evaluation of the thermal performance of an innovative prefabricated natural plant fibre building system. Build. Serv. Eng. Res. Technol. 2013, 344, 369–380. [Google Scholar] [CrossRef] [Green Version]
  8. Prüfbericht. Wärmeleitfähigkeit nach EN 12667; Forchungsinstitut für Wärmeschutz e.V.: München, Germany, 2010. [Google Scholar]
  9. Deutsches Institut für Bautechnik (DIB). Available online: https://www.dibt.de/index_eng.html (accessed on 10 September 2016).
  10. Douzane, O.; Promis, G.; Roucoult, J.-M.; Le, A.-D.T.; Langlet, T. Hygrothermal performance of a straw bale building: In situ and laboratory investigations. J. Build. Eng. 2016, 8, 91–98. [Google Scholar] [CrossRef]
  11. Conti, L.; Barbari, M.; Monti, M. Steady-State Thermal Properties of Rectangular Straw-Bales (RSB) for Building. Buildings 2016, 6, 44. [Google Scholar] [CrossRef]
  12. Wei, K.; Lv, C.; Chen, M.; Zhou, X.; Dai, Z.; Shen, D. Development and performance evaluation of a new thermal insulation material from rice straw using high frequency hot-pressing. Energy Build. 2015, 87, 116–122. [Google Scholar] [CrossRef]
  13. Grelat, A. Using Sustainable Materials as Walling for Individual Housing With Wood Structure; Final report; Centre D’expertise du Batiment et des Travaux Public: Saint-Remy-Les-Chevreuse, France, 2004. [Google Scholar]
  14. Palumbo, M.; Lacasta, A.M.; Holcroft, N.; Shea, A.; Walker, P. Determination of hygrothermal parameters of experimental and commercial bio-based insulation materials. Constr. Build. Mater. 2016, 124, 269–275. [Google Scholar] [CrossRef] [Green Version]
  15. Allgemeine bauaufsichliche Zulassung—Wärmedämmstoff aus Strohballen “Baustrohballen”; Technical agreement n° Z-23.11–1595; Deutsches Institut für Bautechnik: Berlin, Germany, 2006.
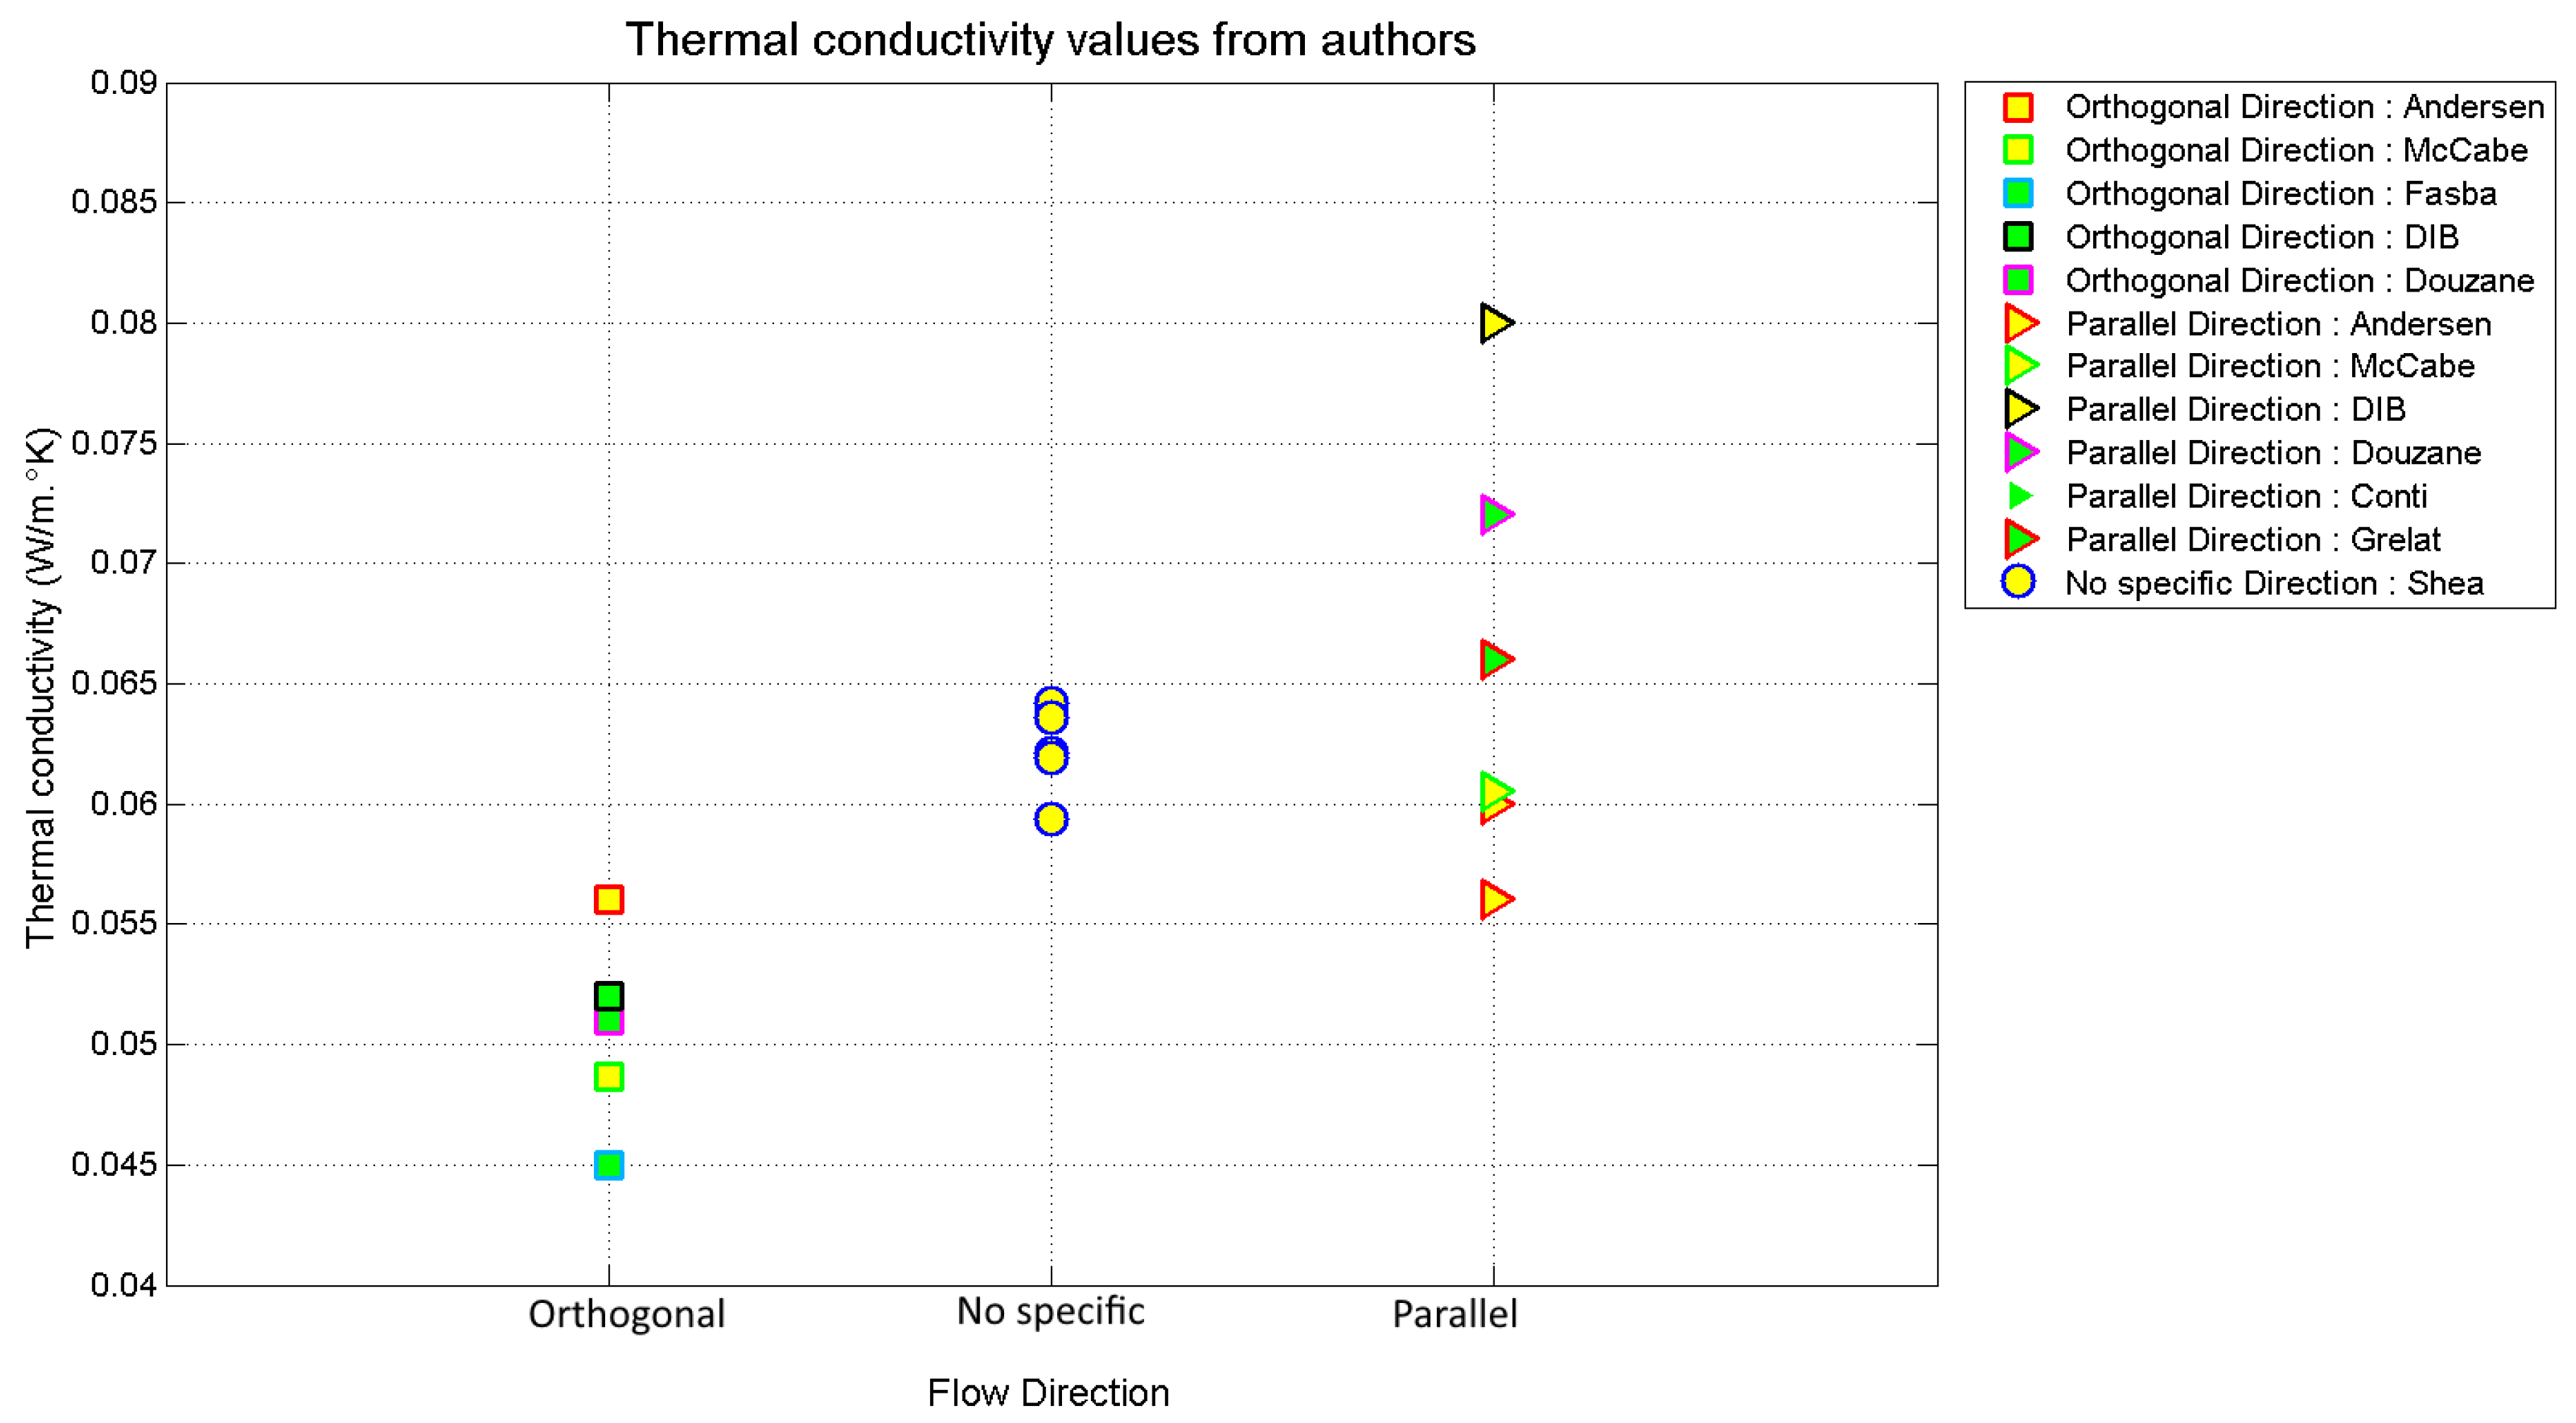
Figure 1. Effect of bale density on thermal conductivity from the literature.
Buildings 07 00011 g001
Figure 2. Effect of bale orientation on thermal conductivity from the literature.
Buildings 07 00011 g002
Figure 3. Dimensions of the studied straw bales and the direction of the heat flow.
Buildings 07 00011 g003
Figure 4. Visual assessment of the orientation of the fibres in a straw bale.
Buildings 07 00011 g004
Figure 5. Proposed terminology when referring to straw bale orientation in vertical walls.
Buildings 07 00011 g005
Figure 6. Example with straw bales laid flat on surface 2 and heat flow direction 1.
Buildings 07 00011 g006
Figure 7. Example with straw bales laid on surface 3 and heat flow direction 1.
Buildings 07 00011 g007
Figure 8. Example with straw bales laid on surface 3 and heat flow direction 2.
Buildings 07 00011 g008
Figure 9. (a) Example with straw bales laid on surface 2 and heat flow following direction 3; (b) Example with straw bales laid on surface 2 and heat flow following direction 3. The length of the straw bale has been reduced.
Buildings 07 00011 g009
Figure 10. The Guarded Hot Plate measurement principle [10].
Buildings 07 00011 g010
Figure 11. Full size test sample prepared for thermal conductivity measurement.
Buildings 07 00011 g011
Figure 12. Measured conductivity (an average of 5 measurements) versus bale density.
Buildings 07 00011 g012
Figure 13. Measured conductivity (an average of 5 measurements) versus bale density, using a simple linear regression model.
Buildings 07 00011 g013
Table 1. Thermal conductivity of straw bales found in the literature.
ReferenceDensity (kg/m3)OrientationThermal Conductivity (W/mK)
McCabe, 1993 [5]130perpendicular0.0487
parallel0.0605
Andersen, 2001 [6]75perpendicular0.052
parallel0.056
90perpendicular0.056
parallel0.06
Shea, 2013 [7]63no specific direction0.0594
760.0621
850.0619
1070.0642
1140.0642
1230.0636
Fasba, 2003 [8]90–110perpendicular0.045
Douzane, 2016 [10]80perpendicular0.051
parallel0.072
Conti, 2016 [11]75parallel0.066
Grelat, 2004 [13]77parallel0.066
DIBt, 2006 [9]90–110perpendicular0.052
parallel0.08
Table 2. Density and thickness values of the measured bales.
Thickness (m)Density (kg/m3)
0.374
0.471111.8
0.488114.6
0.48591.9
0.462104.7
0.386107.8
0.485122.7
0.48595.8
0.48687.7
0.495103.2
0.48490.6
0.48168.1
0.476112.7
Table 3. Calculated densities for various combinations of straw mass (in an apparent square meter wall) and wall width.
Straw Mass in Apparent Wall Surface kg/m2
2025303540455055606570
Wall width (cm)3655.669.483.397.2111.1125.0138.9152.8166.7180.6194.4
4050.062.575.087.5100.0112.5125.0137.5150.0162.5175.0
4643.554.365.276.187.097.8108.7119.6130.4141.3152.2
Table 4. Calculated thermal conductivities for various combinations of straw mass (in an apparent square meter wall) and wall width.
Straw Mass in Apparent Wall Surface kg/m2
2025303540455055606570Gain Average
Wall width (cm)360.0600.0630.0670.0710.0750.0780.0820.0860.0900.0930.097−23%
400.0580.0610.0650.0680.0720.0750.0780.0820.0850.0890.092−28%−25%
460.0560.0590.0620.0650.0680.0710.0740.0770.0800.0830.086−25%
Gain (%) −3%−7%−8%−9%−9%−10%−6%−6%
Average:−7.4%
Table 5. Calculated thermal resistance R (m2K/W) for various combinations of straw mass (in an apparent square meter wall) and wall width.
Straw Mass in Apparent Wall Surface kg/m2
2025303540455055606570Gain Average
Wall width (cm)36 5.695.375.084.824.594.38 30%
40 6.516.175.875.595.335.104.894.70 39%34%
46 7.407.076.766.486.225.985.765.55 33%
Gain (%)-37%38%39%40%41%42%43%44%--
Average:40.4%
Table 6. Calculated thermal transmission coefficient U (W/m2K) for various combinations of straw mass (in an apparent square meter wall) and wall width.
Straw Mass in Apparent Wall Surface kg/m2
2025303540455055606570Gain Average
Wall width (cm)36 0.1760.1860.1970.2070.2180.228 –23%
40 0.1540.1620.1700.1790.1870.1960.2040.213 –28%–25%
46 0.1350.1420.1480.1540.1610.1670.1740.180 –25%
Gain (%)-–27%–27%–28%–29%–29%–30%–30%–30%--
Average:–28.7%

