1. Introduction
Informal settlements are dismissed parts of urban communities where housing and living conditions are dreadfully deficient. Informal settlements range from high density, grimy focal city apartments to unconstrained squatter settlements without lawful acknowledgment or rights, sprawling at the edge of urban communities. Informal settlements speak to a general marvel, which numerous nations experience the ill effects of worldwide and Egypt is no special case [1]. It is one of the significant marvels accompanying the quickened urbanization process around the world. They are an aftereffect of governments’ inability to give satisfactory and reasonable safe housing to the urban poor. Along these lines, informal settlements ought not be seen as a major aspect of the nations’ housing emergency but instead as a solution created by the urban poor under the current states of constrained monetary assets and bureaucratic control, and when neither the legislature nor the private division could furnish tenants with sufficient and reasonable housing [
1].
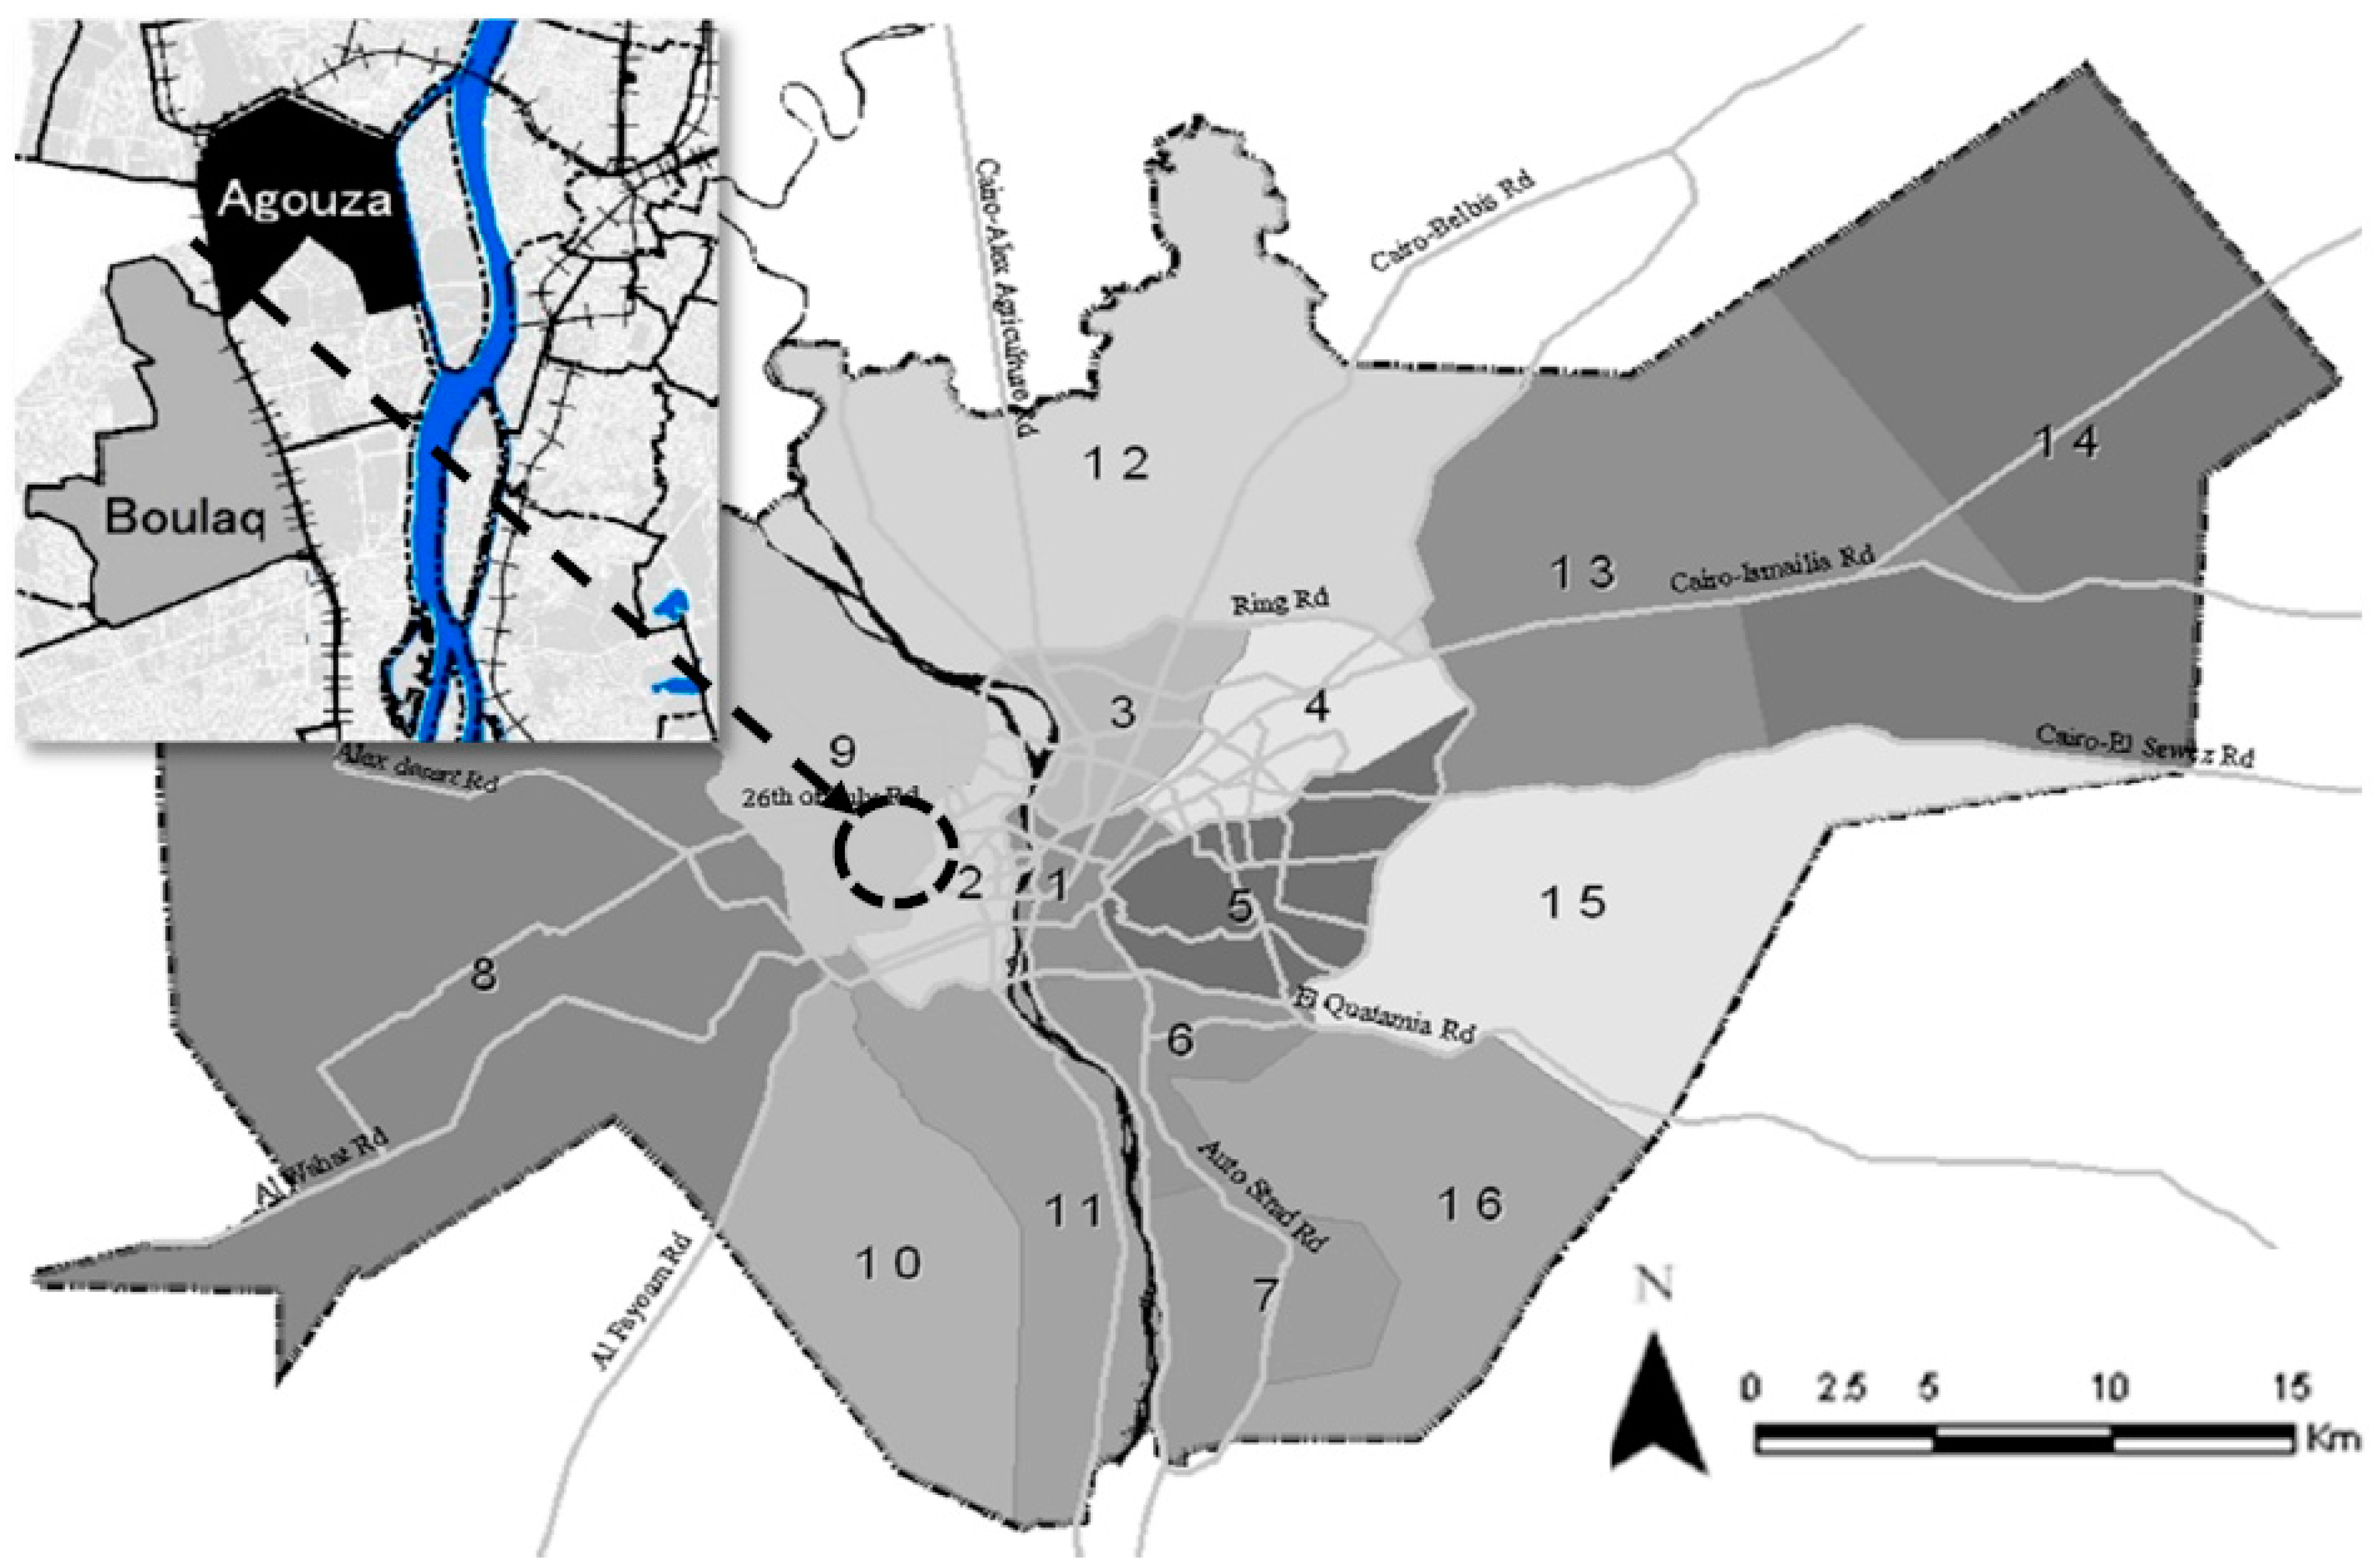
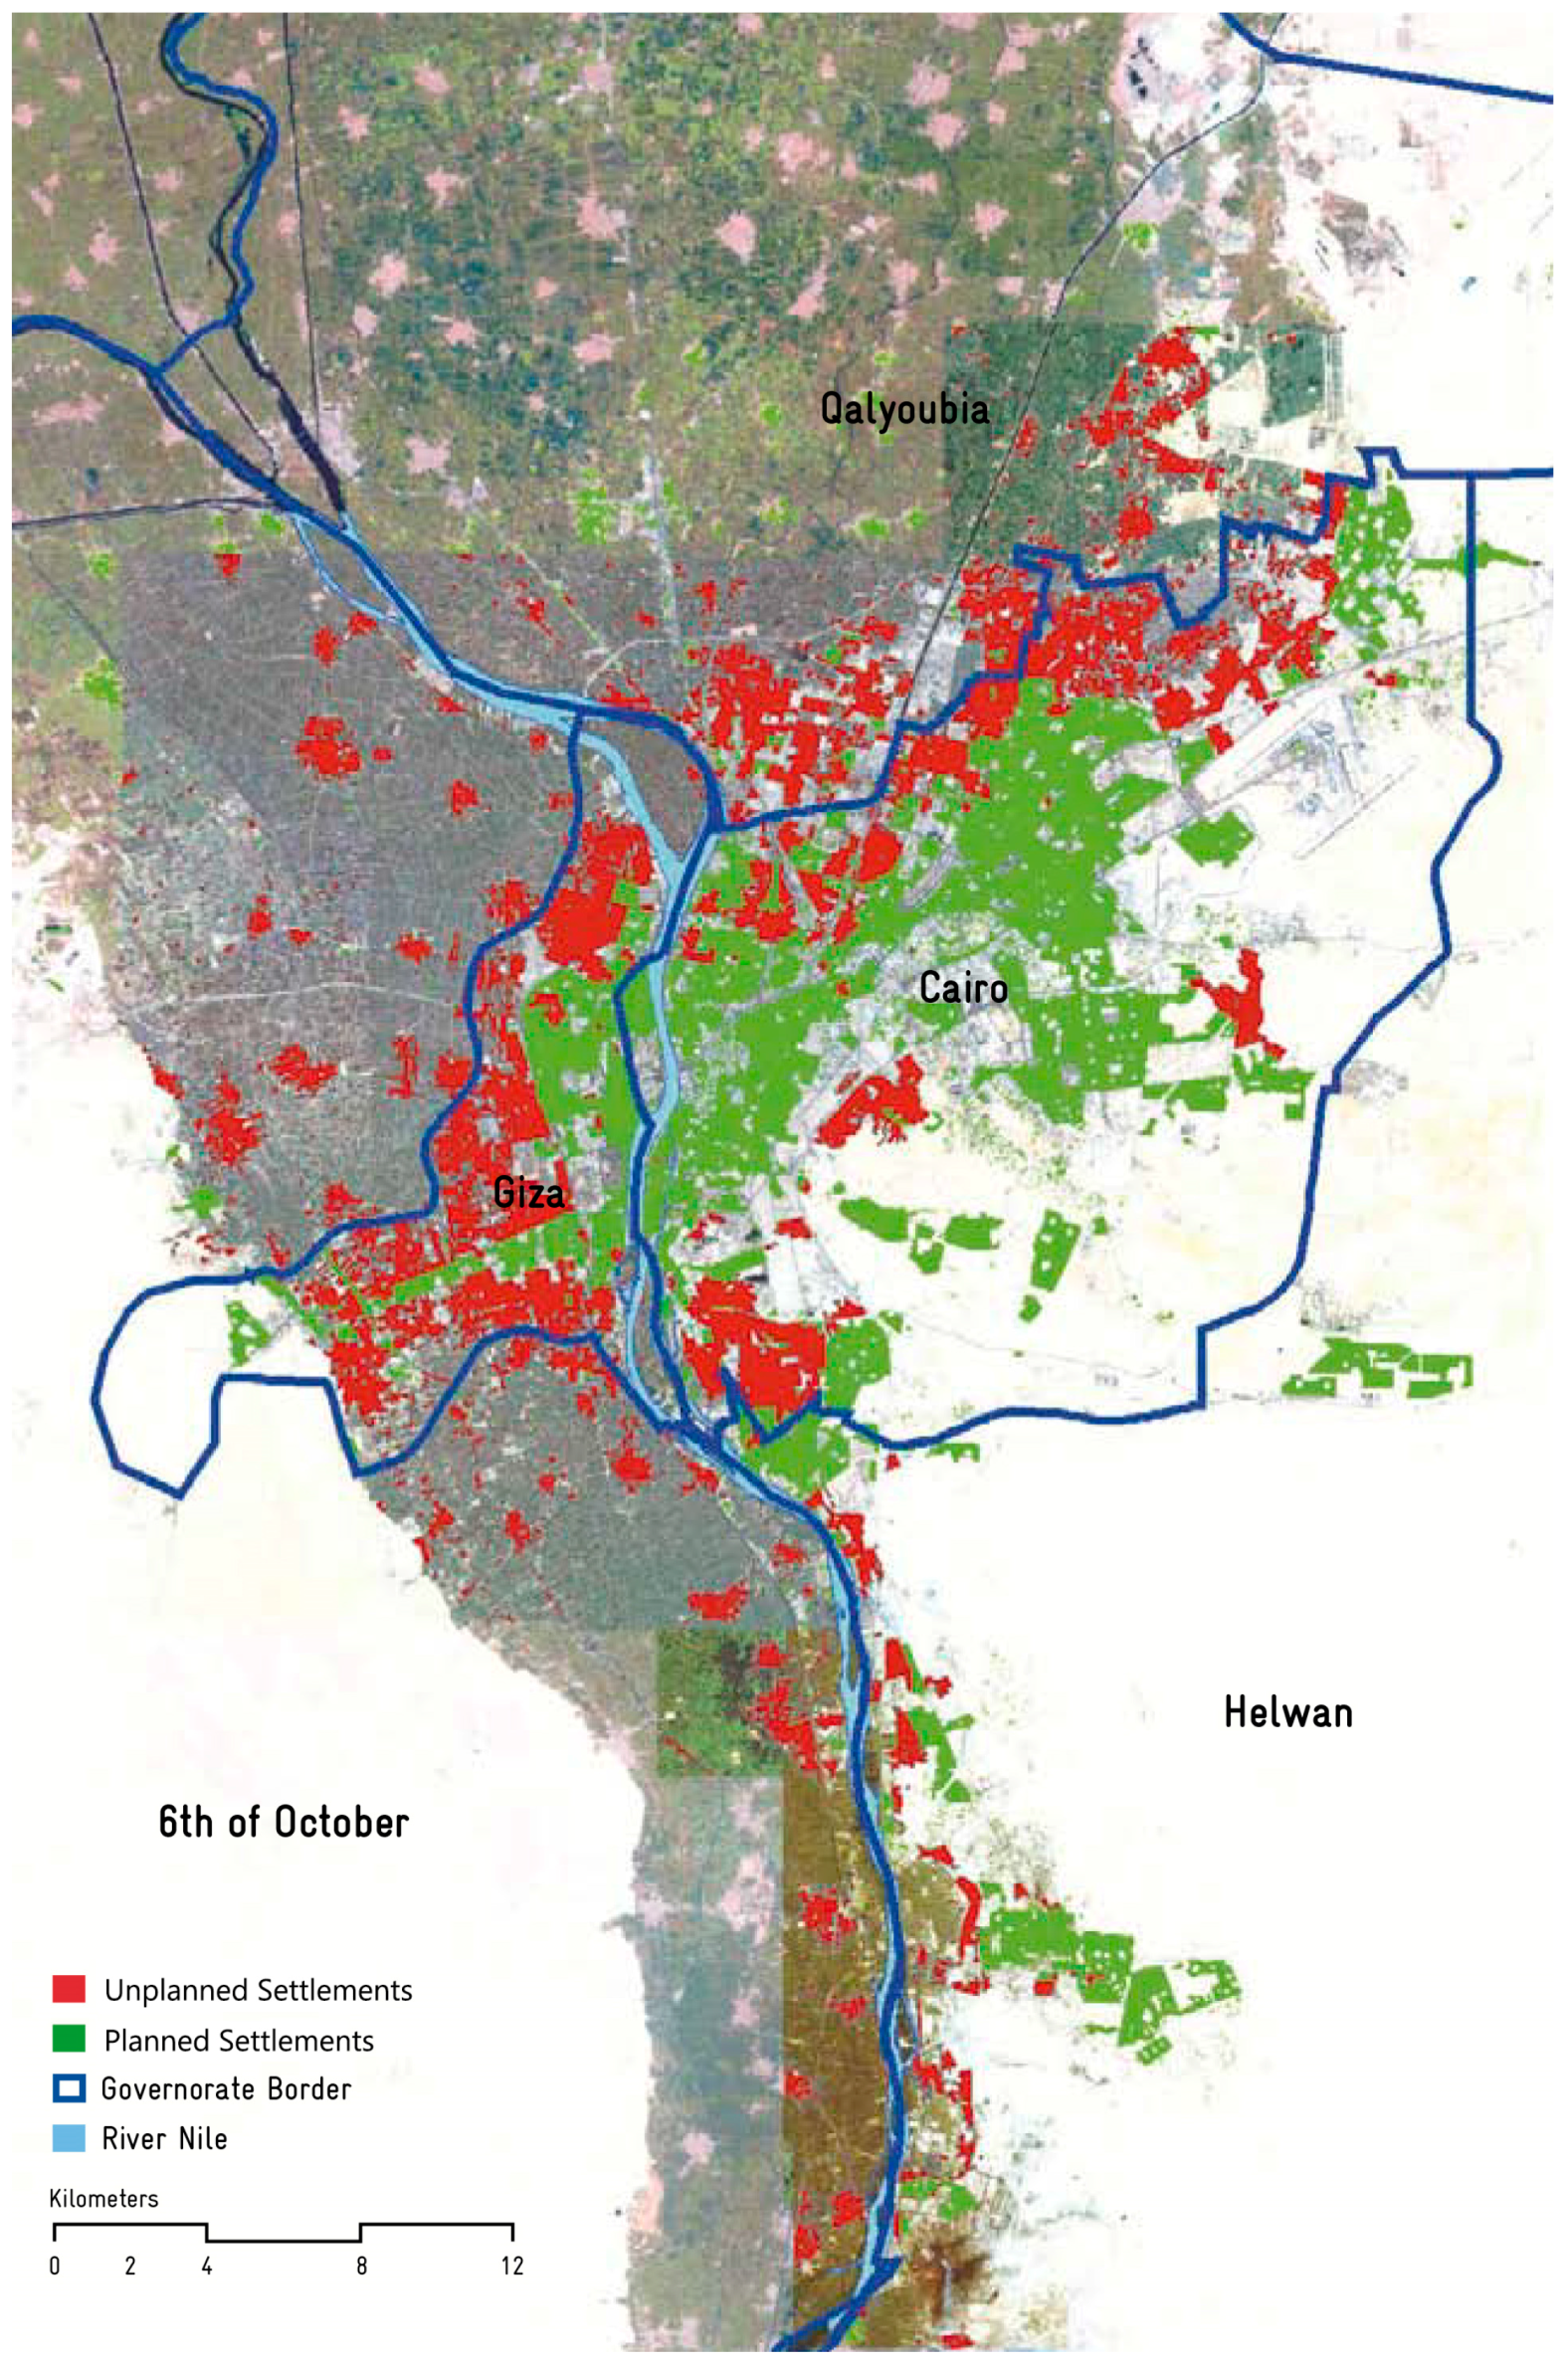
The rapid urbanization in Egypt over the past four decades has caused the emergence of unplanned urban development and unplanned housing supply. Unplanned settlements (
Figure 1) which were built out of the official governmental plans of GCMR are thought to accommodate between 12 and 17 million inhabitants, or about 40%–50% of Egypt’s urban population and over 20% of total population in 2006 [
2,
3]. Despite 30 years of attempts by the government to limit unplanned growth around the GCMR, as it has been in most Egyptian cities and villages, unplanned settlements around the GCMR sheltered more than 7 million inhabitants in 1998 [
4]. As of 2006, they were estimated to contain more than 65% of the population of GCMR (10.5 out of 16.2 million inhabitants), and the rate of population growth in these areas is higher than other cities averages, with an increase of 2% between 1996 and 2006 [
5]. Although many of the previous researches dealt with the unplanned settlements and its related aspects, no one of them has dealt with its urban characteristics or has taken into account the urban sustainability concept, which has become the main development issue in the future plan of Cairo 2027 [
3,
6,
7].
Informal settlements inside the Egyptian connection for the most part take one of two structures; (i) extension on exclusive horticultural area, mainly happening on the urban edges, and speaking to around 80% of informal urbanization; or (ii) squatter settlements on state-claimed land [
8]. For the previous, informality does not originate from proprietorship rights yet rather from the illicit change of agrarian area to housing and also the repudiation of building laws and directions [
9]. Informality is seen as generally unmistakable from convention. Informality alludes to human settlement, exchange or trade that happens outside formal legitimate structures and procedures [
10]. In monetary terms, it is regularly identified with unlicensed road sellers or illicitly utilized specialists, as it were, the informal economy. Informal housing alludes to urban settlement which happens on crouched land or that is worked without legitimate endorsement. Informal area use alludes to the unregulated, uncontrolled, chaotic and wasteful settlement and utilization of area [
11]. It is essentially not quite the same as the requested, directed, proficient ideas of arranged area use and settlement.
There are distinctive sorts of informal area use contingent upon different viewpoints, for example, legitimate status (from informal to formal); security of residency (from unreliable to secure); physical models (absence of access to framework to full arrangement of base); and general ecological, financial, social and political elements [
12]. Urban informality has been comprehended as "another" lifestyle [
13]. Informal area development gives the primary wellspring of housing to the urban poor in numerous creating nations. Low housing costs or lease and slack urban administration are the primary reasons that these urban poor dwell in informal housing neighborhoods, where the nature of urban life is normally much lower than in standard neighborhoods. Regularly, these areas are seen as ghettos [
14], with a low expectation for everyday life, an expansive number of needy individuals and an informal work market forming life at the base of the urban economy [
15].
The multidimensionality of informality spreads physical, financial, and lawful viewpoints, making it unfathomably loose in light of the fact that these components change crosswise over nations and regulatory definitions. By the by, there are four normal interlinked measurements of informality: the lawful (the absence of formal legitimate titles), unpredictable development designs in the urban structure, the absence of key open administrations, for example, sanitation, and the event on naturally powerless or open area [
16,
17,
18]. Beyond these measurements of informality, there are issues of definition and estimation, and the lawful measurement remains the most prevalent.
Informality is a procedure of urban development. Thusly, it can be moved forward. In the start of informal settlements, most open administrations are missing (asphalt, road lighting, water, and sanitation among others). With time, material union happens, sturdy development materials supplant transitory ones, structures are extended, and some open administrations (business focuses, schools, and so on.) start to show up in the long procedure of physical combination and useful separation [
18].
This circumstance prompts non-equivalent measurements crosswise over space and after some time. To date, measuring informality remains a test [
17,
19]. Using existing family unit level reviews and censuses to recognize ghetto inhabitants among the urban populace, UN-Habitat proposed an ordinarily utilized definition in light of the family unit level. It comprises of five components: (1) access to enhanced water to family unit individuals without being liable to compelling exertion; (2) access to enhanced sanitation (excreta transfer framework, either as a private latrine or an open can imparted to a sensible number of people); (3) security of residency (proof of documentation to demonstrate secure residency status or accepted or saw assurance from expulsions); (4) durability of housing (changeless and satisfactory structure in non-dangerous area); and (5) adequate living region (not more than two individuals having the same room). UN-Habitat characterizes a territory of a city as a ghetto if any of these elements exist [
20]. Four of the above elements are physical and one of them is lawful (number 3). Other understood informal definitions depend for the most part on legitimate viewpoints [
21].
Creating nations have been actualizing urbanization as a national system to drive financial development, specifically, to seek after adjusted development amongst urban and country areas. Be that as it may, individuals keep moving into urban communities to look for a superior life and monetary open doors. Along these lines, the act of sustainable urbanization assumes an imperative part in accomplishing worldwide sustainability targets. In accordance with the advancement of sustainable urbanization, universal establishments and governments at various levels are looking for the ideal urban sustainability esteem. With the point of comprehension on the condition of, or changes to, urban areas in connection to better urban sustainability execution, sets of indicators, structures and appraisal tools, have been created [
22,
23].
Urban sustainability indicators are vital for aiding on target setting, execution surveys and encouraging correspondence among the policy makers, specialists and open [
24]. An extensive variety of urban sustainability indicators is in this way being used over the differences of various urban areas and districts, which fluctuate as per their specific needs and objectives [
24,
25]. Be that as it may, useful difficulties have prompted blended results in applying sustainability indicators in various situations and now and again with little pick up in sustainability execution [
26,
27,
28]. It has been contended that one of the principle purposes behind neglecting to achieve the wanted execution is the insufficient choice of indicators directing and observing the sustainable urbanization process [
22,
27].
The previous researches have dealt in shallowness with the unplanned settlements issues; they only discussed the positive and negative aspects of its urban characteristics without in-depth study of its repercussions to the future of these areas. No research has treated the unplanned areas in the frame of its regional vision and the results related to it; as all of them have missed the issue of evaluation the urban characteristics on specific sample to determine its potentials to help or support the urban sustainability, which we investigate in this research .In order to maximize the benefits of the previous researches to use its results as an initial stage, despite our notes on it, we have classified the previous views in two main points. One is pessimistic, while, the other is optimistic.
The pessimistic viewpoint believes that the unplanned settlements needed to be eradicated completely [
29,
30], since they act as barrier to the development of the modern sector and impede economic growth. According to UN-Habitat, 1987 [
31], unplanned settlements increase the city’s unemployment, and its inhabitants have insufficient education, training and/or skills, and are inefficient in working. Also added, unplanned settlements are the parasites cells of cities, which have become fertile breeding grounds for organized crimes and source of chaos in the city [
32]. In addition, the background and traditions of their population isolate them within the urban life and make it impossible for them to participate in urban social and economic life, and they could not perceive the opportunities available in the city, and thus, they remain underdeveloped—both socially and economically.
On the other hand, the optimistic viewpoint believes that Inhabitants of the unplanned settlements have firm intentions to improve their life. Desai and Devadas, 1990 [
33]. Believing that, it is possible for unplanned settlements to become better off through the class structure, by full participation in the economic and social life of the formal community. Unplanned settlements, despite their illegal nature, have a special type of “self-organization”. Inhabitants have common interests, and therefore, are organized against the threat of eviction. They have their recognized leaders who influence the community. Unplanned settlements provide a rational solution to the shelter problem in the highly restricted housing market. Not only do they provide shelter for urban disadvantaged, they also constitute base camps for survival and escape from poverty. Unplanned settlements’ energy consumption is comparatively very low [
30,
34]. If recognized and accounted for, they are, thus, able to contribute towards sustainable city development without much demand on city infrastructure.
Since the mid-1990s, neighborhood and national governments around the world have created indicators to quantify the urban sustainability execution as indicated by their nearby or national needs [
35]. Whilst there are different arrangements of urban sustainability indicators there is no single arrangement of indicators that suits similarly to all urban communities or groups. It is in this manner welcomed that the utilization of normal indicators is vital for observing and looking at the procedure of sustainable urbanization all together this does not remain a theoretical idea. Equivalent indicators are imperative since they permit urban communities to have a typical matrix to share and apply fruitful tools and measures [
36].
Indicators have the part of measuring execution, and during the time spent urban sustainability evaluation there is a need of quantifiable indicators. A few ways to deal with evaluation of urban sustainability taking into account indicators have been produced [
37]. Analyzed accessible strategies for assessing diverse parts of sustainability using indicators [
38]. Utilized the methodological establishments of different appraisal strategies to propose a characterization, which partitioned them into three unique gatherings: framework building, money related assessment and biophysical. Numerous looks into are endeavoring to archive the degree to which urban areas are or are not getting to be sustainable using indicators, and to uncover the useful difficulties that are being experienced all the while [
22,
39,
40,
41,
42]. Be that as it may, the determination procedure of indicators ought not to be about social affair the data for all indicators, yet rather specifically dissecting the ones which are more essential generally and more inclined to create the most exact data about the status of practice. Mega, 1998 [
43] opined that indicators must be clear, basic, deductively stable, certain and reproducible. As per the United Nations Statistical Institute for Asia and Pacific (2007) [
44] a marker must be SMART (i.e., Particular, Measurable, Achievable, Relevant, and Time-related). Zhang, He, and Wen, 2003 [
45] suggested that urban sustainability indicators ought to give at any rate the accompanying: (1) logical tools to interpret the ideas of sustainable development into down to earth terms; (2) pilot tools to help with settling on policy decisions that advance sustainable development and (3) execution appraisal tools to choose how powerful endeavors have been.
According to UN-Habitat, 1987 [
31], they have their own market mechanisms which help inhabitants identify and obtain building materials suitable to their needs. The unplanned sector is an integral part of the urban economy and a positive contributor to economic growth. It is not a separate parasitic enclave to the city .The unplanned economic sector provides goods and services for a large section of urban disadvantaged at very competitive costs. In GCMR, a considerable part of services such as garbage collection and cheap labor are provided by the unplanned sector. Although unplanned settlements consist of inhabitants from every part of the country, they have a high social cohesion that signifies their Inhabitants behaviour as a one family-place. Therefore, Inhabitants can behave and become accepted as ‘normal citizens’ if their participation in decision-making affecting them is recognized [
31,
46].
According to the General Organization of physical Planning, 2010 [
6], Egypt as a partner in UN agreements should meet the sustainability criteria in all of its future plans; in this respect, the future vision of Cairo 2027 has been prepared under the sustainability criteria. The unplanned settlements, which represent 65% of GCMR, should meet the sustainability needs in its plans for urban development.
In this study, we characterized urban sustainability in the Egyptian context as the desirable state of urban conditions that achieve the best possible utilization of urban assets (land-use, services, open spaces and roads networks, infrastructure) to ensure a generational value, assurance of the regular habitat, negligible utilization of non-renewable assets, monetary essentialness and assorted qualities, group confidence, singular prosperity, and fulfillment of fundamental human needs. Additionally, it ought to accomplish the all-around adjusted relationship between the social justice, monetary and ecological demands, in order to achieve the urban development as a dynamic procedure that joins natural, social, financial and political institutional sustainability which unites urban and countryside areas, enveloping the full scope of local human settlements, with connections at the national and worldwide levels.
The aim of this study is to examine and compare two different urbanization practices in the process of evaluating urban sustainability using indicators in the Egyptian context. In line with the study aim, several objectives are planned in this research work: (1) to determine two study samples, the first represents the unplanned settlements and the other represents the comparative district which meets the urban sustainability criteria, to be as a standard unit for the evaluated urban characteristics; (2) To develop a list of urban sustainability indicators; and (3) to examine the variations of the two applied urbanization practices with the primary list proposed in objective 2; and (4) to identify the help and block characteristics of urban sustainability in our study samples.
3. Methodology
In the frame of GCMR, seeking to meet the sustainability needs in the urban vision of 2027, this study aims to identify which urban characteristics of unplanned settlements support and which others hinder the SD, according to the Egyptian context. Focusing on the unplanned settlements on agricultural lands, which represent 46.1% of total GCMR residential area [
5,
47], this study depends on the following procedures to achieve the required purpose. By investigating the previous research on the unplanned settlements on agriculture lands and SD in GCMR, which includes the reports of foreign development agencies, the governmental projects and the academic theses, we have identified the following: definition of sustainable urban development in the Egyptian context, initial evaluation criteria for SD, and identifying the urban characteristics of these types of unplanned settlements.
To carry out this research, the authors have adopted two main methods. Firstly, the literature review of publications and official documents is performed to understand the phenomenon of informal settlements and investigate the different academic stances and governments’ responses to evaluate urban sustainability challenge of informal urbanization. Secondly, semi-structured interviews with urban experts, who have considerable experience in informal settlements characteristics and the shaping of related policies in Egypt, have been conducted. Interviews were carried out separately and were conducted as guided conversations. Additionally, the author draws upon her own theoretical and practical experience in the field of informal settlements development since 2009.
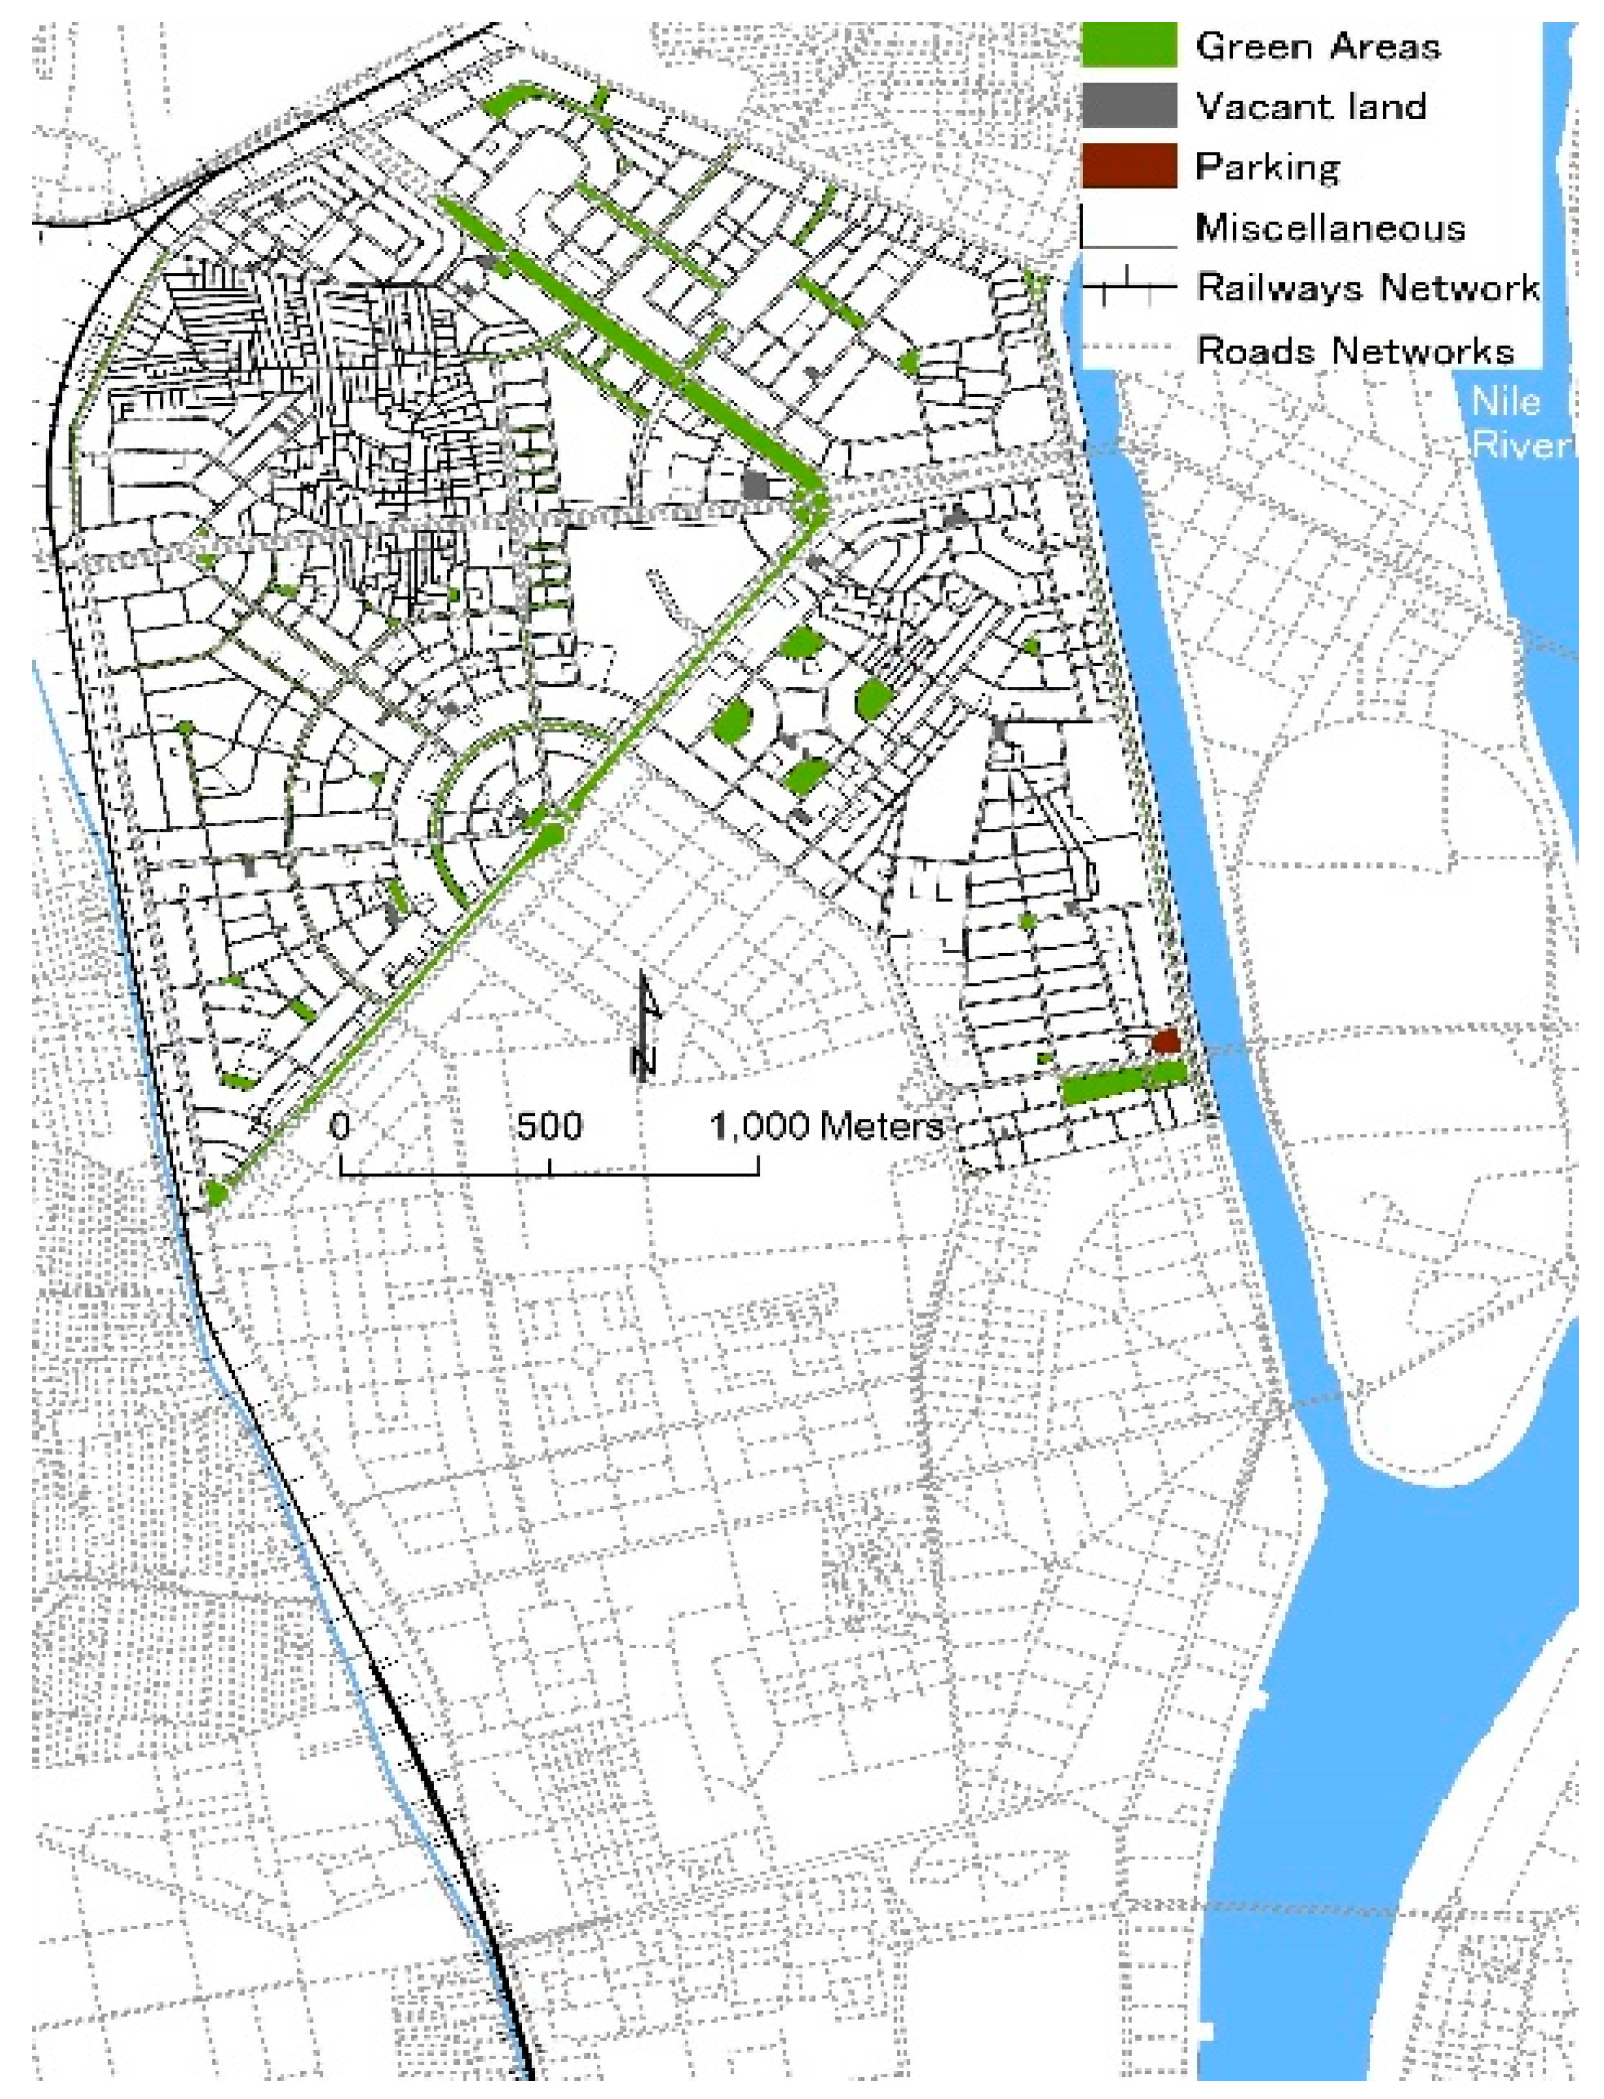
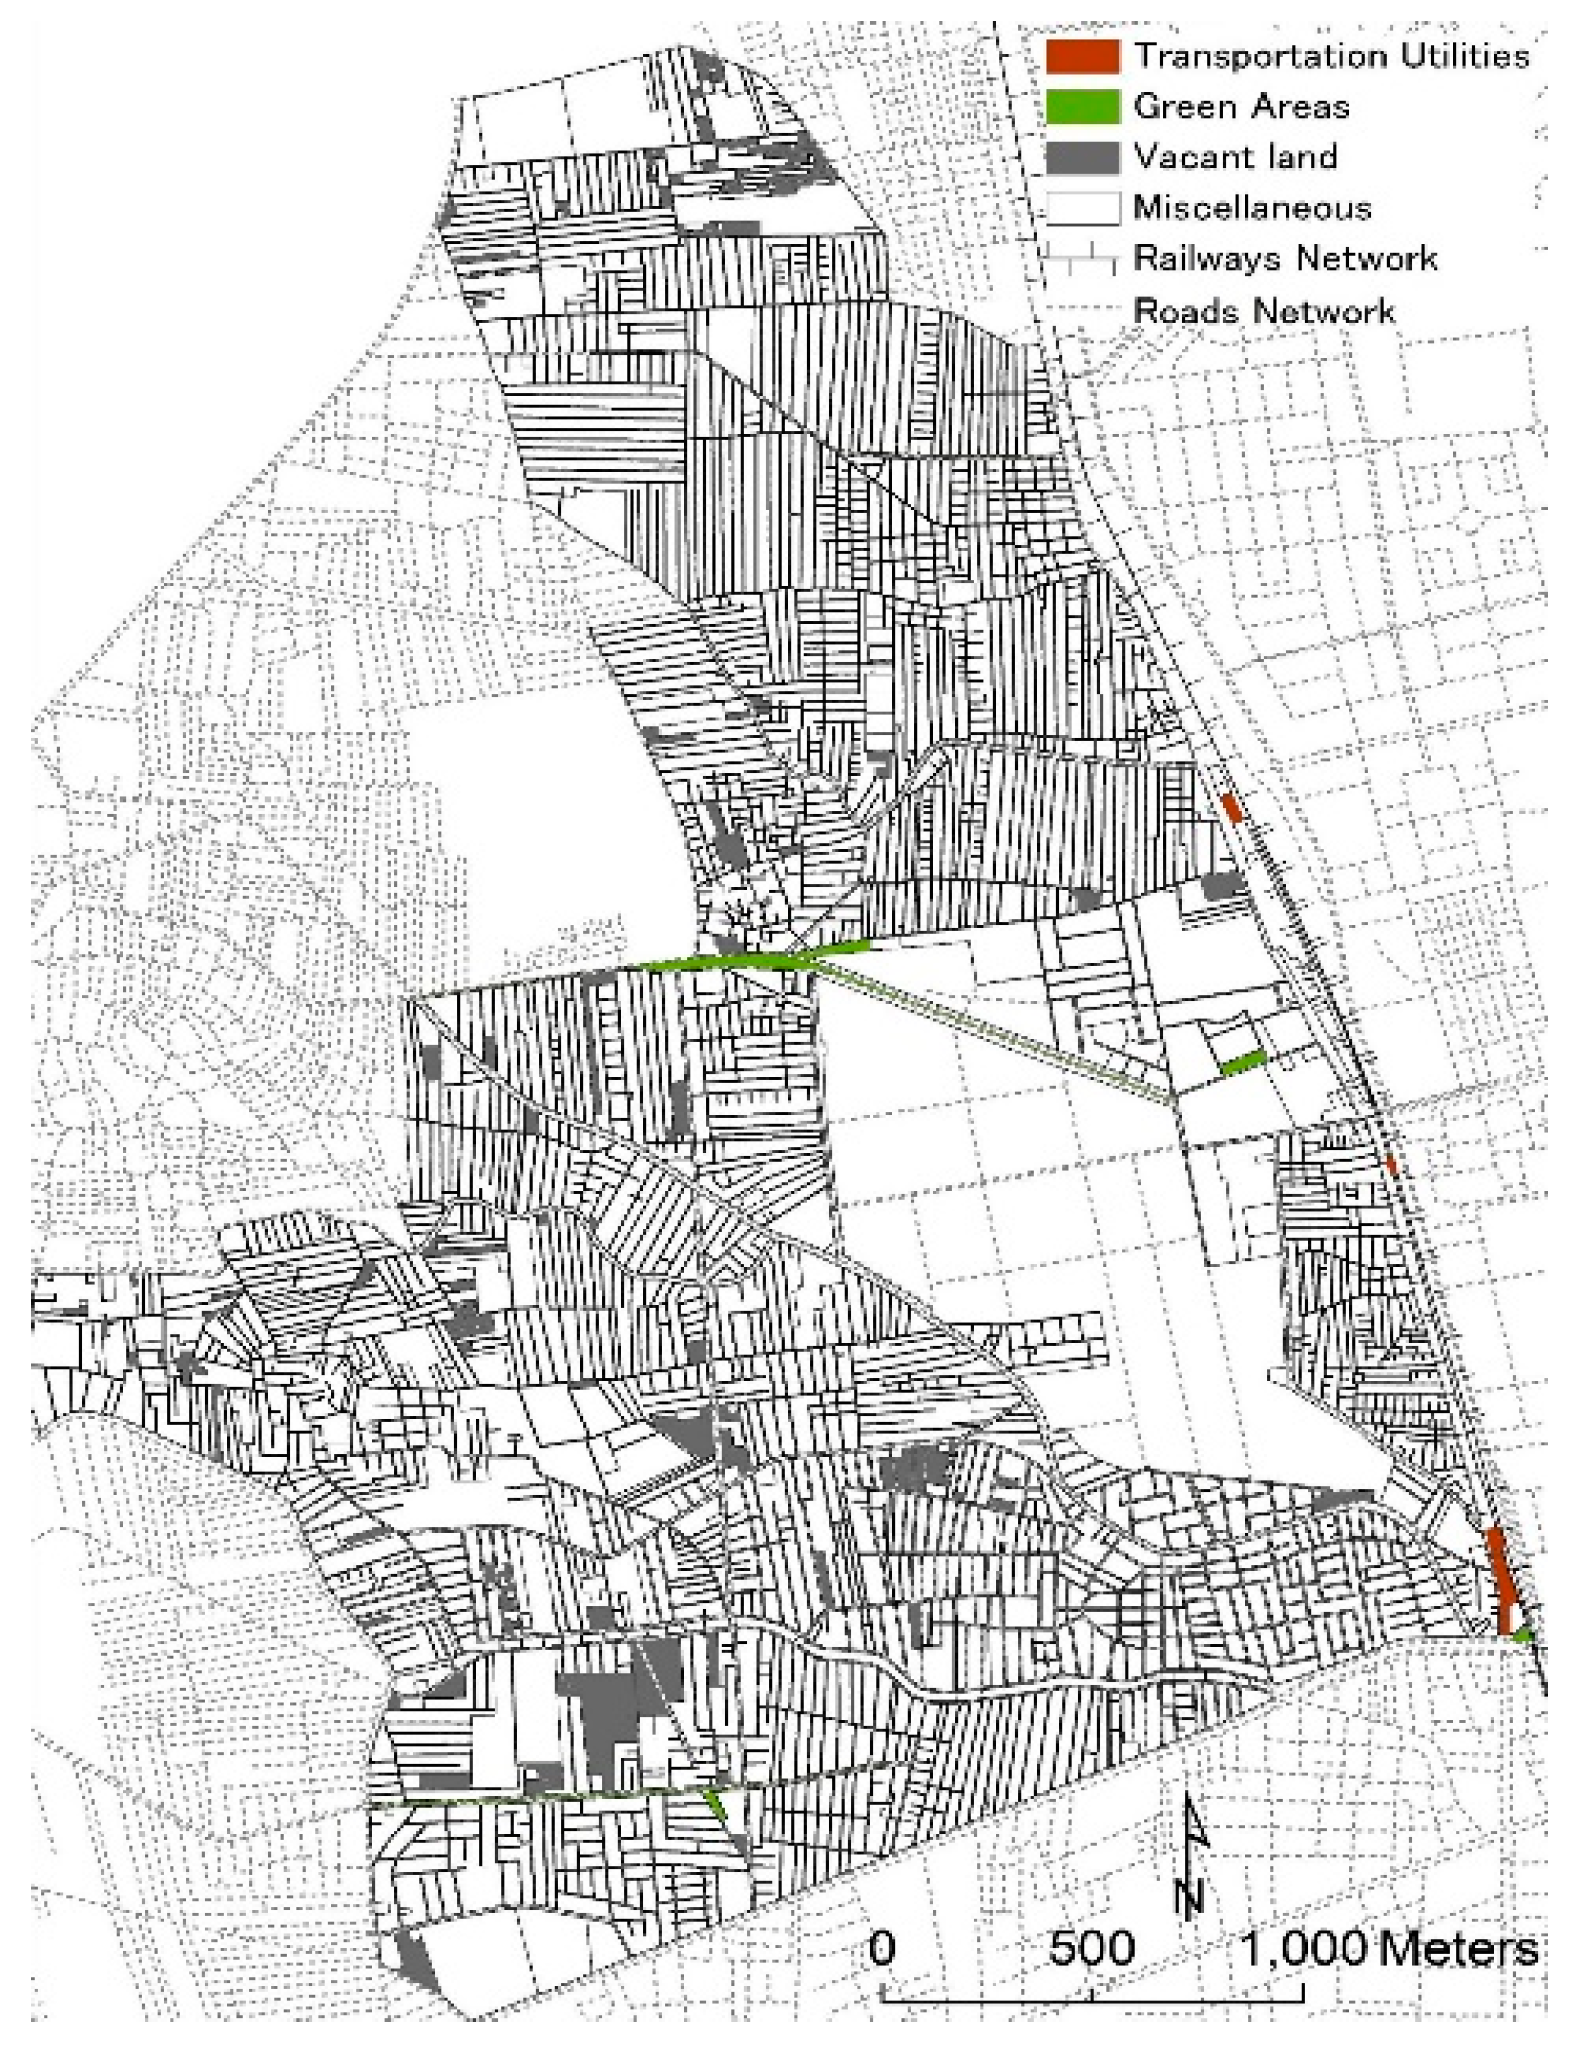
In the frame of our previous literature review, we had a discussion through official interview in GOPP on 5th September 2012, with the development team of unplanned settlements in charge, which included five engineers in addition to the head of team. Through our interview by a face to face discussion, we have identified the following: the study sample district Boulaq Al Dakrour, which meets the most of urban characteristics of unplanned settlements and has an official database from the national census and the main urban characteristics in this district that should be included in the sustainability evaluation. In addition, we have determined the final urban sustainability evaluation criteria as a final version of the previous initial criteria in the literature review based on the accurate determination of the study sample. GOPP has provided us with the official GIS database for the study sample and its surrounding areas, which includes the land-use, services, open spaces and roads networks, and infrastructure.
A total of 31 indicators characterizing land-use, services, street network, land use, infrastructure, and public open spaces were evaluated for impact assessment using a simple matrix approach. Evaluation methods applied to indicator diagnostics are shown in
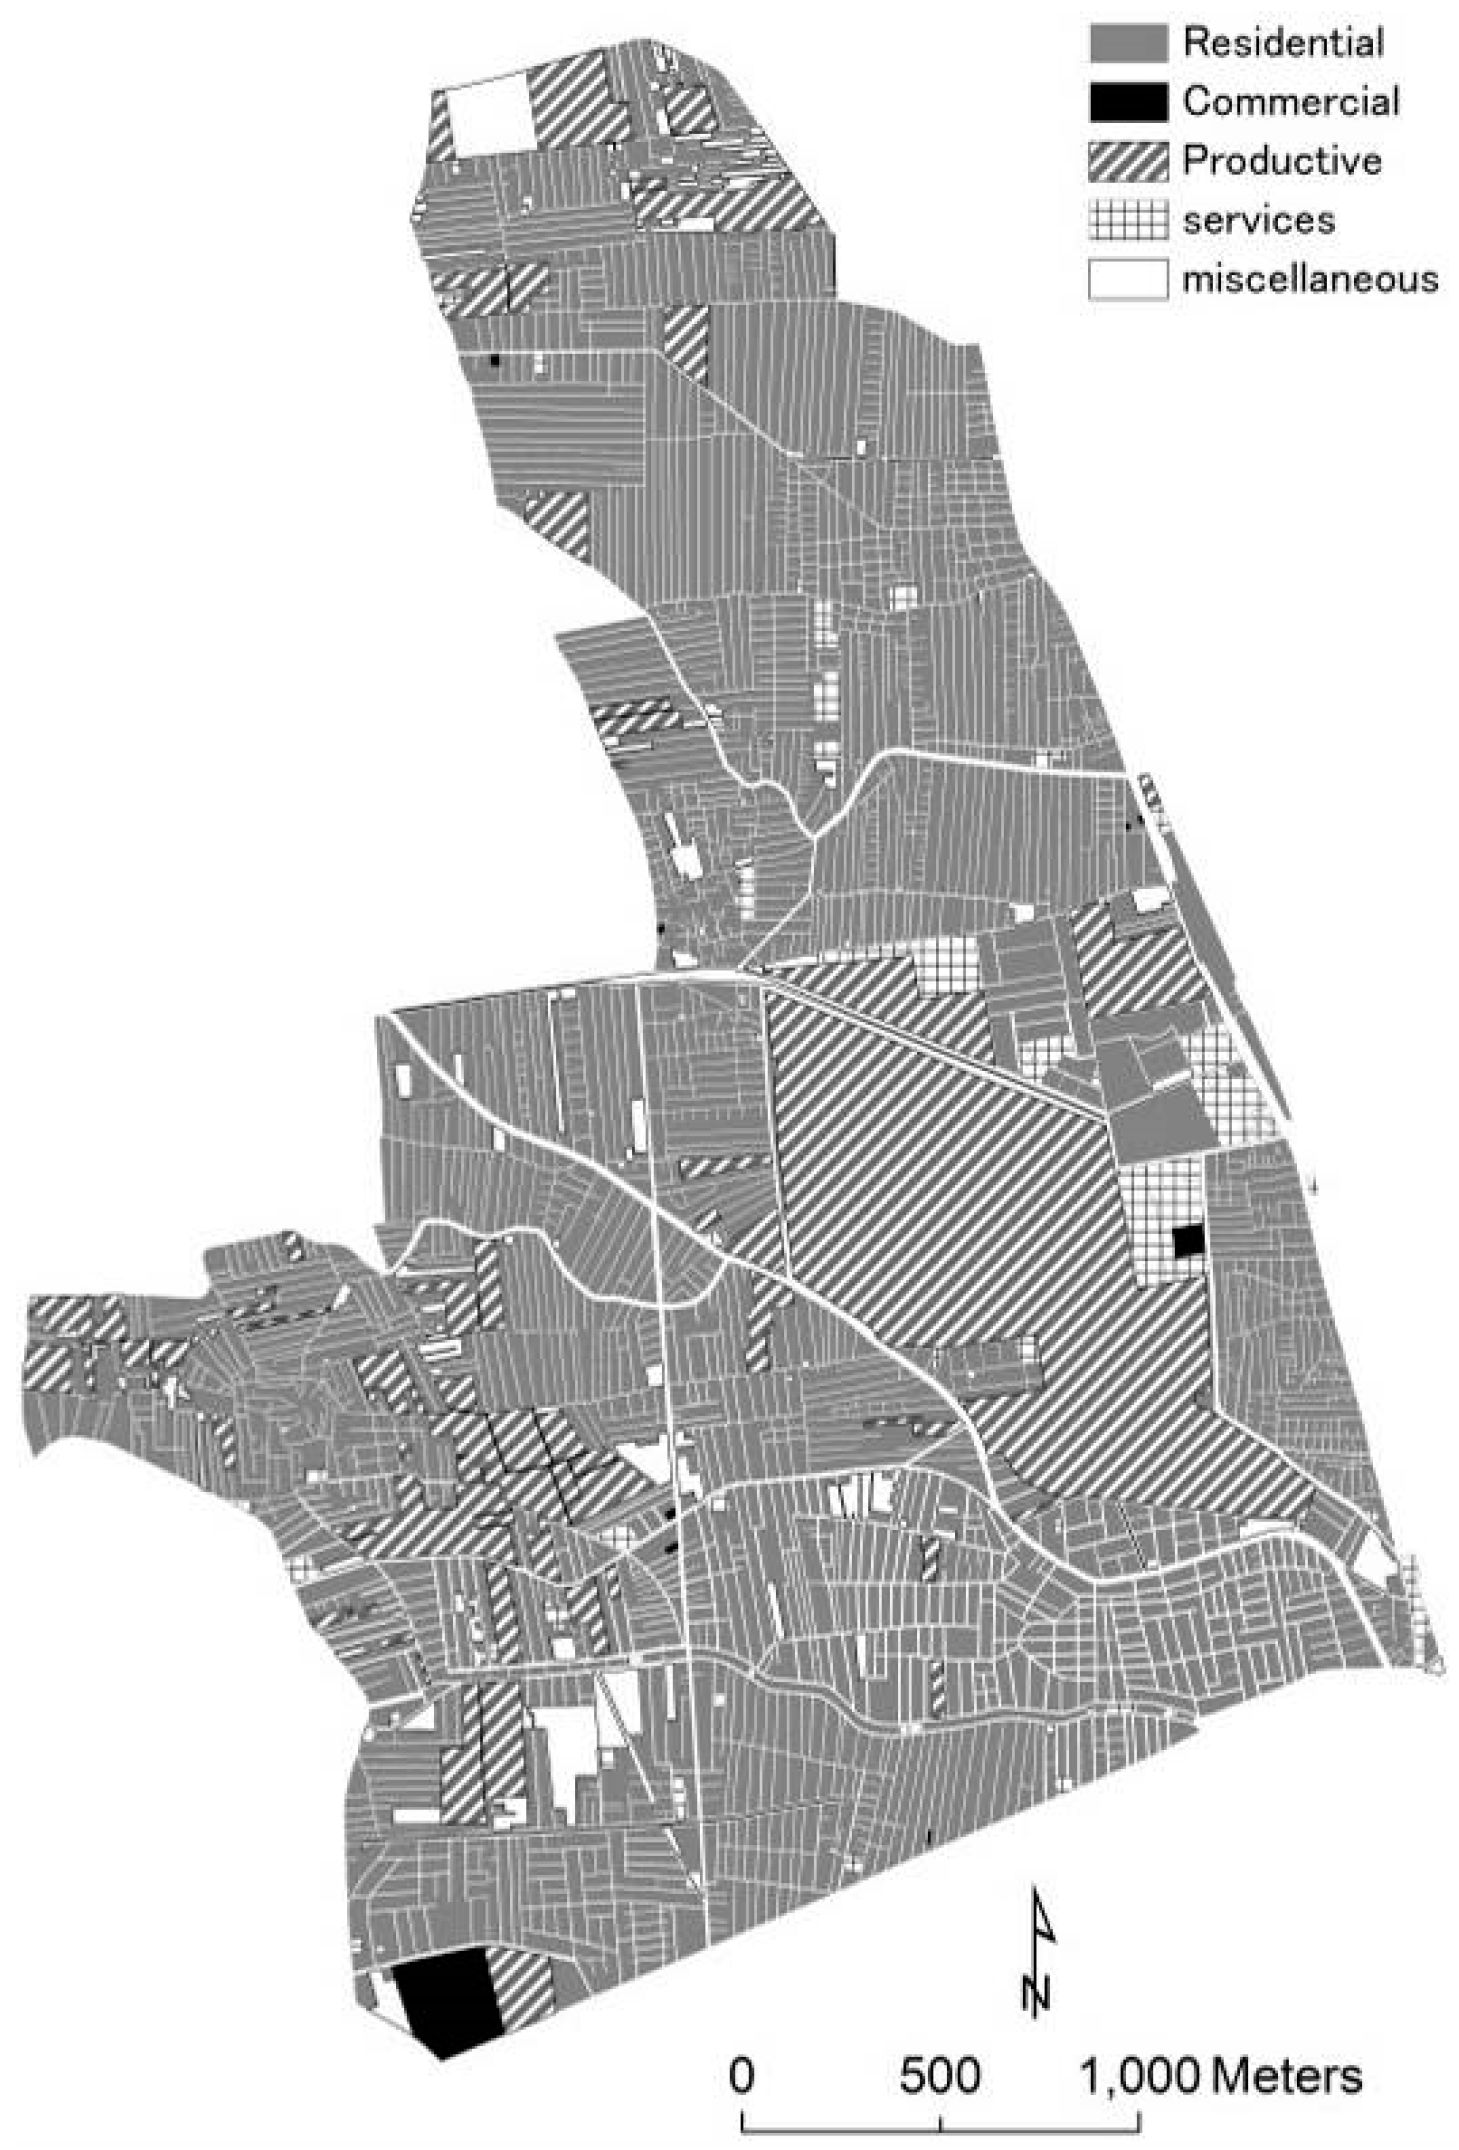
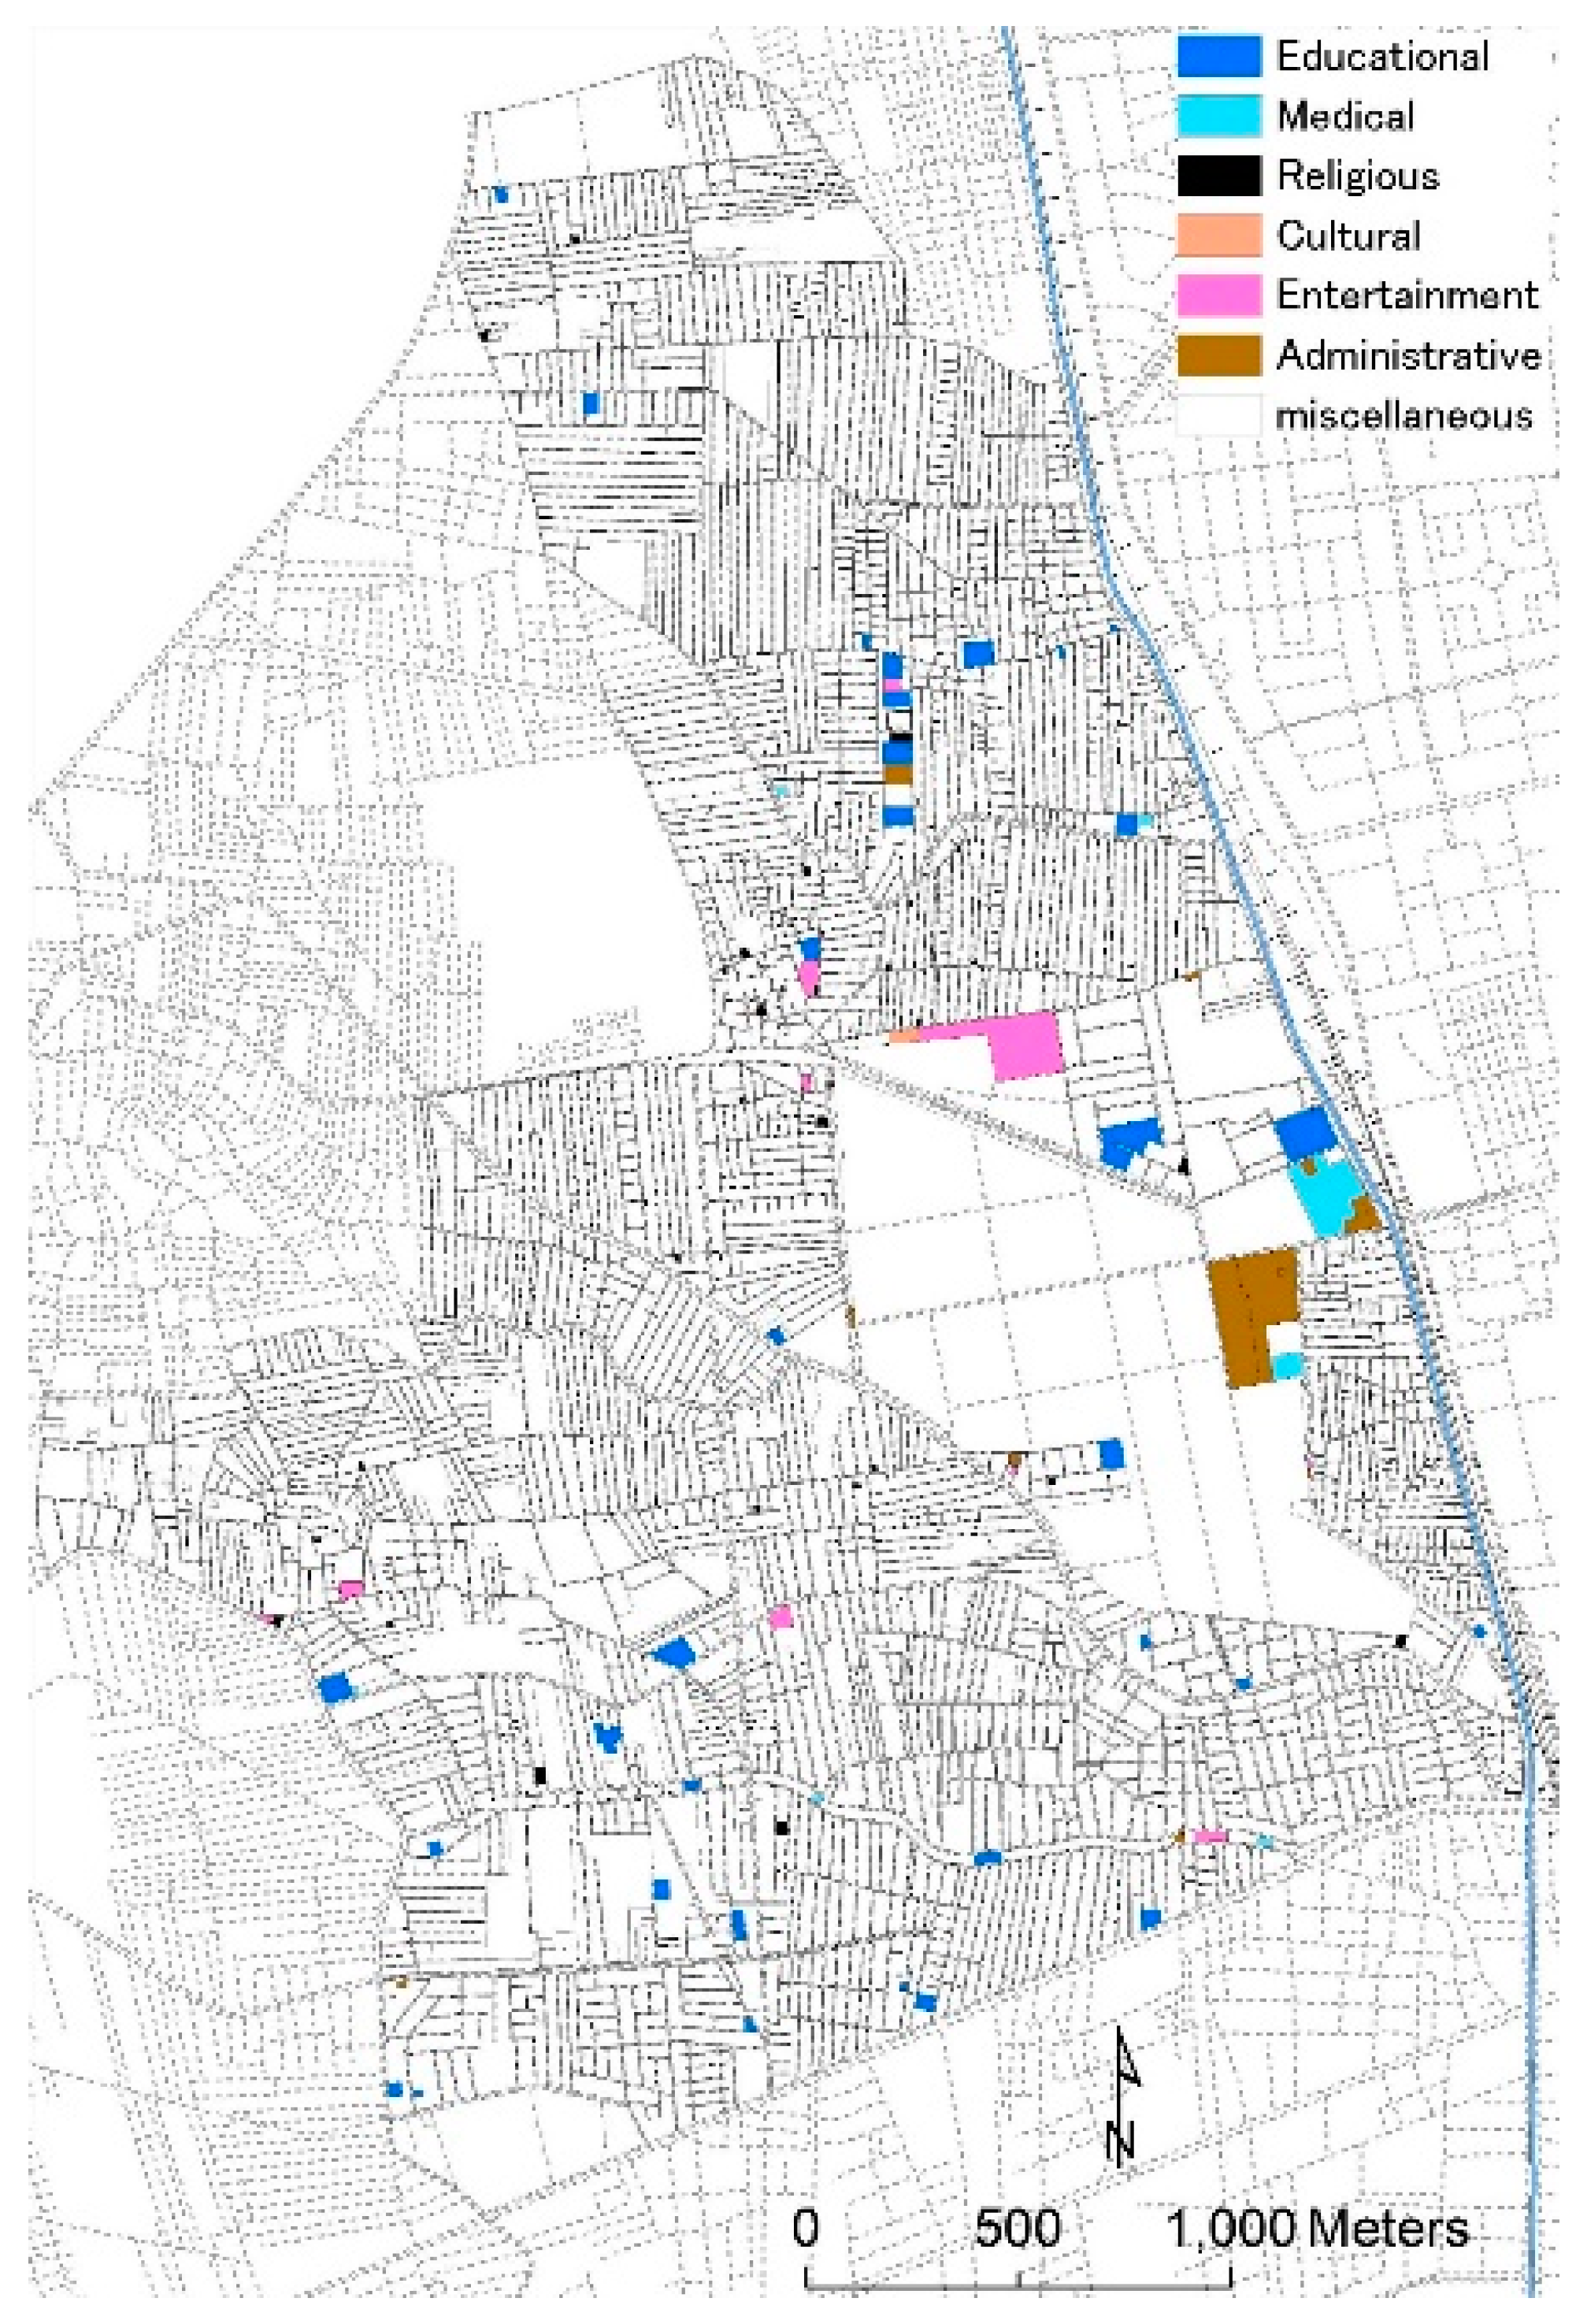
Table 1 and included field surveys with structured interviews, quantification based on sampling and qualitative observations, as well as air photo interpretation, GIS analysis and analysis of official statistics. By a quick check for the GIS database, we found that it was built in 2010 and needs to be updated because of the quick land use change is the main characteristic of these unplanned areas. We performed a field survey with four assistants during three days, which included all of the land-use in the study sample. We have found 139 updates in land uses as follows: 97 vacant lands were converted to residential buildings, 29 agricultural plots were converted to residential buildings, 13 of various uses, and we have not found any change in the infrastructure characteristics. Through the field survey, we have taken photographs for the main urban characteristics of the study areas to be as an extra evidence to support our evaluation for the urban characteristics in the next procedures.
During the stage of evaluation, we have used the comparison method supported by the GIS analysis as tool to evaluate the urban characteristics of the unplanned district “Boulaq” based on the outputs of the interviews with the local experts. We have identified the following criteria to choose the standard district which will work as a sustainability measure to be as a comparative planned sample to evaluate urban sustainability as shown at
Table 1:
Meets the sustainability urban criteria for the characteristics of land use, services, open spaces and roads networks, and infrastructure;
Located in the general location of the unplanned district;
has official data from the national census;
Has been established in the same period of the unplanned district;
We have identified Agouza district as a standard for evaluation, according to the previous criteria.
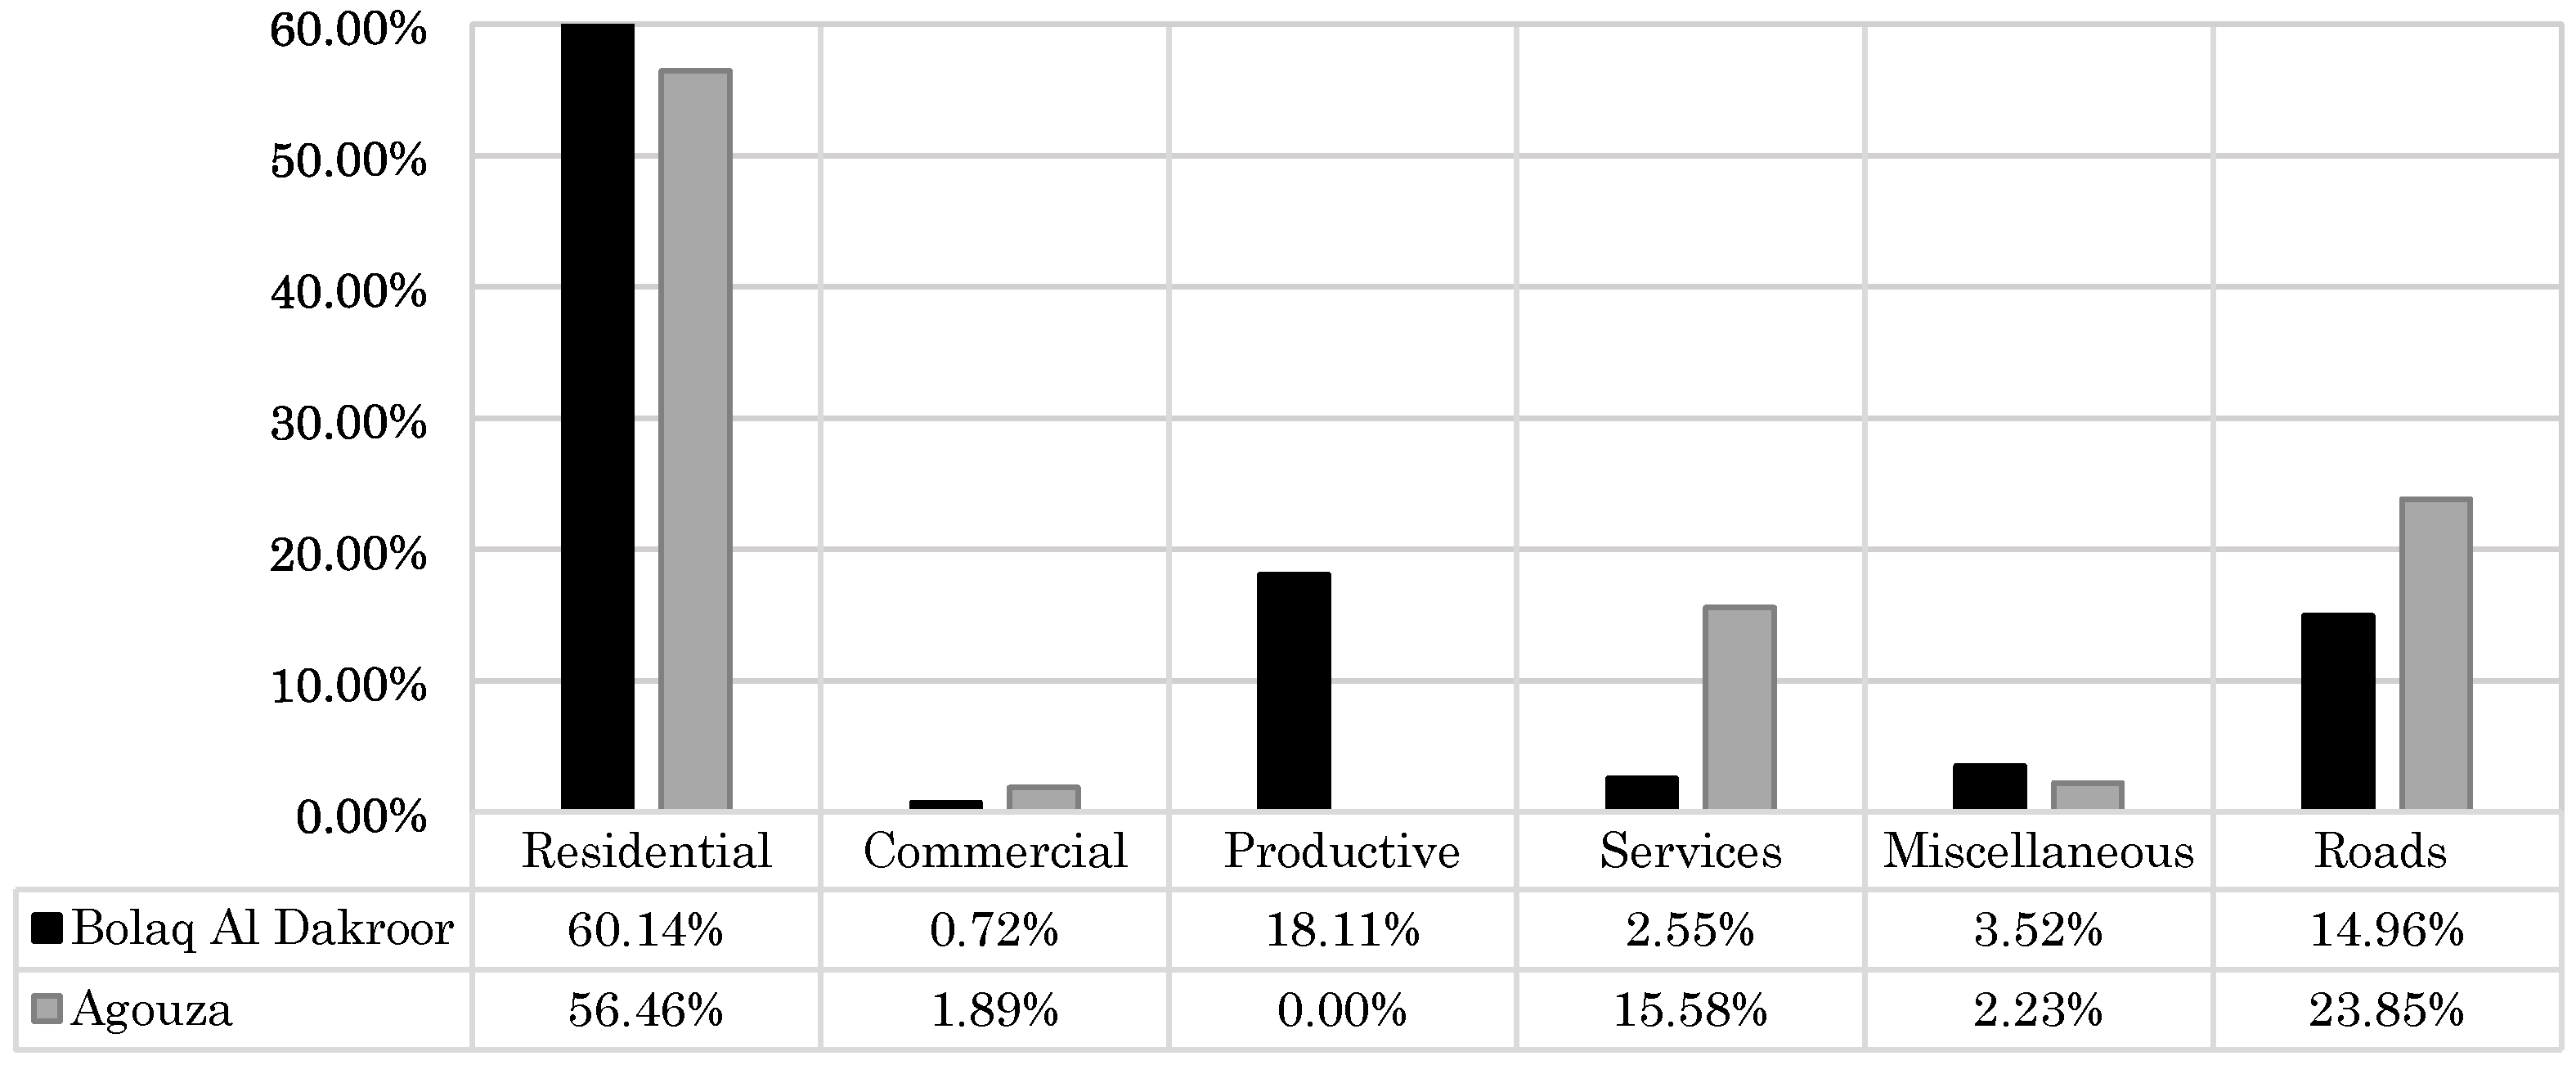
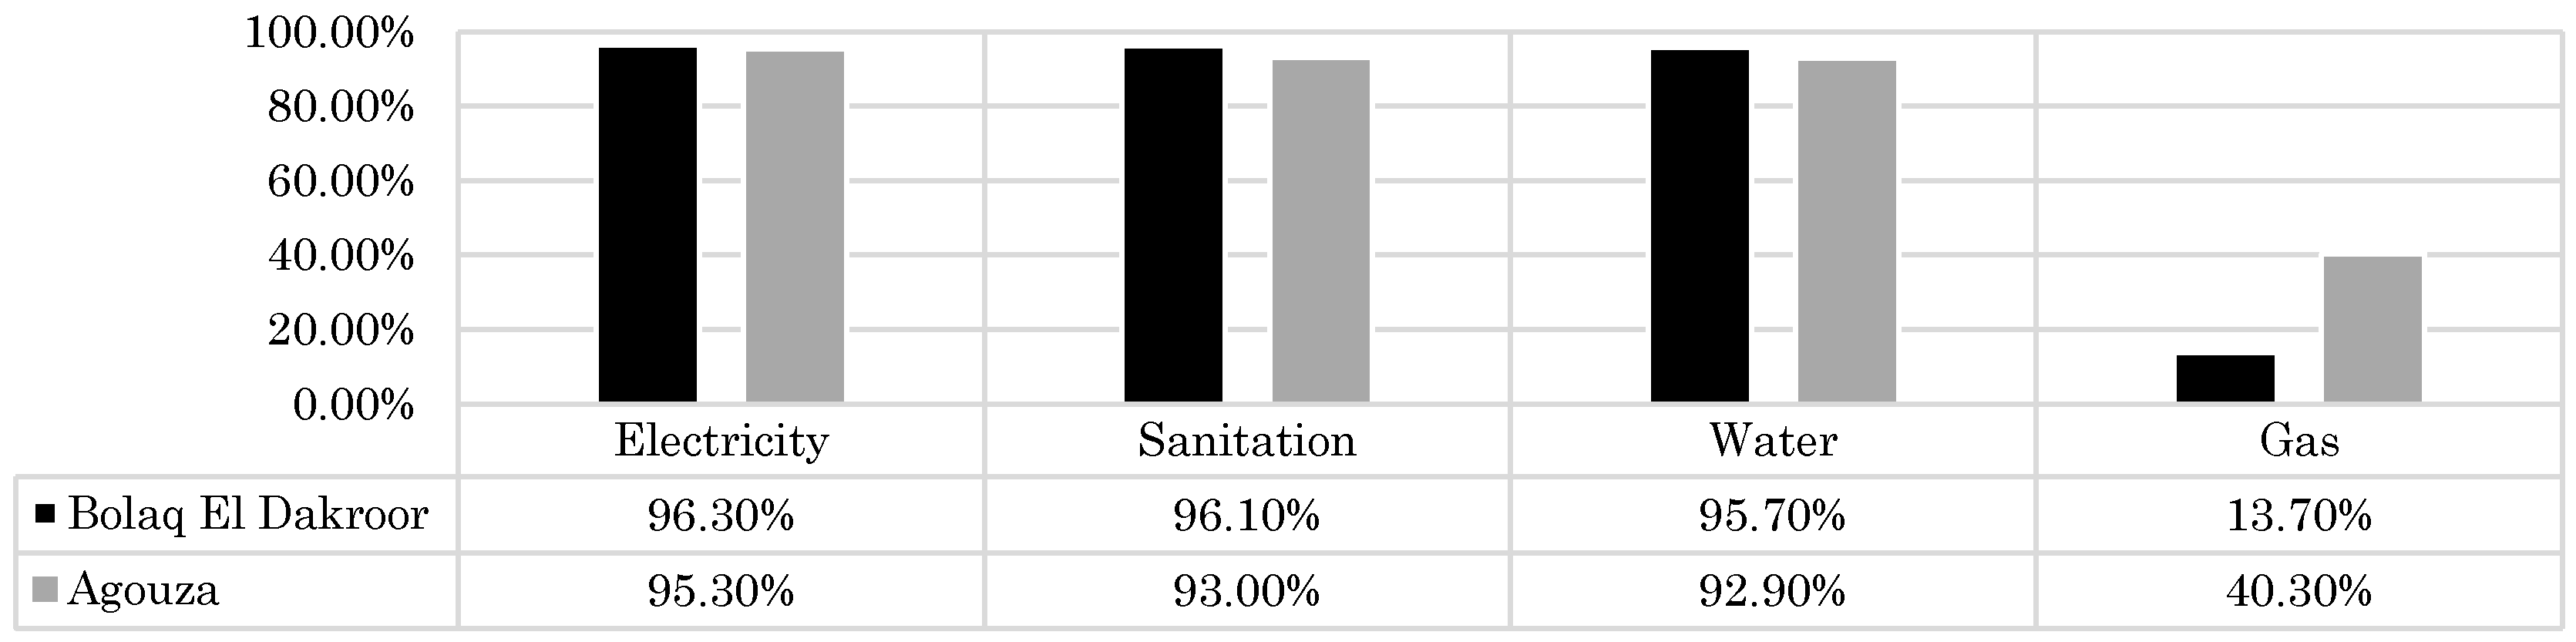
By using Arc GIS 10 as an analyst tool, we could determine the required data for the comparison in both districts according to our updated official database. We have identified which of the urban characteristics of land-use, services, open spaces and roads networks, and infrastructure enhance and which others handicap the urban sustainability in the study area of Boulaq, we have considered each of urban characteristics help SD, if 50% of its evaluation criteria meet the sustainability needs, according to the standard comparative district Agouza.
5. Discussion
An exploratory examination to relate multi-dimensional measures of effects on urban qualities with geotechnical, socio-social, and financial attributes of informal occupations and their tenants may surpass the scientific limit of urban planners, especially in minimal concentrated on urban areas. Accordingly, connected appointment strategy constitutes a target and reproducible structure to enhance the comprehension of, and to measure the mindboggling relations between, urban attributes of unplanned settlements and its determinants. Since direct angle investigation can be connected in prescient displaying, later on, for the spatial demonstrating of effects on natural parts. Hence, that proposed factual and spatial investigation approaches offer urban planners extra tools for enhanced perception, recognizable proof and evaluation of these associations, giving appropriations in their endeavors to accomplish urban sustainability in urban areas.
It is valued that the utilization of indicators for surveying urban sustainability execution is an imperative tool and has been generally embraced. Whilst different indicators have been connected in various ways, the point sought after is the same, for accomplishing urban sustainability. Because of the contrasts between individual practices, the determination of indicators ought to be finished with the unmistakable comprehension of the requirements where these will be connected. A short rundown of indicators toward the start of use is suggested, and amid later corrections more indicators can be added or disposed of as per the rising needs and picked up involvement in individual cases. The reconciliation of fleeting and long haul sustainable urban development arrangements ought to be empowered and their congruity ought to be guaranteed. Association of various areas in the meaning of goals and techniques may speak to an essential stride for getting the acknowledgment and backing while adding endeavors to fulfill them.
Notwithstanding, the nonattendance of critical quantitative assessments for urban sustainability in informal areas, there is general assertion that informality is somewhat lower and sustainability turned out to be more achievable in a few spots of creating nations, for example, of Latin American urban areas. This contended achievement has been credited to the neoliberal strategies of housing arrangement connected lately, which substantively decreased the housing deficiency in these nations [
53,
54]. In any case, the relative accomplishment of the Chilean case for instance is confusing. The housing policy was created with the target of delivering housing through the general population business sector to improve the urban qualities of the informal areas toward more sustainable urban conditions [
53]. Be that as it may, what has been seen amid the most recent years is the inverse: a procedure of formalization of the formal, where keeping in mind the end goal to adapt to unsatisfied abiding needs, formal housing gets to be informal by: (1) including problematic rooms (material informality); or (2) utilizing people in general space (material and lawful informality) in light of absence of adequate plot range [
55] which lead eventually to undermine the sustainable urbanization shots. With everything taken into account, informality keeps on becoming tirelessly. This circumstance uncovers the deficiency of social housing arrangements in the nation [
56].
In our study,
Figure 13 can comprehend the measurements that are under a stricter checking, which speak to higher significance to evaluate the fruitful implementation of strategies in line to the accomplishment of the targets towards a superior urban sustainability execution. It is consequently demonstrated that need is given to ecological and social measurements for more satisfactory administrations and opens spaces giving by all practices. It confirms that endeavors made by worldwide establishments like United Nations and the World Bank, advancing sustainable development, have unmistakably affected the nearby governments and especially in tending to more endeavors to authorize arrangements and approaches to guarantee a superior ecological execution and to enhance the prosperity of their tenants.
In addition,
Table 1 shows the general consistence of the rundown of indicators incorporated into each of the assessed urban qualities and it can be seen that unplanned areas ones that go along the most. However the powerful utilization of indicators is not identified with the quantity of these included for observing the practice yet their legitimate determination to deliver the most exact data about the status of the practice [
41,
57]. On account of unplanned settlement, as stated previously, the nearby specialists for the most part chose the indicators. Their absence of aptitude may have affected the consideration of indicators without enough establishments demonstrating the significance of the incorporation or connecting them with particular targets or arrangements. The arranged settlement practice is a great deal distinctive, this is a territory was manufactured in view of a past arrangement and the administration needs to guarantee that it is worked sufficiently under observing that can precisely impart a powerful sustainable urbanization hone.
For both study areas, it seems, by all accounts, to be progressively an announcement of fancied headings and this may change over their indicators more conceptual. It might be worth obviously distinguishing the key issues expected as opposed to simply giving a brief and exceptionally broad exchange of rising difficulties. These difficulties can be identified with arrangement's objectives and pathways. Additionally, a few indicators do not have targets, making it seem like if these indicators are viewed as irrelevant. The study set of indicators were created for an anticipated urban development where the fascination of venture is imperative yet runs have been resolved with a specific end goal to build up this zone under the standards of sustainable development. Accordingly, these indicators work more as rules as there is insufficient accessible data right now so as to evaluate the sustainability execution. The constraints in the unplanned settlement case especially are clear. This is an examination work, which meant to quantify unplanned settlements’ urban sustainability. In any case, the rundown of indicators is broad and these are not approved by the legislature nor the subjects. No positive target values for every marker had been characterized yet. By the by, the indicators proposed in this methodology may speak to significant reference for comparable contextual analyses in Asia and Latin America powers to set up its pointer framework to upgrade urban sustainability.


 ,
, 


