Article

The impact of Built Environment Characteristics on Metropolitans Energy Consumption: An Example of Greater Cairo Metropolitan Region

by
Taher Osman
1,2,*,
Prasanna Divigalpitiya
3 and
Mustafa M. Osman
4
1
Department of Architecture and Urban Design, Kyushu University, Fukuoka 812-0061, Japan
2
Faculty of urban and Regional Planning, Cairo University, Giza 12411, Egypt
3
Faculty of Human-Environment Studies, Kyushu University, Fukuoka 812-8581, Japan
4
Development institute of Tourism Studies, Al-fayoum university, Fayoum 63111, Egypt
*
Author to whom correspondence should be addressed.
Buildings 2016, 6(2), 12; https://doi.org/10.3390/buildings6020012
Submission received: 6 January 2016 / Revised: 2 March 2016 / Accepted: 16 March 2016 / Published: 24 March 2016
(This article belongs to the Special Issue Environmental Impact of Buildings—Linking Impacts and Tools)

Abstract

:
This paper examined the influences of the built environment and socio-economic driving factors on domestic gasoline consumption in developing metropolitan regions through a case study of the greater Cairo metropolitan region (GCMR), Egypt. Structural equation modeling (SEM) was used in analyzing the causality of the domestic gasoline consumption. The influences of major factors hypothetically affecting the domestic energy consumption such as resident characteristics and built environment characteristics were examined. The results proved a high positive influence of the resident’s income and the number of adults as driving factors, directly and indirectly, affecting energy consumption levels. Population density and attitude towards eco-friendly driving factors proved to be a very low influence on energy consumption. The built environment driving factors such as access time to public transportation and related building characteristics factors proved to have a low impact on energy consumption. The study findings suggest that the design of a built environment should be well related to the socioeconomic factors to manage the domestic energy consumption in developing regions.

1. Introduction

Over 50% of the world’s population are now living in metropolitan regions where over 70% of the energy is consumed [1,2]. The enormous urban population with serious energy demand in metropolitan areas leads to regional-scale environmental issues such as water pollution, air pollution, and flooding while it also causes the global-scale environmental issues such as climate change. These environmental problems have been causing more concerns in urban areas, especially in the developing the world since more than 90% of the future urban population growth is predicted to take place in developing metropolises [1,3].
Several studies were conducted to identify the driving factors of energy consumption in developed and developing metropolitan regions. The researchers have identified a significant basis for urban design and planning, particularly in European and American cities, where a compact urban design is usually supported as a sustainable urban form. Moreover, despite its enormous possible influences, empirical proofs from developing regions were quite limited. The empirical results from the developed regions may not be appropriate for being effective in the developing regions. For example, the compact design of metropolitan regions creates an urban heat island effect, which may lead to a rise in energy consumption for air conditioning in developing countries [4]. Under a compact urban form, where there are more opportunities for commuters to use different transportation modes, the percentage of commuters using automobiles is likely to fall, which ultimately reduces energy consumption [5].
For developed countries’ research findings, some clues have been identified to support the sustainable consumption pattern in urban areas. Built environment attributes have been seen as one of the critical drivers of energy consumption; 70% of the energy consumption is associated with the location and urban design driving factors [6]. The built environment is addressed because it could be potentially achieved through urban planning. Shim et al., 2006 [7], found that high-density-population cities are more efficient in energy consumption than low-density ones. This is because the energy consumption of small-population cities is more affected by variables other than population. However, as population size gradually increases, energy consumption tends to be affected more by population. Similar tendencies are found in the relationship between population and gasoline consumption, which implicates urban crowdedness. This means that urban density is a better explaining driving factor of energy consumption. That is to say that a high-density policy is appropriate for achieving a significant decrease in transportation energy consumption for metropolitan regions. Moreover, if we raise the urban density and make new centers accommodate the population growth, we can reduce energy consumption because the average density of multinuclear cities is over twice that of mononuclear cities.
Most of the existing studies in developed countries’ case studies that examined the relationship between the built environment and energy consumption have focused on the transportation-related energy consumption rather than the energy consumption of dwellings. The transportation energy consumption studies have examined the influences of the built environment such as density, diversity, distance to city center, and distance to transit on travel behavior. Ewing and Cervero, 2001 [8], identified that the travel distance of residents living in a high-population-density area would be shorter than that of those living in a low-population-density area. Krizek, 2003 [9], identified that a person living in a neighborhood with higher accessibility travels less distance which leads to less energy use. Liu and Shen, 2011 [10], used structural equation modeling (SEM) to examine relations among the built environment, vehicle tenure, and sociodemographic and travel behavior in the case of Baltimore. They found that density did not have a direct influence on travel behavior but it had an indirect influence on vehicle tenure. Few researchers are interested in the gasoline consumption of dwellings, such as [11] who found that urban density and the size and type of residence units significantly affect energy consumption.
According to an empirical study of 45 metropolitan cities in the US, Stone, 2008 [12], recognized that cities with low urban and population densities had high energy consumption. Schweitzer and Zhou, 2010 [13], examined 80 metropolitan areas in the US and identified that compact growth areas had low energy consumption. Many empirical studies in developed case studies have already found that patterns of urban development also have a significant impact on energy consumption [14,15,16]. Cervero, 1988 [17], stated that the location of retail facilities had a positive relationship with the usage of environmentally friendly travel modes, which decreased energy consumption. Ewing et al., 1994 [18], identified that mixed-use areas of recreation, commerce, and educational services significantly decreased energy consumption. Frank and Pivo, 1994 [19], identified that mixed land use could significantly reduce the usage of single vehicles and raise the transit and walk trips for work and shopping activities, which ultimately reduces energy consumption. While most researchers found that compact land-use areas decrease travel demand at the regional level, they did not decrease it at the neighborhood level. Other researchers [19,20,21,22,23,24,25] propose that mixed land-use development and pedestrian-friendly urban design aid in decreasing energy consumption. On the other hand, there are researchers [26,27,28,29] who identified no important association between mixed land-use developments and travel patterns.
By using a statistical model about housing use density, vehicle usage, and fuel consumption, Brownstone, and Golob, 2009 [30], identified that the higher-density neighborhoods had lower fuel consumption. Stone et al., 2007 [31], supposed that a neighborhood with 10% higher density has 3.5% lower traffic volume than others, which helps to decrease energy consumption. Bartholomew, 2007 [32], identified a median decrease of 2.32% in vehicle miles traveled (VMT). With a median density increase of 11% from the analysis of 80 scenario-planning schemes in the US. Frank et al., 2000 [33], examined the relationship between land-use type, model choice, and energy consumption in Washington. They used the panel data of residents’ travel in the Puget Sound region. They calculated energy consumption from vehicle travel behavior and land-use data including work commute distance, population density, employment density, and census block density. They found that density had a negative relationship with energy consumption; however, the distance to work was positively associated with energy consumption. Marquez and Smith, 1999 [34], recommended incorporated models of land use and transportation factors to identify the driving factors of domestic energy consumption in developing countries.
For developing countries’ case studies, one of the serious questions about the environmental problems in metropolitan areas was how sustainable energy consumption patterns could be accomplished. To respond to this question, some urban studies assumed that the design of the built environment has important relations with the domestic energy consumption of both urban uses and transportation [11]. Brownstone and Golob, 2009 [30], showed that high density in the neighborhood area would reduce fuel consumption because of the decrease in travel distance and the tenure of vehicles. Yamamoto, 2009 [35], clarified that high urban density leads to less tenure of cars in Kuala Lumpur. He identified that numerous built environment parameters had important influences on vehicle tenure and use. Ho and Yamamoto, 2011 [36], examined the vehicle tenure in Ho Chi Minh City, Vietnam, by using attitudes and preferences to control for self-selection effects. The location of the dwellings relative to central business district (CBD) was identified to exert significant effects on travel behavior. Lin and Yamamoto, 2009 [35], examined the influence of the built environment on trip generation in Taipei, Taiwan. They identified that density is positively associated with the trip generation and negatively related to car and motorcycle tenure. While mixed land use decreased trip generation, it raised motorized vehicle use. Wang et al., 2011 [23], examined the travel behavior and activities of both males and females in Beijing, with car tenure as a parameter. Pan et al., 2009 [37], examined the travel behavior of four neighborhoods in Shanghai, China. They determined that non-work trips by transit and driving modes were diverse among the neighborhoods. Senbil et al., 2007 [38], examined the relationship between the built environment and vehicle tenure in the Jakarta metropolitan area. They indicated that relative housing locations and levels of transportation infrastructure had important influences on vehicle tenure. In addition, they identified that none of the parameters associated with density and diversity had an important influence on motorcycle tenure, and only a few had an important influence on car tenure.
In South American case studies, Cervero et al., 2009 [39], examined the built environment and non-motorized travel behavior in Bogota, Colombia. They identified that road facility designs are related to bicycling and walking but that density and land use mixtures were not. Zegras, 2010 [40], recognized that residents’ socio-demographic driving factors such as income have a more prominent role in affecting energy consumption in Santiago, Chile. Although studies of developing countries’ case studies are few, some common characteristics can be recognized. First, the built environment seems to have a restricted influence on motorized vehicle tenure at the regional scale rather than the neighborhood scale. Second, the level of income has more effect on car tenure. Third, for both regional and neighborhood built environments, parameters have an influence on short-term travel behavior. However, these findings are sometimes unlike those found in developed regions. For instance, density and mixed land use have a less important influence on travel behavior because most cities still have a higher concentration of residents in urban centers with mixed land use, which leads to non-significant outcomes with low statistical variation [39,41]. Some studies have argued that, in developing countries, extreme changes in urban development from a high-density mixed use pattern to a low-density pattern would be a key reason for increasing vehicle travel and then energy consumption [42]. In the high-density metropolitan regions, the urban development pattern is believed to be a major factor inducing motorized travel [42,43,44]. Osman et al., 2016 [41], found that in the Cairo region, neighborhoods with high density and mixed land use could significantly reduce energy consumption compared to lower-density urban sprawling neighborhoods.
All previous findings of case studies in both developing and developed countries were contradicted by the findings of Gober, 1981 [45]. Moreover, it was observed that in developed metropolitan areas, the increase of urban and population density by the subdivision of existing households and creation of new ones will lead to an increase in energy consumption [41]. He assumed that existing housing stock will accommodate fewer people who will consume less energy. When single family dwellings designed for families of four or five pers
ons are occupied by unmarried singles or childless couples, overall population density declines in the sense that fewer people are located on a given square mile or an acre of land. This will undoubtedly result in higher travel times and energy utilization.
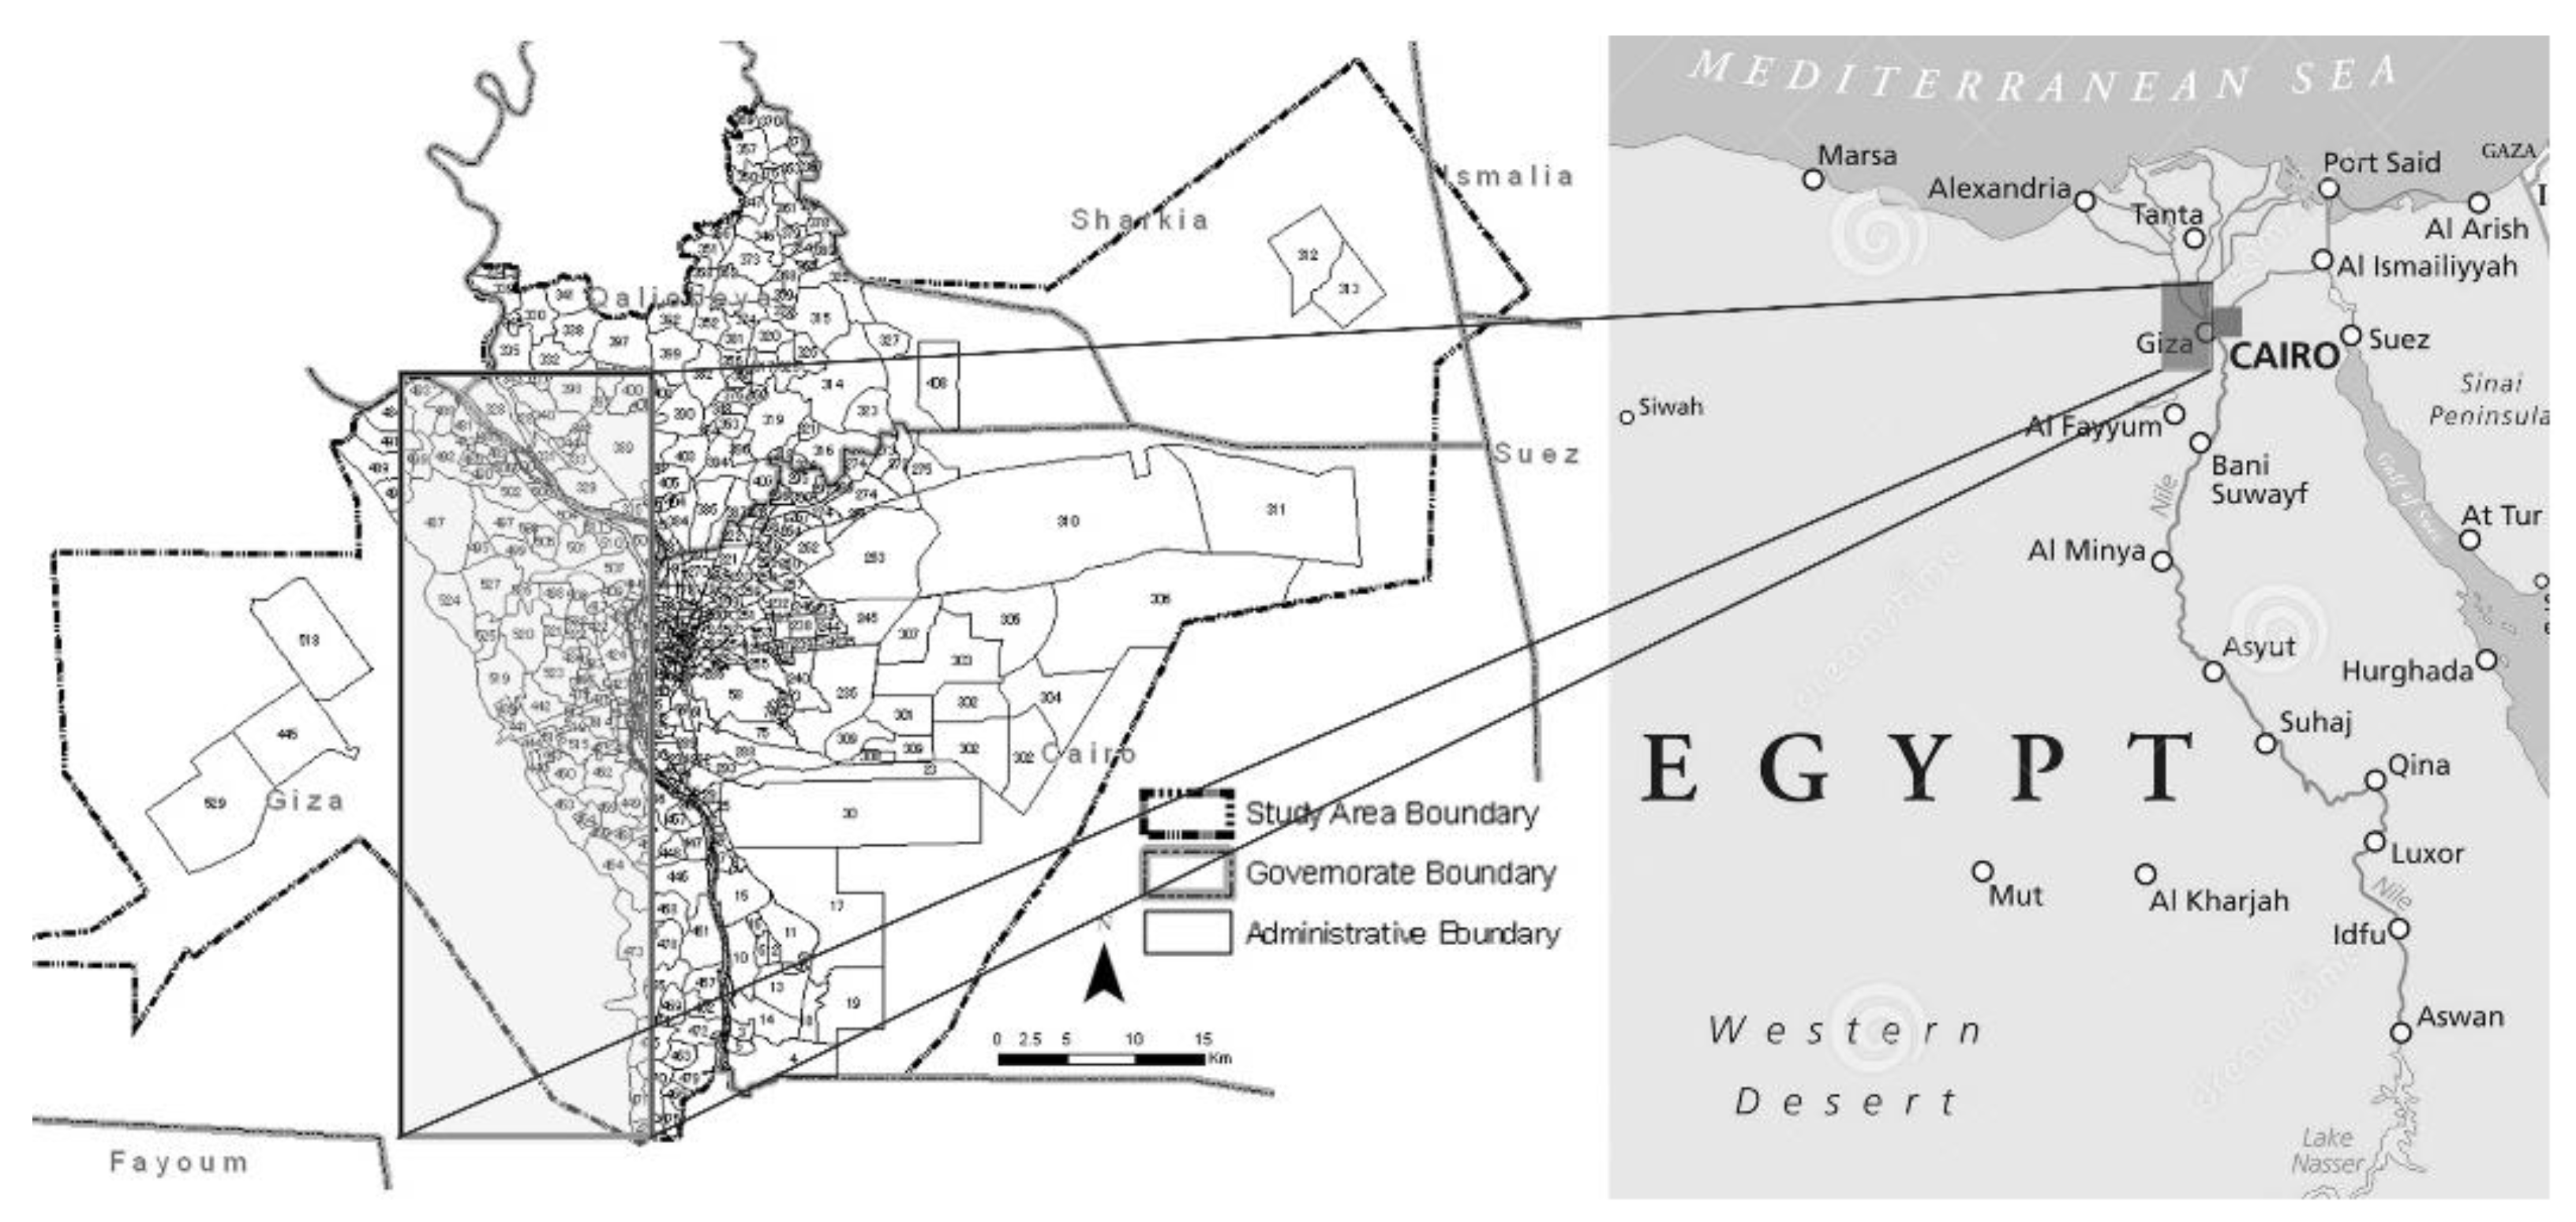
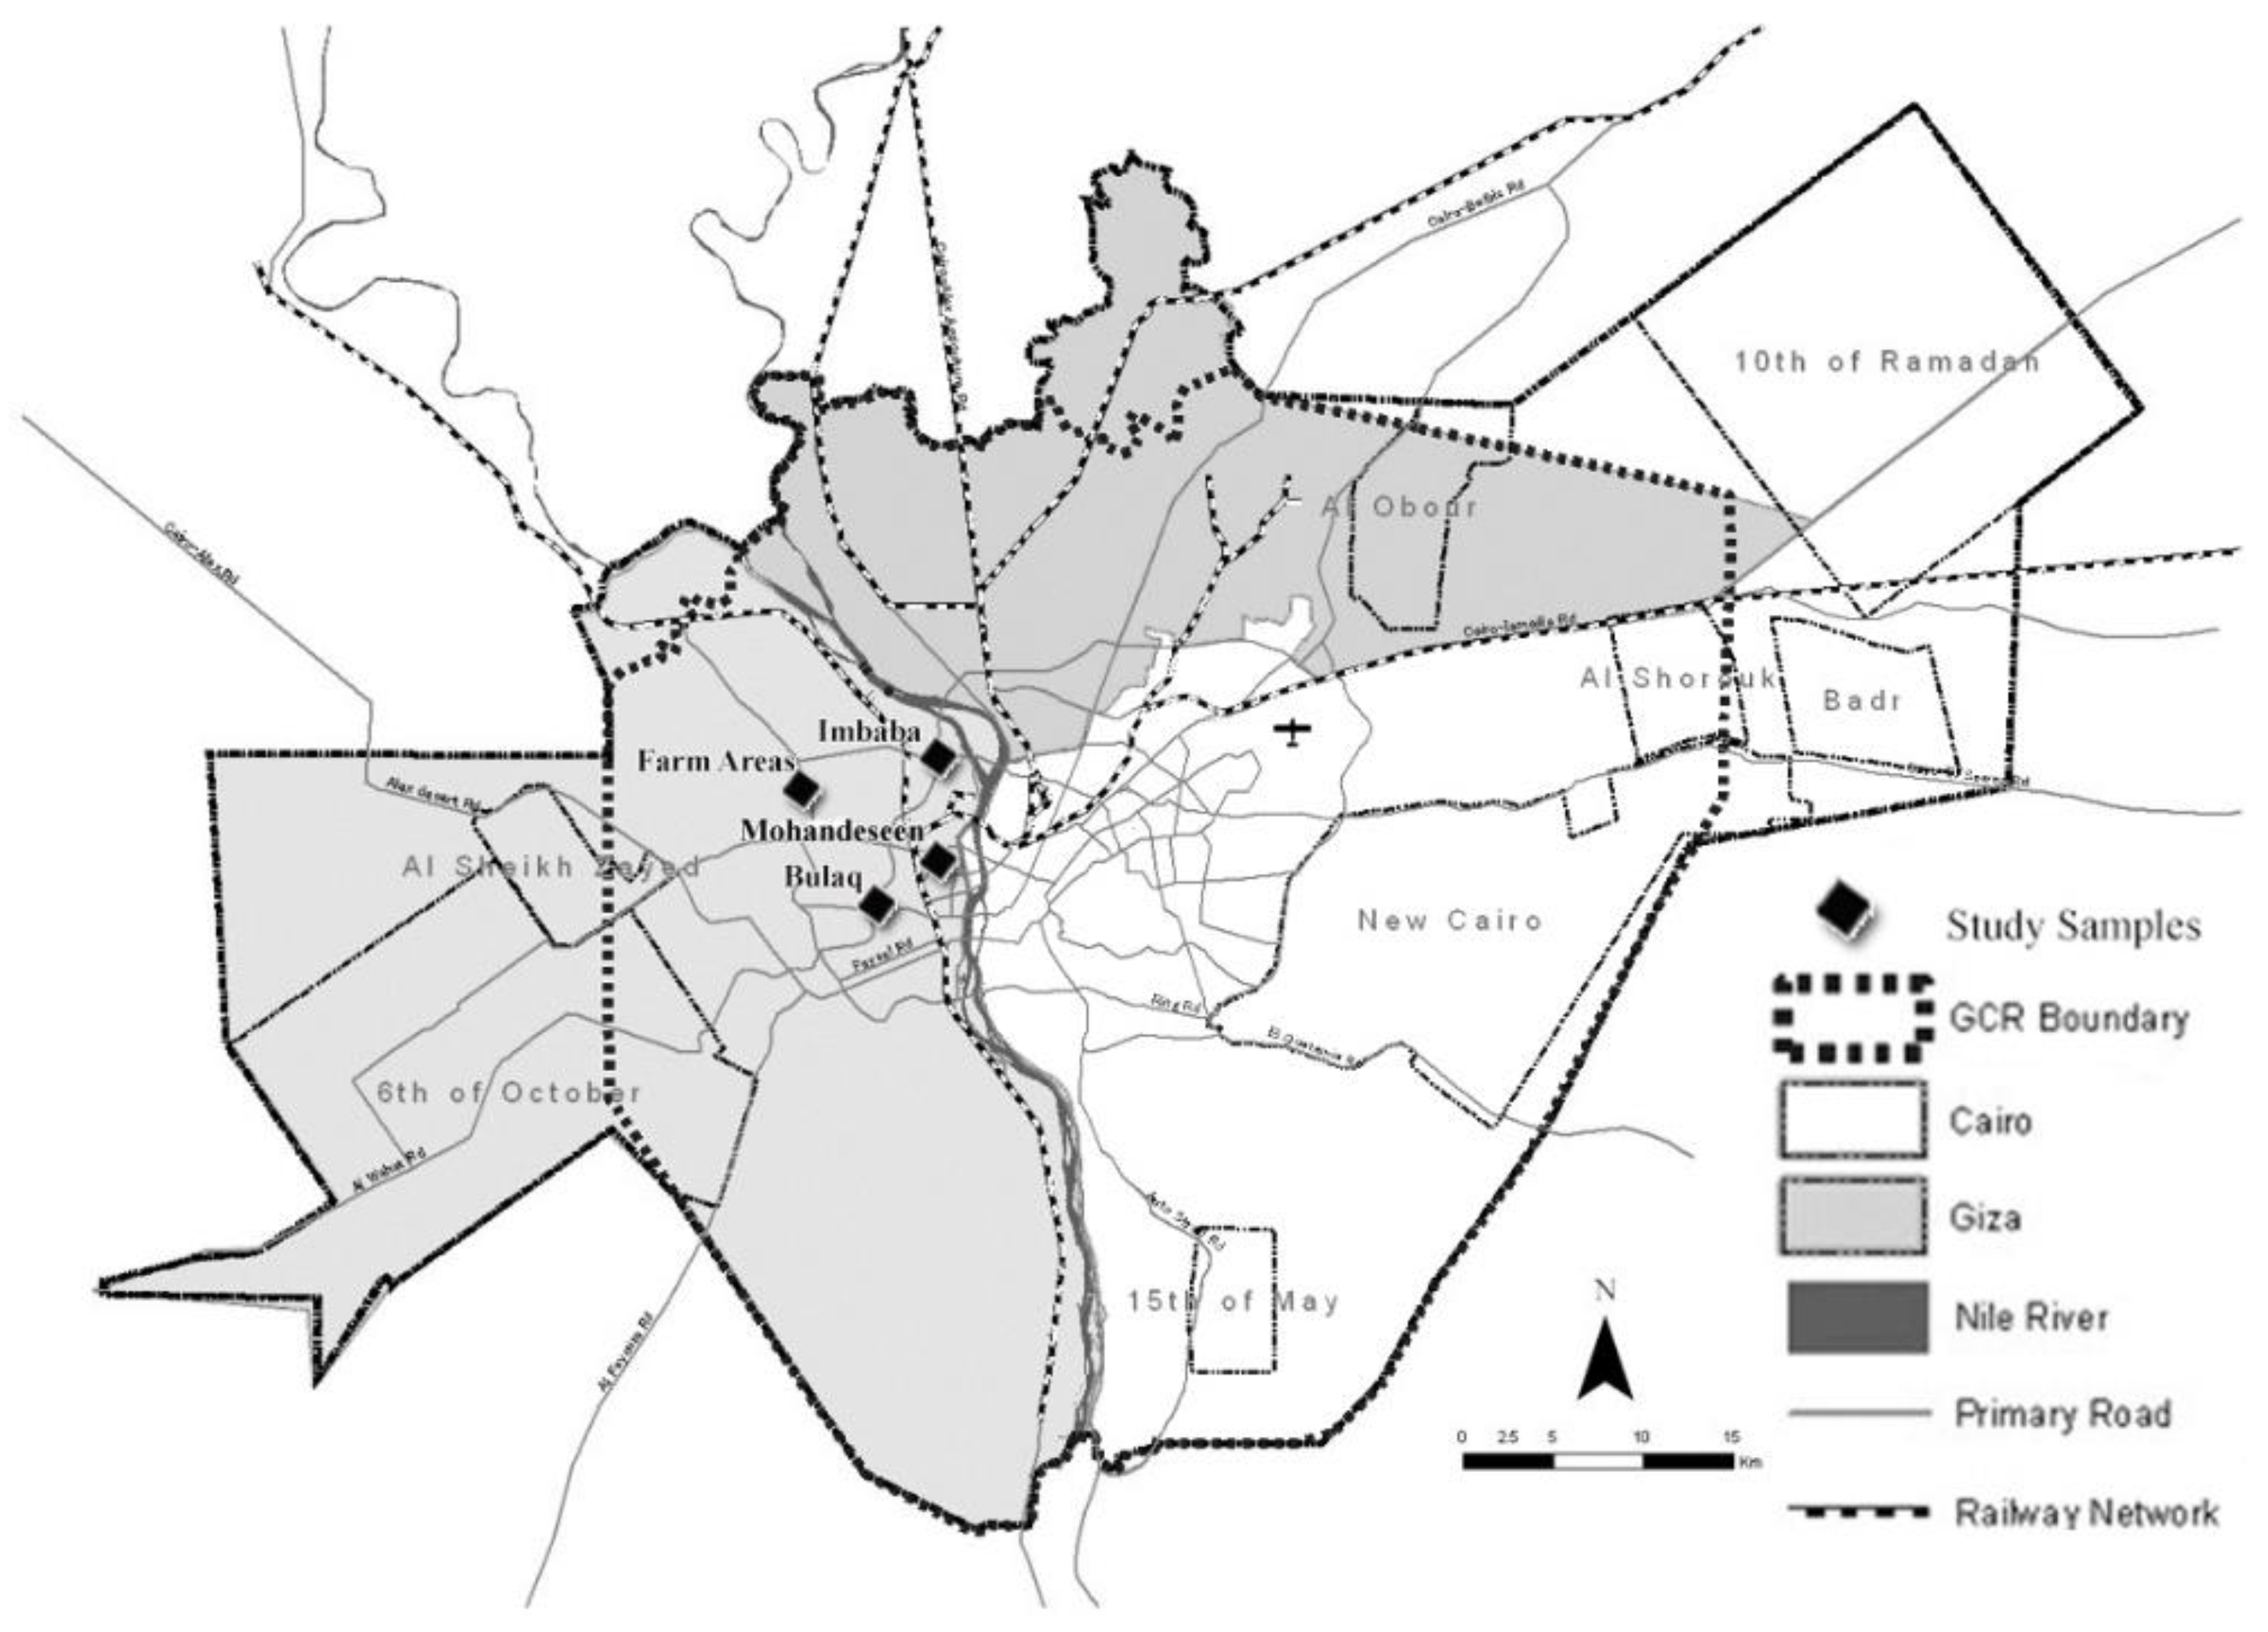
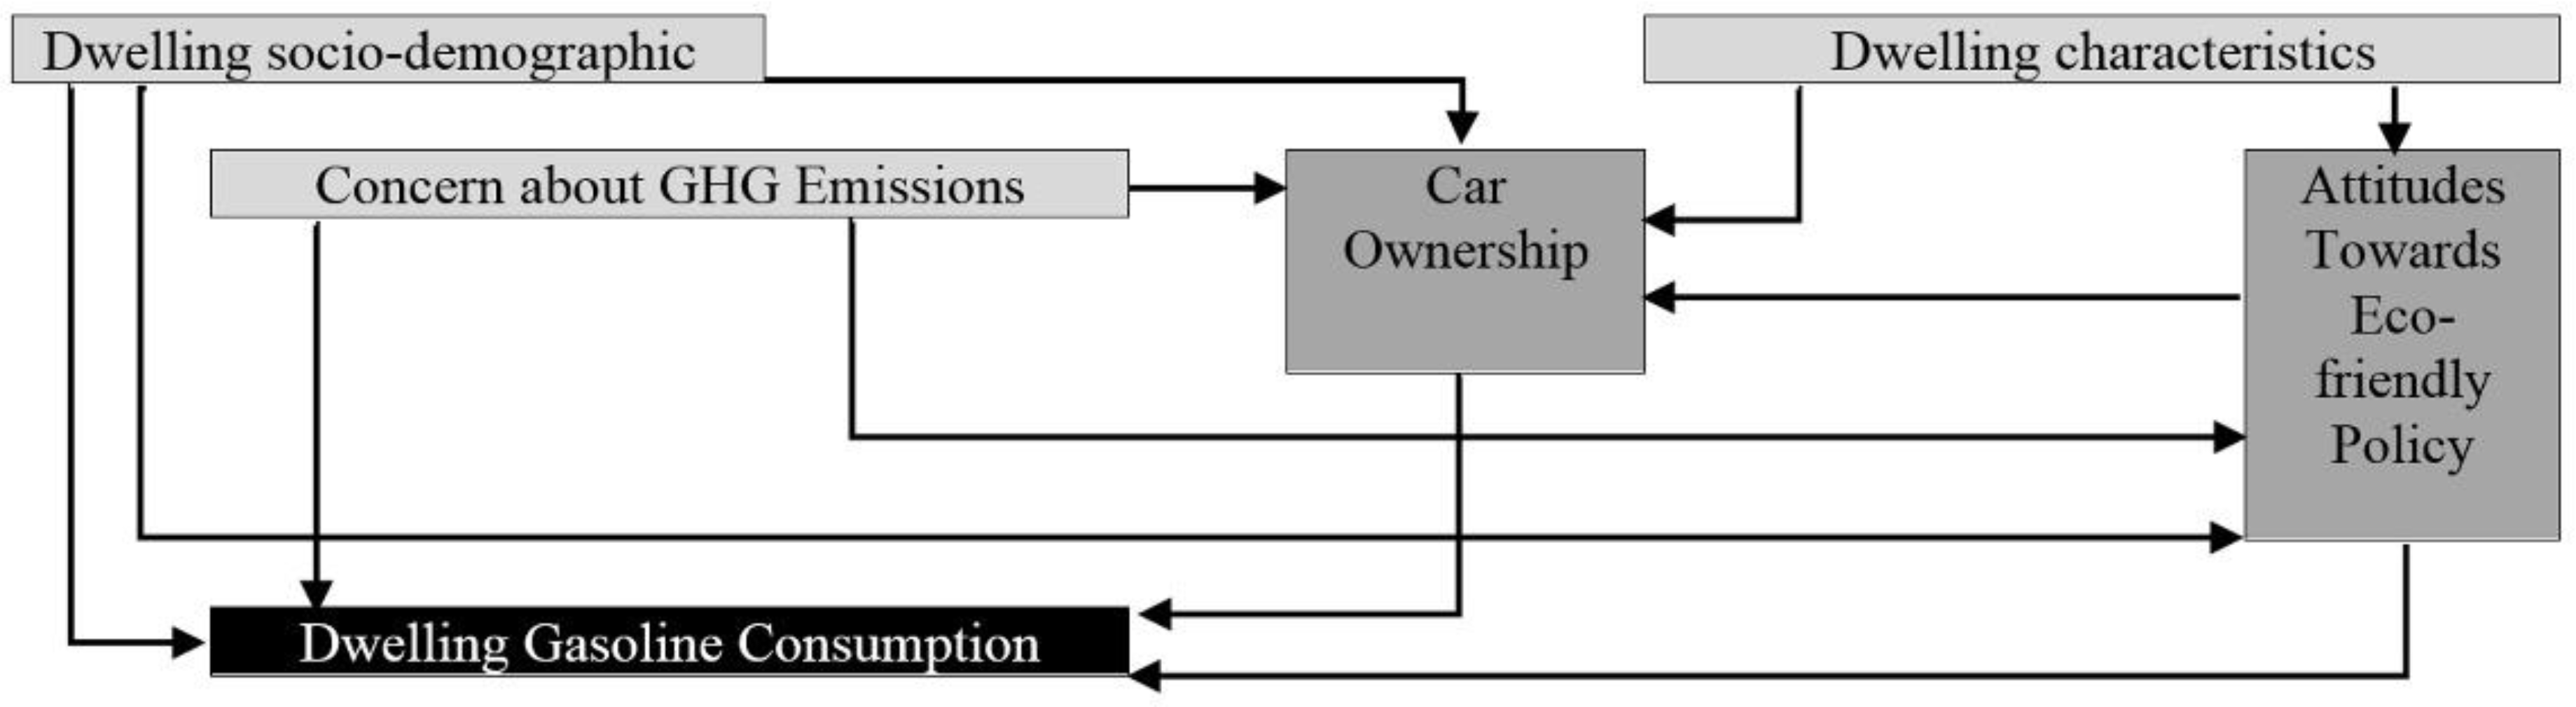
All in all, there is a need to enhance the domestic energy consumption knowledge of developing countries’ cases studies, particularly which focusing on the neighborhood scale. In this paper, we aim to discover the driving factors of domestic energy consumption in two high-density mixed land-use districts as a case study in the greater Cairo metropolitan region (GCMR). By using the built environment, and socio-economic data combined with structural equation modeling (SEM), the interconnections between domestic gasoline consumption and its relevant driving factors were computed.

2. Method and Data

2.1. Study Area

As shown in Figure 1, this paper is focusing on the western part of greater Cairo metropolitan region (GCMR). The population still growing at high rates and suburban of GCMR attracts many migrants from all over the country while the population spills over considerably from the old urban areas to the peripheral areas [46]. This caused a rise in housing demand in both the urban core and peripheral municipalities. Houses have been established through a renewal of conventional urban houses whereas agricultural land has been regularly changed into residential land use in surrounding rural areas. Osman et al., 2015 [46], found that these latest dynamics of housing development in GCMR led to a new behavior in the new residential districts to follow a modern lifestyle with a nuclear family, which is in contrast to the traditional lifestyle of living together with an extended family. Many researchers, such as [47,48,49], have referred to the potential environmental deterioration that accompanies the high economic growth, fast growth of the urban population, and alteration in the individual’s preference.

2.2. Dataset

Local Survey

A local survey was designed and conducted by a study team from Cairo University including the authors of this paper. A questionnaire was designed for an interview-based household survey on daily activities to obtain socio-demographic data and opinions related to lifestyle. The questionnaire sheets consisted of six parts: personal attributes, household attributes, an individual’s daily behaviors, the household’s daily behaviors, data from an individual’s activity diary, and an individual’s values. As for the personal attributes, the respondents were requested to provide basic information such as gender, age, occupation, birthplace, and education level. They were also asked questions about their household’s attributes, including income, settlement, ownership of devices, and information about any hired maid. Next, the respondents were asked about their daily consumption, and community-based activities, along with household-based behaviors such as goods consumption, joint leisure activities, and shopping. As for the activity diary data, the activity episodes included all types of activities from waking up in the morning to going to bed at night on a typical workday and a typical non-workday. The respondents were requested to provide the time allocated to each activity.
The survey was implemented in April 2012–June 2012 after a preparatory survey held in February 2012. The preparatory survey was implemented to test the survey method by using a smaller sample size and was conducted in the local municipalities of Boulaq and Imbaba (Figure 2). The respondents were selected using a random sampling method. First, 100 target areas were selected using a random sampling method considering the distribution of the population. Each target area was a 500 m × 500 m grid zone. Next, the highest-population-density municipalities in the selected area were chosen. Then, a list of all the households in the selected municipalities was prepared. On the basis of this household list, 10 target households were selected randomly. Finally, a respondent was selected from the members of each selected household. A Kish grid was used to select an eligible respondent if there were multiple eligible respondents in a household. It should be noted that only individuals 16 years of age or older were eligible for our survey. Table 1 shows the descriptive statistics of the respondents.
As shown in Table 2, many drivers are estimated to affect domestic gasoline consumption, such as built environment, the tenure of a private vehicle, the resident’s socio-demographics, and the individual’s attitudes. The built environment could affect domestic energy consumption both directly and indirectly through the tenure of private vehicles while the consumption may be also affected by both socio-demographics and attitudes.

2.3. Estimation Method

We applied the Maximization of Likelihood method (ML) to analyze the survey output in this study due to the large survey sample size [51,52]. Moreover, we applied the SEM model to investigate the anticipated complex relationships among hypothesis energy driving factors and domestic energy consumption in our case study based on the collected data from the survey. We used SEM because it does not limit the model structure, nor does it limit the form of the data. Therefore, SEM has been observed as a powerful tool for the verification of hypotheses according to [53]. Moreover, SEM has been commonly used in several studies such as [30,54] which examined transportation-related energy use which integrates SEM to examine how the built environment and individuals’ attitudes affect each other. Figure 3 shows a hypothetical model which was applied to examine the complex relations among several factors that affect domestic energy consumption. First, it hypothesizes that private vehicle tenure directly affects domestic energy consumption. Second, the attitude towards eco-friendly actions has both a direct influence and an indirect influence on private vehicle tenure. Third, the concern about environmental issues affects both attitudes towards eco-friendly actions and private vehicle tenures. Fourth, residents’ socio-demographics have an effect on domestic energy consumption directly and indirectly over four paths via built environment, concern about environmental issues, private vehicle tenures, and attitude towards eco-friendly actions. Fifth, the built environment has an influence on domestic energy consumption directly and also indirectly through two intermediating parameters: private vehicle tenures and attitude towards eco-friendly actions.

3. Results and Discussions

3.1. Built Environment Driving Factors

The findings identified that built environment drivers have various degrees of influence on domestic gasoline consumption via the attitude towards eco-friendly actions and the tenure of vehicles. First, for direct effects, the driving factors of building age and floor area had very low positive effects on consumption while time to the bus stop had a slightly positive effect. The factors of the number of stories, the number of rooms and population density proved to have negative, very low effects on domestic gasoline consumption. Second, for the indirect effects, the number motorbikes factor had a negative, slightly high indirect effect (−0.342) in considering access to public transportation factors, while it had a very low indirect effect with the rest of the direct, active driving factors (0.01~0.08). The factor of number cars had a very low negative effect (−0.009~−0.03) on two direct active factors while it had a low positive effect with rest of the factors (0.01~0.1). The factor of eco-friendly attitude actions had a negative impact on floor area and time to the bus stop (−0.1~−0.6) while it had a positive impact (0.01~0.13) with the rest of the main affecting factors (Table 3).
Findings from Table 3 and Table 4 show the influence of the access time to a bus stop has a low positive influence on domestic gasoline consumption, which means residents residing near public transportation would consume less gasoline. It should be recognized that a causal link from the access time to public transportation to the number of cars or motorbikes is not important. They would refer to the proximity to public transportation not working to discourage the tenure of private vehicles; however, it would work to decrease the use of these vehicles by allowing citizens to use public transportation. The population density factor has a very low negative influence on the number of motorbikes, which proposes that individuals living in a higher-population-density area aim to own fewer motorbikes. This looks to be a reasonable result as it is usually supposed that population density is one of the indices of destination accessibility where individuals living in a dwelling that is highly accessible to several services could simply walk there, causing of the use of fewer motorbikes. However, the findings show that the direct effect of population density on gasoline consumption is not important. This proposes that population density works to abandon the motorbikes, but population density itself does not affect the use of private vehicles. This looks different compared to the findings of the current researchers [42], which suppose population density as one of the indices of compactness, causing less travel distance using vehicles. The built environment associated with the settlement, such as floor area, the number of rooms, the number of stories, and building age, does not have a significant influence on the gasoline consumption. This proposes that the residents’ travel behavior is a parameter independent from the neighborhood design. Note that a fundamental relation from the design of a neighborhood to the tenure of private vehicles is important, as it proposes that the physical characteristics of the neighborhood may affect the tenure of vehicles.
In Table 5, we applied two main groups of driving factors affecting gasoline consumption. The first group of residents’ attributes had three negative high-impact factors and one positive slight-impact factor on gasoline consumption. The second group of vehicle tenure had two extremely affecting factors for gasoline consumption which could make the effects of other factors fade away in this model. Moreover, the influences of the satisfaction with neighborhood driving factor on gasoline consumption and on motorcycle tenure are important. When this factor is added to the model, the entire influences of the built environment parameters are slightly reduced. This explains that, although the attitudes of respondents with respect to the built environment are related to travel behavior, they are not strongly related to the built environment in which they live. There are two potential causes for such a finding. The first supposes a causality from respondents’ attitudes as driving factors toward the built environment to the built environment such as the choice of residential units. This refers to the fact that transportation matters have a lower importance in the choice of a dwelling. For instance, security is one of the most critical drivers for high-income people living in the new districts in GCMR [47,48,55] and could be more serious than transportation drivers. However, the choices of housing are limited in the context of GCMR. The second reason supposes a causality from the built environment to the attitude towards the built environment. This is one of the possible reasons for the relationship between the built environment and travel behavior. Although the second cause may be more probable in the case study introduced here, it has less of an influence. In this model, the overall accuracy of R2 proved the significance of the model fit in analyzing the relationship between domestic gasoline consumption and the causing driving factors arranged in two groups of residents’ attributes and vehicle tenure with a score of 0.522, while the R2 scored 0.285 and 0.0769 when analyzing the relationships between the two endogenous parameters of motorcycle tenure and car tenure with the main group factors of residents’ attributes, which refers to the insignificance of the model fit.
Table 6 shows the analysis outputs of direct and indirect relationships among the main driving factors of gasoline consumption based on Table 3 and Table 5. The residence income factor proved to have a high positive relationship with motorcycle tenure and a low positive relationship with car tenure, which ultimately leads, in an indirect way, to increased energy consumption in our study case studies, while residence income proved a slightly high direct positive effect on energy consumption (0.5415). On the other hand, the lot size of residence units had low positive relations with a motorcycle and car tenure (0.1045, and 0.019), with no direct relationship with gasoline consumption. The time to bus stop proved a direct low positive effect on gasoline consumption while the distance to a service core proved no direct relations. The findings from Table 6 show that individuals living in a larger land area own more vehicles, which causes a positive growth in domestic gasoline consumption. The growth proves that larger houses have more parking space for vehicles. Access time to the nearest public transportation has a positive elasticity of 0.114 as a direct effect only, which proves that an improvement of public transportation accessibility does not affect the tenure of motorized vehicles but does support the use of motorized vehicles. These findings are in agreement with previous studies on developing cities, which also aimed to clarify that the density and land-use mix parameters have a low positive effect on travel behavior [39,41]. Table 6 findings show that distance to the nearest service core causes a very low positive indirect effect on gasoline consumption through motorcycle tenure. These indirect consequences show that motorcycle tenure could increase as the distance to the service core increases.

3.2. Socioeconomic Driving Factors

The findings of Table 4 and Table 7 identified that residents’ socio-demographic driving factors have varied influences on domestic gasoline consumption between very low to medium effects and from negative to positive effects. The driving factors of concern about environmental issues and monthly residents’ income had a very low positive effect on gasoline consumption while the factor of a number of children had very low negative impacts. The factor of a number of motorbikes had the highest positive effect on consumption, followed by the factors of the number of cars, and the number of adults. The findings recognized that the number of adults factor with the highest positive effect on gasoline consumption in this model is affected positively by the factor of the number of motorbikes, which increases by increasing the value of the number of adults factor while it was not affected by the number of children value. This result proves the multiple effects of the study’s driving factors on energy consumption through the internal indirect relations among causing socio-economic driving factors. The concern towards environmental issues and attitude towards eco-friendly actions driving factors had a very low positive influence on energy consumption (0.047~0.028). This could be proof that managing energy consumption in such unplanned urban areas as in our cases studies in developing countries is not possible by spreading concerns about environmental issues or a culture of an eco-friendly environment.

4. Conclusions

The influence of the built environment and socio-economic driving factors on domestic gasoline consumption was examined with data aggregated from GCMR and analyzed through the SEM model. The paper’s findings added empirical proof to the rare literature of the relationship between the built environments and socio-economic factors on energy consumption in developing regions. The findings showed that population density, building age, and floor area as built environment driving factors had very low negative effects on gasoline consumption, which is in contrast to previous findings from researchers in both developing and developed cases studies. For socio-economic driving factors, residence income and number of motorbikes had the highest positive effects on energy consumption, which is consistent with previous findings.
The findings show that a built environment plan without adapting to socioeconomic factors’ demands cannot achieve an effective management of domestic energy consumption in developing metropolitan areas. Therefore, to enhance a sustainable urban plan, the socio-economic driving factors should be considered as the main element of energy consumption in developing countries. For future research, a test for a hypothetical model based on the analysis results including null and alternative hypotheses is highly recommended. More in-depth research should be done to quantify the indirect effects of driving factors on domestic energy consumption and their internal indirect relationships.

Author Contributions

Taher Osman and Mustafa M. Osman conceived the survey, and developed the model, Taher Osman and Prasanna Divigalpitiya conducted analyzes, model runs, and wrote the paper.

Conflicts of Interest

The authors declare no conflict of interest.

References

  1. UN Habitat. State of the World’s Cities 2012/2013: Prosperity of Cities; United Nations Human Settlements Programme: Nairobi, Kenya, 2012. [Google Scholar]
  2. United Nations. City planning will determine pace of global warming. 2007. Available online: http://www.un.org/News/Press/docs/2007/gaef31 90.doc.htm (accessed on 5 May 2014).
  3. Krass, F. Megacities and global change: Key priorities. Geogr. J. 2007, 173, 79–82. [Google Scholar] [CrossRef]
  4. Schiller, S.; Evans, J.M. Urban climate and compact cities in developing countries. In Compact Cities: Sustainable Urban Forms for Developing Countries; Jenks, M., Burgess, R., Eds.; Spon Press: London, UK, 2000; pp. 117–124. [Google Scholar]
  5. Nam, K.; Lim, U.; Kim, B.H.S. Compact or Sprawl for the sustainable urban form? Measuring the effect on travel behavior in Korea. Ann. Reg. Sci. 2012, 49, 157–173. [Google Scholar] [CrossRef]
  6. Williams, K.; Burton, E.; Jenks, M. Achieving Sustainable Urban Form; E & RN Spon: Abingdon, Oxon, UK, 2000. [Google Scholar]
  7. Shim, G.-E.; Rhee, S.-M.; Ahn, K.-H.; Chung, S.-B. The relationship between the characteristics of transportation energy consumption and urban form. Ann. Reg. Sci. 2006, 40, 351–367. [Google Scholar] [CrossRef]
  8. Ewing, R.; Cervero, R. Travel and the Built Environment: A Synthesis. In Transportation Research Record: Journal of the Transportation Research Board; No. 1780; TRB, National Research Council: Washington, DC, USA, 2001; pp. 87–114. [Google Scholar]
  9. Krizek, K. Residential Relocation and Changes in Urban Travel: Does Neighborhood-Scale Urban Form Matter? J. Am. Plan. Assoc. 2003, 69, 265–281. [Google Scholar] [CrossRef]
  10. Liu, C.; Shen, Q. An empirical analysis of the influence of urban forms on household travel and consumption. Comput. Env. Urban Sys. 2011, 35, 347–357. [Google Scholar] [CrossRef]
  11. Holden, E.; Norland, I.T. Three challenges for the compact city as a sustainable urban form: Household consumption of energy and transport in eight residential areas in the greater Oslo Region. Urban Stud. 2005, 42, 2145–2166. [Google Scholar] [CrossRef]
  12. Brian, S., Jr. Urban sprawl and air quality in large US cities. J. Env. Manag. 2008, 86, 688–698. [Google Scholar]
  13. Schweitzer, L.; Zhou, J. Neighborhood Air Quality, Respiratory Health, and Vulnerable Populations in Compact and Sprawled Regions. J. Am. Plan. Assoc. 2010, 76, 363–371. [Google Scholar] [CrossRef]
  14. Cervero, R. Planned communities, self-containment and commuting: A cross-national perspective. Urban Stud. 1995, 32, 1135–1161. [Google Scholar] [CrossRef]
  15. Levinson, D.M.; Kumar, A. Density and the journey to work. Growth Chang. 1997, 28, 147–172. [Google Scholar] [CrossRef]
  16. Barter, P.A. Compact cities: Sustainable urban forms for developing countries. In Transport Dilemmas in Dense Urban Areas: Examples from Eastern Asia; Jenks, M., Burgess, R., Eds.; E & FN Spon: London, UK, 2000; pp. 271–284. [Google Scholar]
  17. Cervero, R. Land-use mixing and suburban mobility. Transp. Quart. 1988, 42, 429–446. [Google Scholar]
  18. Ewing, R.; Haliyur, P.; Page, G.W. Getting Around a Traditional City, a Suburban Planned Unit Development, and Everything in Between. Available online: http://onlinepubs.trb.org/Onlinepubs/trr/1994/1466/1466-008.pdf (accessed on 15 March 2016).
  19. Frank, L.D.; Gary, P. Impacts of Mixed Use and Density on Utilization of Three Modes of Travel: Single-Occupant Vehicle, Transit, and Walking. Available online: http://onlinepubs.trb.org/Onlinepubs/trr/1994/1466/1466-007.pdf (accessed on 15 March 2016).
  20. Bento, A.M.; Cropper, M.L.; Mobarak, A.M.; Vinha, K. The effects of urban spatial structure on travel demand in the United States. Rev. Econ. Stat. 2005, 87, 466–478. [Google Scholar] [CrossRef]
  21. Vance, C.; Hedel, R. The impact of urban form on automobile travel—Disentangling causation from correlation. Transportation 2007, 34, 575–588. [Google Scholar] [CrossRef]
  22. Heres-Del-Valle, D.; Niemeier, D. CO2 emissions: Are land-use changes enough for California to reduce VMT specification of a two-part model with instrumental variables. Trans. Res. Part B 2011, 45, 150–161. [Google Scholar] [CrossRef]
  23. Pan, H.; Shen, Q.; Zhang, M. Influence of urban form on travel behavior in four neighborhoods of Shanghai. Urban Stud. 2009, 46, 275–294. [Google Scholar]
  24. Huzayyin, A.S. Analysis of the evolution of travel, transport system and urban activity for sustainable short/long term transport policies; with reference to greater Cairo. Official CD of WCTR-10, Istanbul. Elsevier Science Publishers: Amsterdam, The Netherlands, 2004. [Google Scholar]
  25. Stead, D. Relationships between land use, socioeconomic factors, and travel patterns in Britain. Env. Plan. B 2001, 28, 499–528. [Google Scholar] [CrossRef]
  26. Bagley, M.N.; Mokhtarian, P.L. The impact of residential neighborhood type on travel behavior: A structural equations modeling approach. Ann. Reg. Sci. 2002, 36, 279–297. [Google Scholar] [CrossRef]
  27. Luk, J.Y.K. Reducing Car Travel in Australian Cities: Review Report. J. Urban Plan. Dev. 2003, 129, 84–96. [Google Scholar] [CrossRef]
  28. Schwanen, T.; Mokhtarian, P.L. The extent and determinants of dissonance between actual and preferred residential neighborhood type. Env. Plan. B 2004, 31, 759–784. [Google Scholar] [CrossRef]
  29. Brownstone, D.; Golob, T.F. The impact of residential density on vehicle usage and energy consumption. J. Urban Econ. 2009, 65, 91–98. [Google Scholar] [CrossRef]
  30. Stone, B., Jr.; Mednick, A.C.; Holloway, T.; Spak, S.N. Is compact growth good for air quality? J. Am. Plan. Assoc. 2007, 73, 404–418. [Google Scholar] [CrossRef]
  31. Bartholomew, K. Land use-transportation scenario planning: Promise and reality. Transportation 2007, 34, 397–412. [Google Scholar] [CrossRef]
  32. Frank, L.D.; Stone, B., Jr.; Bachman, W. Linking land use with household vehicle emissions in the central Puget Sound: Methodological framework and findings. Trans. Res. Part D 2000, 5, 173–196. [Google Scholar] [CrossRef]
  33. Marquez, L.O.; Smith, N.C. A framework for linking urban form and air quality. Env. Model. Softw. 1999, 14, 541–548. [Google Scholar] [CrossRef]
  34. Yamamoto, T. Comparative analysis of household car, motorcycle, and bicycle ownership between Osaka metropolitan area, Japan, and Kuala Lumpur, Malaysia. Transportation 2009, 36, 351–366. [Google Scholar] [CrossRef]
  35. Ho, C.Q.; Yamamoto, T. The role of attitudes and public transport service on vehicle ownership in Ho Chi Minh, Vietnam. In Proceedings of the Australasian Transport Research Forum, Adelaide, Australia, 28–30 September 2011; pp. 28–30.
  36. Wang, D.; Chai, Y.; Li, F. Built environment diversities and activity–travel behaviour variations in Beijing, China. J. Trans. Geogr. 2011, 19, 1173–1186. [Google Scholar] [CrossRef]
  37. Senbil, M.; Zhang, J.; Fujiwara, A. Motorization in Asia—14 countries and three metropolitan areas. Int. Assoc. Traffic Saf. Sci. Res. 2007, 31, 46–58. [Google Scholar]
  38. Cervero, R.; Sarmiento, O.L.; Jacoby, E.; Gomez, L.F.; Neiman, A. Influences of Built Environments on Walking and Cycling: Lessons from Bogota. Int. J. Sustain. Trans. 2009, 3, 203–226. [Google Scholar] [CrossRef]
  39. Zegras, C. The built environment and motor vehicle ownership and use: Evidence from Santiago de Chile. Urban Stud. 2010, 47, 1793–1817. [Google Scholar] [CrossRef]
  40. Naess, P. Residential location, travel, and energy use in the Hangzhou metropolitan area. J. Trans. Land Use 2010, 3, 27–59. [Google Scholar] [CrossRef]
  41. Osman, T.; Arima, T.; Divigalpitiya, P. Effect of urban development patterns on traffic-related CO2 emissions in greater Cairo metropolitan region. J. Archit. Urban Des. 2016, 29, 30–39. [Google Scholar]
  42. Shen, Q. Urban transportation in Shanghai, China: Problems and planning implications. Int. J. Urban Reg. Res. 1997, 21, 589–606. [Google Scholar] [CrossRef]
  43. Gwilliam, K. Urban transport in developing countries. Transport Rev. 2003, 23, 197–216. [Google Scholar] [CrossRef]
  44. Pucher, J.; Peng, Z.; Mittal, N.; Zhu, Y.; Korattyswaroopam, N. Urban transport trends and policies in China and India: Impacts of rapid economic growth. Transport Rev. 2007, 27, 379–410. [Google Scholar] [CrossRef]
  45. Gober, P. Falling household size and its effect on metropolitan population growth and density. Ann. Reg. Sci. 1981, 15, 1–10. [Google Scholar] [CrossRef] [PubMed]
  46. Osman, T.; Divigalpitiya, P.; Arima, T. Effect of governmental housing regulations on the Egyptian housing market: Focusing on greater Cairo metropolitan region. J. Archit. Urban Des. 2015, 28, 1–9. [Google Scholar]
  47. Araby, M.E. Urban growth and environmental degradation: The case of Cairo, Egypt. Cities 2002, 19, 389–400. [Google Scholar] [CrossRef]
  48. Osman, T.; Divigalpitiya, P.; Arima, T. Driving Factors of Urban Sprawl in Giza Governorate of the Greater Cairo Metropolitan Region Using a Logistic Regression Model. Int. J. Urban Sci. Taylor Francis Publ. 2016, in press. [Google Scholar] [CrossRef]
  49. Yin, Z.Y.; Stewart, D.J.; Bullard, S.; MacLachlan, J.T. Changes in urban built-up surface population distribution patterns during 1986–1999: A cast study of Cairo, Egypt. Comput. Environ. Urban Syst. 2005, 29, 595–616. [Google Scholar] [CrossRef]
  50. Japan International Cooperation Agency. The Strategic Urban Development Master Plan Study for Sustainable Development of the greater Cairo Region in the Arabic Republic of Egypt. Available online: http://www.jica.go.jp/english/our_work/social_environmental/archive/pro_asia/egypt_2.html (accessed on 15 March 2016).
  51. Hox, J.J.; Bechger, T.M. An introduction to structural equation modeling. Fam. Sci. Rev. 1998, 11, 354–373. [Google Scholar]
  52. Golob, T.F. Structural equation modeling for travel behavior research. Trans. Res. Part B 2003, 37, 1–25. [Google Scholar] [CrossRef]
  53. Cao, X.; Mokhtarian, P.L.; Handy, S.L. Examining the Impacts of Residential Self-Selection on Travel Behaviour: A Focus on Empirical Findings. Trans. Rev. 2009, 29, 359–395. [Google Scholar] [CrossRef]
  54. Abe, R.; Kato, H. Effect of built environment on gasoline consumption in a developing megacity. Evidence from the Jakarta, Indonesia, metropolitan area. Trans. Res Rec. 2014, 2454, 12–19. [Google Scholar] [CrossRef]
  55. Osman, T.; Arima, T.; Divigalpitiya, P. Measuring urban sprawl patterns in greater metropolitan cairo region. J. Indian Soc. Remote Sens. 2016. [Google Scholar] [CrossRef]
Figure 1. Study area location within Egypt.
Buildings 06 00012 g001
Figure 2. Study samples. Jica, 2008 [50] with Authors modifications.
Buildings 06 00012 g002
Figure 3. The study’s hypothetical model.
Buildings 06 00012 g003
Table 1. Descriptive statistics of survey respondents’ households (N = 900).
ParametersValues
Number of Children0123456<
Percentage11.90%31.10%29.40%19.30%6.80%1.20%0.30%
Monthly income (EGP)<600600–900900–12001200–15001500–18001800–24002400<
Percentage4.70%19.40%27.30%29.90%9.50%6.30%2.90%
Car ownership012<3
Percentage98.10%1.70%0.20%0.00%
Motorbike ownership0123<
Percentage39.40%49.10%9.70%1.80%
Air-condition tenure0123<
Percentage97.30%2.30%0.30%0.10%
GenderMaleFemale
Percentage52.40%47.60%
EducationNo schoolPrimaryJunior highSenior highAcademyUniversity
Percentage1.20%28.60%29.70%33.80%3.90%2.80%
Age16–1920–2930–3940–4950–5960–6970<
Percentage2.30%28.30%32.80%21.30%13.60%1.30%0.40%
OccupationGovern.HousewifeAuthorized self-employ.Unauthorized self-employ.EmployeeEmployerStudentPart time
1.20%27.50%10.40%19.70%21.60%0.30%6.10%1.40%
LaborUn-employ.RetiredLecturer
6.20%4.40%0.90%0.30%
Table 2. Descriptive statistics of sample data (N = 900).
Sample StatisticMeanMedianStandard Deviation
Endogenous Parameters
Gasoline consumption (MJ/month)10457201501
Motorcycle tenure (1/adult)0.840.950.73
Car tenure (1/adult)0.02800.18
Resident’s Attributes
Resident’s income (EGP/month)12541083741
Number of adults2.5651.91.14
No. children (less than 18 years old)1.2350.951.045
Age of resident’s head42.65540.8512.065
Period at current residence (years)16.3411.414.915
Built Environment Attributes
Lot size of residence (m2)9667124
Population density (persons/km2)13,20511,49510,640
Time to public Transportation (min)18.249.520.33
Distance to nearest service core (km)8.2657.5055.7
Distance to city center (km)20.23517.38512.825
Distance to the nearest facilities (km)
Hospital1.521.331.045
Place of religion0.4750.3420.3895
Educational institution0.52250.3990.38
Business and commercial place2.091.711.615
Cultural place11.49.57.315
* p < 0.05.
Table 3. The result of domestic gasoline consumption model and built environment driving factors *.
Endogenous ParametersPop. DensityTime to Bus StopFloor AreaNo. RoomsNo. StoriesBuild. Age
Gasoline consumptionStd. Coeff.−0.02850.10450.0285−0.019−0.02850.0095
t-statistic−1.11154.3035−1.1685−0.5225−1.178−0.4465
No. carsStd. Coeff.0.0380.0190.10450.0665−0.038−0.0095
t-statistic−1.1495−0.6463.1161.957−1.2065−0.4085
No. motorbikesStd. Coeff.−0.057−0.3420.08550.06650.019−0.038
t-statistic−1.9570.08552.9642.1375−0.7885−1.3395
Eco-friendly attitudeStd. Coeff.0.133−0.6435−0.10450.066500.019
t-statistic3.9995−0.1045−3.0211.976−0.0665−0.418
* p < 0.05.
Table 4. The result of domestic gasoline consumption model and residents’ attitudes.
Endogenous ParametersAttitude toward Eco-Friendly ActionsConcern about Environmental Issues
Gasoline consumptionStd. Coeff.−0.0475
t-statistic−1.9
No. carsStd. Coeff.−0.0190.019
t-statistic−0.57−0.5795
No. motorbikesStd. Coeff.0.00950.0285
t-statistic−0.4655−1.121
Eco-friendly attitudeStd. Coeff.0.1235
t-statistic3.9235
* p < 0.05.
Table 5. Results of residents’ characteristics and vehicle tenure *.
StatisticEndogenous Parameters
Domestic Gasoline ConsumptionMotorcycle TenureCar Tenure
Intercept−13300−8.987−1.6055
Residents’ attributes
Number of adults0.13965−0.01425
Number of children−97.85−0.00988
Age of resident’s head−15.485−0.00825
Period of residing in current residence−43.7
Satisfaction with neighborhood9.39550.0006555
Vehicle tenure
Motorcycle tenure1482
Car tenure1748
Error covariance of vehicle tenure−0.0046
R20.52250.2850.07695
* p < 0.05.
Table 6. Built environment elasticities and income elasticities of gasoline consumption *.
CharacteristicIndirectDirectTotal
Motorcycle TenureCar Tenure
Lot size of residence unit0.10450.0190.1235
Time to bus stop0.1140.114
Distance to service core0.04750.0475
Residence Income0.61750.12350.54151.273
* p < 0.05.
Table 7. Effect of socio-economic drivers on domestic gasoline consumption *.
ParametersStd. Coeff.t-Statistic
Number of adults in a residence0.1333.439
Number of children in a residence−0.04−1.2255
Number of cars owned0.198.17
Number of motorbikes owned0.389513.11
Attitude towards eco-friendly actions0.0475−1.634
Concern about environmental issues0.02851.083
* p < 0.05.

