Article

Guidelines for Using Building Information Modeling for Energy Analysis of Buildings

1
FXFOWLE Architects, 22 W 19 Street, New York, NY 10011, USA
2
Department of Construction Management, Colorado State University, 224A Guggenheim Hall, Fort Collins, CO 80523, USA
3
Rinker School of Construction Management, University of Florida, 304 Rinker Hall, Gainesville, FL 32611, USA
*
Author to whom correspondence should be addressed.
These authors contributed equally to this work.
Buildings 2015, 5(4), 1361-1388; https://doi.org/10.3390/buildings5041361
Submission received: 23 June 2015 / Revised: 16 November 2015 / Accepted: 1 December 2015 / Published: 9 December 2015
(This article belongs to the Special Issue BIM in Building Lifecycle)

Abstract

:
Building energy modeling (BEM), a subset of building information modeling (BIM), integrates energy analysis into the design, construction, and operation and maintenance of buildings. As there are various existing BEM tools available, there is a need to evaluate the utility of these tools in various phases of the building lifecycle. The goal of this research was to develop guidelines for evaluation and selection of BEM tools to be used in particular building lifecycle phases. The objectives of this research were to: (1) Evaluate existing BEM tools; (2) Illustrate the application of the three BEM tools; (3) Re-evaluate the three BEM tools; and (4) Develop guidelines for evaluation, selection and application of BEM tools in the design, construction and operation/maintenance phases of buildings. Twelve BEM tools were initially evaluated using four criteria: interoperability, usability, available inputs, and available outputs. Each of the top three BEM tools selected based on this initial evaluation was used in a case study to simulate and evaluate energy usage, daylighting performance, and natural ventilation for two academic buildings (LEED-certified and non-LEED-certified). The results of the case study were used to re-evaluate the three BEM tools using the initial criteria with addition of the two new criteria (speed and accuracy), and to develop guidelines for evaluating and selecting BEM tools to analyze building energy performance. The major contribution of this research is the development of these guidelines that can help potential BEM users to identify the most appropriate BEM tool for application in particular building lifecycle phases.

1. Introduction

As sustainability increasingly becomes a standard practice in the building industry, the demand for high-performance buildings also increases [1]. Goals related to sustainability are being set ever higher, demanding greater levels of energy and resource efficiency [2,3,4]. With the demand for high-performance buildings and the resulting challenges posed to designers, builders and facility managers, the integration of building performance analysis into the design, construction, and operation and maintenance of buildings becomes crucial [2,5,6,7,8]. According to the US GSA [8] use of the building information modeling (BIM)-based energy modeling provides several benefits including: more accurate and complete energy performance analysis in early design stages, improved lifecycle cost analysis, and more opportunities for monitoring actual building performance during the operation phase. Building information modeling (BIM) in conjunction with building energy modeling (BEM) seeks to make this integration seamless throughout the design process [8,9]. In addition, during the building operation and maintenance phase, BEM can be used to improve energy efficiency through adjustments to system operations and building retrofits [8].
The American Institute of Architects (AIA) [5] recognized the various benefits of using BEM to the stakeholders involved in energy-efficient building projects. BEM helps designers create energy-efficient buildings using a performance-based approach. Performance-based modeling provides buildings owners with reduced life-cycle cost for the project (e.g., reduced initial cost, change orders, operation and maintenance costs) while building occupants experience higher level of comfort and consequently higher satisfaction with their indoor environment.
Design of energy efficient buildings requires validation of building performance which is typically completed using building simulation software [7]. In addition, designing energy-efficient buildings is not intuitive [2] and interactions among various parameters of these buildings are best studied using BEM tools [6]. According to Bambardekar and Poerschke [10], there is very limited guidance to architects for understanding and integrating BEM in the design process. In addition, they noted that selection of BEM tools is not a trivial task and that it requires better guidance [10]. Architects have a limited background in energy simulation and often do not understand how to translate design concepts into BEM tools [2,10]. They prefer using intuition and rule of thumb approaches rather than using BEM [10]. As there are several existing BEM tools available, there is a need to evaluate how these various tools can be used within the architecture, engineering, construction, and operation and maintenance (AECOM) industry [8,10,11,12]. There is also a need to provide a guide for selection of the appropriate BEM tool to facilitate energy simulations [10]. Therefore, the goal of this research was to develop guidelines for evaluation, selection and application of BEM for the energy analysis of buildings in the various lifecycle phases (design, construction, and operation/maintenance). In particular, the research focused on whole building energy use, daylighting, and natural ventilation potential. Intended users of the guidelines are building designers, green building consultants, contractors, and facility managers. The research objectives were to:
(1)
Evaluate major existing BEM software tools.
(2)
Illustrate the application of the three BEM tools selected based on the initial evaluation.
(3)
Re-evaluate the three BEM tools using an updated set of criteria.
(4)
Develop a set of guidelines to help potential BEM users evaluate, select and use the most appropriate BEM tool.
The major contribution of this research is the development of guidelines for the evaluation and selection of BEM tools relative to application and usability of the tools in various phases of the building lifecycle. As discussed earlier, previous research identified the need for the development of such guidelines as there are many BEM tools available and typical project stakeholders (architects, contractors, facility managers) find it challenging to use some of these BEM tools.

2. Literature Review

BEM may be utilized in various phases of the building lifecycle to improve building energy performance [4,13]. In the design phase, design professionals can use BEM simulations to analyze the energy performance of various design alternatives in order to select the most efficient design [6,8,9,14,15]. In the construction phase, BEM is used mostly to assess different alternatives that are created due to change orders [6,8]. In the building operation phase, BEM can be used to predict actual building performance [8,16]. Use of BEM to predict actual energy consumption during building operation requires calibrating the building energy model to be as close as possible to how the building will actually be built, occupied and operated [17]. In either case, BEM can be used as a decision support tool that simulates building performance under idealized conditions [18] or under realistic conditions [14]. Idealized conditions focus primarily on parameters like building geometry, structure, materials, and HVAC, and do not include real-life parameters such as building occupant behavior. On the other hand, realistic conditions consider building occupant behavior for which information can be gathered by using actual measured data or by conducting surveys of building occupants [14,19,20].
The level of detail of an energy model and depth of energy analysis depend on the building lifecycle phase [8]. For example, in the conceptual design phase simple models and quick analysis are sufficient [11] while in the design development and construction documents phase more detailed models and in-depth energy analysis are necessary [8]. In the construction phase, a detail model is used to conduct a comprehensive evaluation of the effect of change orders and construction detailing. The detailed model is also required in the building operation phase in order to conduct in-depth analysis of the building’s actual energy performance [8].

2.1. BIM and BEM

The emergence of BIM in the building industry has allowed for increased collaboration among building design and construction project members [13,15,21,22]. In the traditional project delivery method, the work of architects, structural engineers, MEP engineers, contractors, and various other building consultants occurs in relative isolation to one another. However, BIM-based project delivery facilitates collaboration among the project stakeholders [13,15,21,22]. In this case, information available to the various parties can all be shared and integrated around a central building information model [1]. In addition, immersive virtual environments (IVEs) combine pre-construction mock-up that presents a sense of real space to the future users and building information models that allow for testing of different design alternatives [22,23]. Use of IVEs provides designers and engineers with the opportunity to collect information about occupant behavior [22]. This information can be very helpful for making decisions during the project design phase.
According to the US GSA [8], in the case of a traditional energy modeling approach, an energy modeler uses traditionally created drawings and creates an independent model in an energy modeling tool. This may lead to misinterpretation of the drawings, inconsistencies, simplified model, and large amount of time needed to create an energy model. On the other hand, BIM-based energy modeling helps automate this process, and create consistent and more complex energy models [8]. In BIM-based project delivery, BEM is integrated into building design, construction, and operation/maintenance more efficiently because energy performance is analyzed using the central BIM model without having to recreate building geometry in certain BEM platforms (i.e., gbXML-enabled BEM tools). In addition, BIM-based sustainability analysis provides the results faster as compared to the traditional methods [1]. Although there is a need for higher levels of interoperability between BIM and BEM tools [24], the efficiency and accuracy of BIM-based energy modeling is constantly improving [9].

2.2. Use of BEM in the Building Design Phase

Many of the most important decisions related to energy efficiency are made early on in the design process [4,9,12,15,25]. The earlier BEM simulations are performed in the design process the more energy savings can be achieved later on in the project [7]. Therefore, the use of BEM tools can be very beneficial during the design phase [2,10,15,24]. BEM simulations can be used to assess the energy benefits of various design alternatives and thus help designers and owners make better decisions related to building performance [8,12] and lifecycle cost benefits [26]. Building designers use BEM as a design tool to analyze the performance of building design iterations through BEM simulations [12]. In the design phase a need for the qualitative comparison of design alternatives is more important than accuracy of simulation results [2,10]. The Chartered Institution of Building Service Engineers (CIBSE) [27] proposed two methods for integrating BEM in design: (1) applying simplified simulation tools in the early design phase and more detailed tools in the detailed design phases, and (2) using a sophisticated single simulation tool in all the design phases. The advantage of the second method is that with the use of the single tool the same building energy model is used by different team members in all the design phases. This approach also eliminates errors that may occur due to use of different BEM tools [28]. Similarly, Hemsath [7] suggested using multiple BEM tools throughout the design process depending on the design phase and the scope of simulation.
BEM can help designers achieve sustainable buildings by providing tools that can be used for energy analysis, selecting materials and products that have low environmental impact, and evaluating projects for LEED compliance [21]. Stadel et al. [26] showed how certain BIM platforms (e.g., Revit) that are able to quickly perform quantity takeoffs can be used in connection with certain BEM software (e.g., Green Building Studio™ Revit Plugin, IES VE™ Revit Plugin, and SimaPro). These software tools can be used for performing lifecycle analysis in order to estimate the environmental impact (in terms of lifecycle energy consumption and greenhouse gas emissions) of building materials from the cradle to grave phases.
Effective use of BEM can span from the conceptual design phase [2,5,12], through the design development and the construction documents phase [8]. In the preliminary conceptual design phase, the BEM model is typically used for evaluating the impact of building location and orientation, building massing, and building envelope while in the final conceptual design phase alternative designs are compared in regard to the various building layouts, building component structures and HVAC systems [5,6,7,8]. More detail energy performance analysis is conducted in the design development phase by using BEM to evaluate the effect of different building systems and subsystems such as windows, insulations, and control systems [5,6,7]. In the final construction document phase, additional BEM analysis is performed to make sure that the building design meets all the required energy codes and, if desired, green building certification requirements [5,6,7,8].
Donn et al. [12] illustrated the effective implementation of BEM simulations in the early stages of the design process using the building performance sketch approach. The goal of their research was to assess the use of detailed simulation tools during early design stages when there is greater freedom to explore various design concepts and greater ability to improve building performance. The two main criteria that Donn et al. [12] used for determining a high quality simulation tool were speed and accuracy. Evaluating the speed of a simulation tool is necessary in order to provide feedback quickly enough to keep up with the rapid pace of the design sketch process. Accuracy is necessary to ensure that the results are reliable [14] and the subsequent design decisions are effective [12]. The building performance sketch was compared to the BIM-based simulation workflow in which a relatively complete, whole-building information model is first finalized and then design iterations are analyzed based on feedback from the simulation tool [12]. The BIM-based workflow requires that the building design is relatively complete [1]. Another limitation of the BIM-based workflow is that by the time the design is ready for energy analysis, many of the design decisions that carry the greatest weight in regard to overall energy consumption have already been made and fewer design changes are possible [15].
Heydarian et al. [19] found that bringing real world human data from the physical world into the simulation model is a challenge for building designers. According to Heydarian et al. [19] the use of virtual reality technologies can help building designers evaluate different design alternatives. Thus, Heydarian et al. [19] used an immersive virtual environment (IVE) to create different design alternatives and to provide realistic representation of the physical environment. The building occupant input was incorporated in these IVE models by allowing occupants to control lighting settings.
Attia et al. [2] noted that architects found it difficult to integrate existing BEM tools into design of zero-energy buildings. At the same time, Attia et al. [2] understood the importance of including building performance evaluation in the early design stages of zero-energy buildings. In addition, they noted that no existing BEM tool was applicable to the design of zero-energy buildings. Therefore, Attia et al. [2] developed an energy software tool that provided support for decision making in the early design of zero-energy buildings. This tool could assist architects in making decision about building parameters that would help achieve zero-energy building as well as perform sensitivity analysis of these parameters.

2.3. Use of BEM in the Building Construction Phase

For building constructors, use of BEM is especially beneficial on projects that must meet certain performance requirements [21]. During the construction phase, BEM can be used to analyze data related to heating and cooling loads in order to determine the size of the HVAC systems, evaluate targeted light levels [21], assess the environmental impacts of change orders, and evaluate and compare performance of different materials or equipment options when selecting manufacturers, subcontractors, and material suppliers [6,8].
BEM is also useful to contractors for material documentation during the construction phase [1]. For example, material documentation is necessary to obtain LEED credit points related to reusable/recyclable material selection (Materials and Resources Credits), and non-toxic materials (Indoor Environmental Quality Credits) [1,29]. Azhar et al. [1] demonstrated the usefulness of BEM by integrating BEM into a Revit™-based BIM workflow for the purpose of material documentation. Azhar et al. [1] exported the BIM model from Revit™ as a gbXML file and imported it into the BEM software IES VE™. The software used the material takeoffs created in Revit™ to generate reports analyzing the building model for compliance with LEED.
In their assessment of three BEM tools, Stadel et al. [26] noted certain limitations in the Green Building Studio™ Revit Plugin and the IES VE™ Revit Plugin which included the inability to account for energy consumption and greenhouse gas emissions related to material activities during the construction phase (e.g., material transportation and processing).

2.4. Use of BEM in the Building Operation and Maintenance Phase

In the operation phase, BEM can be used to monitor actual building performance and identify building systems that may not function properly [6,8,23]. If renovation or remodeling needs to be performed during the maintenance phase, BEM can be used to identify the most energy efficient retrofit model [8]. In other words, for the purpose of improving building performance in the facility management phase, BEM may be used to help identify errors in HVAC system operation, and predict potential energy savings related to adjustments in system levels and building retrofits [30].
There are a few limitations on BEM use in the operations phase of the building lifecycle. For example, evaluation of energy advanced buildings (e.g., zero-net-energy building) shows that the actual performance of some of them is not as expected or designed [12]. Another limitation is BEM’s inability to simulate building performance under realistic conditions. Simulating building energy performance under realistic conditions, i.e., including occupant behavior, is needed in order to obtain more accurate results [14,19,20,22]. Inaccurate input related to occupant behavior and building operation is a common and substantial source of error in building performance simulations under realistic conditions [12,14]. Thus, understanding the difference between the actual and optimum behavior is very important [12]. Occupant behavior is typically represented by setting indoor temperature, and schedule of appliances, lighting and HVAC systems [12,14]. These parameters are highly variable and unpredictable [14]. Meanwhile, these parameters also significantly affect actual energy consumption and building performance [31].
A number of energy analysis studies have offered solutions to mitigate the disparities between predicted occupancy and operation, and actual building occupancy and operation, and the resulting energy model inaccuracies. One solution is to calibrate the energy model with measured data from actual building operation [8,14]. Adjustments made to occupancy schedules and operational profiles can be made based on the observations of actual building users to more accurately input when and to what extent the building is occupied, and how certain building systems (e.g., operable windows, artificial lighting, blinds, etc.) are operated [14]. This strategy is illustrated in a case study conducted by Knight et al. [32], in which a survey of building occupants for an educational building in the U.K. was used to generate detailed schedules and operational profiles for more than 300 spaces in the building energy model. According to this study, the use of building occupant surveys and other post-occupancy evaluations is considered a useful method to improve the energy model accuracy during building operation.
Jazizadeh et al. [20] noted that field studies that include occupant surveys was one of the methods that can be used to assess occupants comfort. However, they thought that these field studies did not reflect real-time occupant comfort on ongoing basis as surveys were typically conducted only once or periodically. Therefore, Jazizadeh et al. [20] proposed a framework for human-building interaction for thermal comfort which allows occupants to have personalized control of their thermal comfort as well as of HVAC systems in office buildings. The framework applied a participatory sensing approach via smart-phone application.
BEM can also be utilized during the building operation phase to synchronize energy model inputs with a real-time data feed from actual building operation. This synchronization is used to both calibrate the model with actual building performance and to optimize system operation. Platt et al. [33] demonstrated how a live feed of measured data from actual building operation is used to continuously update and calibrate the operational inputs in the energy model. Platt et al. [33] used a genetic algorithm to define the energy model inputs to optimize model accuracy. They demonstrated how an energy model can continuously be calibrated and adapted to the dynamism of various parameters that affect the actual HVAC zone environment. Adaptive energy models can both increase model accuracy and improve energy efficiency through the analysis of resultant parameter inputs and potential operational changes in the actual building. The resultant inputs provided by the genetic algorithms and the data obtained by post-occupancy evaluations provide insight into improving accuracy for energy models used in earlier building lifecycle phases.

2.5. Evaluation of BEM Tools

The literature review in the previous subsections of this paper illustrated how BEM can be utilized for a variety of purposes and in different phases of the building lifecycle. BEM tools are also tailored to specific user groups (e.g., architects, engineers, contractors, and facility managers). Previous research focused on evaluating existing BEM tools using a variety of criteria to assess BEM capabilities and features.
Attia et al. [34] conducted a survey of architects involved in design of sustainable buildings in order to evaluate existing BEM tools. Architects were asked to compare 10 major BEM tools using two criteria: (1) usability and information management interface; and (2) integration of intelligent design knowledge-base. In regard to usability and information management interface, architects expressed the need for greater user-friendliness of the graphical user interface. Architects also expressed the need for a 3D environment for the energy model, and the desire for generating comparative reports for different design alternatives. In regard to the integration of the intelligent design knowledge-base, the survey results showed that the most desired BEM capabilities were feedback on building code and rating system compliances, ability to provide weather data, and extensive building component and system libraries. Attia et al. [34] concluded that the 10 BEM tools examined did not meet the needs expressed by the architects that responded to the survey, and that IES VE, eQuest, and HEED were the most “architect friendly” BEM tools.
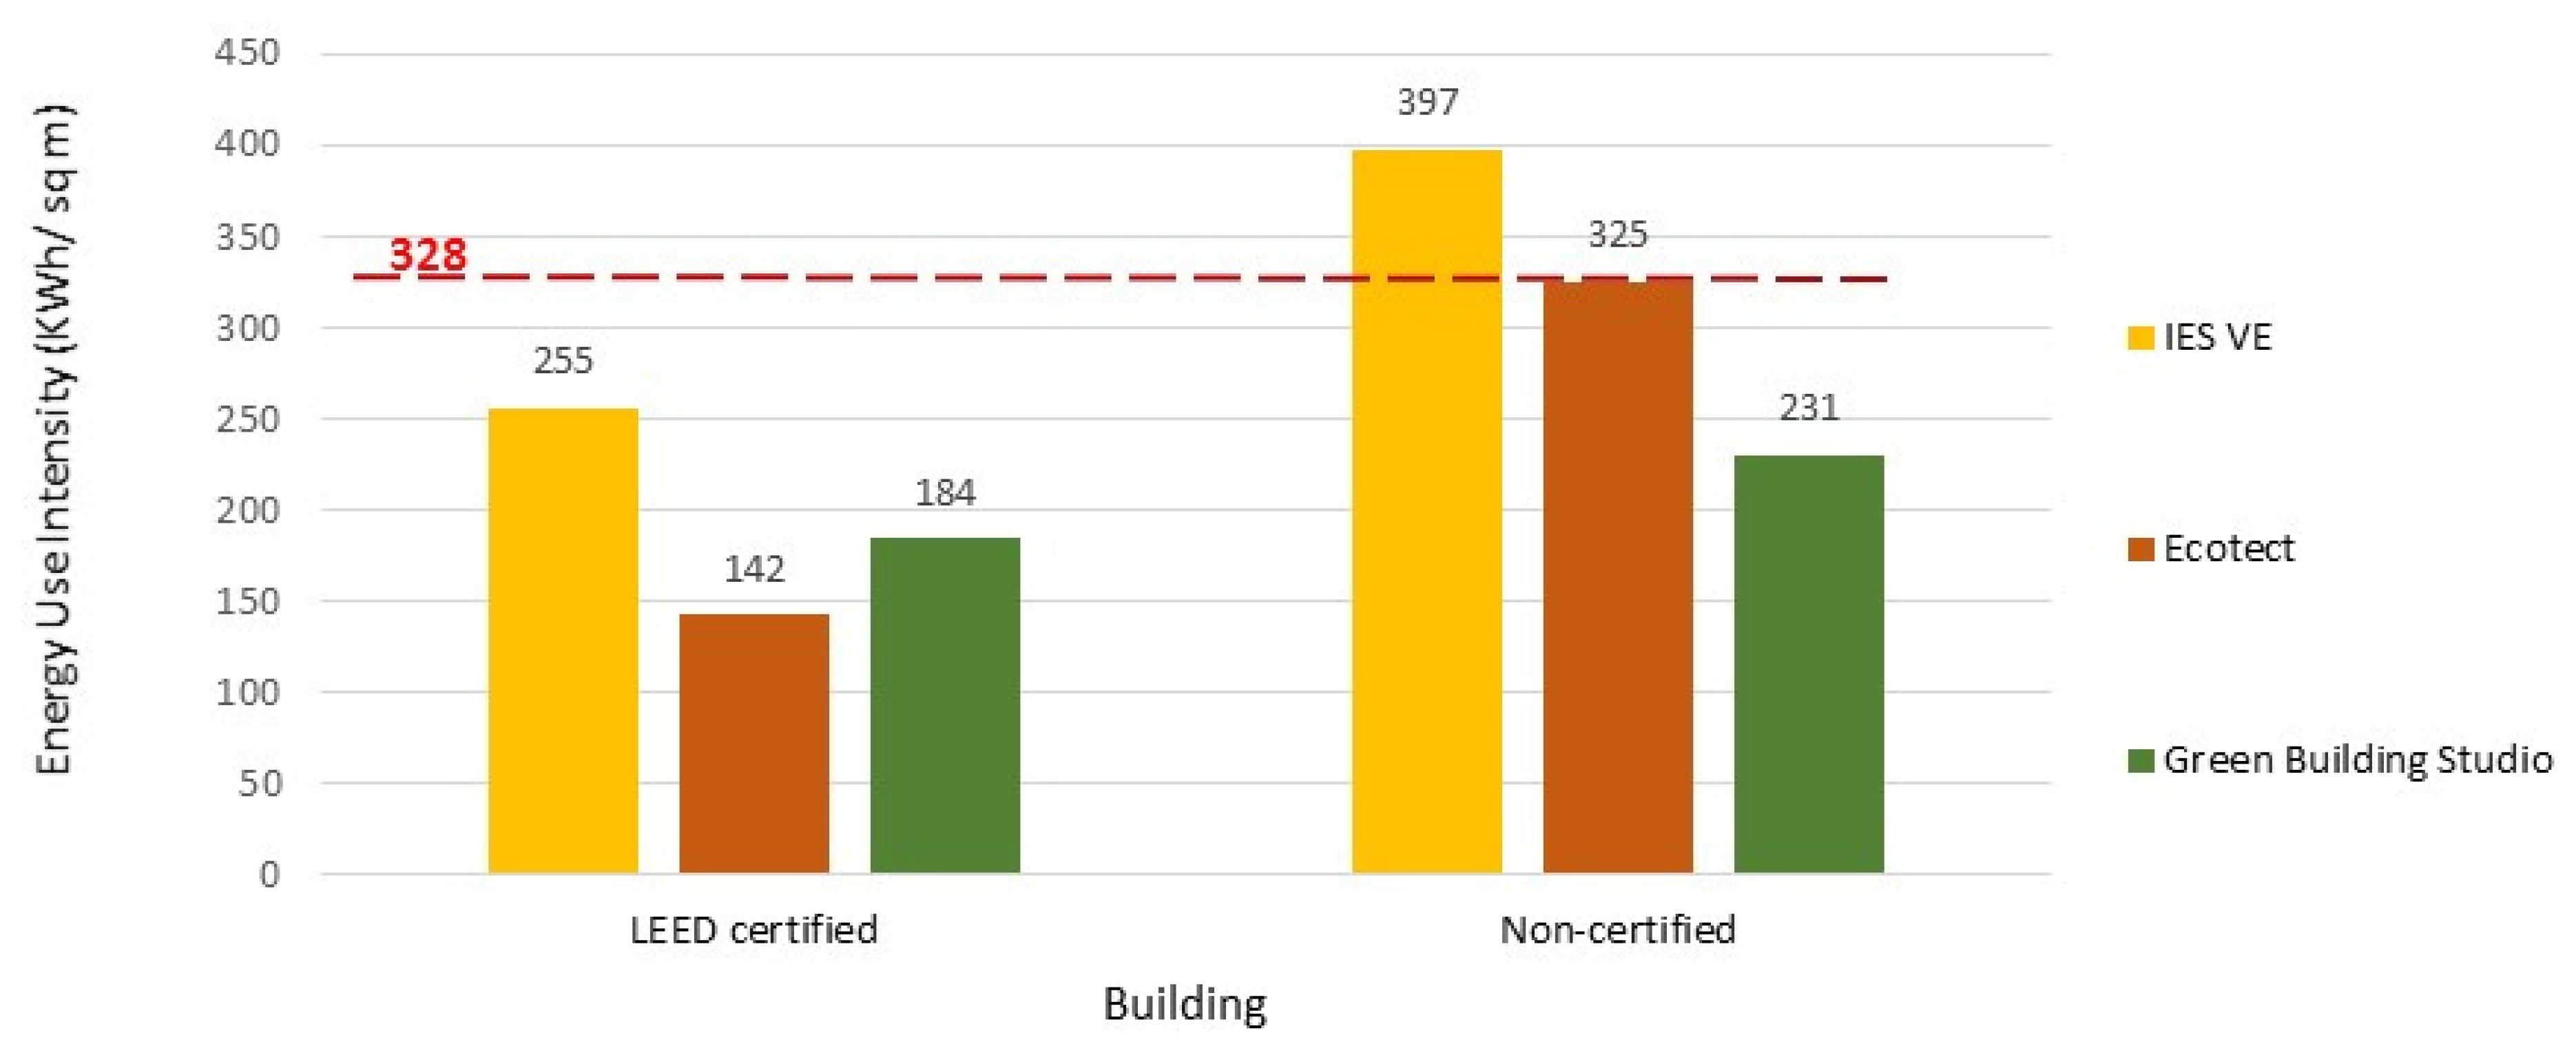
Azhar et al. [25] conducted an evaluation study in which they compared the capabilities, advantages, and disadvantages of three BEM tools (Ecotect, Green Building Studio, and IES VE). They concluded that IES VE was the strongest of the three BEM tools based on its range of analysis options.
Crawley et al. [11] compared 20 BEM tools in terms of their capabilities and features. The BEM features included in the comparison were organized into the following categories: modeling features; zone loads; building envelope; daylighting and solar; infiltration, ventilation and multi-zone airflow; renewable energy systems; electrical systems; HVAC systems; HVAC equipment; environmental emissions; economic evaluation; climate data availability; results reporting; validation; user interface, links to other programs, and availability. This evaluation of BEM tools provided users with a checklist of capabilities for the 20 BEM tools evaluated, and can be helpful for users with a specific set of BEM requirements.

3. Research Method

In order to accomplish the objectives of this research four primary tasks were executed: (1) Performing an initial evaluation of the existing BEM tools; (2) Conducting a case study utilizing the top three BEM tools identified in the initial evaluation; (3) Re-evaluating the top three BEM tools, and (4) Developing a set of guidelines to aid BEM users in the evaluation, selection and use of the most appropriate BEM tool in a specific lifecycle phase.

3.1. Initial Evaluation of Existing BEM Tools

A literature review was conducted to select the BEM tools for the initial evaluation. The 12 major existing BEM tools selected for the initial evaluation were: Graphisoft EcoDesigner, Bentley Tas Simulator V8i, Bentley Hevacomp Simulator V8i, Autodesk Ecotect, Autodesk Green Building Studio, IES VE, DesignBuilder, Visual DOE 4.0, Energy10, EnergyPlus, eQuest and HEED. The four criteria used in the initial evaluation were: interoperability, usability, available inputs, and available outputs. Each criterion was assessed through a number of sub-criteria (Figure 1). The evaluation criteria and sub-criteria were identified based on the literature review. The scoring system in this study placed an even weight of maximum 1 point for each criterion satisfied with a criterion score based on the percentage of the sub-criteria supported by the BEM tool. For example, the interoperability criterion included five sub-criteria: interoperability with Revit, Archicad, SketchUp, DXF import and gbXML import. If a BEM software tool scored 1 for each interoperability sub-criterion, the total score at the sub-criteria level would be 5. Based on this maximum total score for all sub-criteria, the achieved score for the interoperability criterion would be equal to 1.
Figure 1. Initial evaluation scoring system with criteria and sub-criteria.
Buildings 05 01361 g001

3.2. Case Study

A case study was conducted to illustrate the application of BEM tools. The top three BEM tools identified in the initial evaluation stage were used in the case study. The performances of two buildings located on a University campus in Gainesville, Florida, USA: Rinker Hall (a LEED gold-certified building) and Gerson Hall (a non-LEED certified building) were compared. BIM models of each building were created using the Revit Architecture software. Each model was exported as a gbXML file from Revit Architecture to each of the three BEM tools. Specifications pertinent to each building’s performance were input into the BEM tools (Table 1). Each BEM tool was used to simulate the buildings’ performance in three categories: annual energy usage, daylighting, and natural ventilation.
Table 1. Specifications of buildings used in the case study.
Building CharacteristicsLEED CertifiedNon-Certified
Date of completion20032004
LocationGainesville, FL, USAGainesville, FL, USA
Area of conditioned space3969 sq·m3589 sq·m
HVAC systemVariable Air Volume with Energy Recovery VentilationVariable Air Volume with Terminal Reheat
Building envelope construction (from exterior to interior)1.9 cm metal panel, 14 cm R20 cellulose insulation, 5.1 cm rigid insul., 1.3 cm gypsum board10.2 cm brick veneer, 5.1 cm air gap/damproofing, 30.5 cm CMU, 1.6 cm GWB on 3.8 cm studs with rigid insul.
Exterior wall U-Value0.0330.097
Glazing typeLow-E, double-glazed, insulatedLow-E, double-glazed
Glazing U-Value0.530.66
Window-to-Wall Area Ratio0.220.20
Albedo (Roof Reflectance)0.800.41

3.3. Re-Evaluation of Top Three BEM Tools

Upon completion of the case study, a re-evaluation of the top three BEM tools was performed using an updated set of criteria. Information gathered during the case study was used to revise the scoring system used in the initial evaluation and develop a new set of criteria and sub-criteria to be used in the re-evaluation phase (Figure 2). In addition to the criteria used in the initial evaluation, the scoring system in the re-evaluation phase included the additional criteria of speed and accuracy. The speed of a BEM tool was evaluated based on the amount of time needed to perform simulations of energy usage, daylighting, and natural ventilation. Accuracy was assessed based on the percent differences between the simulation results and actual/measured data for the two buildings. The re-evaluation scoring system also added a few new sub-criteria to the two criteria (i.e., to available inputs and available outputs).
The best BEM tool was selected by evenly weighting each of the six criteria. A matrix that applies different weights to criteria based on order of importance for the potential user was developed. Using this approach, potential BEM users can use the matrix by first identifying the order of importance of the six criteria, and then selecting the best BEM tool relative to the user’s criteria preference.

3.4. Development of Guidelines for Selecting, Evaluating and Using BEM Tools

Guidelines for BEM evaluation, selection and application were developed using data gathered in the re-evaluation phase of this research and organized around the various building lifecycle phases (such as design, construction and facility management) in which BEM can be applied.
Figure 2. Re-evaluation scoring system with criteria and sub-criteria.
Buildings 05 01361 g002

4. Results

4.1. Results of Initial Evaluation of the Existing BEM tools

The top three BEM tools identified by the initial evaluation had a score larger than 3 points. IES VE™ scored 3.38 (out of 4 possible points), Ecotect™ scored 3.14, and Green Building Studio™ had a score of 3.06 (Figure 3). The major factors that distinguished these three tools from the other tools were high interoperability and available outputs. eQuest which had the fourth highest score did not perform well in regards to interoperability and usability as compared to the top three BEM tools. For more details on initial evaluation and calculations of the scores, see Appendix, Table A1, Table A2, Table A3, Table A4, Table A5 and Table A6.

4.2. Results of the Case Study

The top three BEM tools identified by the initial evaluation (IES VE, Ecotect, and Green Building Studio) were used in the case study. Simulations of each building were performed using each BEM tool to assess energy usage, daylighting, and natural ventilation in order to understand the process of using the BEM tools. The secondary objective of conducting the case study was to compare the environmental performance of the two buildings.
Figure 3. Initial evaluation scores.
Buildings 05 01361 g003
The simulation results of energy usage showed that Rinker Hall, the LEED gold-certified building, performed better than Gerson Hall, the non-certified building. Energy use intensity (EUI) was used as the metric to compare energy performance, because EUI eliminates any differences between the two buildings’ energy consumption that may be attributed to differences in areas of conditioned space. The LEED certified building performed better than non-certified building in terms of total annual energy usage as well as energy use intensity (Figure 4). This finding was consistent for the simulation results obtained by using all three BEM tools.
The Ecotect simulation results showed that the LEED certified building would consume less energy than non-certified building (56% difference between EUIs). Simulation results obtained from Green Building Studio also showed that the LEED certified building would consume less energy than the non-certified building (20% difference between EUIs). Similarly, the IES VE simulations estimated that the LEED certified building would consume less energy than the non-LEED certified building (36% difference between EUIs). Both the Ecotect and the Green Building Studio simulation results showed that both buildings have EUI lower than the median value of 328 kWh/sq·m recommended by U.S. Energy Information Administration [35]. In the case of the IES VE simulation results, the non-certified building has an EUI higher than the median value of 328 kWh/sq·m, while the EUI of the LEED certified building was lower than 328 kWh/sq·m.
Four rooms from each building were selected to compare the daylighting performance (Table 2). Similar rooms based on room function, area, and glazing orientation in the two buildings were compared using daylight factor as the common parameter that was available as the output of the three BEM tools.
Figure 4. Energy use intensity (EUI) comparison by building and by building energy modeling (BEM) tool. Dashed line denotes the national median EUI for educational building types (328 kWh/sq·m).
Buildings 05 01361 g004
Table 2. Characteristics of the rooms used in daylighting analysis.
LEED Certified BuildingNon-Certified Building
Room FunctionArea (sq·m)Glazing OrientationRoom FunctionArea (sq·m)Glazing Orientation
Main Conference55NorthLarge Conference71North
Faculty Office13WestOffice14North
Est./Dwg./Sch. Class.124EastMedium Classroom108East
Grad. Stud. Office49EastPhD Office25North
Daylighting performances of the two buildings could be compared within each BEM tool, but results could not be compared between the three BEM tools due to the fact that the daylight factor was not calculated in a consistent manner. Only Ecotect and IES VE allow the user to specify in the model the location of the sensor points at which the daylight level is measured. None of the three BEM tools allows the user to specify the date and time at which the daylight factor is calculated.
The rooms in the LEED certified building, with some exceptions, had higher daylight factors than their counterparts in the non-certified building (Table 3). According to the simulation results obtained from each BEM tool, the LEED certified building’s conference room, classroom, and graduate student office suite performed better than those in the non-certified building. The faculty office had mixed results based on the Ecotect and Green Building Studio simulation results that predicted higher daylight factors in the faculty office in the non-certified building. However, IES VE simulation results showed that the faculty office in the LEED certified building performed better.
Table 3. Comparison of daylight factors (for the selected rooms and the three building energy modeling (BEM) software). Bolded values are greater than the minimum required daylight factor (2%) for adequate daylighting.
Room FunctionBuildingIES VEEcotectGreen Building Studio
Conference RoomLEED certif.13.70%11.48%6.30%
non-certified4.80%3.37%0.70%
Faculty OfficeLEED certif.6.40%2.74%0.30%
non-certified5.00%3.22%1.00%
ClassroomLEED certif.3.80%3.98%0.80%
non-certified1.10%3.00%0.20%
Grad. Stud. OfficeLEED certif.2.60%3.89%0.90%
non-certified3.10%1.79%0.50%
Each of the three BEM tools uses a different method to evaluate natural ventilation. Potential energy savings from natural ventilation were calculated in the Ecotect by subtracting the overall energy use of the models with natural ventilation activated from energy use values of the benchmark models. The Ecotect simulations showed that the non-certified building (potential savings of 142,043 kWh) could possibly save more energy (35% difference) than the LEED certified building (potential savings of 92,516 kWh). Green Building Studio provided outputs related to the amount of energy that could be saved through the use of natural ventilation. The Green Building Studio simulations showed that the non-certified building (potential savings of 57,883 kWh) could possibly save more energy (44% difference) through natural ventilation than the LEED certified building (potential savings of 32,254 kWh). IES VE assesses natural ventilation by providing average annual infiltration rates in units of cubic decimeters per minute (cu dm m) per square meter for each zone. The non-certified building had an average natural ventilation rate of 10.1 cu dm m per square meter averaged over the entire inhabitable building floor area compared to LEED certified building’s average natural ventilation rate of 6.7 cu dm m per square meter. Thus, the non-certified building seemed to have a 33% higher ventilation rate than the LEED certified building.

4.3. Results of Re-Evaluation of the Top Three BEM Tools

Based on the re-evaluation, IES VE had the highest comprehensive score (4.34 out of 6 possible points) when criteria were weighted equally (Figure 5). Green Building Studio achieved the score of 3.44, while Ecotect scored 3.40 points. Out of the six different criteria used in the re-evaluation, IES VE received the highest criterion score for four criteria. IES VE had the same score as the Ecotect in the criterion for interoperability, and the second highest score in the criterion of speed after the Green Building Studio. Ecotect and IES VE achieved the highest scores (score 0.61) in the criterion of interoperability followed by the Green Building Studio (score 0.33). IES VE had the highest score in the criterion of usability (score 0.73), while Green Building Studio followed with a score of 0.59 and Ecotect with a score of 0.55. IES VE also had the highest score in the criterion of available inputs with a score of 0.95, followed by Ecotect (score 0.91) and Green Building Studio (score 0.45). Regarding the criterion available outputs, IES VE had the highest score of 0.86, followed by Ecotect (score 0.81) and Green Building Studio (score 0.56). Green Building Studio had the highest score in the criterion of speed (1.00) followed by IES VE 1 (score 0.5) and Ecotect (score 0.0). Regarding the criterion of accuracy, IES VE achieved the highest score based on percent difference between the simulation results and the measured data for the two buildings used in the case study. IES VE’s accuracy score was 0.69 followed by Ecotect and Green Building Studio, each of which obtained a score of 0.52. For more details on re-evaluation and calculations of the scores, see Appendix, Table A7, Table A8, Table A9, Table A10, Table A11 and Table A12.
Figure 5. Re-evaluation scores (un-weighted).
Buildings 05 01361 g005

4.4. Guidelines for Evaluation, Selection and Application of BEM Tools

Existing BEM tools are diverse in terms of capabilities, inputs, outputs, and applicability in various building lifecycle phases. The guidelines developed by this research are meant to assist potential BEM users in evaluating and selecting the appropriate BEM tool for the user’s intended BEM application. The guidelines for BEM evaluation and selection include the following steps (Figure 6):
  • Step 1—Defining the building lifecycle phases in which the BEM tool is intended to be utilized.
  • Step 2—Defining the required inputs as necessary to utilize the BEM for the specified building lifecycle phase applications, and then using these inputs as a checklist of prerequisites when evaluating and selecting BEM tool.
  • Step 3—Defining the required outputs and using them as a checklist of prerequisites when evaluating and selecting BEM tool.
  • Step 4—Ranking other criteria for BEM evaluation and selection (e.g., interoperability, usability, and speed) in order of importance.
  • Step 5—Applying appropriate weights to the criteria (based on order of importance) and calculating the scores of the BEM tools that meet the prerequisites defined by steps 1 through 3.
Figure 6. Guidelines for BEM tool evaluation and selection.
Buildings 05 01361 g006
The steps of the BEM evaluation and selection process are related to the corresponding tables for required inputs, user-defined required outputs, and examples of other “soft” criteria for evaluation (e.g., interoperability and usability). Potential BEM users can use these guidelines as a template to develop their own specific system for BEM tool evaluation and selection that would incorporate the criteria and sub-criteria, which they find important for their project. Potential BEM users should first define the building lifecycle phases in which the BEM tool will be utilized. Certain BEM tools are geared only towards early design stages while others carry a wide range of capabilities and may be useful from the conceptual design to the facility management phase. The range of available inputs from a BEM tool is indicative of its applicability in various building lifecycle phases. Secondly, BEM users should ensure that the necessary inputs are included for the building lifecycle phases in which they intend to use BEM. For instance, BEM users that plan to use BEM in later building lifecycle phases, such as the facility management phase, should ensure that the BEM tool allows inputs for occupancy schedule, lighting schedule, equipment schedule, and plant data in order to calibrate the model with actual building operation. The degree of versatility of schedule implementation is particularly important. The capability of inputting user-defined schedules is necessary for calibrating the energy model with actual data obtained from building operation. These inputs should be treated as prerequisites to later BEM evaluation and selection criteria. Thirdly, BEM users should define a set of required outputs. These may serve as a checklist for users of the guidelines and may be considered prerequisites to later BEM evaluation and selection criteria. This step of the guidelines asks users to define the simulation and analysis types the user intends to perform with the BEM tool. The available outputs checklist is intended to be used to shortlist BEM tools that meet the user’s required outputs.
After narrowing down the potential BEM tools based on the user’s required inputs and outputs, other criteria may be integrated into the evaluation and selection process. These potential criteria for evaluation and selection can then be ranked in the user’s order of importance. Other criteria, such as those used in this research, may include usability, interoperability, and speed of simulation. Based on the user’s order of importance for these criteria, appropriate weightings can be applied for scoring purposes. For example, the most important criterion may multiply the respective score in the initial evaluation by three; the second most important criterion may multiply the score by two; and the third most important criterion may multiply the respective score by one. The weighted scores can then be added together to provide a cumulative score that should indicate the most appropriate BEM tool for the user’s specified BEM applications in a specific building lifecycle phase.

5. Conclusions

The various existing building energy modeling (BEM) tools present a wide range of capabilities and applications. Based on the criteria used to evaluate BEM tools in this research, IES VE was selected as the most appropriate BEM software when criteria were weighted evenly. However, the selection of a BEM tool is dependent on how the user intends to apply BEM and how BEM is incorporated into a design, construction and facility management workflow. For example, Green Building Studio may be a more appropriate selection for users requiring a faster output to compare numerous design iterations related to building specifications. As observed in the case study conducted in this research, there are also numerous BEM methodologies that can be adopted for various applications. As suggested by previous research, BEM has a wide range of applications spanning throughout the building lifecycle from conceptual design through the building operation and maintenance phases. Thus, the guidelines are intended to be used as a template that can be tailored to the specific needs of the user and intended applications of BEM. This research aimed at developing methods that can be used to evaluate and select BEM tools. The potential users of the evaluation methods can use them to evaluate different sets of actual commercial BEM software tools as compared to the set of software used in this research. In that case, they can still use the methods developed in this research for evaluating and selecting the most appropriate BEM tool for their needs.
This research evaluated BEM tools in a broader scope given the wide range of BEM applications as compared to previous BEM tool evaluations. The research contribution includes the development of guidelines for the evaluation and selection of the BEM tools in regard to their application and usability in different lifecycle phases of the building. As noted previously in this paper, previous research showed the need for development of BEM guidelines because there are various BEM tools available and typical project stakeholders (such as architects, contractors, and facility managers) find it often challenging to evaluate, select and use some of the BEM tools.

Author Contributions

This research is based on Thomas Reeves’ Master’s research. He conducted the research under the supervision of Svetlana Olbina who designed this research. Raja R. A. Issa was a co-chair of Thomas’ Master’s committee. All three authors contributed equally to writing of the paper.

Conflicts of Interest

The authors declare no conflict of interest.

Appendix

Table A1. Initial evaluation: interoperability criterion calculations for BEM tools.
BEM ToolWith RevitWith ArchicadWith Sketch UpDXF ImportgbXML ImportTotal Points (Out of 5)Percentage Score
HEED0000000.0
IES VE1111151.0
Energy-100000000.0
EnergyPlus0010010.2
Visual DOE 4.00001010.2
Design Builder0001010.2
Hevacomp Simulator V8i1101140.8
Ecotect1101140.8
Green Building Studio1101140.8
Tas V8i1101140.8
EcoDesigner1101140.8
eQuest1001130.6
Table A2. Initial evaluation: usability criterion calculations for BEM tools.
BEM ToolSimple User InterfaceProvides Extensive Weather/Climate DataDefault LibrariesRequires Minimal ExpertiseHelp FileUser Tutorials/Online SupportPotential for CustomizationProvides Feedback for Potential Design Changes to Improve Energy EfficiencyTotal Points (Out of 8)Percentage Score
HEED1011110160.75
IES VE1110110050.63
Energy-101110110160.75
EnergyPlus0110110040.50
Visual DOE 4.00110111050.63
Design Builder1011110050.63
Hevacomp Simulator V8i0110110040.50
Ecotect0110111050.63
Green Building Studio1110110160.75
Tas V8i0110110040.50
EcoDesigner0110110040.50
eQuest0110110040.50
Table A3. Initial evaluation: available inputs criterion calculations for BEM tools (Part 1).
BEM ToolHEEDIES VEEnergy-10EnergyPlusVisual DOE 4.0Design Builder
Floor plan110011
Openings111111
Material properties011111
Number of floors101100
OpenGL model000001
Location111110
gbXML model010000
Building geometry010011
Envelope construction111111
HVAC system011111
HVAC sizing010100
MEP model010000
Plant data010100
Occupancy010111
Lighting system010111
Interior objects000000
Weather data111110
Orientation011110
Number of Rooms010100
Room connections010100
Relation to exterior exposure000000
Building type/function010011
Setting (local terrain)000000
Required indoor temperature010100
Type of energy used010000
Total points (Out of 25)6208151210
Percentage Score0.240.80.320.60.480.4
Table A4. Initial evaluation: available inputs criterion calculations for BEM tools (Part 2).
BEM ToolHevacomp Simulator V8iEcotectGreen Building StudioTas V8iEcoDesignereQuest
Floor plan111111
Openings011011
Material properties011101
Number of floors000001
OpenGL model000000
Location111111
gbXML Model111111
Building geometry111111
Envelope construction111101
HVAC system111011
HVAC sizing110010
MEP model000000
Plant data000111
Occupancy010101
Lighting system010001
Interior objects100000
Weather data111111
Orientation011011
Number of Rooms011001
Room connections011000
Relation to exterior exposure001000
Building type/function011011
Setting (local terrain)010000
Required indoor temperature010011
Type of energy used010011
Total points (Out of 25)9191491318
Percentage Score0.360.760.560.360.520.72
Table A5. Initial evaluation: available outputs criterion calculations for BEM tools (Part 1).
BEM ToolHEEDIES VEEnergy-10EnergyPlusVisual DOE 4.0Design Builder
Energy usage111101
Carbon emissions 111101
Resource management010000
Thermal analysis111111
Heating/cooling load 011111
HVAC110111
Natural ventilation111101
Solar analysis011101
Daylighting 111111
Right-to-light 010000
Shading design010001
Lighting design010111
Lifecycle assessment010000
Lifecycle cost111000
Water usage010100
PV collection potential111000
Wind energy potential010000
Whole building energy analysis011100
LEED integration tools011010
Energy Star integration tools000000
Total points (Out of 20)8191111610
Percentage Score0.40.950.550.550.30.5
Table A6. Initial evaluation: available outputs criterion calculations for BEM tools (Part 2).
BEM ToolHevacomp Simulator V8iEcotectGreen Building StudioTas V8iEcoDesignereQuest
Energy usage111111
Carbon emissions011111
Resource management011000
Thermal analysis111111
Heating/cooling load111111
HVAC111111
Natural ventilation111101
Solar analysis111001
Daylighting111111
Right-to-light010000
Shading design111101
Lighting design011000
Lifecycle assessment001001
Lifecycle cost011101
Water usage011001
PV collection potential111001
Wind energy potential111000
Whole building energy analysis111001
LEED integration tools011100
Energy Star integration tools011000
Total points (Out of 20)11191910614
Percentage Score0.550.950.950.50.30.7
Table A7. Re-evaluation: interoperability criterion calculations for the top three BEM tools.
Interoperability Sub-CriteriaEcotectGreen Building StudioIES VE
Geometry translation (from Revit)0.50.50.5
Material translation (from Revit)0.500.5
Openings translation (from Revit)0.50.50.5
SketchUp plugin001
Import CAD geometry (DXF)101
Import IFC100
Import gbXML111
Export analysis data to Excel111
Total points (out of 8)5.535.5
Percentage score0.610.330.61
Table A8. Re-evaluation: usability criterion calculations for the top three BEM tools.
Usability Sub-CriteriaEcotectGreen Building StudioIES VE
Help file111
User forum111
Simple user interface010
Default libraries/templates111
gbXML import model error check001
Error check during simulation101
Automatic report generator011
Graphical User Interface (GUI)101
Requires minimal expertise00.50
Design alternative assistance010
Ability to edit model in BEM101
Total points (out of 11)66.58
Percentage score0.550.590.73
Table A9. Re-evaluation: available inputs criterion calculations for the top three BEM tools.
Available Inputs Sub-CriteriaEcotectGreen Building StudioIES VE
Available inputsHVAC type111
Heat recovery system100
Glazing specifications (low-e, tint, U value, visible transmittance)111
Automated lighting controls111
Construction (walls, roof, floor)111
Albedo111
Shade walls/louvers101
Lighting power density (LPD)111
HVAC design flow101
Local terrain111
Geographic location/climate111
Occupancy schedule101
Equipment/lighting schedule101
HVAC schedule101
Heating/cooling setpoint111
Equipment power density111
Fuel type111
System energy efficiency101
User-defined fan power101
Operable windows011
Operable windows schedule001
Versatility of inputsUser-defined constructions10.51
User-defined occupancy schedule101
User-defined equipment/lighting schedule101
User-defined heating/cooling schedule101
User-defined systems (HVAC)10.51
User-defined time step for calculations0.500.5
Zone-by-zone inputs101
Model builder101
Total points (out of 29)26.51327.5
Percentage score0.910.450.95
Table A10. Re-evaluation: available outputs criterion calculations for the top three BEM tools.
Available Outputs Sub-CriteriaEcotectGreen Building StudioIES VE
Available outputsEnergy usage 111
Carbon emissions 111
Resource management111
Thermal analysis101
Heating/cooling load breakdown111
Solar analysis101
Daylighting assessment 111
Lighting design101
Lifecycle cost analysis111
Ventilation and airflow analysis111
Water usage110
Design alternative comparison010
Versatility of outputsUser-defined time step0.500.5
User-defined reports/graphical outputs101
Graphical analysis over model101
Animation001
Room/zone level analysis101
Graphical comparison between design iterations011
Total points (out of 18)14.51015.5
Percentage score0.810.560.86
Table A11. Re-evaluation: speed criterion calculations for the top three BEM tools.
Speed Sub-CriteriaEcotectGreen Building StudioIES VE
Energy simulation time under 1 h011
Energy simulation time under 10 min010
Daylighting simulation time under 1 h011
Daylighting simulation time under 10 min010
Ventilation simulation time under 1 h011
Ventilation simulation time under 10 min010
Total points (out of 6)063
Percentage score010.5
Table A12. Re-evaluation: accuracy criterion calculations for the top three BEM tools.
Accuracy Sub-CriteriaEcotectGreen Building StudioIES VE
LEED certified building32.3752.0951.90
Non-certified building71.1152.7885.45
Total Points (out of 200)103.48104.87137.35
Percentage score0.520.520.69

References

  1. Azhar, S.; Carlton, W.A.; Olsen, D.; Ahmad, I. Building information modeling for sustainable design and LEED rating analysis. Automat. Constr. 2011, 20, 217–224. [Google Scholar] [CrossRef]
  2. Attia, S.; Gratia, E.; de Herde, A.; Hensen, J.L.M. Simulation-based decision support tool for early stages of zero-energy building design. Energy Build. 2012, 49, 2–15. [Google Scholar] [CrossRef]
  3. Bringezu, S. Construction ecology and metabolism. In Construction Ecology: Nature as the Basis for Green Buildings; Spon Press: New York, NY, USA, 2002; pp. 196–215. [Google Scholar]
  4. Cemesova, A.; Hopfe, C.; Mcleod, R. PassivBIM: Enhancing interoperability between BIM and low energy design software. Automat. Constr. 2015, 57, 17–32. [Google Scholar] [CrossRef] [Green Version]
  5. The American Institute of Architects (AIA). Integrating Energy Modeling in the Design Process; The American Institute of Architects: Washington, DC, USA, 2012. [Google Scholar]
  6. Hayter, S.; Torcellini, P.; Hayter, R.; Judkoff, R. The Energy Design Process for Designing and Constructing High-Performance Buildings. In Proceedings of the Clima 2000/Napoli 2001 World Congress, Napoli, Italy, 15–18 September 2001.
  7. Hemsath, T. Conceptual Energy Modeling for Architecture, Planning and Design: Impact of Using Building Performance Simulation in Early Design Stages. In Proceedings of the BS2013: 13th Conference of International Building Performance Simulation Association, Chambery, France, 26–28 August 2013; pp. 376–384.
  8. U.S. General Services Administration (GSA). GSA BIM Guide 05—Energy Performance. Version 2.1. Available online: http://www.gsa.gov/portal/mediaId/227119/fileName/GSA_BIM_Guide_05_Version_21.action (accessed on 15 June 2015).
  9. Kim, H.; Anderson, K. Energy modeling system using building information modeling (BIM) open standards. J. Comput. Civil Eng. 2013, 27, 203–211. [Google Scholar] [CrossRef]
  10. Bambardekar, S.; Poerschke, U. The Architect as Performer of Energy Simulation in the Early Design Stage. In Proceedings of the Eleventh International IBPSA Conference, Glasgow, UK, 27–30 July 2009.
  11. Crawley, D.B.; Hand, J.W.; Kummert, M.; Griffith, B.T. Contrasting the capabilities of building energy performance simulation programs. Build. Environ. 2008, 43, 661–673. [Google Scholar] [CrossRef] [Green Version]
  12. Donn, M.; Selkowitz, S.; Bordass, B. The building performance sketch. Build. Res. Inf. 2012, 40, 186–208. [Google Scholar] [CrossRef]
  13. O’Donnell, J.T.; Maile, T.; Rose, T.; Mrazović, N.; Morrissey, E.; Regnier, C.; Parrish, K.; Bazjanac, V. Transforming BIM to BEM: Generation of Building Geometry for the NASA Ames Sustainability Base BIM; Lawrence Berkley National Laboratory: Berkley, CA, USA, 2013; pp. 1–26. [Google Scholar]
  14. Ryan, E.M.; Sanquist, T.F. Validation of building energy modeling tools under idealized and realistic conditions. Energy Build. 2012, 47, 375–382. [Google Scholar] [CrossRef]
  15. Schlueter, A.; Thesseling, F. Building information model based energy/exergy performance assessment in early design stages. Automat. Constr. 2009, 18, 153–163. [Google Scholar] [CrossRef]
  16. Krygiel, E.; Nies, B. Green BIM: Successful Sustainable Design with Building Information Modeling; Wiley: New York, NY, USA, 2008; pp. 1–241. [Google Scholar]
  17. Summerfield, A.J.; Lowe, R. Challenges and future directions for energy and buildings research. Build. Res. Inf. 2012, 40, 391–400. [Google Scholar] [CrossRef]
  18. Donn, M. Simulation of Building Performance; VDM: Saarbrücken, Germany, 2009. [Google Scholar]
  19. Heydarian, A.; Carneiro, J.P.; Gerber, D.; Becerik-Gerber, B. Immersive virtual environments, understanding the impact of design features and occupant choice upon lighting for building performance. Build. Environ. 2015, 89, 217–228. [Google Scholar]
  20. Jazizadeh, F.; Ghahramani, A.; Becerik-Gerber, B.; Kichkaylo, T.; Orosz, M. Human-building interaction framework for personalized thermal comfort-driven systems in office buildings. J. Comput. Civil Eng. 2014, 28, 1–15. [Google Scholar] [CrossRef]
  21. Eastman, C.M.; Teicholz, P.; Sacks, R.; Liston, K. BIM Handbook: A Guide to Building Information Modeling for Owners, Managers, Designers, Engineers, and Contractors, 2nd ed.; John Wiley and Sons, Inc.: Hoboken, NJ, USA, 2011; pp. 1–626. [Google Scholar]
  22. Heydarian, A.; Pantazis, E.; Carneiro, J.P.; Gerber, D.; Becerik-Gerber, B. Use of Immersive Virtual Environments to Understand Human-Building Interactions and Improve Building Design. In Proceedings of the 2015 ASCE International Workshop on Computing in Civil Engineering, Austin, TX, USA, 21–23 June 2015.
  23. Heydarian, A.; Carneiro, J.P.; Gerber, D.; Becerik-Gerber, B.; Hayes, T.; Wood, W. Immersive virtual environments versus physical built environments: A benchmarking study for building design and user-built environment explorations. Automat. Constr. 2015, 54, 116–126. [Google Scholar]
  24. Bynum, P.; Issa, R.; Olbina, S. Building information modeling in support of sustainable design and construction. J. Constr. Eng. M. ACSE 2013, 139, 24–34. [Google Scholar] [CrossRef]
  25. Azhar, S.; Brown, J.; Farooqui, R. BIM-Based Sustainability Analysis: An Evaluation of Building Performance Analysis Software. In Proceedings of the 45th ASC Annual Conference, Gainesville, FL, USA, 1–4 April 2009.
  26. Stadel, A.; Eboli, J.; Ryberg, A.; Mitchell, J.; Spatari, S. Intelligent sustainable design: integration of carbon accounting and building information modeling. J. Prof. Iss. Eng. Ed. Pr. 2011, 137, 51–54. [Google Scholar] [CrossRef]
  27. Chartered Institution of Building Service Engineers (CIBSE). Application Manual AM11: Building Energy and Environmental Modelling; CIBSE: London, UK, 1998. [Google Scholar]
  28. Morbitzer, C.; Strachan, P.; Webster, J.; Spires, B.; Cafferty, D. Integration of Building Simulation into the Design Process of an Architectural Practice. In Proceedings of the 7th Conference of International Building Performance Simulation Association, Rio de Janeiro, Brazil, 13–15 August 2001.
  29. Wu, W.; Issa, R.R.A. BIM execution planning in green building projects: LEED as a use case. J. Manage. Eng. 2014, 31, 1943–5479. [Google Scholar] [CrossRef]
  30. Heo, Y.; Choudhary, R.; Augenbroe, G.A. Calibration of building energy models for retrofit analysis under uncertainty. Energy Build. 2012, 47, 550–560. [Google Scholar] [CrossRef]
  31. Berker, T.; Bharathi, K. Energy and buildings research: Challenges from the new production of knowledge. Build. Res. Inf. 2012, 40, 473–480. [Google Scholar] [CrossRef]
  32. Knight, I.; Stravoravdis, S.; Lasvaux, S. Assessing the Operational Energy Profiles of UK Educational Buildings: Findings from Detailed Surveys and Modeling Compared to Consumption. In Proceedings of the 2nd PALENC Conference and 28th AIVC Conference on Building Low Energy Cooling and Advanced Ventilation Technologies in the 21st Century, Crete Island, Greece, 27–29 September 2007; Santamouris, M., Wouters, P., Eds.; pp. 531–536.
  33. Platt, G.; Li, J.; Li, R.; Poulton, G.; James, G.; Wall, J. Adaptive HVAC Zone modeling for sustainable buildings. Energy Build. 2010, 42, 412–421. [Google Scholar] [CrossRef]
  34. Attia, S.; Beltran, L.; de Herde, A.; Hensen, J. “Architect Friendly”: A Comparison of Ten Different Building Performance Simulation Tools. In Proceedings of the Building Simulation, Eleventh International IBPSA Conference, Glasgow, UK, 27–30 July 2009; pp. 204–211.
  35. U.S. Energy Information Administration. 2003 Commercial Buildings Energy Consumption Survey. Available online: http://www.eia.gov/consumption/commercial/data/2003/index. cfm?view=consumption#c1a (accessed on 15 June 2015).

