
Energy Performance of Two Multi-Story Wood-Frame Passive Houses in Sweden

Abstract
:1. Introduction

| Climate Zone | Maximum Annual Purchased Energy (kWh/m2Atemp) | |||
|---|---|---|---|---|
| BBR 2014 (Mandatory) | FEBY 2012 (Recommended) [1] | |||
| Buildings with Electric Heating | Other Buildings | Buildings with Electric Heating | Other Buildings | |
| I (north Sweden) | 95 | 130 | 29 | 58 |
| II (central Sweden) | 75 | 110 | 27 | 54 |
| III (south Sweden) | 55 | 90 | 25 | 50 |
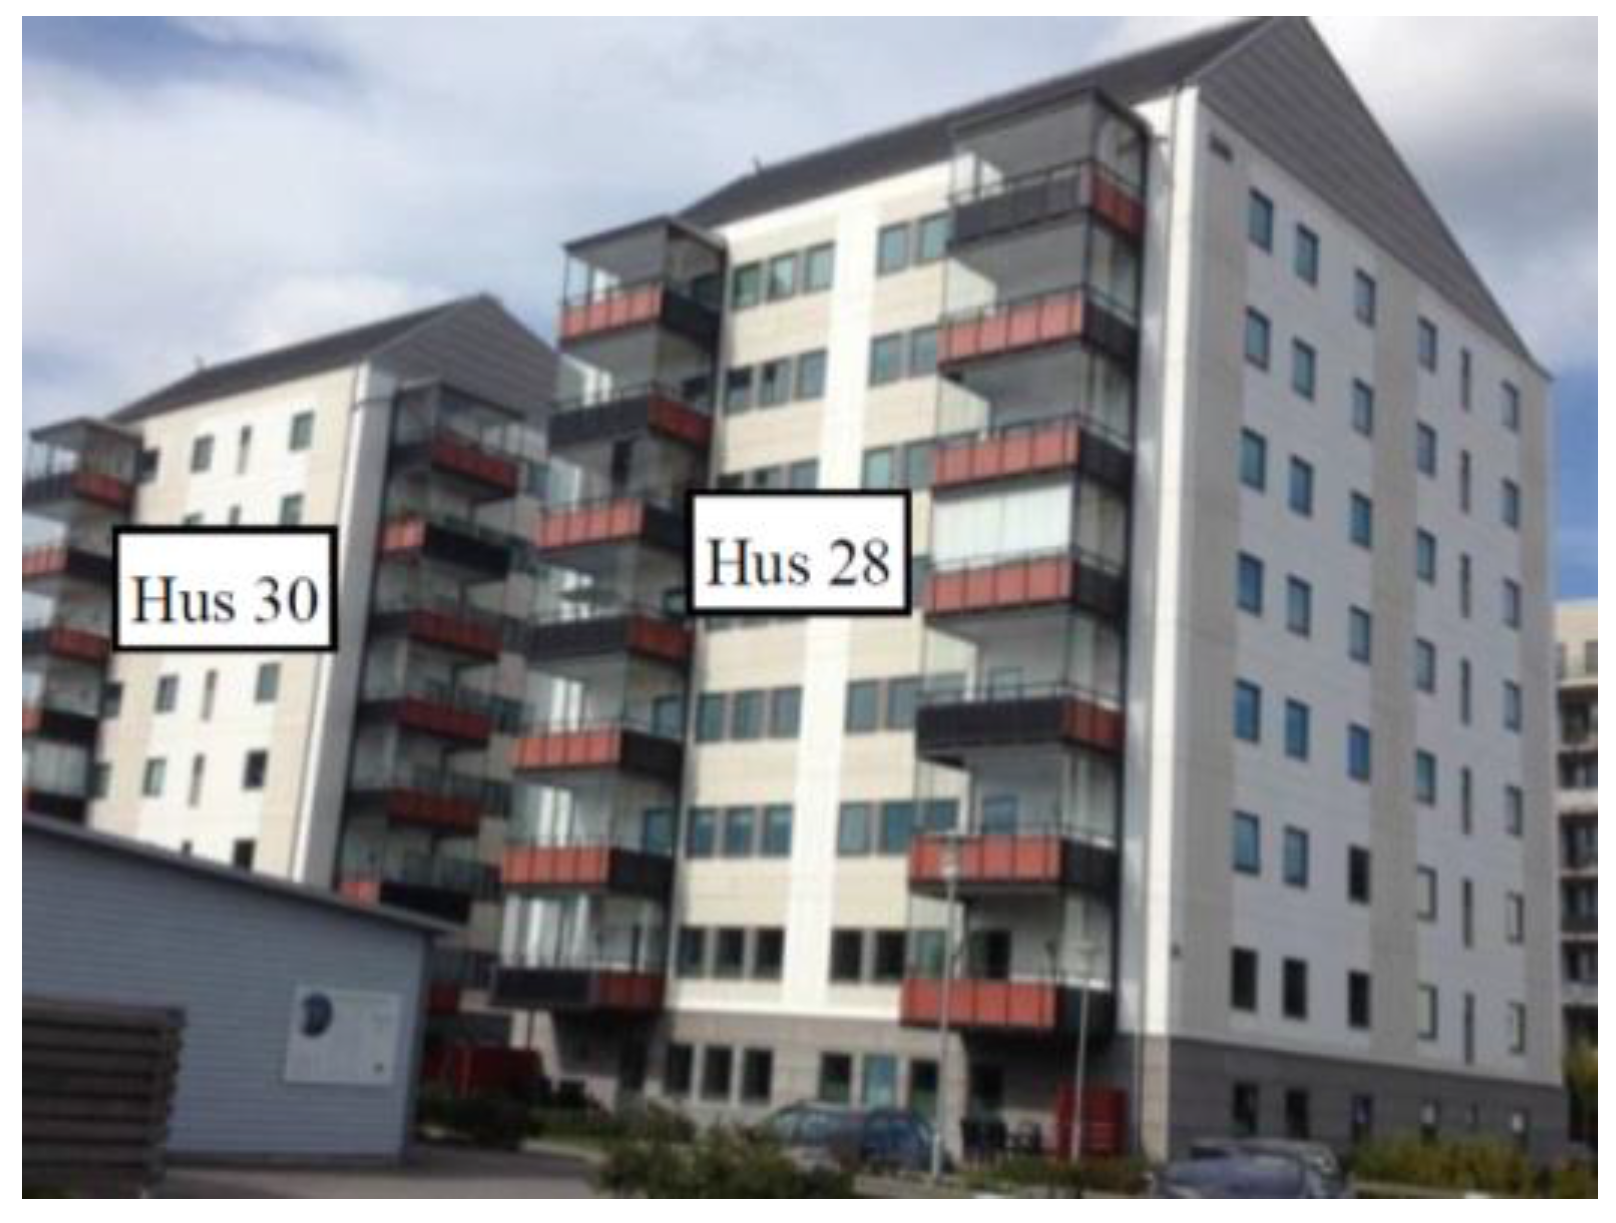
2. The Buildings
| Apartments | Hus 28 (Atemp = 3270 m2) | Hus 30 (Atemp = 2683 m2) | ||
|---|---|---|---|---|
| Number | Floor Area | Number | Floor Area | |
| 2 rok | 1 | 63.6 m2 | 17 | 60–63.5 m2 |
| 3 rok | 15 | 78.1–81 m2 | 15 | 77.9–80.2 m2 |
| 4 rok | 16 | 94.5 m2 | 0 | – |
3. Method
| Technology and Fuel | Share (%) | Conversion Efficiency, Lower Heating Value (%) | |
|---|---|---|---|
| Heat | Electricity | ||
| Combined heat and power (CHP) plant | |||
| Biomass | 76.4 | 80 | 30 |
| Peat | 5.8 | 80 | 30 |
| Oil | 2.0 | 56 | 34 |
| Heat-only boiler (HOB) | |||
| Biomass | 13.3 | 110 | – |
| Oil | 2.4 | 90 | – |
4. Results
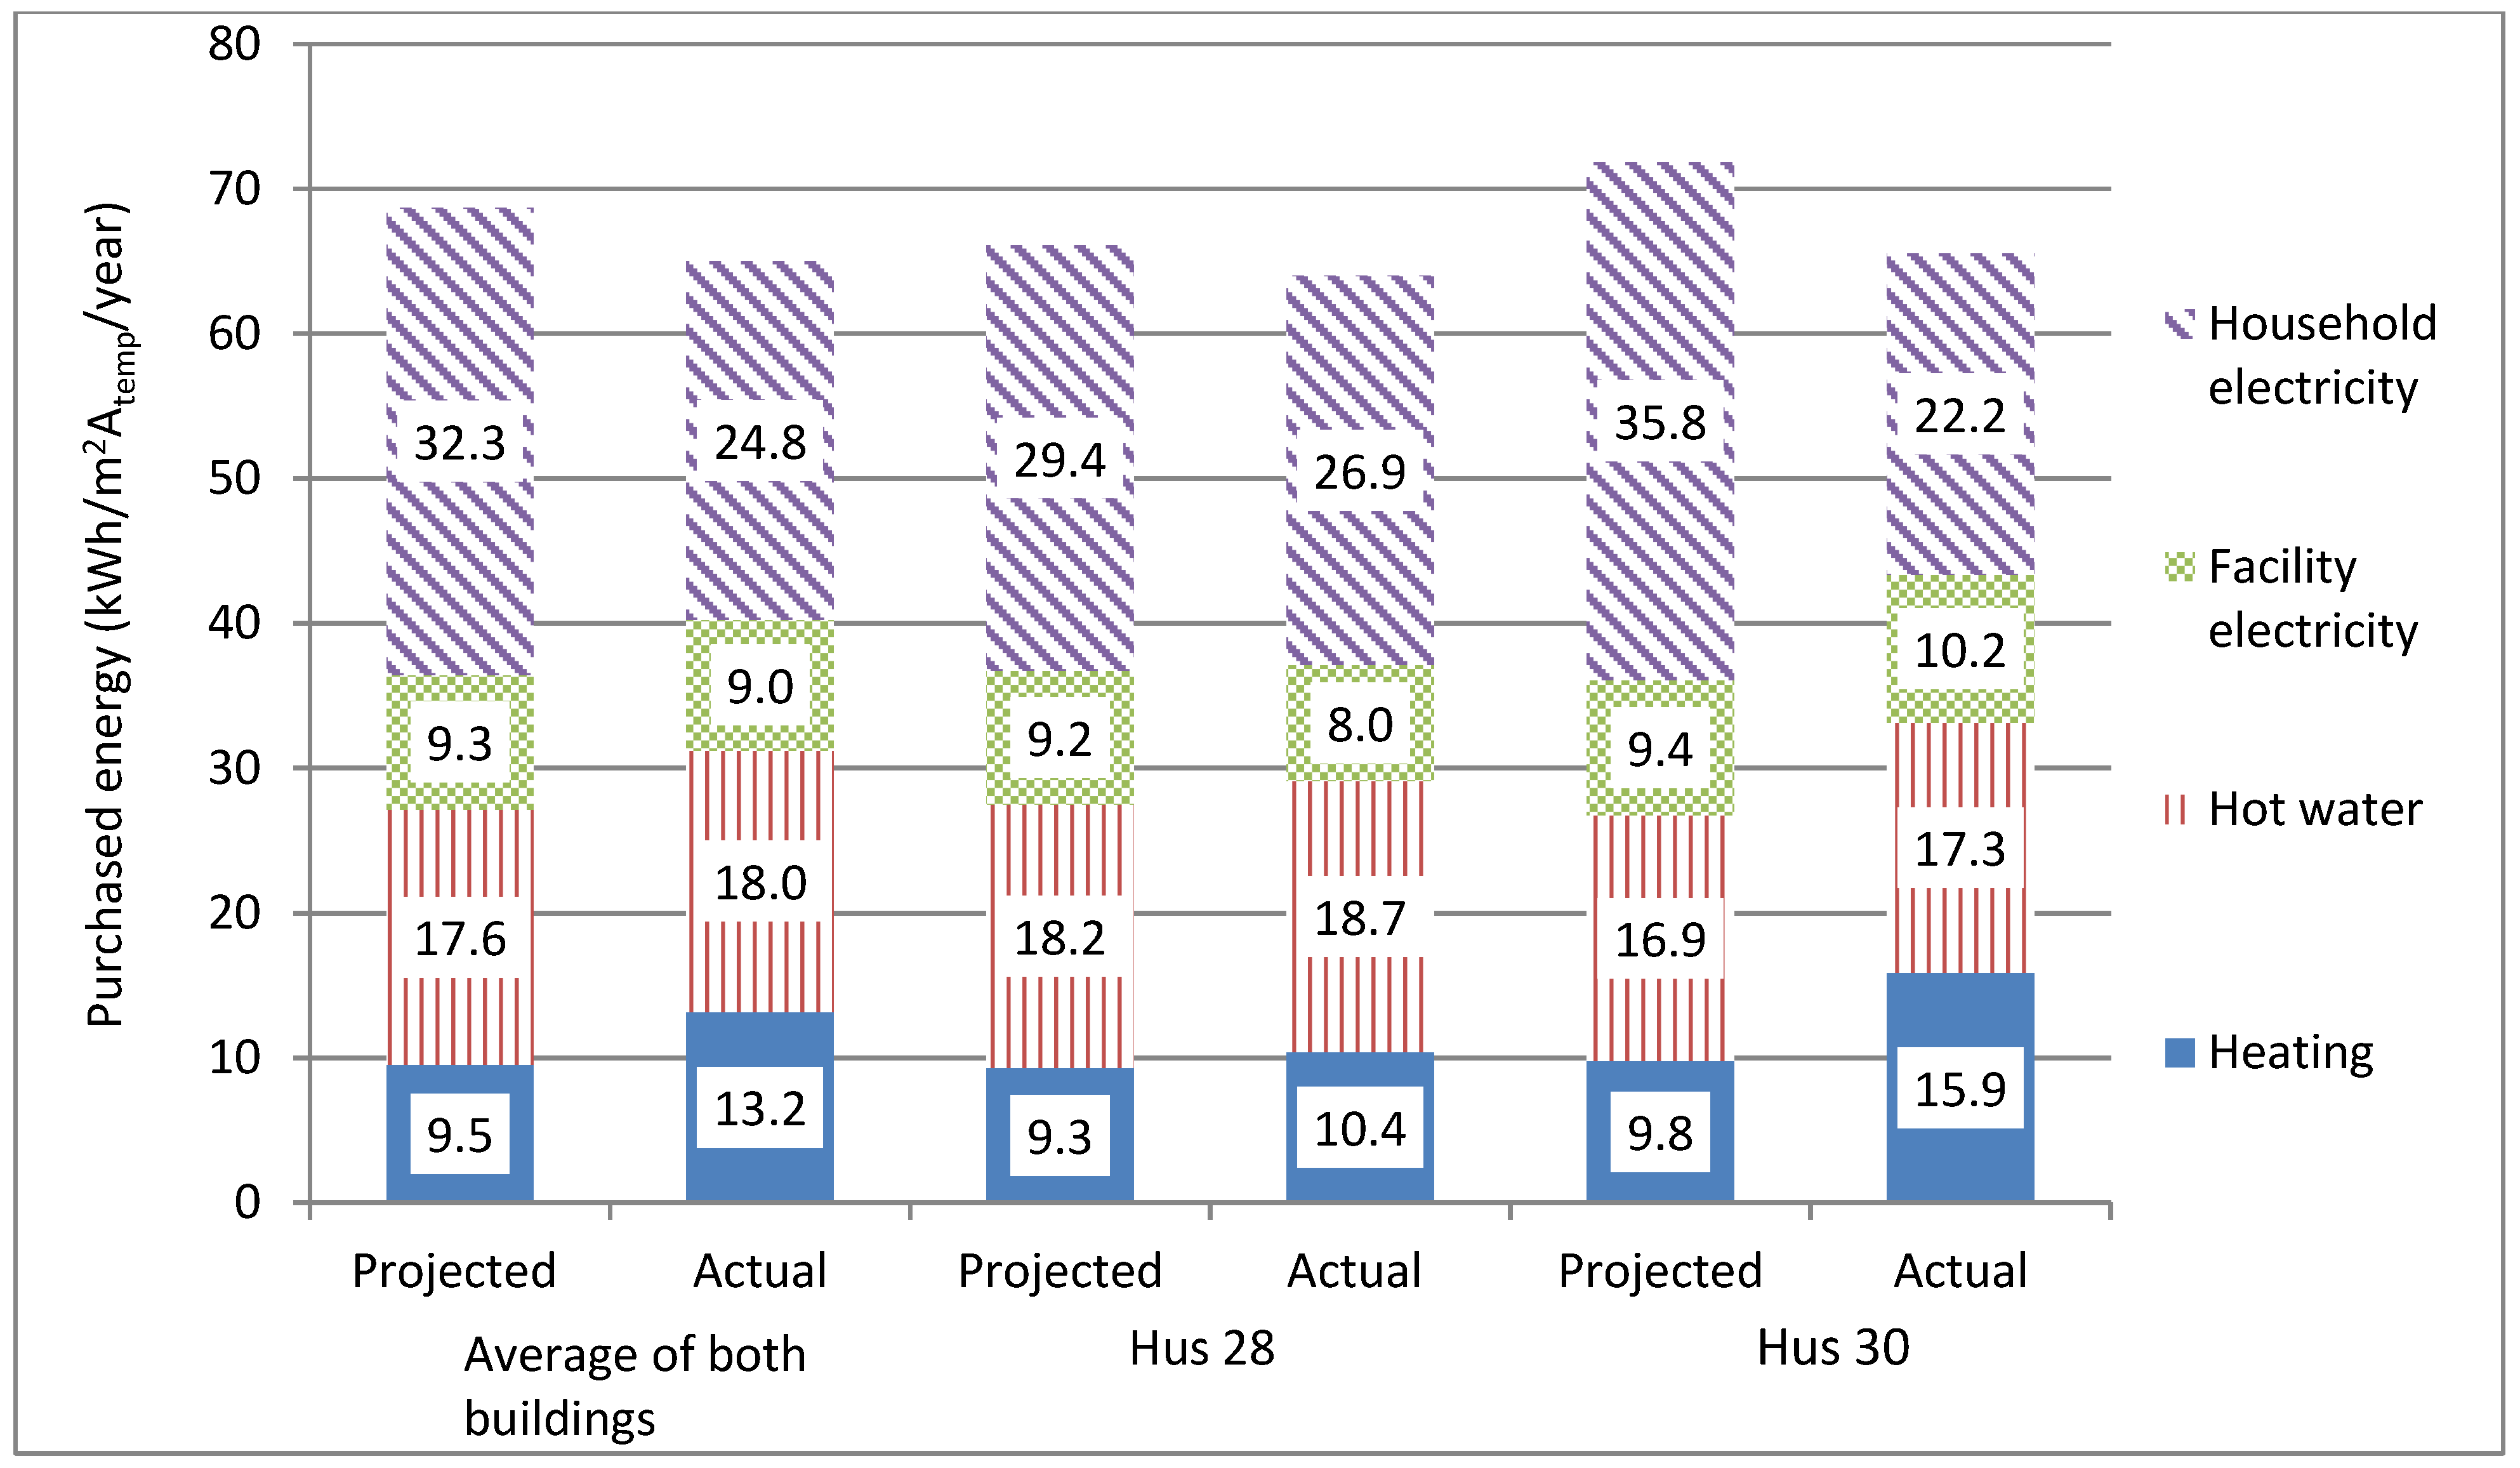
4.1. Energy Use

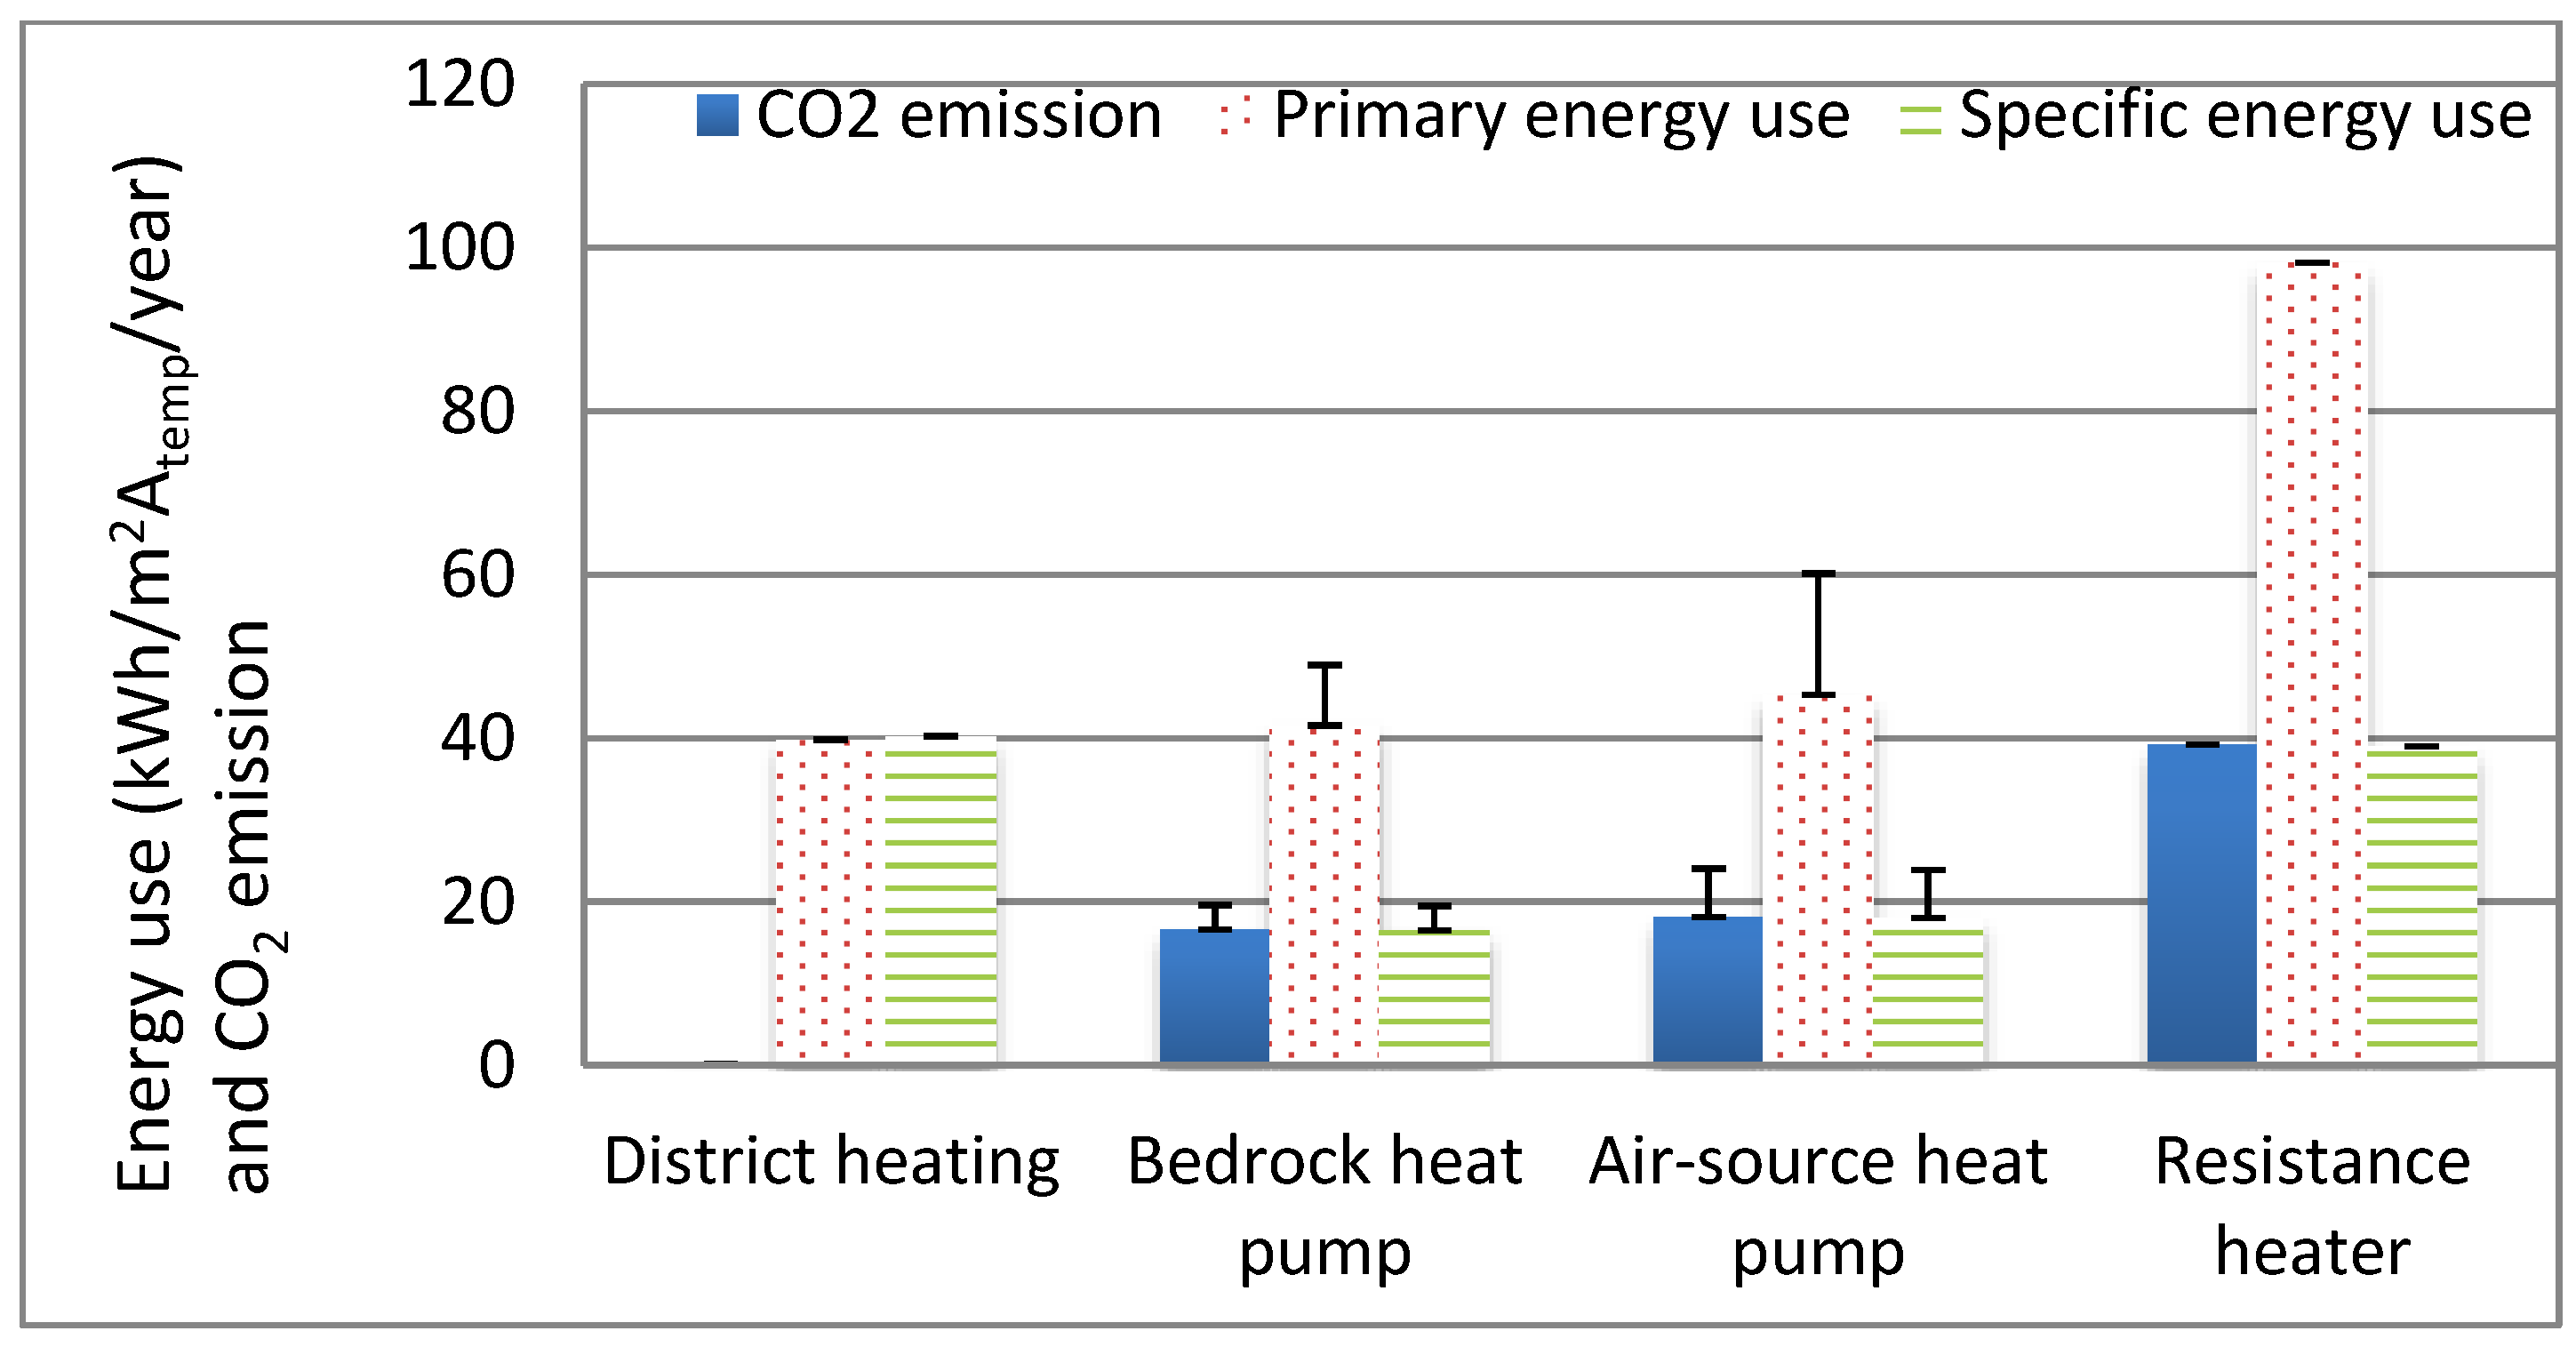
4.2. Implication of Heating Systems
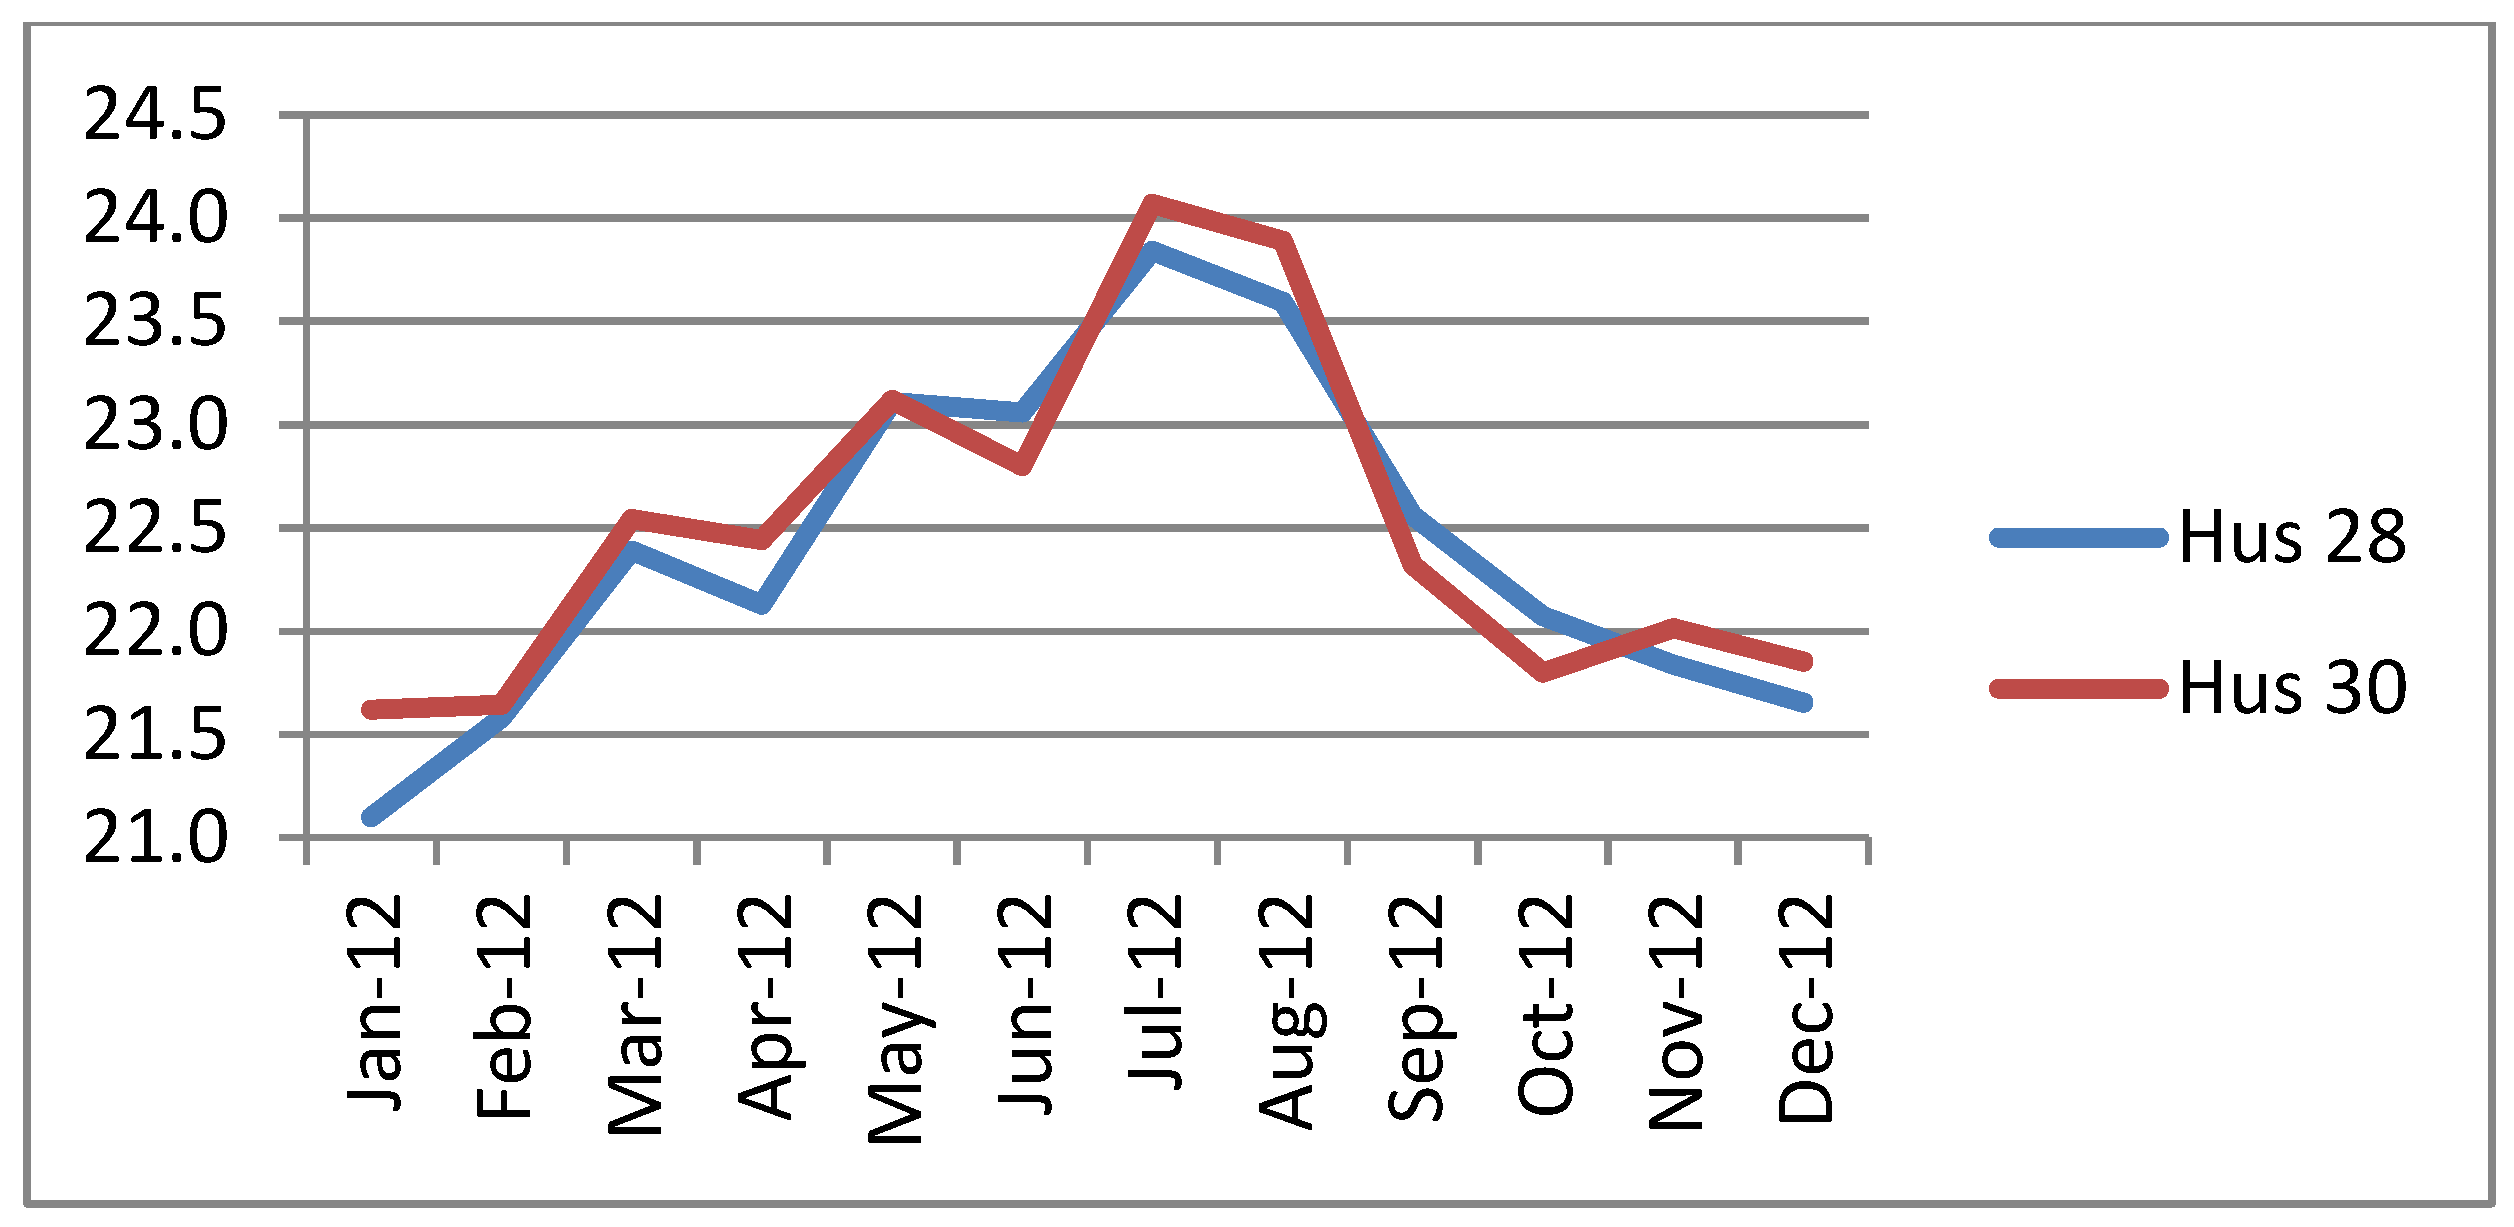
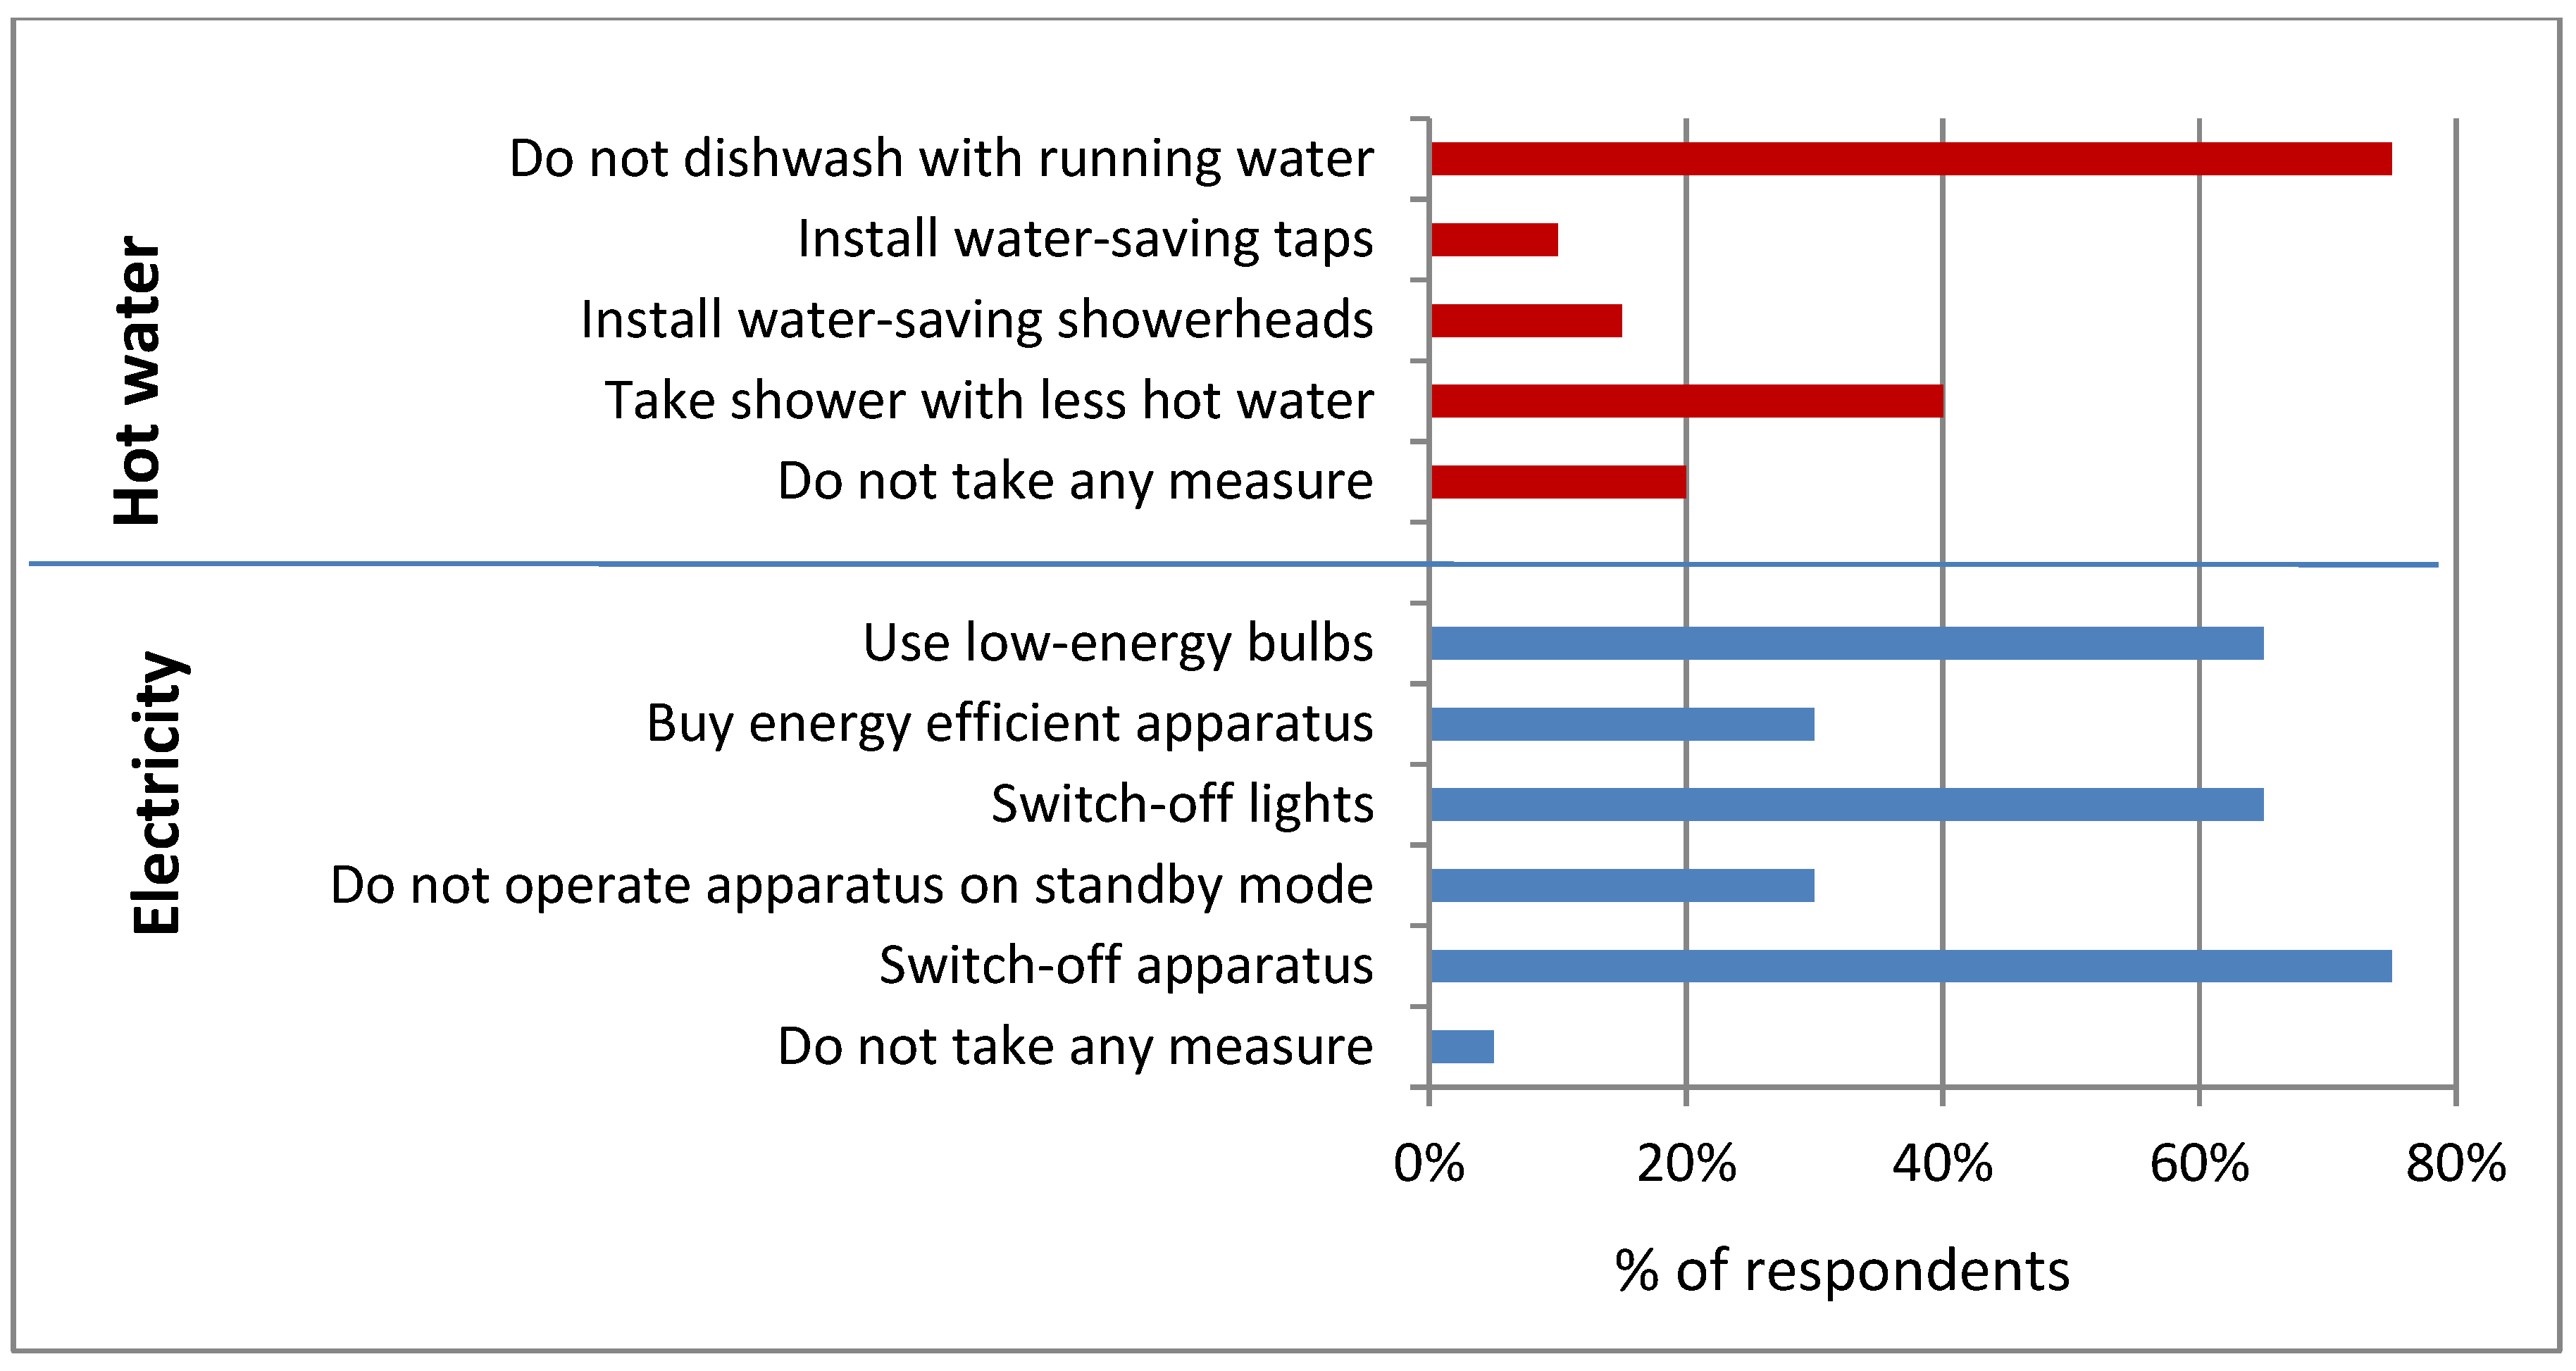
4.3. Tenants’ Experience
5. Discussion

6. Conclusions
Author Contributions
Conflicts of Interest
References
- Sveriges Centrum för Nollenergihus. Kravspecifikation för Nollenergihus, Passivhus och Minienergihus: Bostäder. LTH Rapport EBD-R-12/36. Available online: http://www. nollhus.se/dokument/Kravspecifikation%20FEBY12%20-%20bostader%20sept.pdf (accessed on 10 October 2013).
- Swedish Energy Agency. Energiläget 2013; ET 2013:22; Swedish Energy Agency: Eskilstuna, Sweden, 2013. [Google Scholar]
- Ett Energieffektivare Sverige. Slutbetänkande av Energieffektiviserings-Utredningen; SOU 2008:110; Government Offices of Sweden: Stockholm, Sweden, 2008.
- Boverket. Energianvändning i Byggnader, Delmål 6—Underlagsrapport till Fördjupad Utvärdering av God Bebyggd Miljö 2007, November 2007; National Board of Housing, Building and Planning: Karlskrona, Sweden, 2007. [Google Scholar]
- Dodoo, A.; Gustavsson, L.; Sathre, R. Lifecycle primary energy analysis of conventional and passive houses. Int. J. Sustain. Build. Technol. Urban Dev. 2012, 3, 105–111. [Google Scholar] [CrossRef]
- Gustavsson, L.; Pingoud, K.; Sathre, R. Carbon dioxide balance of wood substitution: Comparing concrete- and wood-framed buildings. Mitig. Adapt. Strateg. Glob. Chang. 2006, 11, 667–691. [Google Scholar] [CrossRef]
- NCC Construction Sverige AB. Energiberäkning Portvakten, Växjö; NCC Construction Sverige AB: Gothenberg, Sweden, 2008. [Google Scholar]
- Lågan. LÅGANbygg—Marknadsöversikt. 2014. Available online: http://marknad.laganbygg.se/lagan/www/index.php/ (accessed on 18 November 2014).
- Jansson, U. Passive Houses in Sweden: From Design to Evaluation of Four Demonstration Projects. Ph.D. Thesis, Lund University, Lund, Sweden, 2010. [Google Scholar]
- Aton. Verifierat Passivhus—Kv Fridhem. 2014. Available online: http://www.nollhus.se/images/Rapporter/Verifierat_passivhus_Fridhem.pdf (accessed on 10 November 2014).
- Wickman, P.; Sandberg, E. Lågenergihus—Jämförande + Mätstudie av Fyra Flerbostadshus. Ett LÅGAN Finansierat Projekt. ATON Rapport 1301. Available online: http://www.aton.se/img/userfiles/file/L%C3%A5genergihus%20-%20j%C3%A4mf%C3%B6rande%20m%C3%A4tstudie_maj.pdf (accessed on 10 November 2014).
- Kilersjö, C.; Fahlén, E. Vallda Heberg, LÅGAN-Seminarium om Energieffektiva Byggnader 15 Oktober 2014. Available online: http://www.laganbygg.se/UserFiles/Hur_langt_kan/Elsa_Fahlen_Presentation_LAGANs_seminariedag_141015_Vallda_Heberg_141007.pdf (accessed on 10 November 2014).
- Majcen, D.; Itard, L.C.M.; Visscher, H. Theoretical vs. actual energy consumption of labelled dwellings in the Netherlands: Discrepancies and policy implications. Energy Policy 2013, 54, 125–136. [Google Scholar] [CrossRef]
- Wilde, P.D. The gap between predicted and measured energy performance of buildings: A framework for investigation. Autom. Constr. 2014, 41, 40–49. [Google Scholar] [CrossRef]
- Turner, C.; Frankel, M. Energy Performance of LEED® for New Construction Buildings; Final Report; Green Building Council: Washington, DC, USA, 2008; Available online: http://www.usgbc.org/Docs/Archive/General/Docs3930.pdf (accessed on 12 Nvember 2014).
- Schnieders, J.; Hermelink, A. CEPHEUS Results: Measurements and occupants satisfaction provide evidence for passive houses being an option for sustainable building. Energy Policy 2006, 34, 151–171. [Google Scholar] [CrossRef]
- Danny Harvey, L.D. Recent advances in sustainable buildings: Review of the energy and cost performance of the state-of-the-art best practices from around the World. Annu. Rev. Environ. Resour. 2013, 38, 281–309. [Google Scholar] [CrossRef]
- Gustavsson, L.; Joelsson, A. Life cycle primary energy analysis of residential buildings. Energy Build. 2010, 42, 210–220. [Google Scholar] [CrossRef]
- Gustavsson, L.; Joelsson, A.; Sathre, R. Life cycle primary energy use and carbon emission of an eight-storey wood-framed apartment building. Energy Build. 2010, 42, 230–242. [Google Scholar] [CrossRef]
- Gustavsson, L.; Joelsson, A. District heating and energy efficiency in detached houses of differing size and construction. Appl. Energy 2009, 86, 126–134. [Google Scholar]
- Dodoo, A.; Gustavsson, L. Life cycle primary energy use and carbon footprint of wood-frame conventional and passive houses with biomass-based energy supply. Appl. Energy 2013, 112, 834–842. [Google Scholar] [CrossRef]
- Rogers, E.M. Diffusion of Innovations; Free Press: New York, NY, USA, 2003. [Google Scholar]
- Jansson, U. Passive Houses in Sweden: Experience from Design and Construction Phase; Report EBD-T-08/9; Lund University, Lund, Sweden, 2008. [Google Scholar]
- Schauerte, T. Evaluation of those who live in wooden buildings (Värderingarna hos dem som bor i trähus). Träinformation 2009, 2, 10. [Google Scholar]
- Walford, G.B. Multistorey wood building in UK and Sweden. N. Z. Wood Des. J. 2006, 2, 6–13. [Google Scholar]
- Boverket. Sundsvall’s Inner Harbour—A Development and Information Project for Solid Wood Construction. (Sundsvalls Inre Hamn—Ett Utvecklings och Informationsprojekt för Trähusbyggande i Massivträ); Diarinummer 504-2239/2004. Available online: www.boverket.se (accessed on 5 November 2015).
- Gold, S.; Rubik, F. Consumer attitudes towards wood as a construction material and towards wood frame houses—Selected findings of a representative survey among the German population. J. Clean. Prod. 2009, 17, 303–309. [Google Scholar] [CrossRef]
- Mahapatra, K.; Gustavsson, L. Multi-storey timber buildings—Breaking industry path dependency. Build. Res. Inf. 2008, 36, 638–648. [Google Scholar] [CrossRef]
- Kildsgaard, I.; Jarnehammar, A.; Widheden, A.; Wall, M. Energy and environmental performance of multi-storey apartment buildings built in timber construction using passive house principles. Buildings 2013, 3, 258–277. [Google Scholar] [CrossRef]
- Växjö Fastighetsförvaltning AB. Miljöredovisning för 2012. Available online: http://www.vaxjo.se/upload/Profilerad%20webbplats/V%C3%B6FAB/Bilder/bilder%20p%C3%A5%20sidor/milj%C3%B6red%20f%C3%B6r%202012_1.pdf (accessed on 29 October 2013).
- Vändal, S.; Lowentoft, C. Utvärdering av Portvakten Söders Spillvattenvärmeväxlare och Varmvattenförbrukning. Bachelor’s Thesis, Linnaeus University, Småland, Sweden, 2014. [Google Scholar]
- Dodoo, A.; Gustavsson, L.; Sathre, R. Lifecycle carbon implications of conventional and low-energy multi-storey timber building systems. Energy Build. 2014, 82, 194–210. [Google Scholar] [CrossRef]
- Swedish Energy Agency. Välj rätt Värmepump; ET2010: 02; Swedish Energy Agency: Eskilstuna, Sweden, 2010. [Google Scholar]
- Hördegård, U. Personal Communication with Ulf Hördegård, Project Leader, Växjö Energi AB: Växjö, Sweden, 2013.
- Gustavsson, L.; Dodoo, A.; Truong, N.L.; Danielski, I. Primary energy implications of end-use energy efficiency measures in district heated buildings. Energy Build. 2011, 43, 38–48. [Google Scholar] [CrossRef]
- Gustavsson, L.; Sathre, R. Variability in energy and carbon dioxide balances of wood and concrete building materials. Build. Environ. 2006, 41, 940–951. [Google Scholar] [CrossRef]
- Uppenberg, S.; Zetterberg, L.; Åhman, M. Climate Impact from Peat Utilization in Sweden; IVL B-1423; Swedish Environmental Research Institute: Goeteborg, Sweden, 2001. [Google Scholar]
- Intergovernmental Panel on Climate Change. Climate Change 2007: Synthesis Report; IPCC: Geneva, Switzerland, 2007. [Google Scholar]
- Swedish Environmental Protection Agency. Beräkna Utsläpp av Växthusgaser och Luftföroreningar. Available online: http://www.naturvardsverket.se/Stod-i-miljoarbetet/Vagledningar/Luft-och-klimat/Berakna-utslapp-av-vaxthusgaser-och-luftfororeninga/ (accessed on 15 October 2014).
- ISO 14044:2006 Environmental Management—Life Cycle Assessment—Requirements and Guidelines; International Standardization Organization: Geneva, Switzerland, 2010.
- Gustavsson, L.; Karlsson, Å. A system perspective on the heating of detached houses. Energy Policy 2002, 30, 553–574. [Google Scholar] [CrossRef]
- Hawkes, A.D. Long-run marginal CO2 emissions factors in national electricity systems. Appl. Energy 2014, 125, 197–205. [Google Scholar] [CrossRef]
- Lund, H.; Mathiesen, B.V.; Christensen, P.; Schmidt, J.H. Energy system analysis of marginal electricity supply in consequential LCA. Int. J. Life Cycle Assess. 2010, 15, 260–271. [Google Scholar] [CrossRef]
- Harmsen, R.; Graus, W. How much CO2 emissions do we reduce by saving electricity? A focus on methods. Energy Policy 2013, 60, 803–812. [Google Scholar] [CrossRef]
- Weidema, B.P.; Frees, N.; Nielsen, A.-M. Marginal production technologies for life cycle inventories. Int. J. Life Cycle Assess. 1999, 4, 448–456. [Google Scholar] [CrossRef]
- Dodoo, A.; Gustavsson, L.; Sathre, R. Primary energy implications of ventilation heat recovery in residential buildings. Energy Build. 2011, 43, 1566–1572. [Google Scholar] [CrossRef]
- Energispartips: Värme. Swedish Energy Agency. 2014. Available online: http://www. energimyndigheten.se/Hushall/Tips-pa-hur-du-spar-energi--/Varme/ (accessed on 11 November 2014).
- NCC Construction Sverige AB. Portvakten-Lufttäthetsprovning . In Air Tightness Test Conducted by CA Consultadministration AB on behalf of NCC AB on 2009-02-18 (Hus 30) and 2009-06-24 (Hus 28); NCC Construction Sverige AB: Gothenberg, Sweden, 2009. [Google Scholar]
- Dodoo, A.; (Linnaeus University, Småland, Sweden). Personal Communication, 2015.
- McMullan, R. Environmental Science in Building, 7th ed.; Palgrave Macmillan: Basingstoke, UK, 2012. [Google Scholar]
© 2015 by the authors; licensee MDPI, Basel, Switzerland. This article is an open access article distributed under the terms and conditions of the Creative Commons Attribution license (http://creativecommons.org/licenses/by/4.0/).
Share and Cite
Mahapatra, K.; Olsson, S. Energy Performance of Two Multi-Story Wood-Frame Passive Houses in Sweden. Buildings 2015, 5, 1207-1220. https://doi.org/10.3390/buildings5041207
Mahapatra K, Olsson S. Energy Performance of Two Multi-Story Wood-Frame Passive Houses in Sweden. Buildings. 2015; 5(4):1207-1220. https://doi.org/10.3390/buildings5041207
Chicago/Turabian StyleMahapatra, Krushna, and Stefan Olsson. 2015. "Energy Performance of Two Multi-Story Wood-Frame Passive Houses in Sweden" Buildings 5, no. 4: 1207-1220. https://doi.org/10.3390/buildings5041207