1. Introduction
In the coming years, improvement of the built environment is essential. To reach Europe’s goal of becoming energy and carbon efficient in the future, the residential sector needs extra attention. This sector uses 26% of the final energy consumption in the EU-28 [
1,
2]. Given that, at most, 1% of new construct is added to the existing stock [
3], only a small percentage of buildings will be new, while the largest part consists of existing buildings in need of upgrading. In The Netherlands, buildings constructed before 1975 have a particularly high energy demand, as the Dutch regulations concerning thermal insulation values in buildings were introduced after 1975. More than 50% of residential buildings was built before 1971 [
4], so the share of the building stock to be improved is large.
Refurbishment of existing buildings has the potential to bring substantial savings in energy consumption of the building stock [
5]. Both rate and depth of renovation need to increase, surmounting to energy savings of 60%–90% [
6]. Transformation of the existing housing stock is a more environmentally efficient way to achieve the same result than demolition and rebuilding [
7]. This is because the building process and the materials used are both energy intensive, while most of the building mass and structural elements in an existing premise are already there and only rarely need replacing. As a result, new homes use four to eight times more resources than an equivalent refurbishment [
8]. With regard to wider environmental impact, the exhaustion of available landfill sites also has serious implications for the scale of building and demolition. Demolition of buildings is the biggest source of landfill by volume, around 30% of the total [
9].
The building stock has been the focus of European Union policies for energy savings. The Energy Performance of Buildings Directive (EPBD) (Directive 2002/91/EC) is the main EU policy instrument to improve the energy performance of buildings. Among other measures, it introduced a framework for energy performance certification [
10]. The Dutch government is already trying to improve the energy efficiency of the existing building stock with the release of the “
Energieakkoord” (“energy agreement”), signed by various parties of the building industry, under the leadership of the Social and Economic Council of The Netherlands, the SER. The aim of the government, in accordance with EU legislation, is that as of 2020 new housing will be nearly energy neutral and that by 2015 new houses already are 50% more energy efficient than in 2007 [
11]. Moreover, by 2020 all rental houses owned by housing associations must have an average energy label B or higher and 80% of privately rented houses must have energy label C or better [
12].
Nevertheless, energy certification refers to operational energy and does not usually consider aspects related to the life cycle of the building. This life-cycle energy consists of three energy types: embodied energy, operational energy and demolition energy [
13]. In The Netherlands, there are specific software tools that help improve the operational energy of a building, but the embodied energy and demolition energy are not included. Operational energy is the energy necessary to heat, cool, light and power a building [
13]. Demolition energy is the energy necessary to demolish and dispose of a building at the end of its lifespan [
13]. Embodied energy is the quantity of energy consumed to extract, process, produce and supply materials to the construction site [
13,
14,
15]. The embodied energy is necessary to initially produce the building, but also the energy needed to maintain and refurbish the building, the recurring energy, is included in it [
13]. Using existing software, it is difficult to make a design that includes all aspects of energy use of a building during its lifespan. However, if the life cycle energy needs to be calculated, the embodied energy of materials has to be considered as well, as it is interrelated to LCA.
Because of the fact that there is no generally accepted method to calculate the embodied energy accurately and methodically, there is a wide variation in embodied energy figures due to various factors [
14]. Some of these factors are: the methods of embodied energy analysis, type of energy considered, geographic location of the study area, the age of data sources and source of data. Efforts toward creating an inventory of materials’ embodied energy have resulted in different databases, such as the University of Bath’s inventory of carbon and energy database [
16], the Dutch Institute of building biology and Ecology (NIBE) environmental classification of building products [
17], and the environmental product declarations database Ökobau.dat [
18], used in the German sustainable building certification scheme, DGNB.
The inventory of carbon and energy (ICE) of Bath University gives the embodied energy and embodied carbon data for over 200 materials. Some of its limitations are that it has not been updated since 2011, many of the underlying studies used for the database are much older than this and that it only considers cradle to gate [
19]. The last aspect gives a large limitation; this only gives the embodied before it is transported to the consumer. The database gives the raw materials, but if a combination of materials is needed, this is not easily calculated. The German Oekobau.dat database also has this limitation. Many façade elements also have smaller components such as fixings. The embodied energy needed for the assembly of all components and the recurring embodied energy needed for maintenance of façade materials, such as painting every few years, is not included. In the building industry, embodied energy is most frequently expressed in mega joule (MJ) and global warming potential (GWP) in kilogram CO
2 equivalent [
20].
With regard to the relation between embodied and operational energy, studies have shown that there is a linear relation between operating and total life-cycle energy [
21] and that operating energy represents by far the largest part of energy demand in a building during its life cycle. Hence, low-energy buildings result in being more energy efficient than conventional ones, even though their embodied energy is somewhat higher. However, when nearly zero energy is needed to operate the buildings [
22], the importance of the embodied energy of the building’s materials will grow [
20]. For highly energy-efficient buildings, the embodied energy accounts for approximately 40% of the whole life cycle energy [
13]. The part of embodied and demolition energy increases to 100% if the operational net energy-use is zero.
In refurbishment designs, usually only the operational energy reduction is taken into account, and not the embodied energy. In contrast to performance energy, which is easily linked to the energy bill, the energy linked to the building substance is not immediately recognizable [
23]. The use of more materials for the refurbishment has a good influence on the operational energy, but gives an increase in required embodied energy. This can lead to the contradiction of obtaining a better energy classification, while producing a higher energy consumption or more CO
2 emissions in global terms [
24]. Therefore assessing holistically the environmental performance, including embodied and operational energy, is necessary at the beginning of the design process.
However, in current practice, as well as research, the environmental footprint of a solution is not often considered in decision making of refurbishment strategies. Ma
et al. [
25] give an overview of retrofit studies on residential buildings and the decision making process. Out of 14 studies documented, only one [
26] considered the environmental upfront cost of the retrofits. Moreover, the design with the lower embodied energy is difficult to establish, since this greatly depends on the lifespan as well: the lifespan determines whether the break-even point between operational energy reduction and embodied energy investment is reached. And this break-even point also depends on the façade materials and façade strategies most suitable for that type of building and existing façade detailing. Applying materials with a low embodied energy can be an essential step towards reaching zero-energy buildings in terms of operational as well as embodied energy consumption. This goal demands for a new method of designing.
The presented paper develops a design methodology that can be used for existing residential buildings to decrease both the operational and embodied energy. This is done in a different way than usual design methods; firstly, by looking at the most suitable materials; secondly, by developing the best façade strategies and finally, by determining the best design that fits with the previous conclusions. The research is focused on Dutch building stock, Dutch regulations and available accredited energy performance software. Different façade materials were evaluated in terms of embodied energy, based on the NIBE material database [
17], which is the Dutch institute for building biology and ecology. Subsequently, the results of this evaluation were applied on three schematic façade designs for retrofitting a case-study building. The thermal performance of the façade design strategies was calculated, as well as the resulting operational energy and embodied energy, for a lifespan of 35 years. This way, operational and embodied energy can be compared. This approach, which determines the best façade materials and façade design for both the embodied and operational energy, was evaluated through a design proposal for refurbishment, based on the façade materials and strategies determined in the previous steps. The energy demand of the final design proposal, both operational and embodied, was calculated and compared to the current façade and building performance.
2. Method to Integrate Life-Cycle Energy into the Design of a Façade Refurbishment
As the life cycle energy consists of different components, i.e., the embodied and operational energy, the method to incorporate embodied and operational energy into the design decision-making for existing buildings, consists of several steps. The present study introduces four steps in order to determine the façade refurbishment strategy design: the material comparison (embodied energy), the strategy comparison per façade part (embodied energy), the strategy comparison for a whole apartment (embodied and operational energy) and the final refurbishment design (embodied and operational energy).
The most appropriate option for a refurbishment strategy is often influenced by the payback time. When the planned lifespan of a residence is only a few years, the decisions can be very different from a building with a projected lifespan of 50 years. In this paper, the refurbishment strategy and material choice for a multi-family residential building is determined for a planned lifespan of 35 years, which was the planned lifespan of the case-study building, according to the building owner at the time of the study.
For the material comparison, the NIBE material database [
17] was used as a basis. The NIBE database was selected to be used for this research, because it gives information on complete building products, in contrast to other embodied energy material databases. It also gives data on the recurring embodied energy needed for maintenance. It is also relevant to the Dutch context, on which the research focuses. Amongst many others, the database has information on façade materials. It contains different façade components, such as timber cladding or roof insulation, and compares the environmental impact of different material options for these components. For the purpose of this study, the embodied energy is defined by the environmental impact given in the NIBE database.
With regard to the embodied energy, different materials had to be compared per component type, for example timber cladding or roof insulation. To render the materials comparable, a Functional Unit was used: 1 m
2 of façade, where the thickness of the materials common for that type of cladding or function is taken into account [
27]. For example, the aluminum cladding in practice is very thin, while masonry façade is much thicker. For the insulation materials, the thermal resistance (m
2K/W) is kept equal in all variants. The necessary thickness for this thermal resistance is used in the comparison.
In the material comparison part of the study, the deciding factor for the material selection is the lowest possible embodied energy for the chosen lifespan. The results of the material comparison are not dependent on the case study and can be used for all types of buildings.
The next step is the façade strategy analysis, for which a case study building was used, in order to apply and compare the strategies. The building used is representative for a Dutch flat from the 1960s [
28]. Conclusions from this comparison may also be used for other buildings of this type. The calculations were made for one apartment in this building, which was situated at the top right corner of the building. Three façade strategies were compared by making global designs of the apartment per strategy.
The embodied energy was accounted for a lifespan of 35 years for three different façade strategies. The calculation considered each façade part; if different façade materials are used, the façade parts were calculated separately. This is because per façade part, a different façade strategy might be a better option, depending on the existing materials and detailing. These calculations were made in an Excel spreadsheet to determine the embodied energy.
After the embodied energy of the façade parts were compared per strategy, the complete energy use of the total apartment was calculated per strategy. This was done by simulating the three designs in the accredited energy performance calculation software ENORM v1.11 [
29]. ENORM is Dutch software that calculates the Dutch Energy Performance Coefficient (EPC), which also gives an accurate operational energy per year in MJ, based on the Dutch norm NEN 7120, Energy performance of buildings-Determination method [
30]. This norm is required according to the Dutch building regulation for determining the energy performance. The Dutch building regulation (“Bouwbesluit 2012”) was used [
31]. The building services have a large influence on the operational energy per year. In this research, however, the façade strategies are compared without the influence of the building services on the embodied energy. However, the operational energy is taken into account, so the choice of building system is needed as an input.
Conclusions from the material and façade analysis were used to make a final refurbishment design for the case-study building. This gives a total overview of the operational and embodied energy for the final design chosen for the building. A weighted average of all apartment types was calculated in the final design, in order to give results for the complete building. The payback time of the embodied energy investment compared to the reduction in operational energy for the building in the old condition was then determined.
3. Material Comparison
The first step of the design method for existing buildings compared the materials based on the NIBE database. The database, however, gives the environmental impact in kg CO
2eq (kilograms of Carbon Dioxide Equivalent). For the purpose of this study and to be able to compare it with operational energy in further steps, the environmental impact was converted into MJ, by taking the average breakdown of fuel types used in the world [
32] and using a conversion factor per type of fuel [
33,
34,
35,
36]. The calculated average of all these types of fuels gives the total conversion factor: 1 kg CO
2eq corresponds to approximately 15.5 MJ [
37]. In Excel the data from NIBE was reprocessed to calculate the MJ of embodied energy per material per 1 m
2 of façade.
The NIBE database gives the data for a functional unit value. This is the functional thickness and amount of material that is common for a certain façade material. For example, a brick façade has a functional unit that is 100 mm thick. However, timber cladding is only a few mm thick. By using 1 m2 of façade and accounting the embodied energy needed for that functional thickness, a correct comparison can be made of the façade materials.
The NIBE database includes a number of façade component types, which have different material possibilities. An example of a façade component type is a metal façade cladding, which amongst others can be made out of copper, steel or aluminum. The available data of the NIBE database was used for the material comparison. The façade components used in the material comparison are the following:
cavity insulation;
flat roof insulation;
outside window frame;
inside window frame;
window sill;
inside cavity wall with a light construction;
inside cavity wall with a heavy construction;
wooden cladding;
metal cladding;
stone or plastic cladding;
outside cavity wall; and
doors.
The embodied energy depends on the lifespan of the materials and of the building. An element has a certain lifespan, after which it needs to be replaced. The lifespan per element is derived from the NIBE database [
17]. If an element needs to be replaced during the lifespan of the building, the embodied energy of the façade component increases. Therefore, the best choice for an element’s material can vary for different building lifespans. The NIBE database gives data for the building materials for a building lifespan of 75 years. However, in this research the embodied energy needed to be calculated for 35 years, therefore the data of NIBE was reprocessed in Excel so that the results could be calculated for different lifespans.
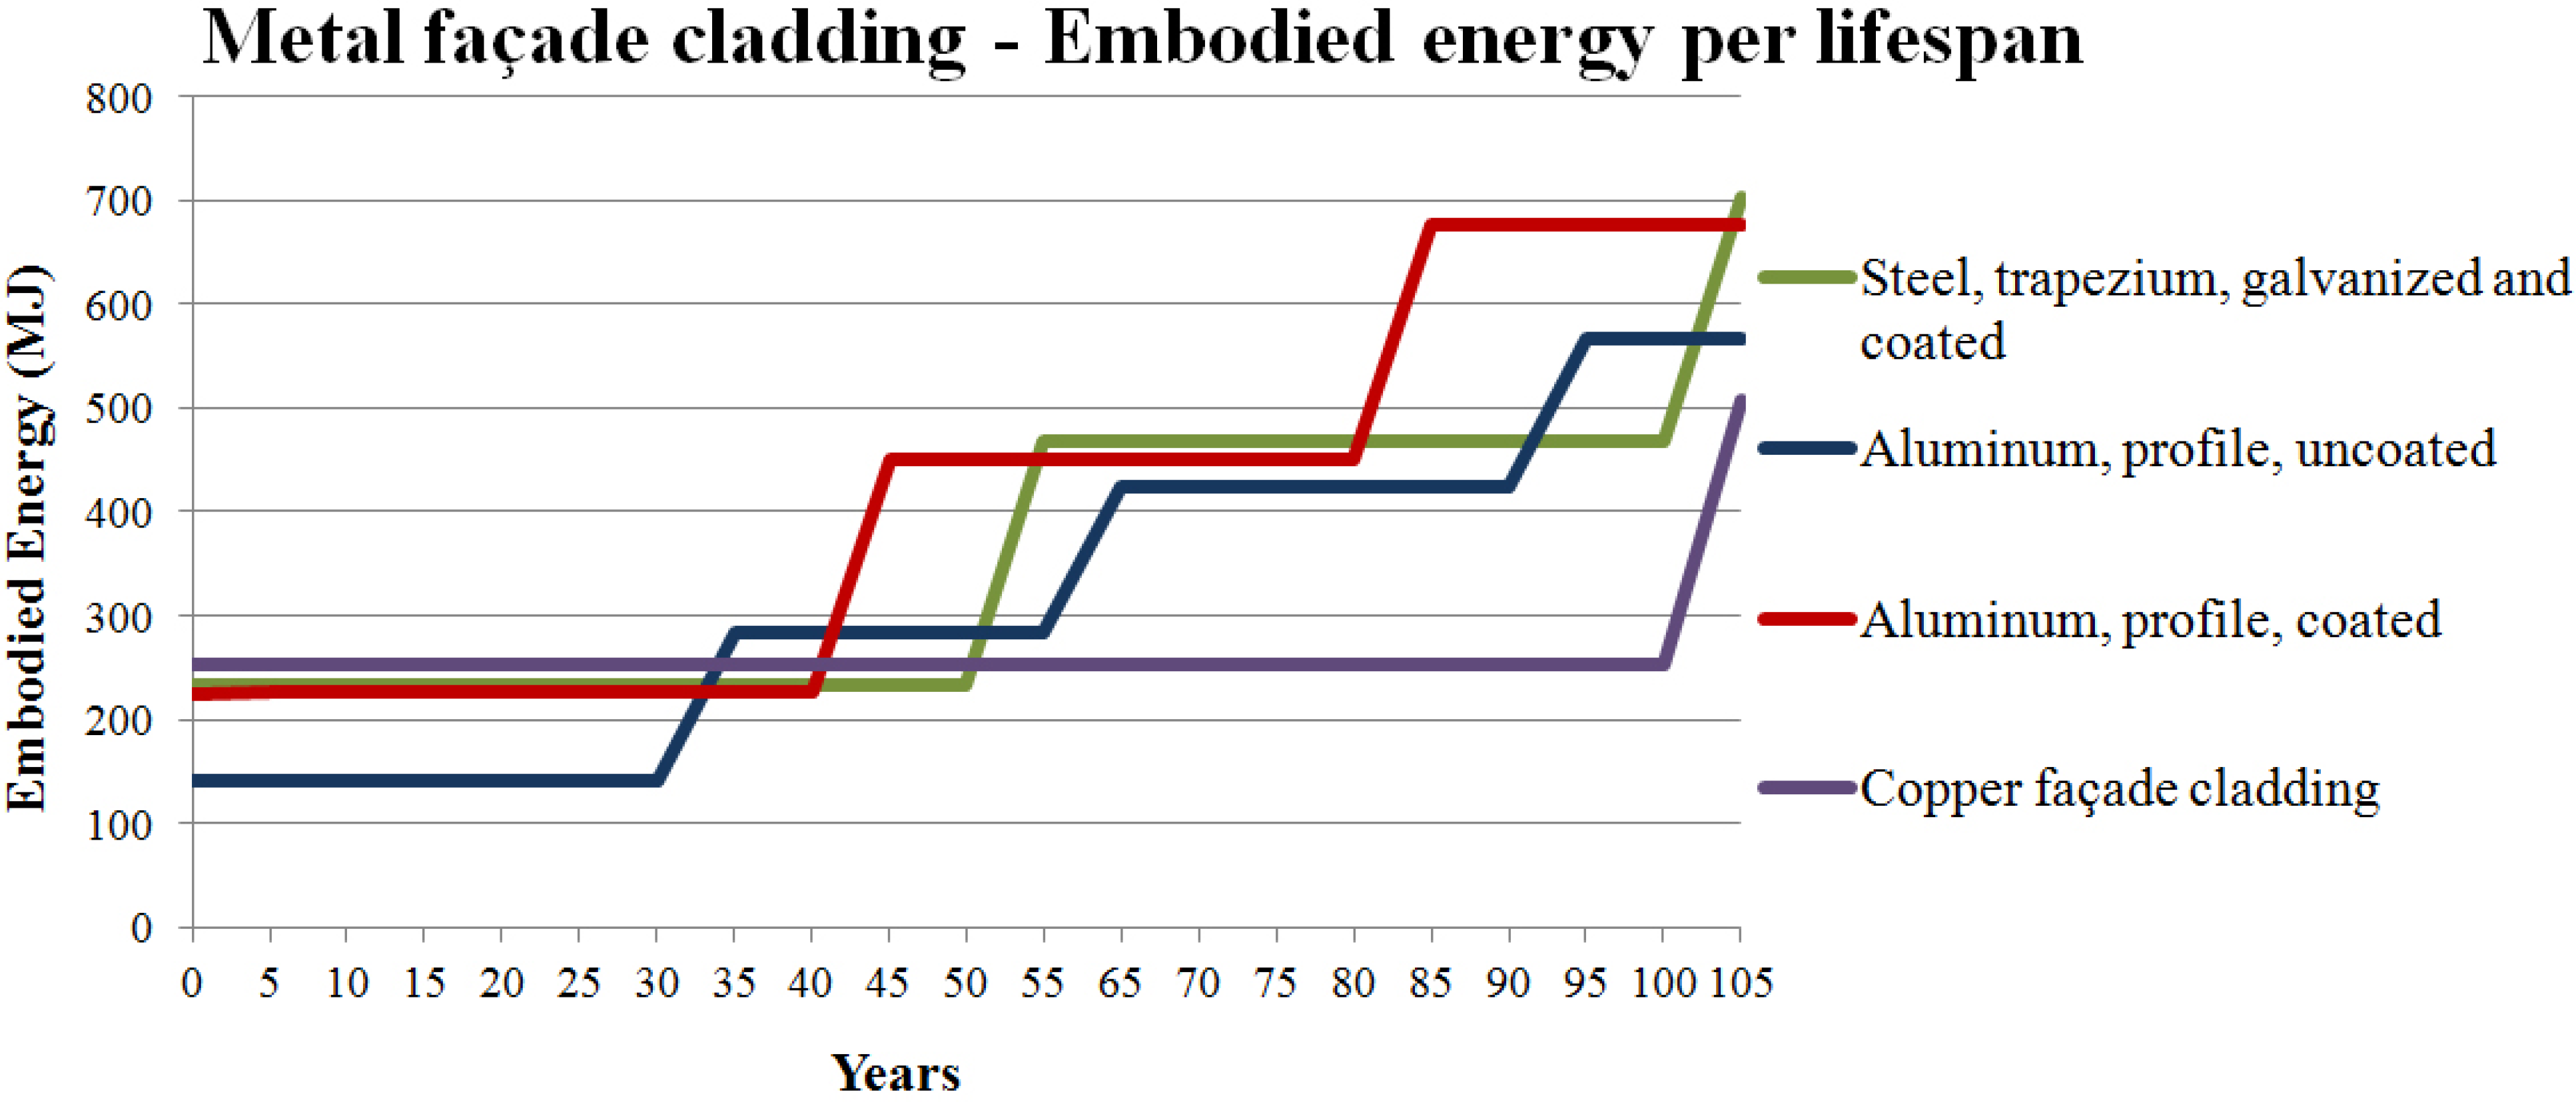
Figure 1 gives an example of the material comparison of the component category “metal façade cladding”. For different materials the technical lifespan is also different. An initial embodied energy is needed for the material; however, after a specific material lifespan the façade component is replaced. As is shown in the figure, due to the low initial embodied energy the uncoated aluminum cladding is the best choice for a short building lifespan. However, the material has to be replaced relatively often, and therefore is not suitable for a building with a longer lifespan. The copper façade is the best choice for a building lifespan above 50 years, because the technical lifespan of this material is estimated at 100 years.
Figure 1.
Material comparison of metal façade cladding for 1 m
2 of façade. The steel façade (galvanized and coated) needs to be replaced every 50 years, the aluminum profile uncoated every 30 years, the aluminum coated profile every 40 years and the copper façade cladding every 100 years, according to the NIBE database [
17].
As far as insulation materials are concerned, the thermal conductivity of the material is important, since it influences the thickness to get a good thermal resistance. To make the different materials comparable in terms of performance, a thermal resistance of 3.5 m
2K/W was considered, because that was the Dutch building legislation requirement at the time of study [
31].
Table 1 shows the total embodied energy of different material alternatives for the component of “cavity insulation” after a certain building lifespan. In contrast to
Figure 1, the table shows one material that has lower embodied energy during all lifespans: glass wool boards. This is due to the low initial embodied energy and the long material lifespan of glass wool boards. However, cellulose boards are also an option with a building lifespan of up to 15 years. This material, however, needs to be replaced more often.
The process was repeated for the different façade components and provided information on which material has the lowest embodied energy and is, thus, a better choice for retrofitting, depending on the expected lifespan.
Table 2 summarizes these results, showing the materials with the lowest embodied energy for 35 and 50 years building lifespan for all façade components identified in the case study. Other lifespans were also considered, as can be seen in the example in
Table 1. In many cases, the best material for a building lifespan of 15 years is the same as 35 years. Also, the materials with the lowest embodied energy for a building lifespan of 50 years often are the same as for a longer lifespan.
Table 1.
Embodied energy comparison for cavity insulation materials, for 1 m2 of façade. The results are shown for different building lifespans. The underlined values show the lowest embodied energy per lifespan.
Table 1.
Embodied energy comparison for cavity insulation materials, for 1 m2 of façade. The results are shown for different building lifespans. The underlined values show the lowest embodied energy per lifespan.
| Material Possibilities for Cavity Insulation | Thickness (m) Needed for Rc-Value = 3.5 m2K/W | Embodied Energy (MJ) for a Certain Lifespan (years), 1 m2 of Façade |
|---|
| 15 | 35 | 50 | 75 | 100 | 150 | 200 |
|---|
| Glass wool boards | 0.123 | 83 | 83 | 83 | 83 | 166 | 166 | 249 |
| BIO-EPS | 0.133 | 202 | 202 | 202 | 202 | 405 | 405 | 607 |
| EPS boards | 0.140 | 256 | 256 | 256 | 256 | 511 | 511 | 767 |
| Rockwool boards | 0.123 | 157 | 157 | 157 | 157 | 315 | 315 | 472 |
| Purfoam boards | 0.081 | 279 | 279 | 279 | 279 | 559 | 559 | 838 |
| Resolfoam boards | 0.074 | 235 | 235 | 235 | 235 | 469 | 469 | 704 |
| Wood fiber flexible insulation | 0.133 | 115 | 115 | 230 | 230 | 346 | 461 | 576 |
| Vlas-boards (incl. PE-foil) | 0.123 | 118 | 118 | 236 | 236 | 355 | 473 | 591 |
| Cellulose boards (incl. PE-foil) | 0.137 | 89 | 179 | 179 | 268 | 358 | 447 | 626 |
| Cellular glass | 0.144 | 468 | 468 | 468 | 468 | 468 | 937 | 937 |
| Cork boards, expanded | 0.140 | 421 | 421 | 421 | 421 | 843 | 843 | 1264 |
| XPS boards | 0.133 | 984 | 984 | 984 | 984 | 1967 | 1967 | 2951 |
| Sheep wool (incl. PE-foil) | 0.123 | 2967 | 2967 | 2967 | 2967 | 5935 | 5935 | 8902 |
Table 2.
Materials with the lowest embodied energy for 35- and 50-year lifespan per component type, for 1 m2 of façade.
Table 2.
Materials with the lowest embodied energy for 35- and 50-year lifespan per component type, for 1 m2 of façade.
| Façade Component | Lifespan 35 Years | Lifespan 50 Years |
|---|
| Material with the Lowest Embodied Energy per Façade Component | Embodied Energy Total after 35 Years (MJ) | Material with the Lowest Embodied Energy per Façade Component | Embodied Energy Total after 50 Years (MJ) |
|---|
| Cavity insulation | Glass wool boards | 83 | Glass wool boards | 83 |
| Flat roof insulation | EPS boards | 313 | EPS boards | 313 |
| Outside window frame | European softwood | 313 | European hardwood | 400 |
| Inside window frame | European softwood | 286 | European hardwood | 366 |
| Window sill | Pinewood | 461 | Pinewood | 922 |
| Inside cavity wall, light construction | Wooden frame sustainably grown | 42 | Wooden frame sustainably grown | 42 |
| Inside cavity wall, heavy construction | Clay/mud brick | 115 | Clay/mud brick | 115 |
| Wooden cladding | Oak, sustainably grown or Robinia sustainably grown | 36 | Oak, sustainably grown or Robinia sustainably grown | 36 | |
| Metal cladding | Aluminum profile, coated | 225 | Steel trapezium, galvanized and coated | 234 |
| Stone or plastic cladding | Fiber cement plate | 222 | Fiber cement plate | 222 |
| Outside cavity wall | Mud masonry brick | 378 | Mud masonry brick | 378 |
| Door | Tropical multiplex/tropical hardwood/PUR sustainably grown | 419 | Tropical multiplex/ tropical hardwood/PUR sustainably grown | 629 |
The thickness per material depends on the necessary thickness per façade cladding material and thermal resistance for insulation materials. The table shows which material has the lowest embodied energy for different building lifespans. For window frames European softwood proves to be the best option for a building lifespan of 35 years. However, for a longer building lifespan European hardwood is a better option due to the material’s longer lifespan. The materials in the table are recommended as a result of this study, when designing a building with low embodied energy. Depending on the type of cladding that is desired for architectural expression, a different component can be chosen.
4. Façade Strategy Comparison
After the materials were compared and those with lower embodied energy were identified, they were applied in different integrated façade strategies, which provided refurbishment scenarios for the complete façade, including different materials.
There are many façade refurbishment strategies possible for residential buildings. However, three façade strategy designs were made for the case study building and compared to each other, to limit the amount of possibilities. These three strategies were examined as the most representative and commonly used in current refurbishment practice, based on literature review and experience with the building industry [
5,
38]. Some strategies, such as addition of a double façade on the current façade, were not examined, due to the limitations of the software and calculation methods that were used.
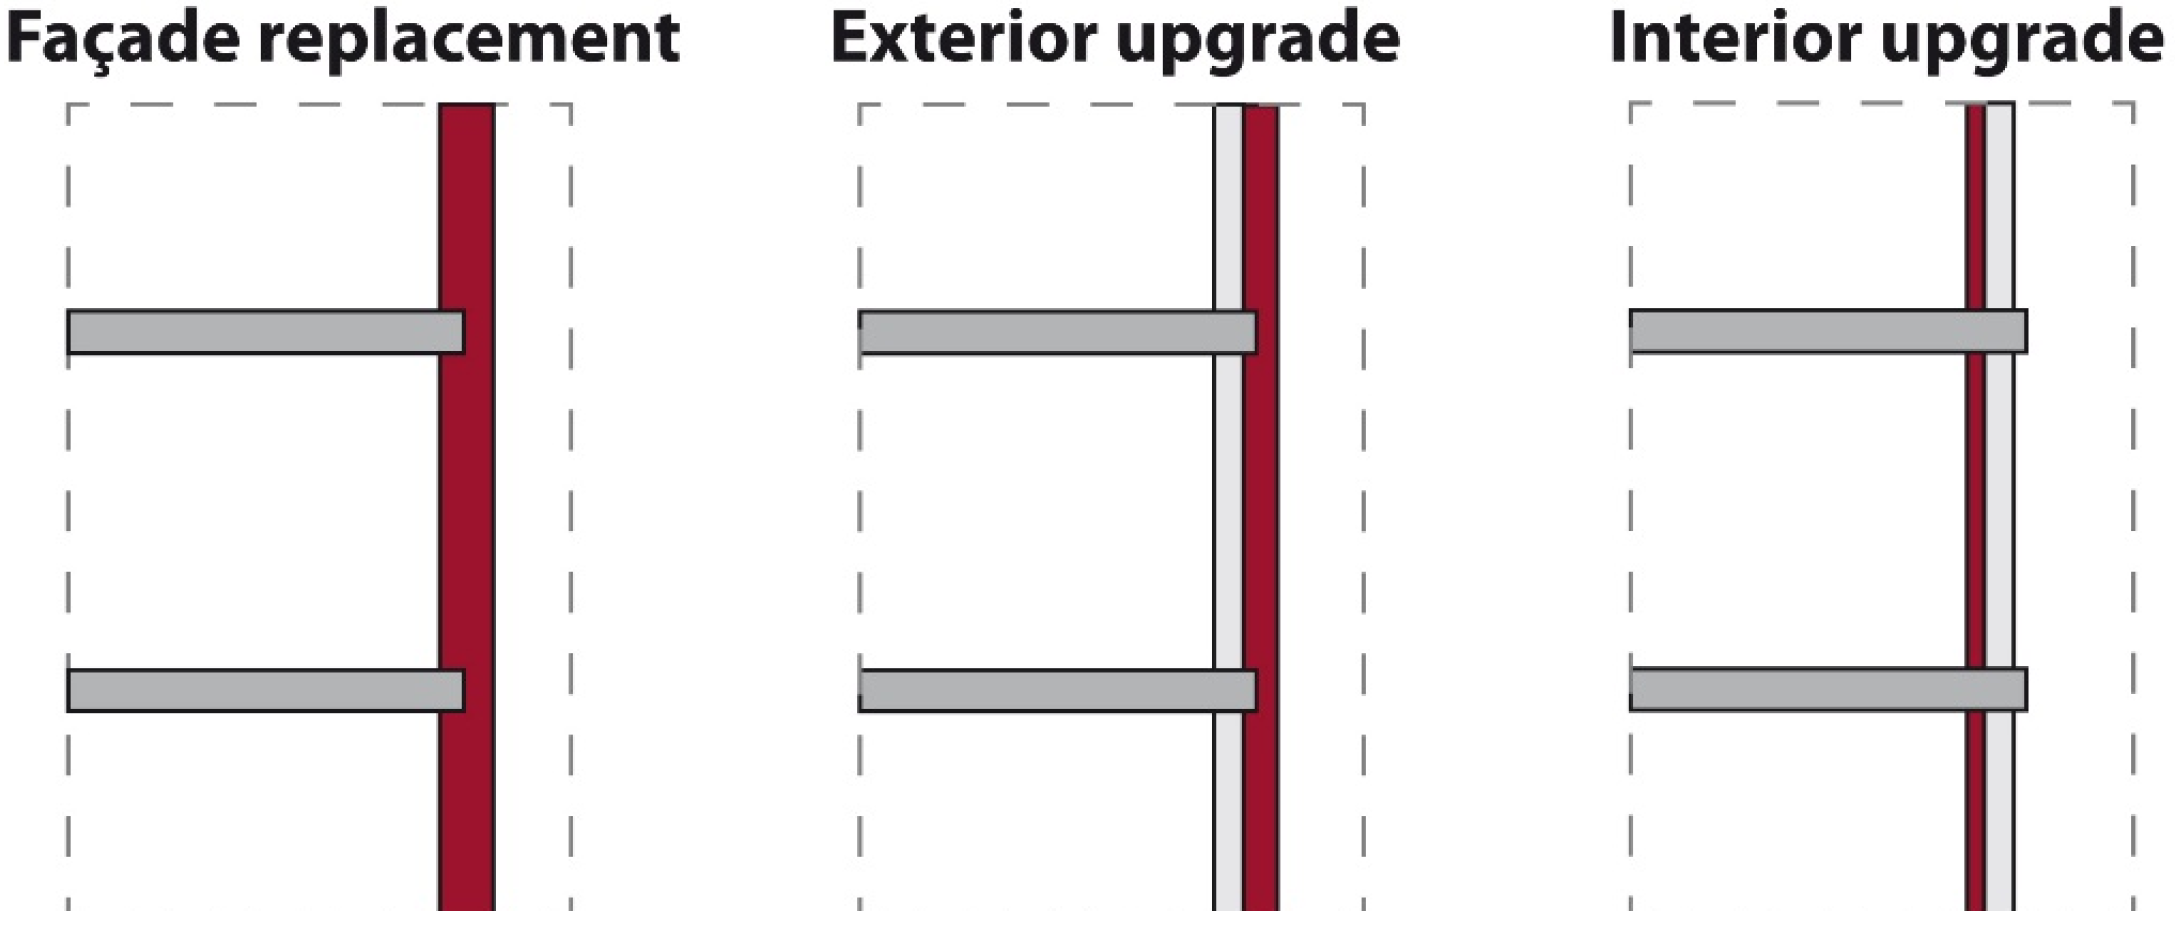
Figure 2 shows a schematic representation of the strategies. The compared strategies were:
Complete façade replacement
Exterior upgrade
The existing balconies are closed off with glazing or closed façade.
The glass is replaced by insulated glazing.
An insulated finishing system or ventilated cladding is added externally on top of the existing façade.
Figure 2.
Three façade refurbishment strategies that were compared.
Figure 2.
Three façade refurbishment strategies that were compared.
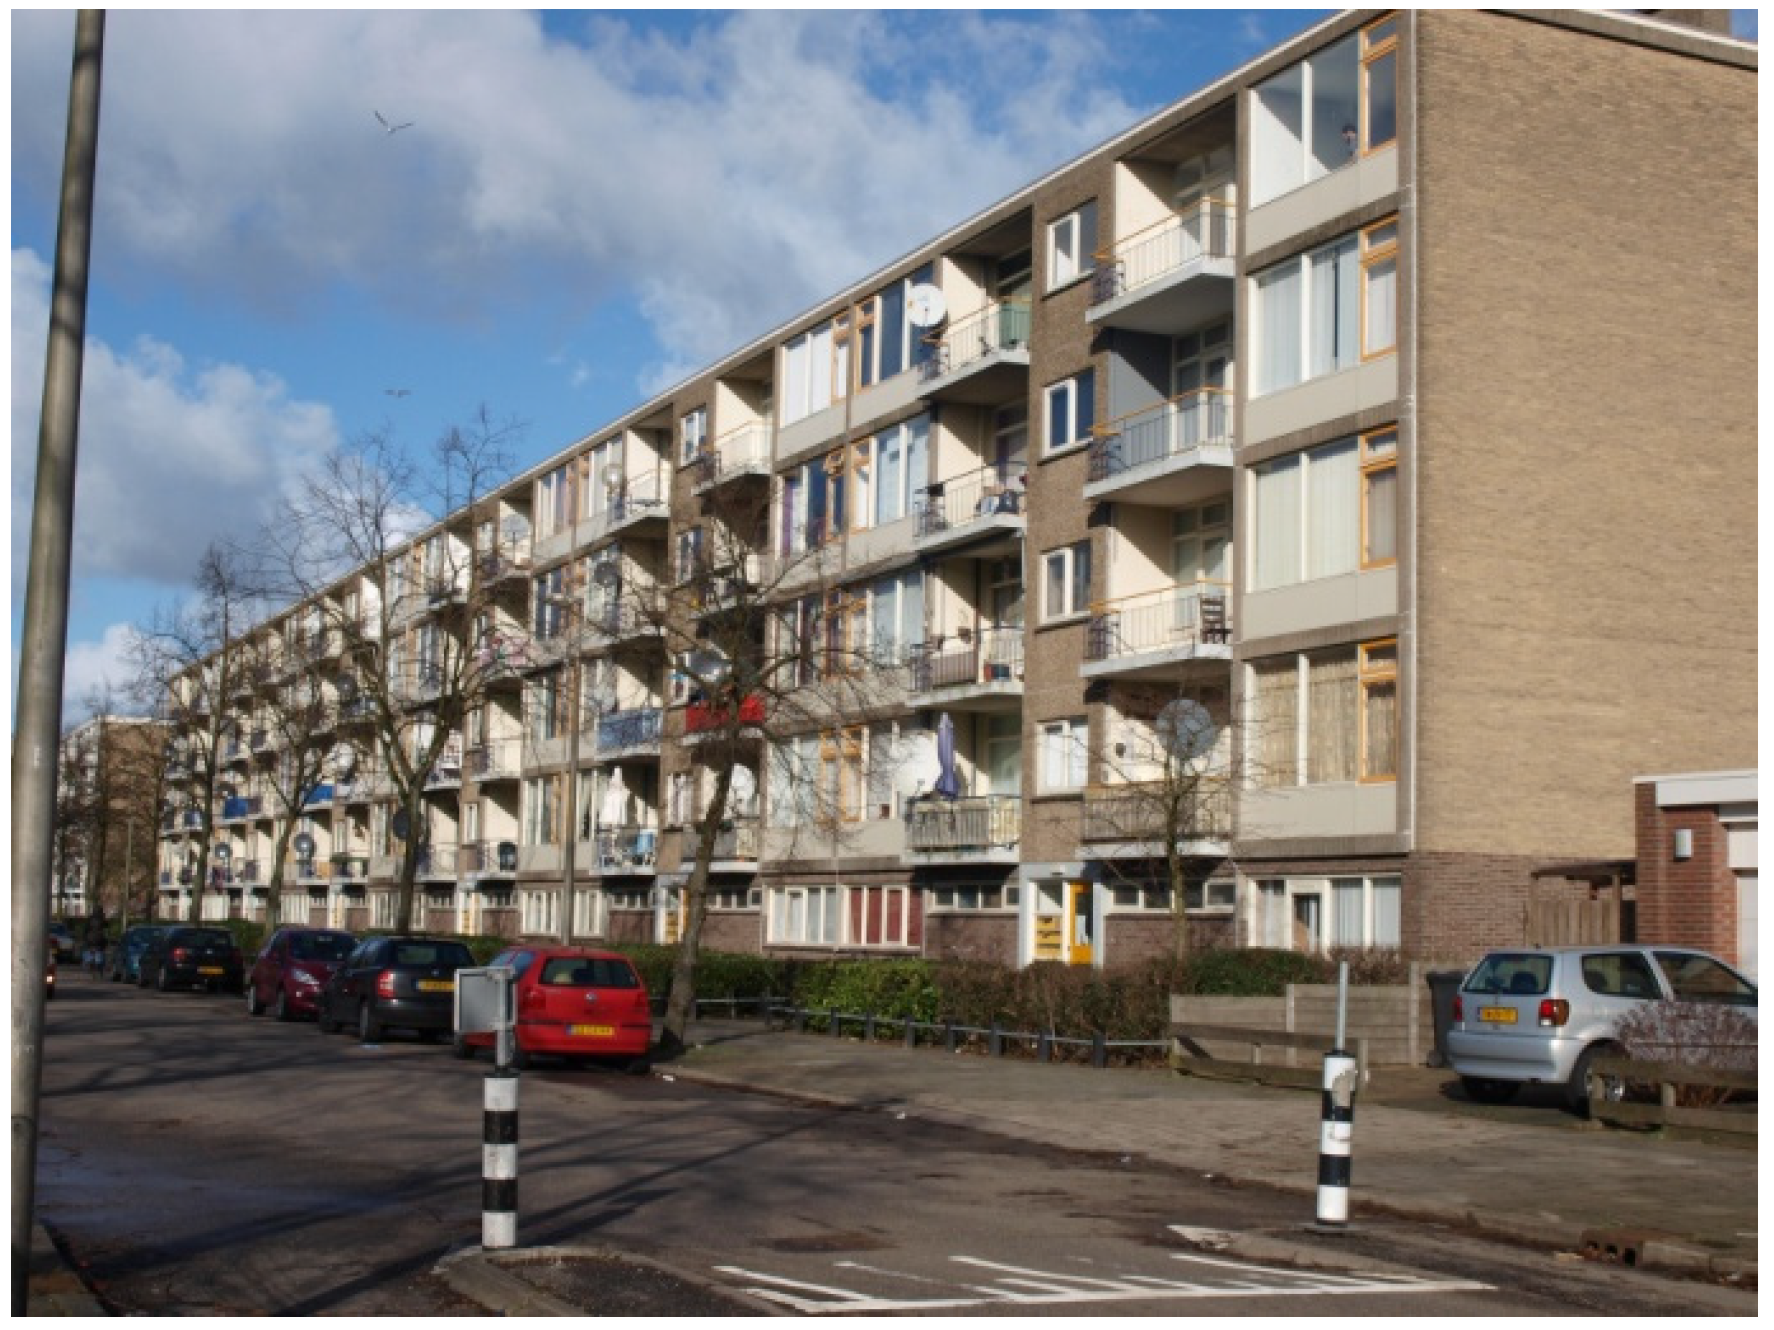
In order to compare the façade strategies, schematic designs were applied to the case study building using materials with the lowest embodied energy, which was found in the previous section. These designs were only given a global amount of detail, because only larger material parts were needed for the calculations. Only the material surface area and thickness was considered and not the detailing of smaller aspects such as sealants. For each strategy, a schematic design was made for the case study building. The case study building chosen is situated at the Marco Pololaan in Utrecht, in the district of “Kanaleneiland”. This building was built in the 1960s and is now owned by a housing association. The building consists of 48 apartments, distributed over five stories, with four different apartment types. Amongst other reasons, this building was chosen as a case study because at the time of research, refurbishment was planned for the building.
The structure of the existing building consists of load-bearing prefab concrete walls. On the south and north side the façade was made of brick, completely without windows (as can be seen in
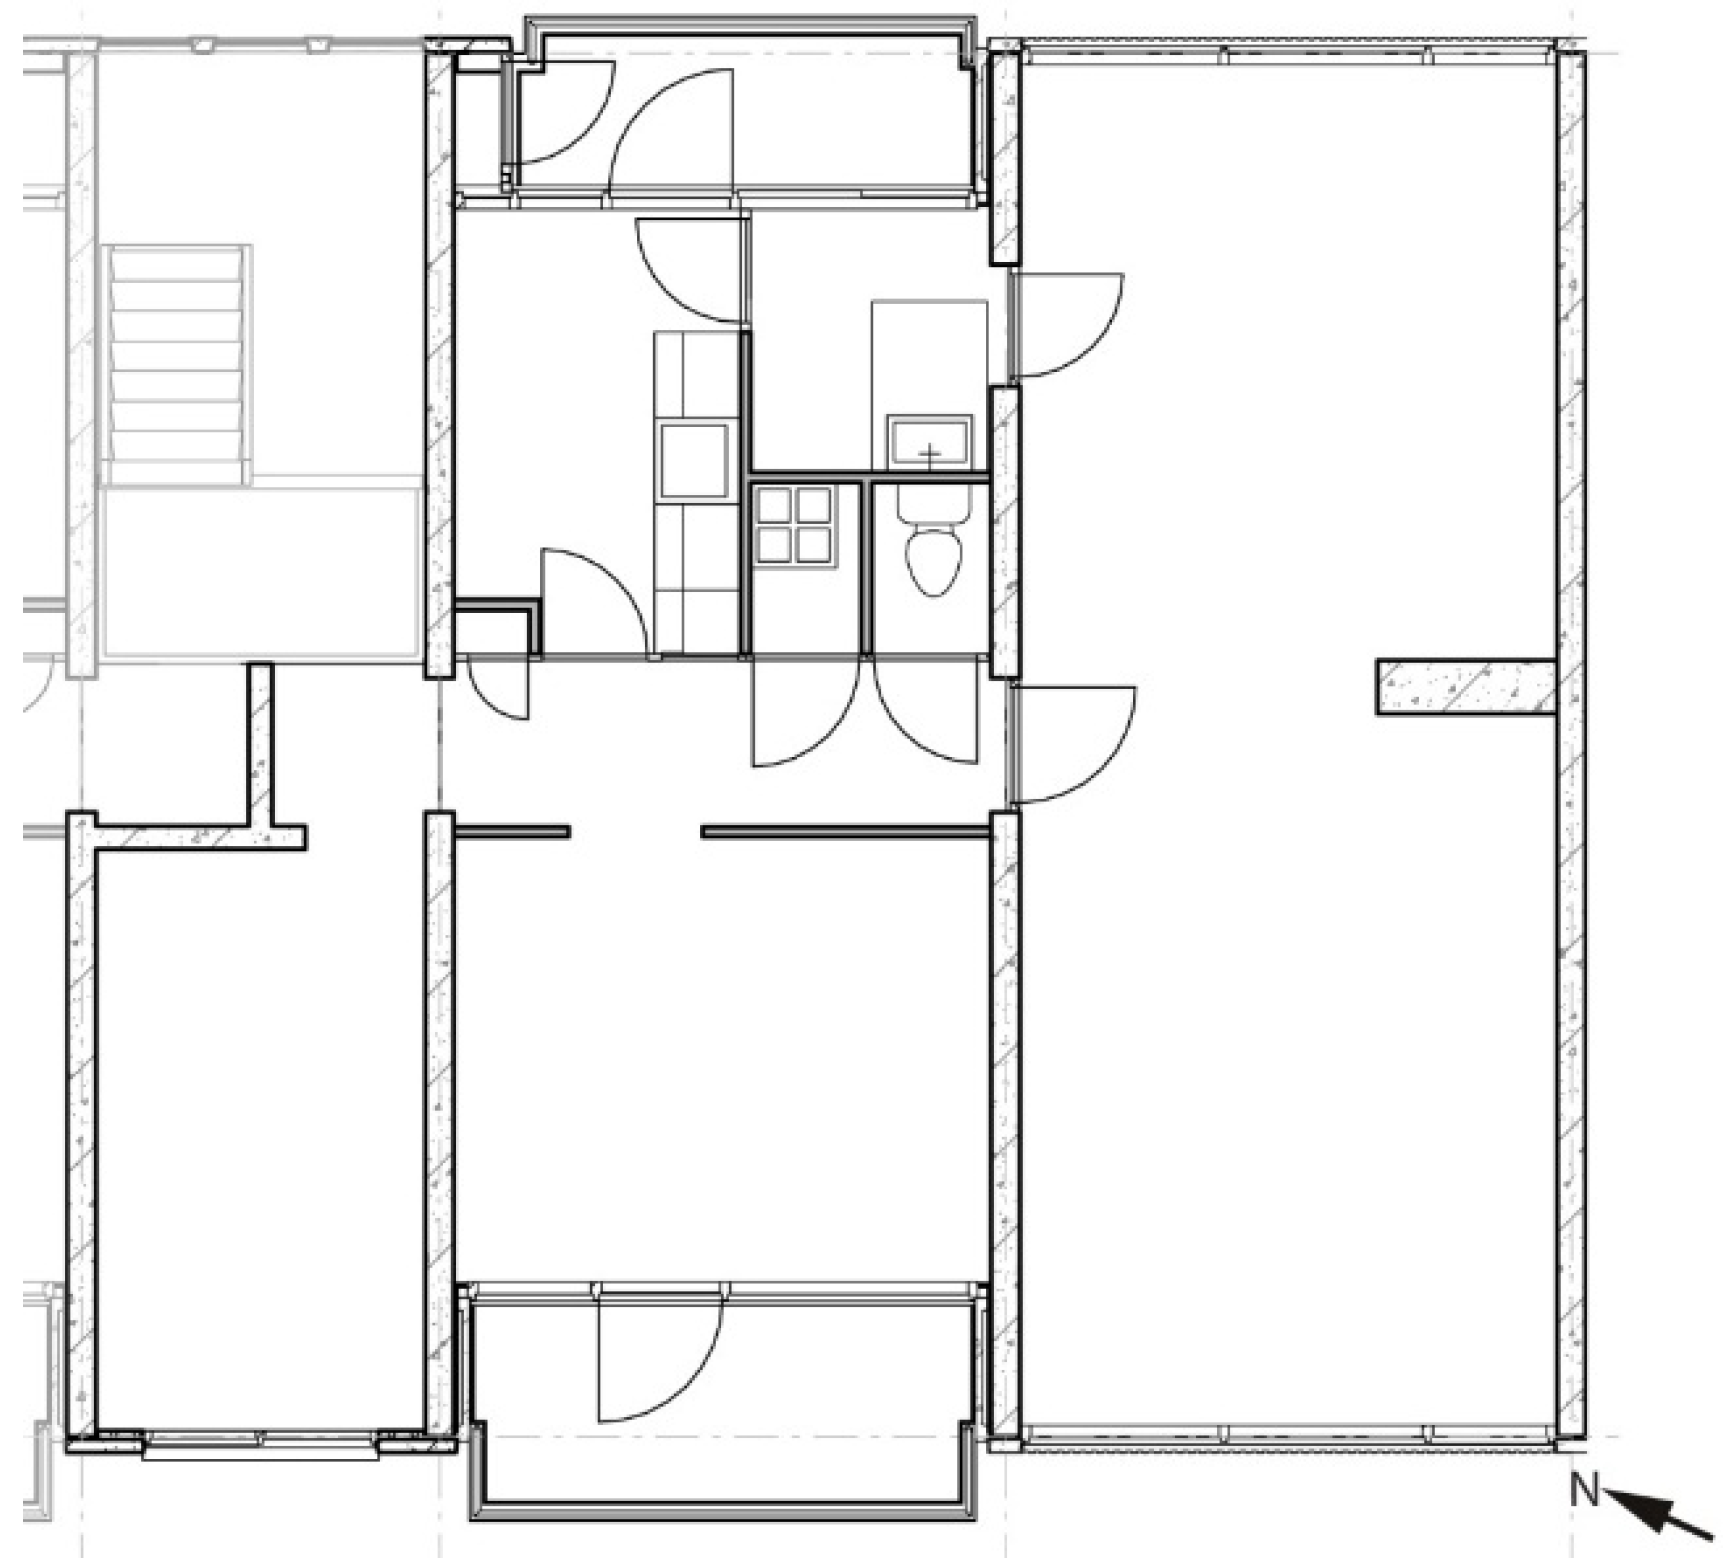
Figure 3). The east and west longitudinal façades comprise both transparent and opaque elements. The windows are single-glazed and some of them have a panel parapet, made of three layers of panels. The rest is made of prefabricated concrete elements. The ground floor has a masonry façade. A floor plan of one of the apartments and part of the elevation is shown in
Figure 4,
Figure 5 and
Figure 6.
Figure 3.
The case study building: a post-war apartment building in the Marco Pololaan in Utrecht.
Figure 3.
The case study building: a post-war apartment building in the Marco Pololaan in Utrecht.
Figure 4.
Floor plan of the right top corner apartment of the case study building [
39].
Figure 4.
Floor plan of the right top corner apartment of the case study building [
39].
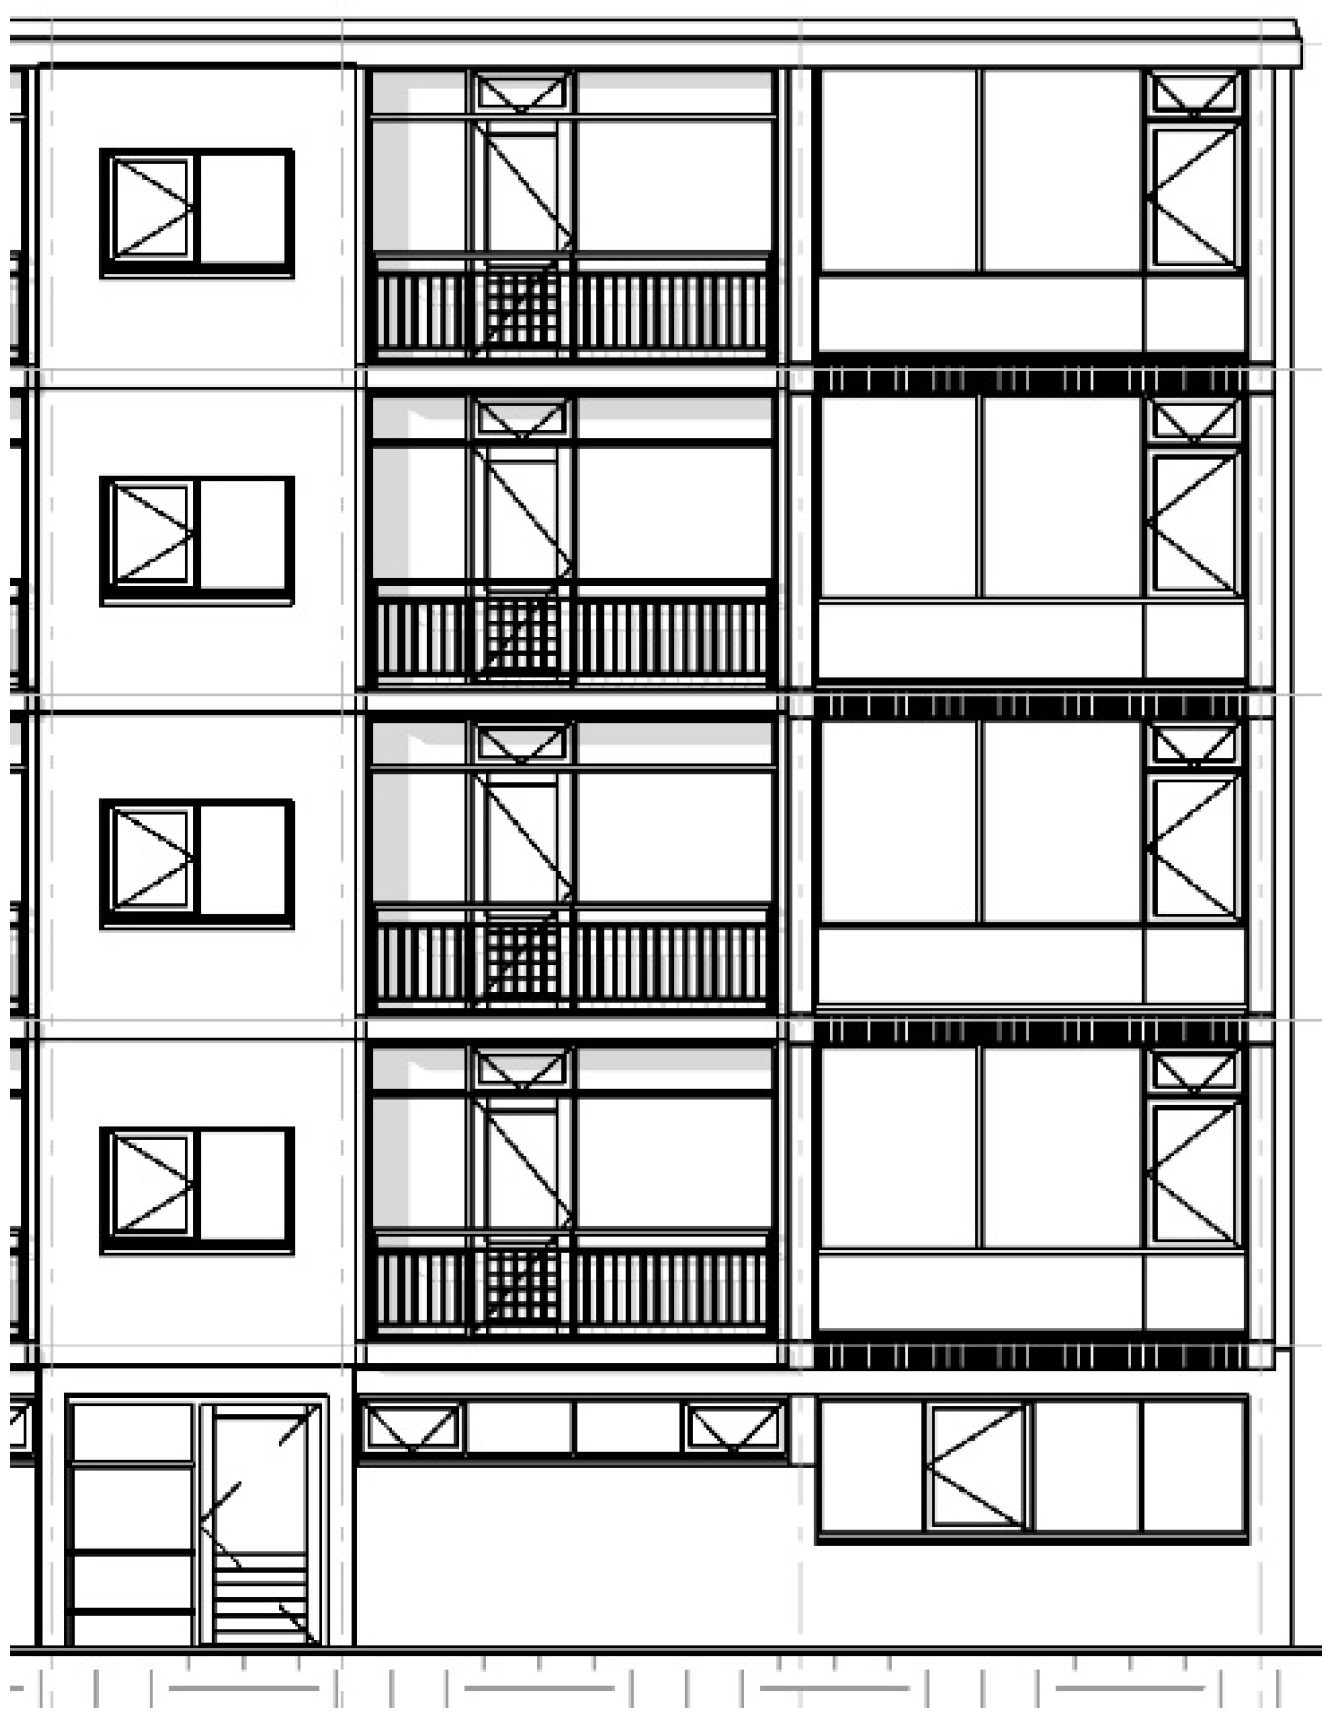
Figure 5.
Part of the front (west) façade of the case study building [
39].
Figure 5.
Part of the front (west) façade of the case study building [
39].
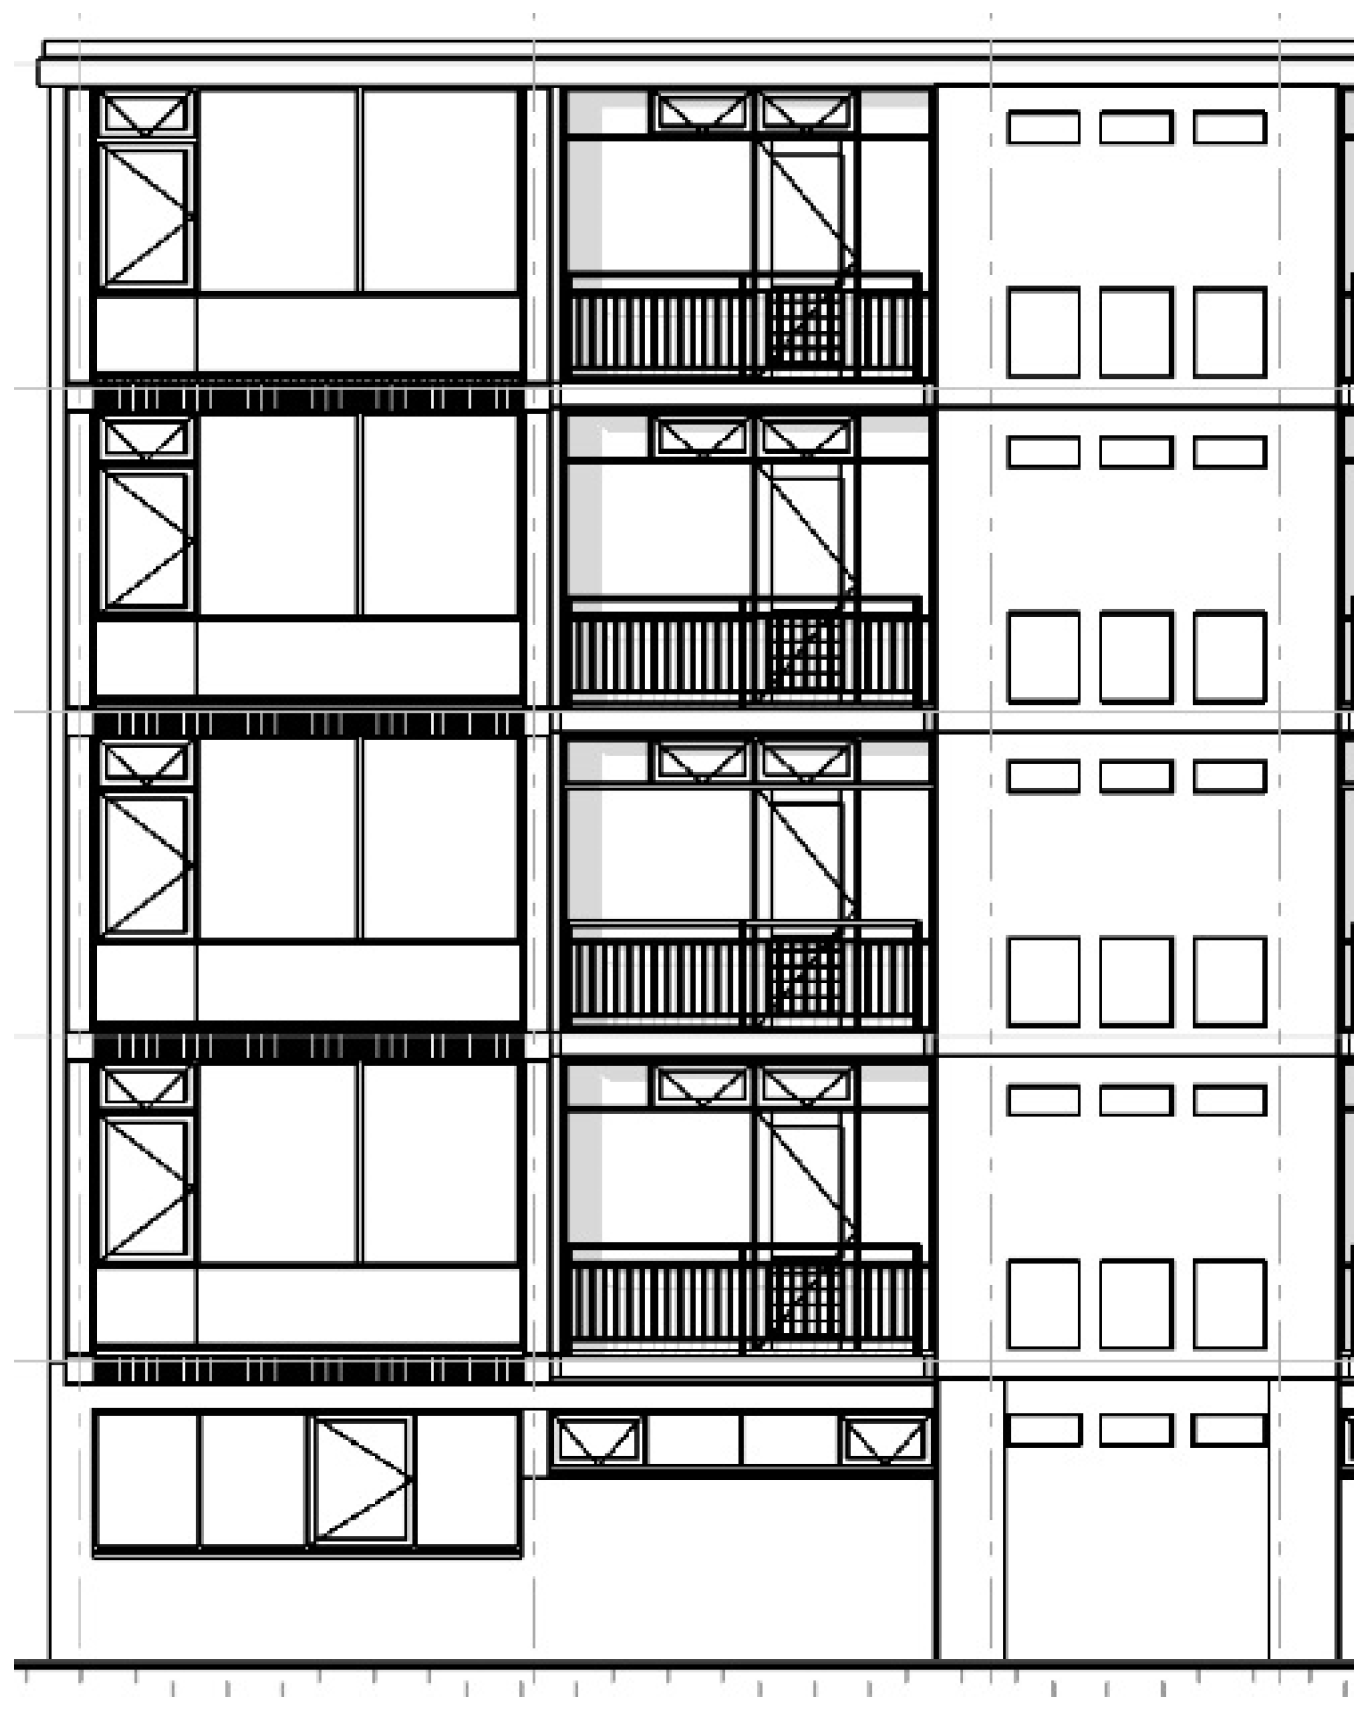
Figure 6.
Part of the back (east) façade of the case study building [
39].
Figure 6.
Part of the back (east) façade of the case study building [
39].
Currently the apartments have an energy label F or G, which are the labels corresponding to the highest energy demand in the label scale. New buildings need an energy label A at least. The façade materials are still mostly functional, but have deteriorated by age. Since its construction in the 1960s, no changes were made to the building until the time of research. The original materials are still present.
One basic design was used for all the three design strategies, where the same amount of glass parts was used. The strategies were different in some design and construction aspects, such as the position of thermal insulation, removal or preservation of existing components,
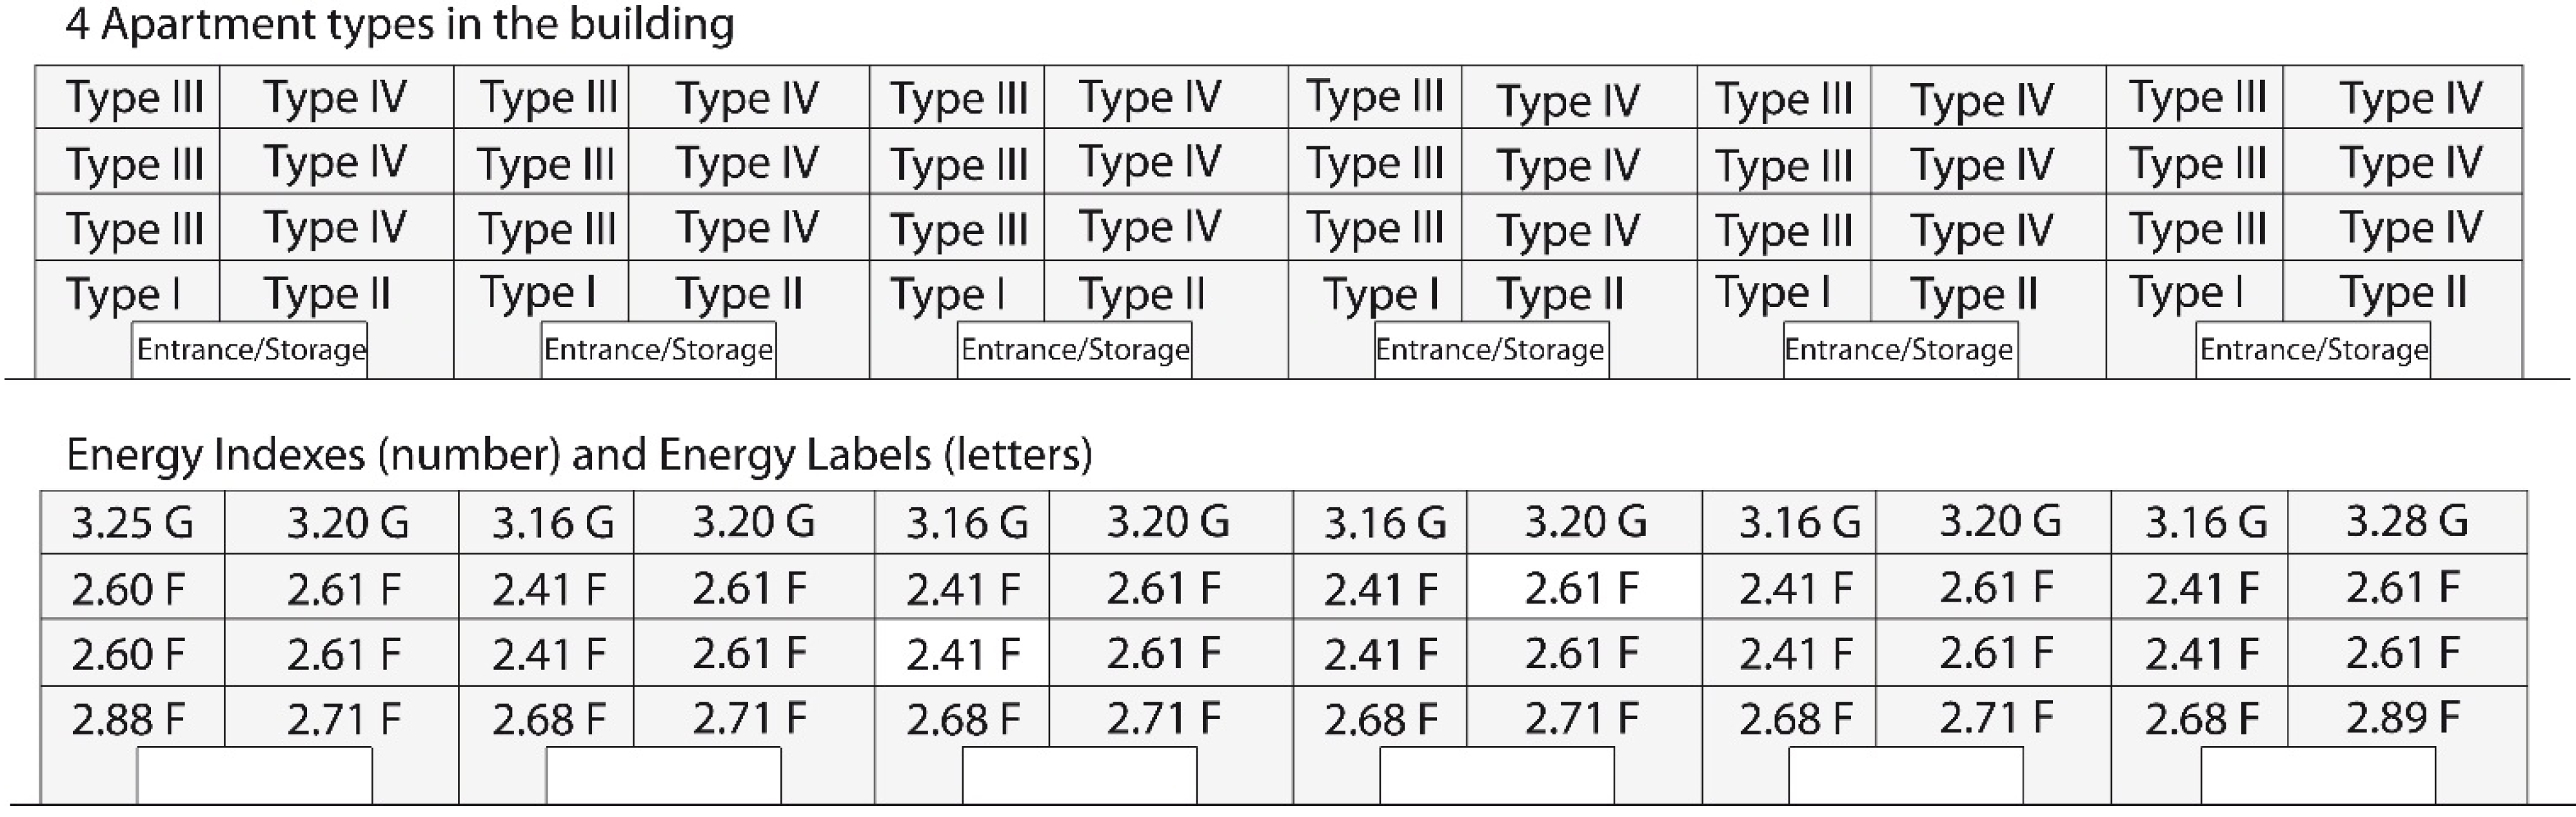
etc. The design used as reference the top corner apartment of the building, due to the larger amount of façade parts and materials in this apartment that can be used in the calculation. In contrast to most of the other apartments, its external envelope includes, apart from the longitudinal façade, the roof and the masonry traverse façade. This apartment was also selected as the design reference because it has the highest energy use of all units in the building (see
Figure 7).
Figure 7.
The top figure shows the four different apartment types of the case-study building on the Marco Pololaan, shown in a view of the front west façade. The bottom figure shows the Energy labels and Energy Indexes. Label A has the lowest operational energy use, label G the highest. The figure was based on data received from the housing association that owns and manages the estate [
40].
The designs were divided into façade parts, which were calculated separately for the comparison. The results from the previous material comparison (
Table 2) were used in the new design. The new material of each component was chosen depending on the type of material that was present in the existing design. For example, when a concrete façade was initially used, fiber cement panels were used in the façade designs. The old panel parapet was replaced by timber cladding. See
Figure 8,
Figure 9 and
Figure 10 for the different designs.
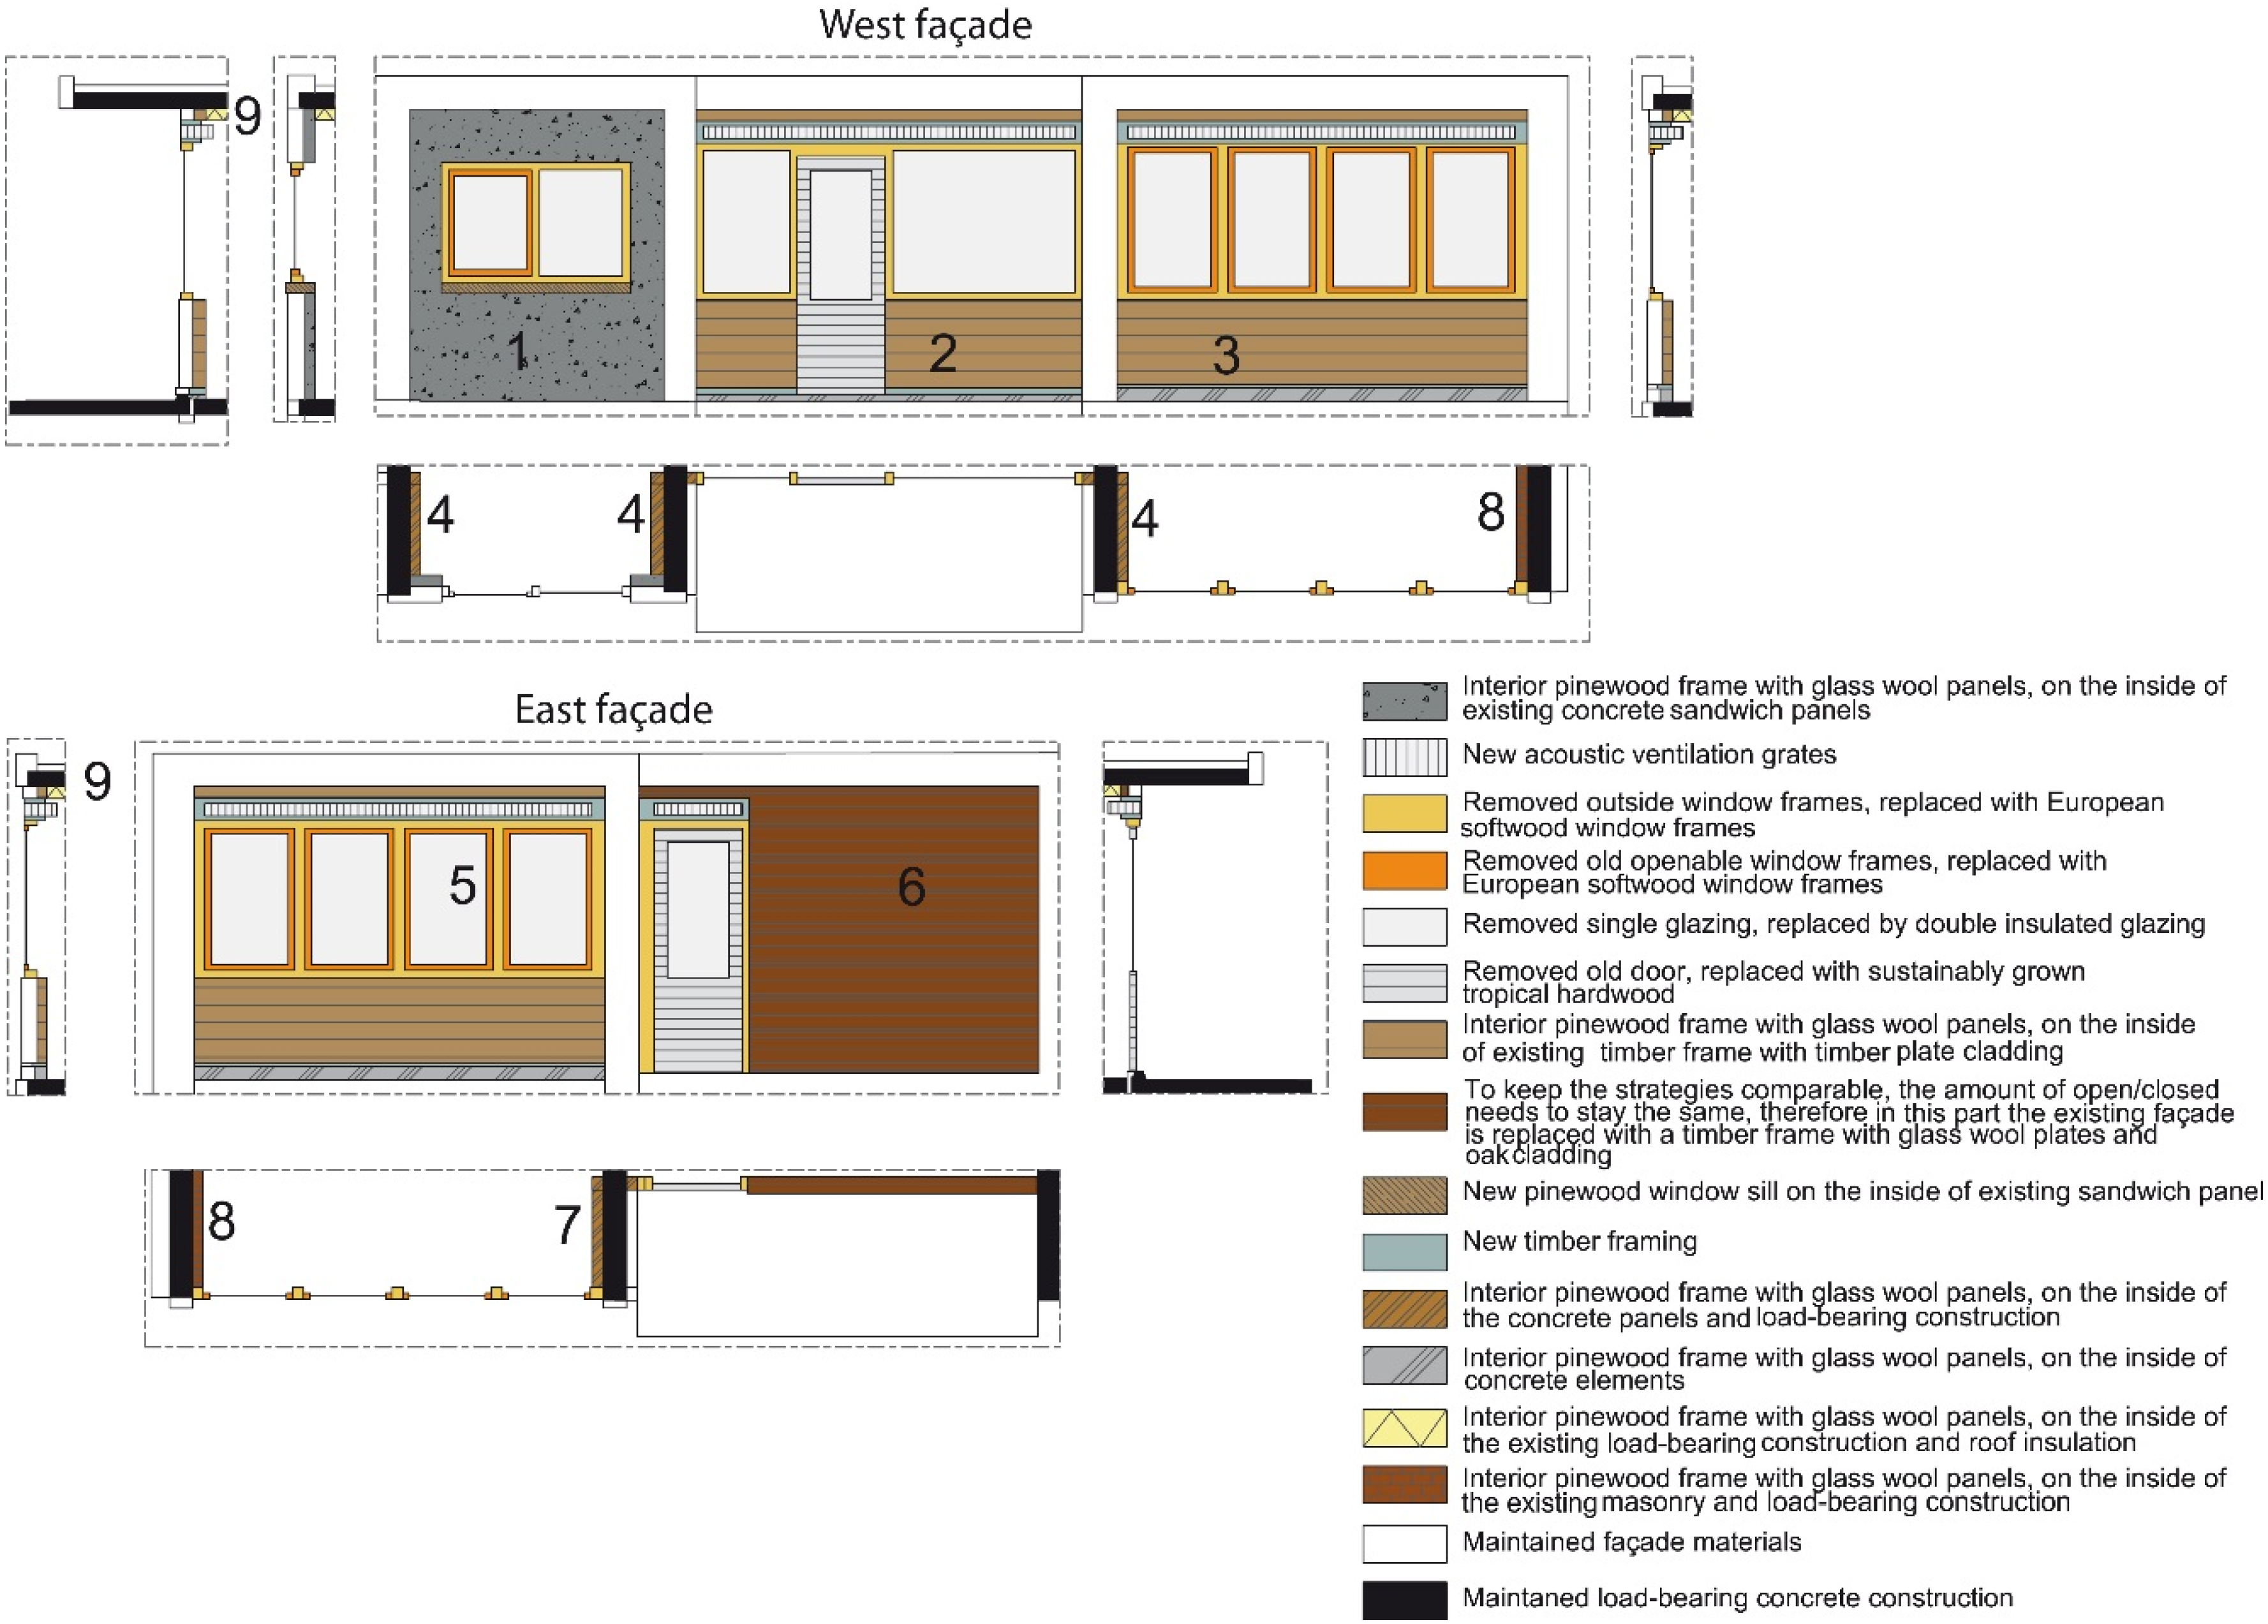
In all designs EPS (expanded polystyrene) boards were used for roof insulation. Only in the strategy of interior upgrading, external façade materials were preserved and an interior insulation layer was added with inside finish (see
Figure 10). The interior insulation walls were made out of glass wool insulation and timber framing. However, all window frames were replaced with European softwood window frames and double-glazed, argon-filled panes (HR
++ glazing).
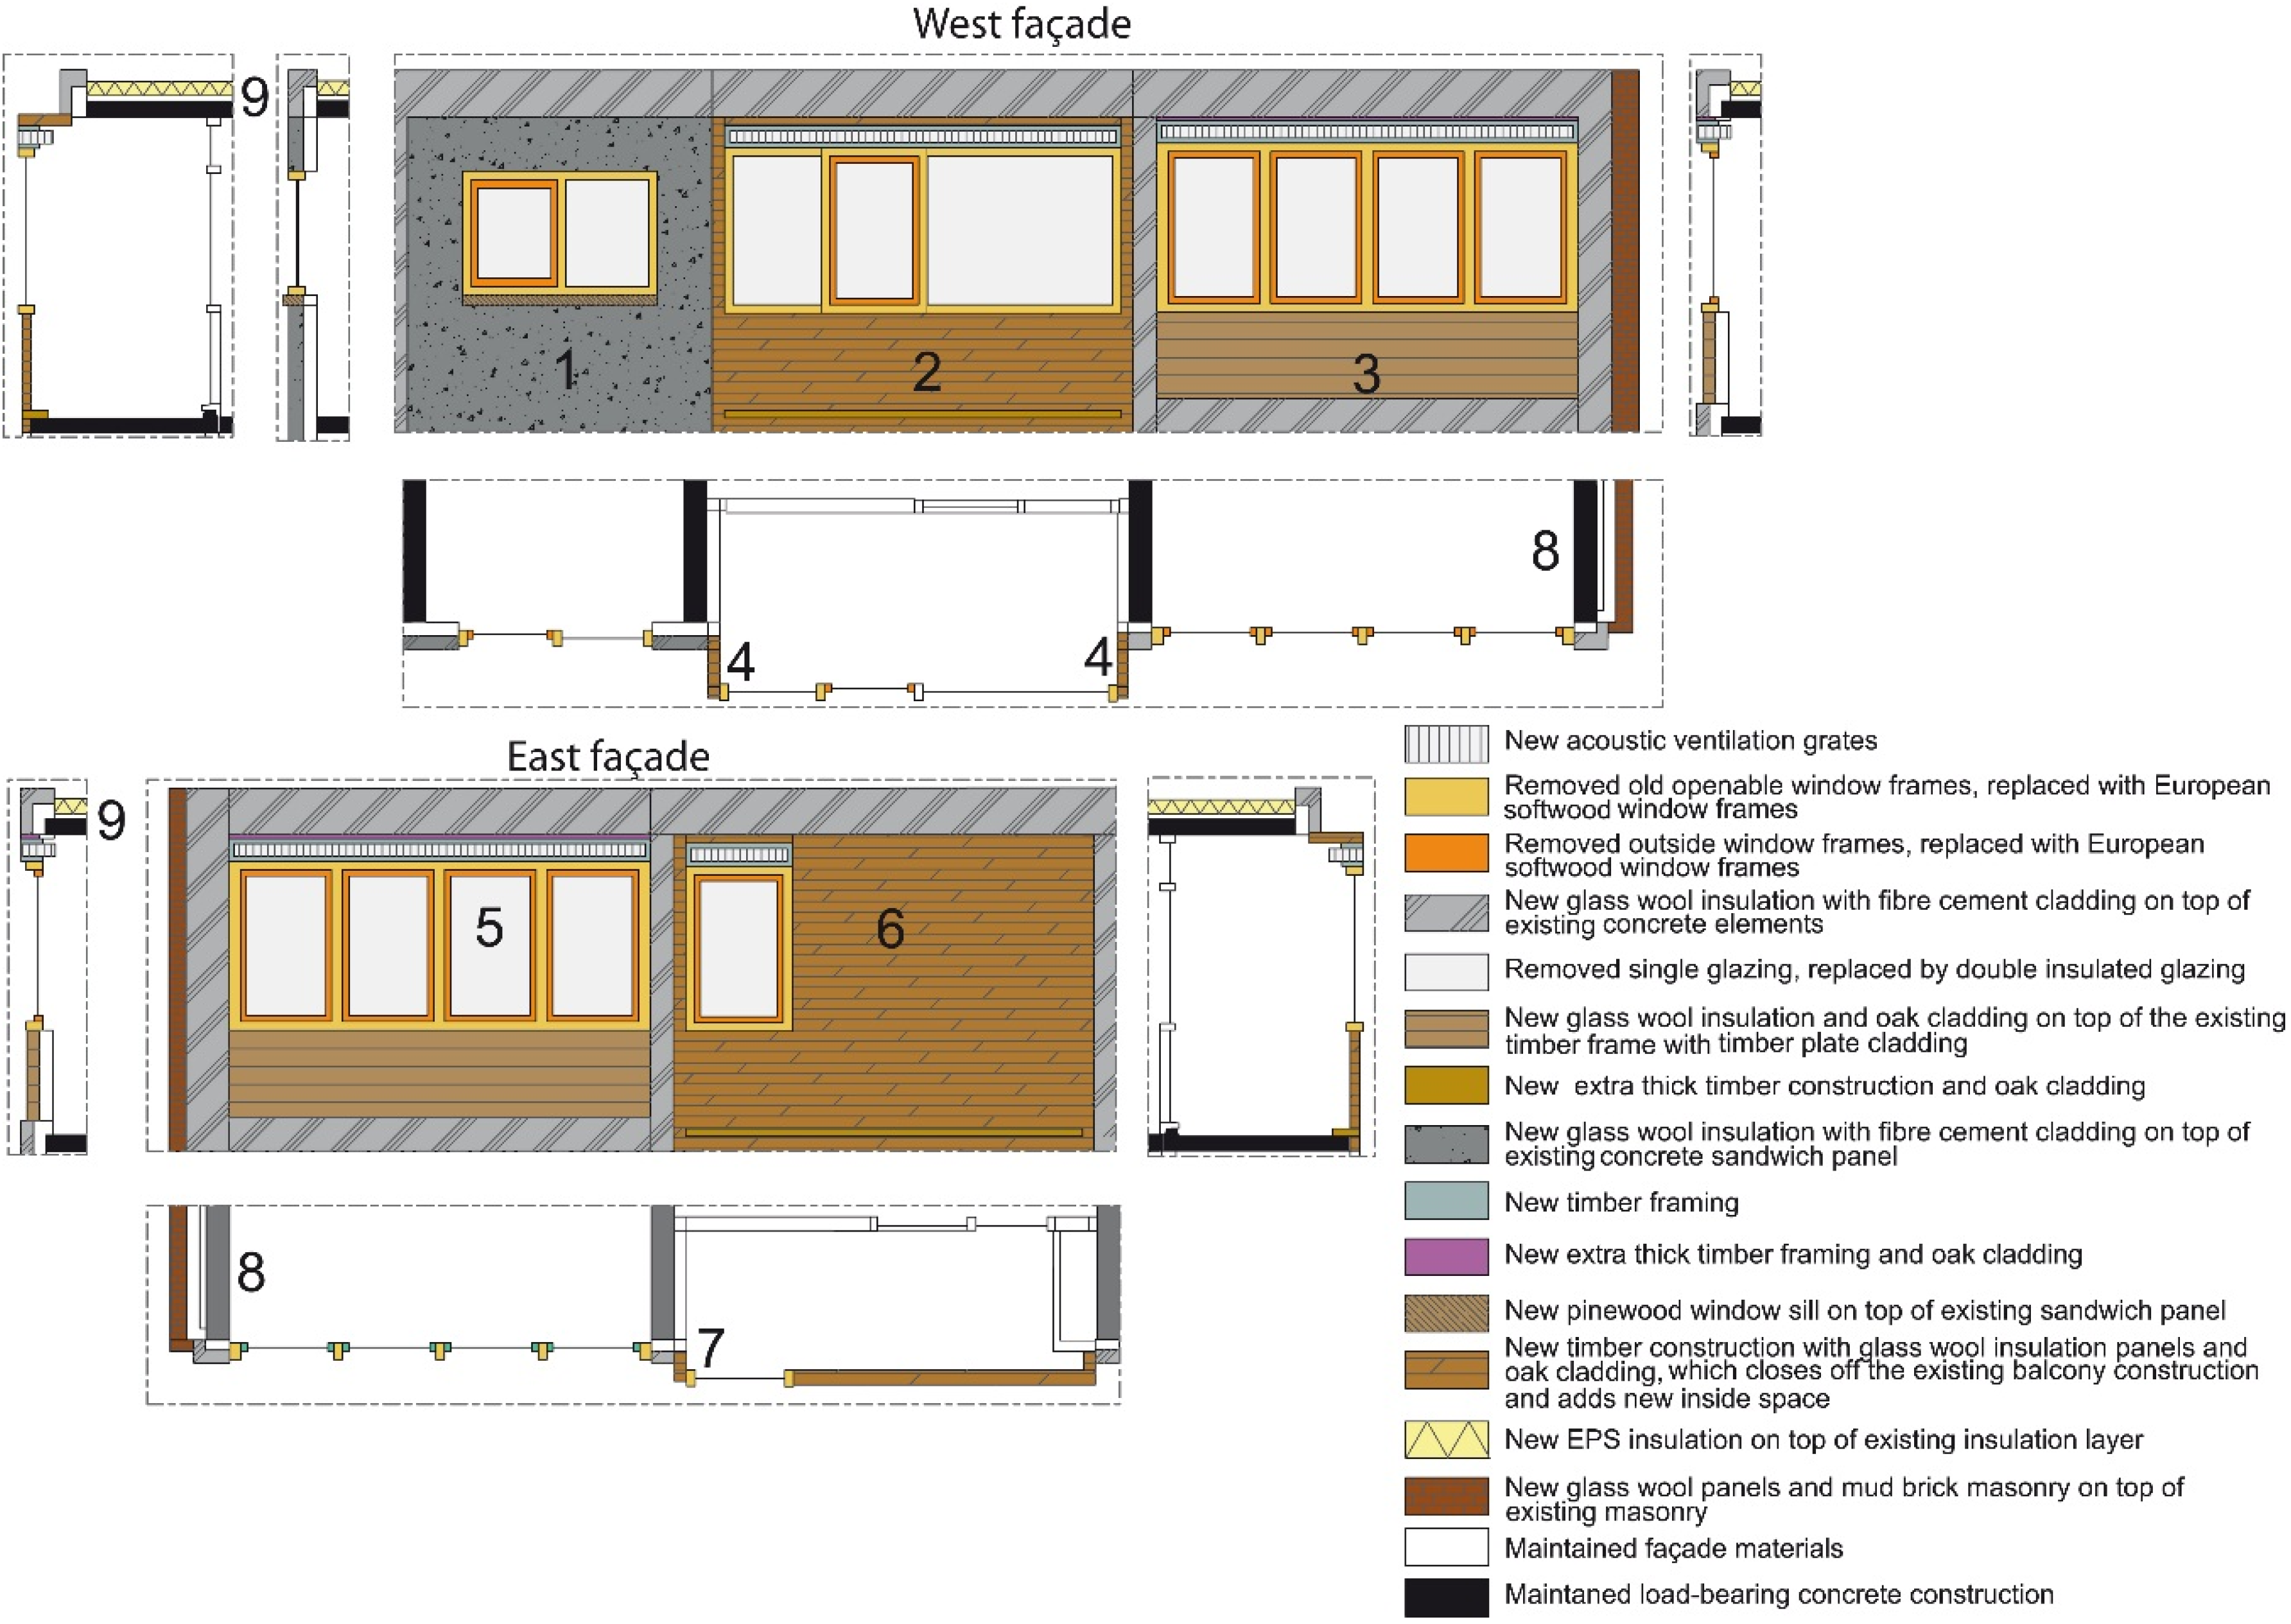
For the façade replacement strategy, new façade constructions were executed with glass wool boards and timber framing. In both the façade replacement and exterior upgrade strategies, for façade part 1, fiber cement cladding was used (see
Figure 8 and
Figure 9). For façade parts 2–7, timber cladding of sustainably grown oak (FSC certified) was used. On the south side, mud brick masonry was used for replacement or exterior upgrading. All window frames were replaced by European softwood and HR
++ panels were used for glazing. For the doors tropical multiplex was used, which is sustainably grown. In the exterior upgrading strategy, the balconies at façade parts 2 and 6 were sealed off by adding a layer outside the balcony construction. This saves energy, because no thermal bridges will occur anymore.
The NIBE database at the time of study did not have data on glass types. For the façade strategy comparison a calculation was made for the embodied energy of new glass parts, based on the different glass thicknesses [
37].
The embodied energy of three global designs was calculated in the Excel sheet, using the following boundary conditions.
The layers of the construction per façade part and per façade strategy were inserted into Excel. The embodied energy needed for new materials was summarized per layer.
The added thermal resistance values of the roof were R = 5.0 m2K/W and for the façade addition R = 3.5 m2K/W. If this is added on top of an existing façade or roof structure, the total thermal resistance is higher, because these old layers also have a thermal resistance. This was the case for the exterior and interior upgrade strategy.
HR++ glazing was used.
The embodied energy of parts that were removed of the old building, for example in the façade replacement strategy, account for 1/3 of the initial embodied energy of those materials. This is because the estimated lifespan of a residential building is 75 years, while this building was only 50 years old.
Figure 8.
Façade replacement design; all façades were removed and replaced with new walls with insulation and cladding.
Figure 8.
Façade replacement design; all façades were removed and replaced with new walls with insulation and cladding.
Figure 9.
Exterior upgrade design; the balconies were “sealed off” with a new timber cladding wall. All walls were upgraded with an R = 3.5 W/m2K insulation and façade cladding.
Figure 9.
Exterior upgrade design; the balconies were “sealed off” with a new timber cladding wall. All walls were upgraded with an R = 3.5 W/m2K insulation and façade cladding.
Figure 10.
Interior upgrade design; insulation with a thermal resistance R = 3.5 W/m2K is added on the inside walls with a finish layer.
Figure 10.
Interior upgrade design; insulation with a thermal resistance R = 3.5 W/m2K is added on the inside walls with a finish layer.
Table 3 gives the results of the calculation from the different façade parts per façade strategy.
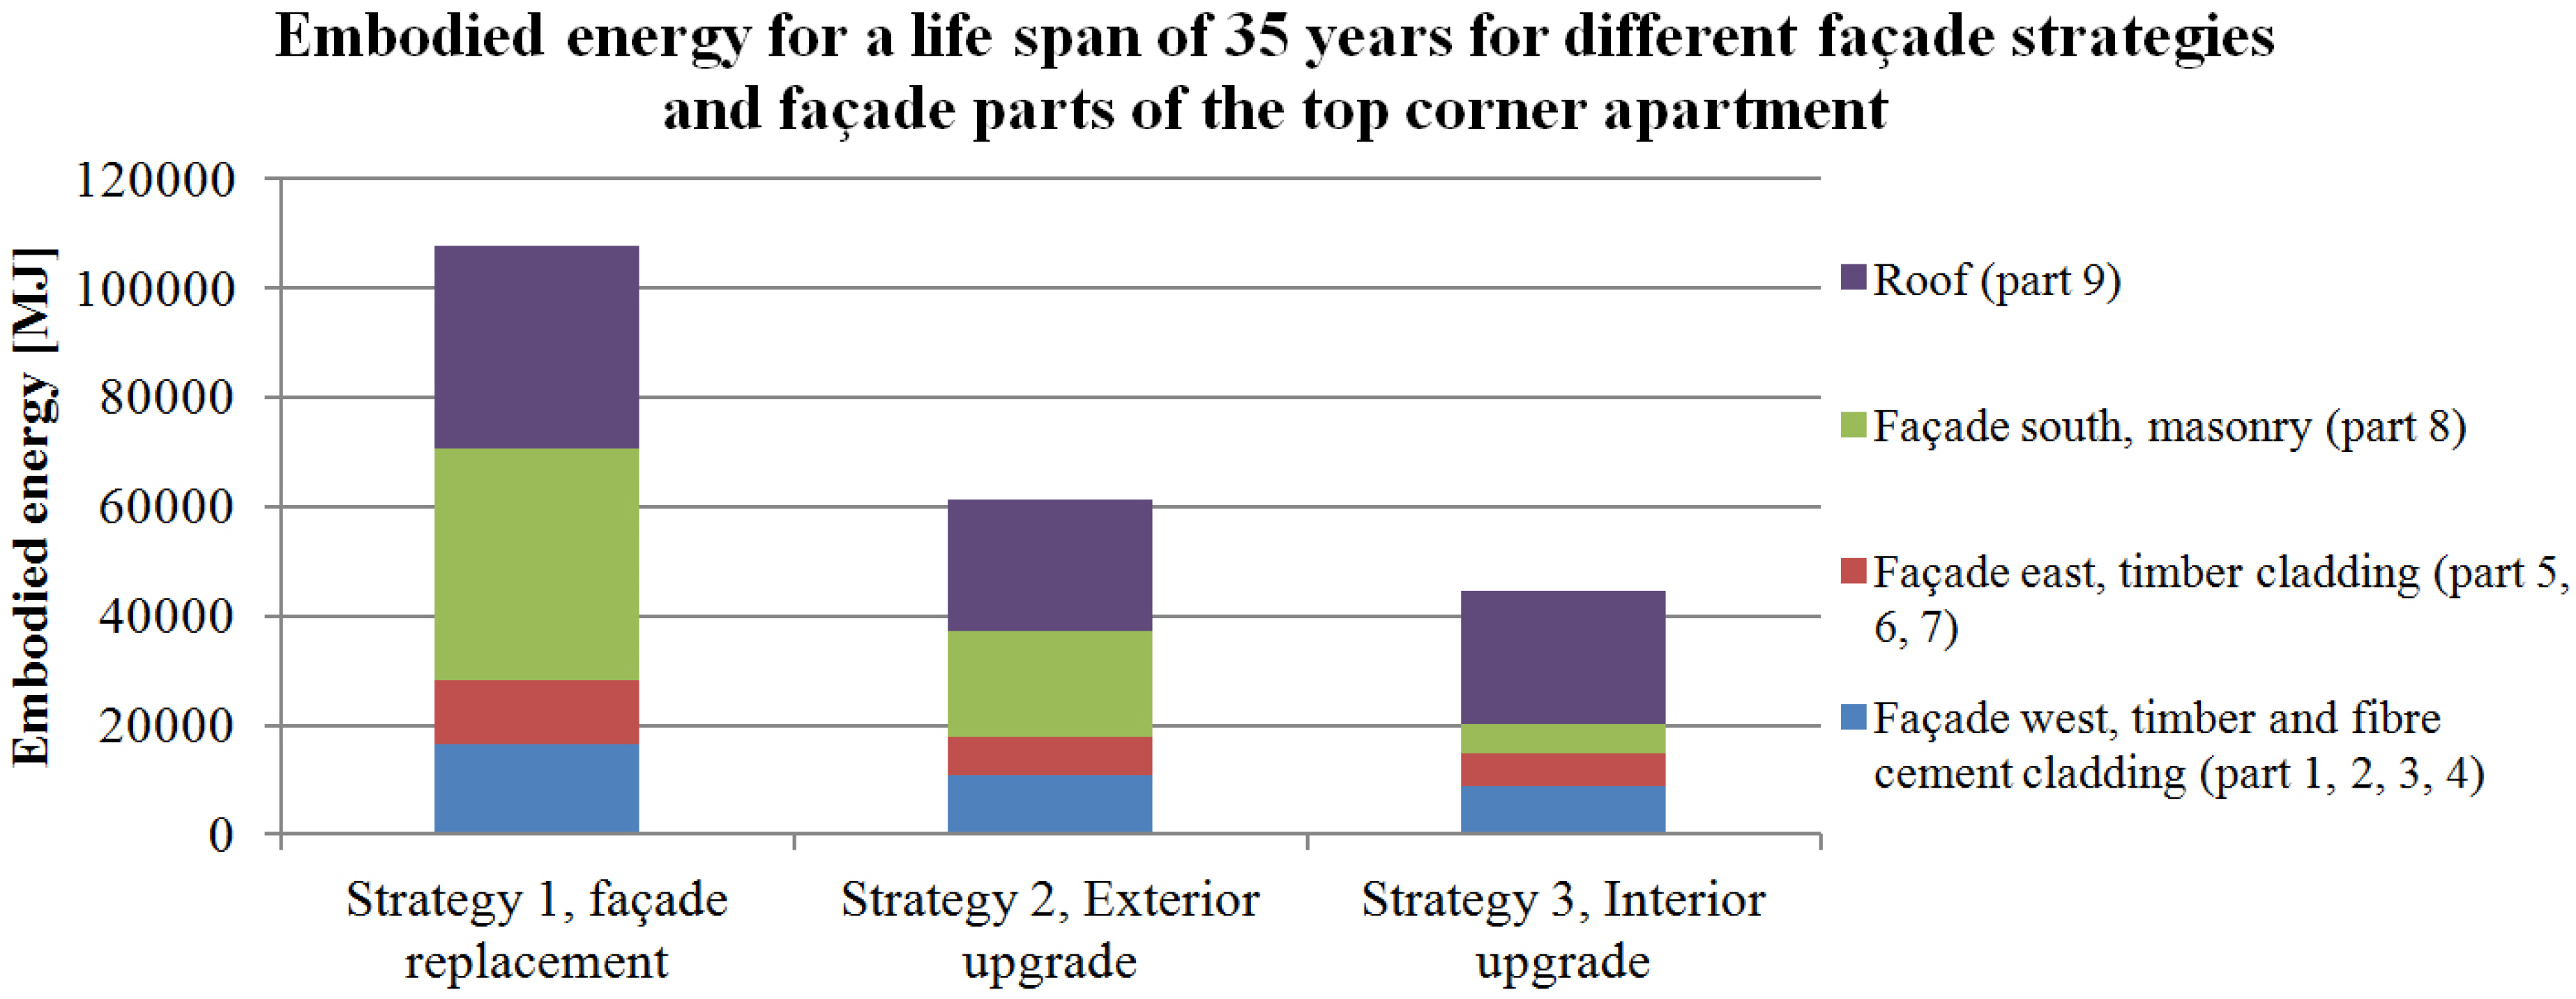
Figure 11 gives the results of this table in a graph. In this graph the total embodied energy per façade orientation is shown. Per façade orientation, different façade parts were combined.
Table 3.
Results of the strategy comparison per façade part for the Embodied Energy for a total of 35 years in MJ.
Table 3.
Results of the strategy comparison per façade part for the Embodied Energy for a total of 35 years in MJ.
| Façade Component | Strategy 1, Façade Replacement Embodied Energy (MJ) | Strategy 2, Exterior Upgrade Embodied Energy (MJ) | Strategy 3, Interior Upgrade Embodied Energy Total (MJ) |
|---|
| Façade part 1 (west) | 3,670 | 2990 | 1430 |
| Façade part 2 (west) | 5,420 | 3350 | 3000 |
| Façade part 3 (west) | 4,370 | 4180 | 2940 |
| Façade part 4 (west side balcony) | 3,140 | 330 | 1460 |
| Façade part 5 (east) | 5,180 | 4070 | 2890 |
| Façade part 6 (east) | 5,340 | 3030 | 2480 |
| Façade part 7 (east side balcony) | 1,060 | 65 | 520 |
| Façade part 8 (south masonry) | 42,540 | 19,080 | 5590 |
| Façade part 9 (roof) | 36,850 | 24,130 | 24,290 |
| TOTAL | 10,7560 | 61,230 | 44,600 |
Figure 11.
Comparison of the façade strategies per façade orientation, combining different façade parts from the previous table, for the embodied energy for a total lifespan of 35 years.
Figure 11.
Comparison of the façade strategies per façade orientation, combining different façade parts from the previous table, for the embodied energy for a total lifespan of 35 years.
The first thing to note in
Figure 11 is that the interior upgrade (Strategy 3) has the lowest embodied energy in total. This is because no external cladding is needed, and no material needs to be removed or replaced on the outside. However, this strategy leads to a much lower internal floor area and a lower floor-to-ceiling height, especially when the thermal resistance is higher and the insulation material thicker. It also does not provide a renewed appearance of the building on the outside and the removal of old materials that are beyond their technical lifespan. Moreover, interior insulation could lead to condensation problems.
The façade replacement has a higher embodied energy than the exterior upgrading. This is because the old materials need to be removed, which also adds to the residual embodied energy. Especially the south façade has a much higher embodied energy when replacing, because of the high residual embodied energy in bricks. Also adding masonry to the existing façade, in the exterior upgrade strategy, leads to a much higher embodied energy than interior upgrading, due to the high embodied energy of the new bricks. It therefore was preferred that the masonry was kept. A solution could be to keep the masonry, add insulation in the cavity and on the inside. By adding insulation in the cavity the inside insulation can be thinner, thus saving floor area.
On the façade parts 1 to 7, the embodied energy of the interior upgrade is very similar to the exterior upgrade. This is due to the low embodied energy needed for the new façade cladding of timber and fiber cement. An exterior addition of insulation and cladding is a better choice here, since this gives a renewed appearance. However, this option is not always possible, due to the detailing of the new design. Sometimes the new construction of insulation and cladding cannot be attached to the existing construction. In these cases façade replacement would be necessary.
5. Strategies for the Entire Apartment
The previous section compared the embodied energy of the design strategies. The comparison of the façade strategies concluded that the interior upgrade strategy has the lowest embodied energy and that exterior upgrading is a better option than façade replacement for the embodied energy. It also gave different conclusions for other façade parts of the apartment.
The next step was to calculate and compare the operational energy of the strategies. The three façade designs were entered into the software tool of ENORM, taking into account the entire top corner apartment and the building services. The floor area can vary as it depends on the strategy, for example internal insulation makes the apartment smaller. The three designs and the varying parameters are shown in the global strategy designs in
Figure 8,
Figure 9 and
Figure 10.
Only replacing the façade often is not enough to make the residence truly sustainable with a low energy use—the operational energy needs to be improved further. The operational energy is the total energy needed for heating, cooling, ventilation, electricity, etc. To simulate a true refurbishment of the building, where necessary, the outdated building services were replaced in the residences. High efficiency systems, such as decentralized ventilation units with heat recovery, electrical heat pumps, and aquifer thermal energy storage (ATES) replace the old heating system, which had radiators and natural ventilation. The existing district heating system replaced the electric geyser for the warm water.
The following boundary conditions were used for the calculations to compare the façade strategies for a whole apartment:
Infiltration qv10;spec = 3 dm3/s∙m2;
New insulating was added of Rroof = 5.0 m2K/W and Rfaçade = 3.5 m2K/W. The total thermal resistance depends on the façade structure, which was kept. If the insulation was added on top of an existing insulated layer, the new thermal resistance of the façade would be higher than 3.5 m2K/W;
UGlass = 1.85 W/m2K, glass g-value = 0.6, no sun shading, double, argon-filled glazing;
Heating with an electric heat pump groundwater, 35 °C < T ≤ 40 °C, heat storage;
Domestic hot water with external heat supply, with an efficiency of 100%;
No cooling;
Decentralized heating system for ventilation with heat exchange and CO2 regulated with zoning.
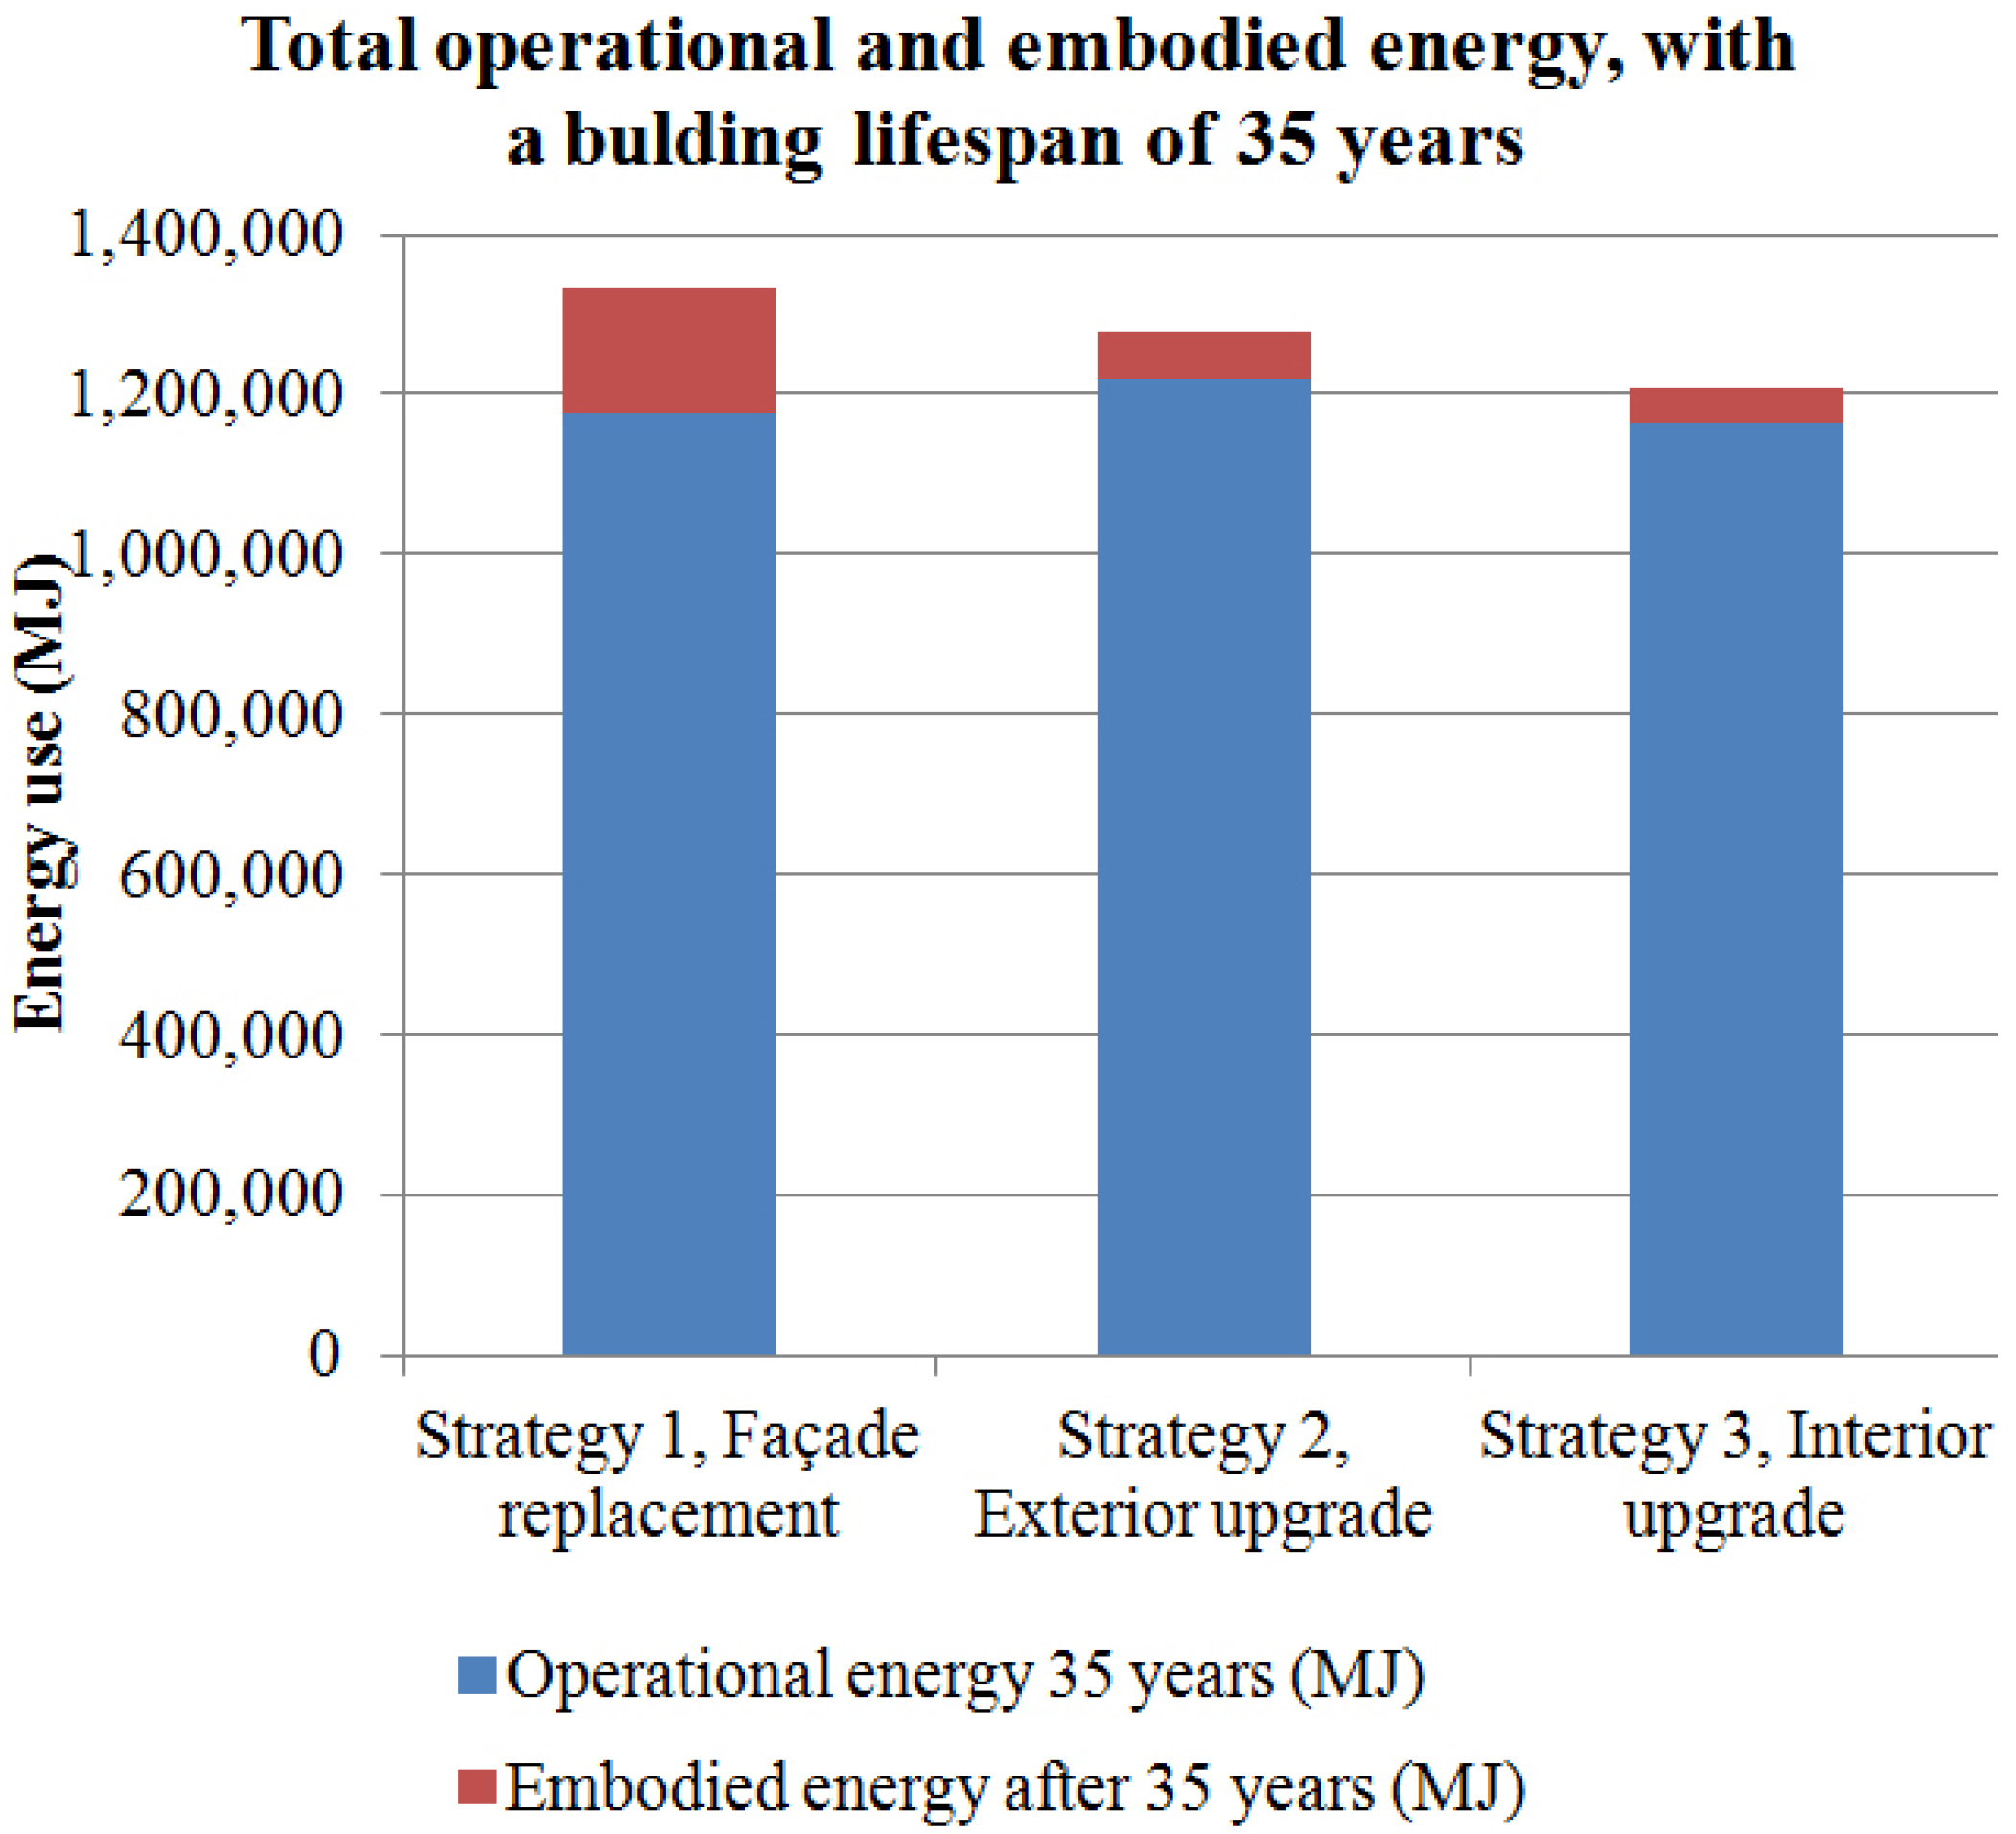
The results of the façade strategy comparison are shown in
Figure 12 and
Figure 13. For the complete façade strategy for a lifespan of 35 years, the operational energy is the lowest if inside insulation is applied. Even though the interior upgrade strategy shows the best results in
Figure 12, this is usually not the best option. Inside insulation can lead to condensation problems and it also decreases the useful floor area.
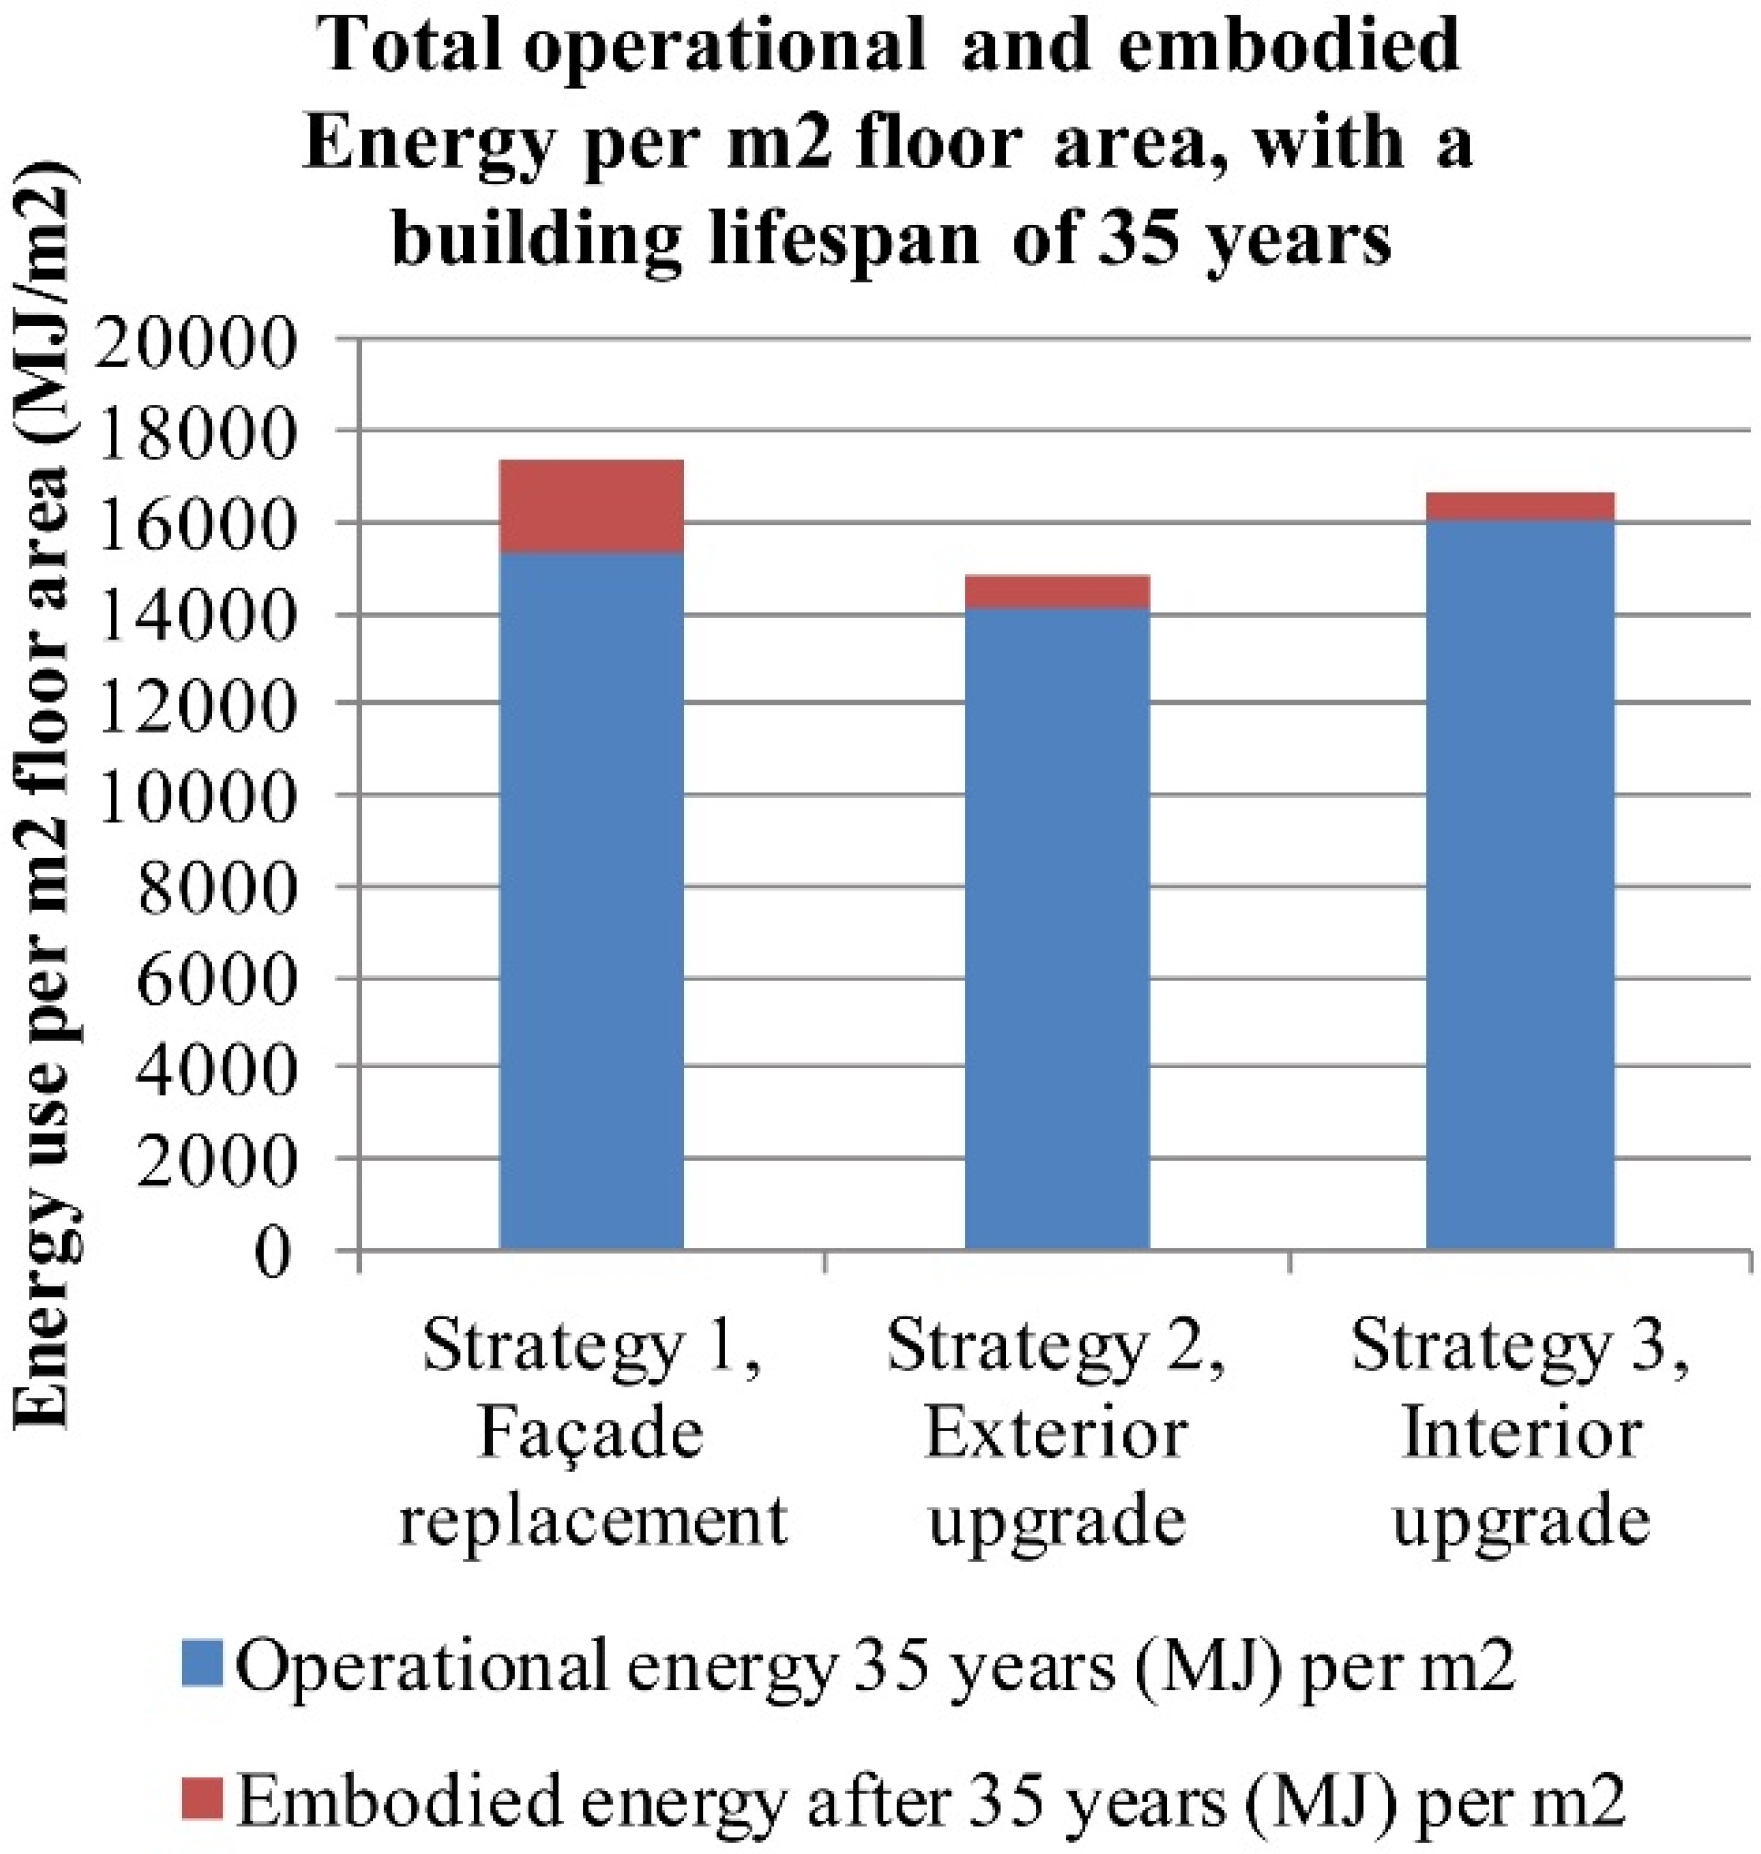
Figure 13 shows that the energy use per m
2 is higher with the strategy exterior upgrade than the interior upgrade. This is because by adding interior insulation the floor area becomes smaller.
The façade replacement strategy shows a higher energy use over 35 years than the exterior addition. This is because with exterior addition, new insulation is added on top of the existing insulation and materials, which gives a higher thermal resistance. Also with façade replacement, the materials of the existing façade need to be removed, which increases the total embodied energy.
The operational energy is lowest per m
2 for exterior upgrading. This is due to the fact that the balconies in this strategy are closed off (see
Figure 9). This leads to a lower transmission area and a more compact building. It also leads to an increase in the useful floor area.
Figure 12.
Total embodied and operational energy per strategy for a lifespan of 35 years for the top corner apartment of the case study building.
Figure 12.
Total embodied and operational energy per strategy for a lifespan of 35 years for the top corner apartment of the case study building.
Figure 13.
Operational and embodied energy per m2 floor area, per strategy, for a lifespan of 35 years for the top corner apartment of the case study building.
Figure 13.
Operational and embodied energy per m2 floor area, per strategy, for a lifespan of 35 years for the top corner apartment of the case study building.
6. Design of the Final Façade Refurbishment
The previous sections presented the different steps to an integrated consideration of embodied energy together with the operational energy performance into the design decisions for a façade refurbishment strategy. Based on these conclusions, a final refurbishment strategy was designed and evaluated for the case-study building.
6.1. Conclusions from the Previous Methodology Steps
In the previous sections, conclusions were drawn per façade part and also for the complete apartment, for the embodied and operational energy. These conclusions were used to make the final design for the case study building with the lowest life cycle energy. However, the combination of the best renovation strategy and the best material for the façade components is not always the best. Sometimes the detailing of the façade is not possible for the selected combination of refurbishment strategy and material. In the final design, as much of the results from the previous parts were used, if possible.
The following choices were made for the new design.
Exterior upgrading where possible, where external insulation with cladding is added on top of the existing façade. Also, insulation should be added on top of the existing roof structure. The possibility to apply the exterior upgrading depends on the detailing; some detailing does not allow attachment of new materials on top of the existing structure due to weakness of the material.
The most suitable strategy also depends on the embodied energy of the existing façade. For example, masonry has a high-embodied energy and it is not preferred to demolish it or add a new layer of brick. Therefore the masonry on the south and north should be kept and repaired, with cavity insulation and inside insulation.
Closing off balconies (so that the outside balcony comes into the building envelope) by adding a new façade, to prevent detailing problems and improve the façade appearance.
Furthermore, based on conclusions from variation studies [
37], other principles were used in the design. A glass percentage of 50% or lower was designed, since no sun shading was applied. A higher percentage would lead to a higher cooling load and transmission losses, which could increase the operational energy. Also, a higher thermal resistance of the insulation is better for a lower operational energy. For the façade, additional insulation with a thermal resistance 5.0 m
2K/W was used and new roof insulation with 7.0 m
2K/W added on top of the thin layer of existing roof insulation, in accordance with conclusions from a variation study of various insulation standards ([
37], page 114). Also, the use of triple glazing decreases the operational energy, with a reasonable payback time of embodied energy. The building should have a low infiltration value, of maximum
qv10 = 0.15 dm
3/s/m
2. Also, in this case, the balconies should be closed off to lower the outside façade area and add extra inside space. A new outside balcony could be added in the design, made out of a steel construction with timber flooring.
6.2. Design
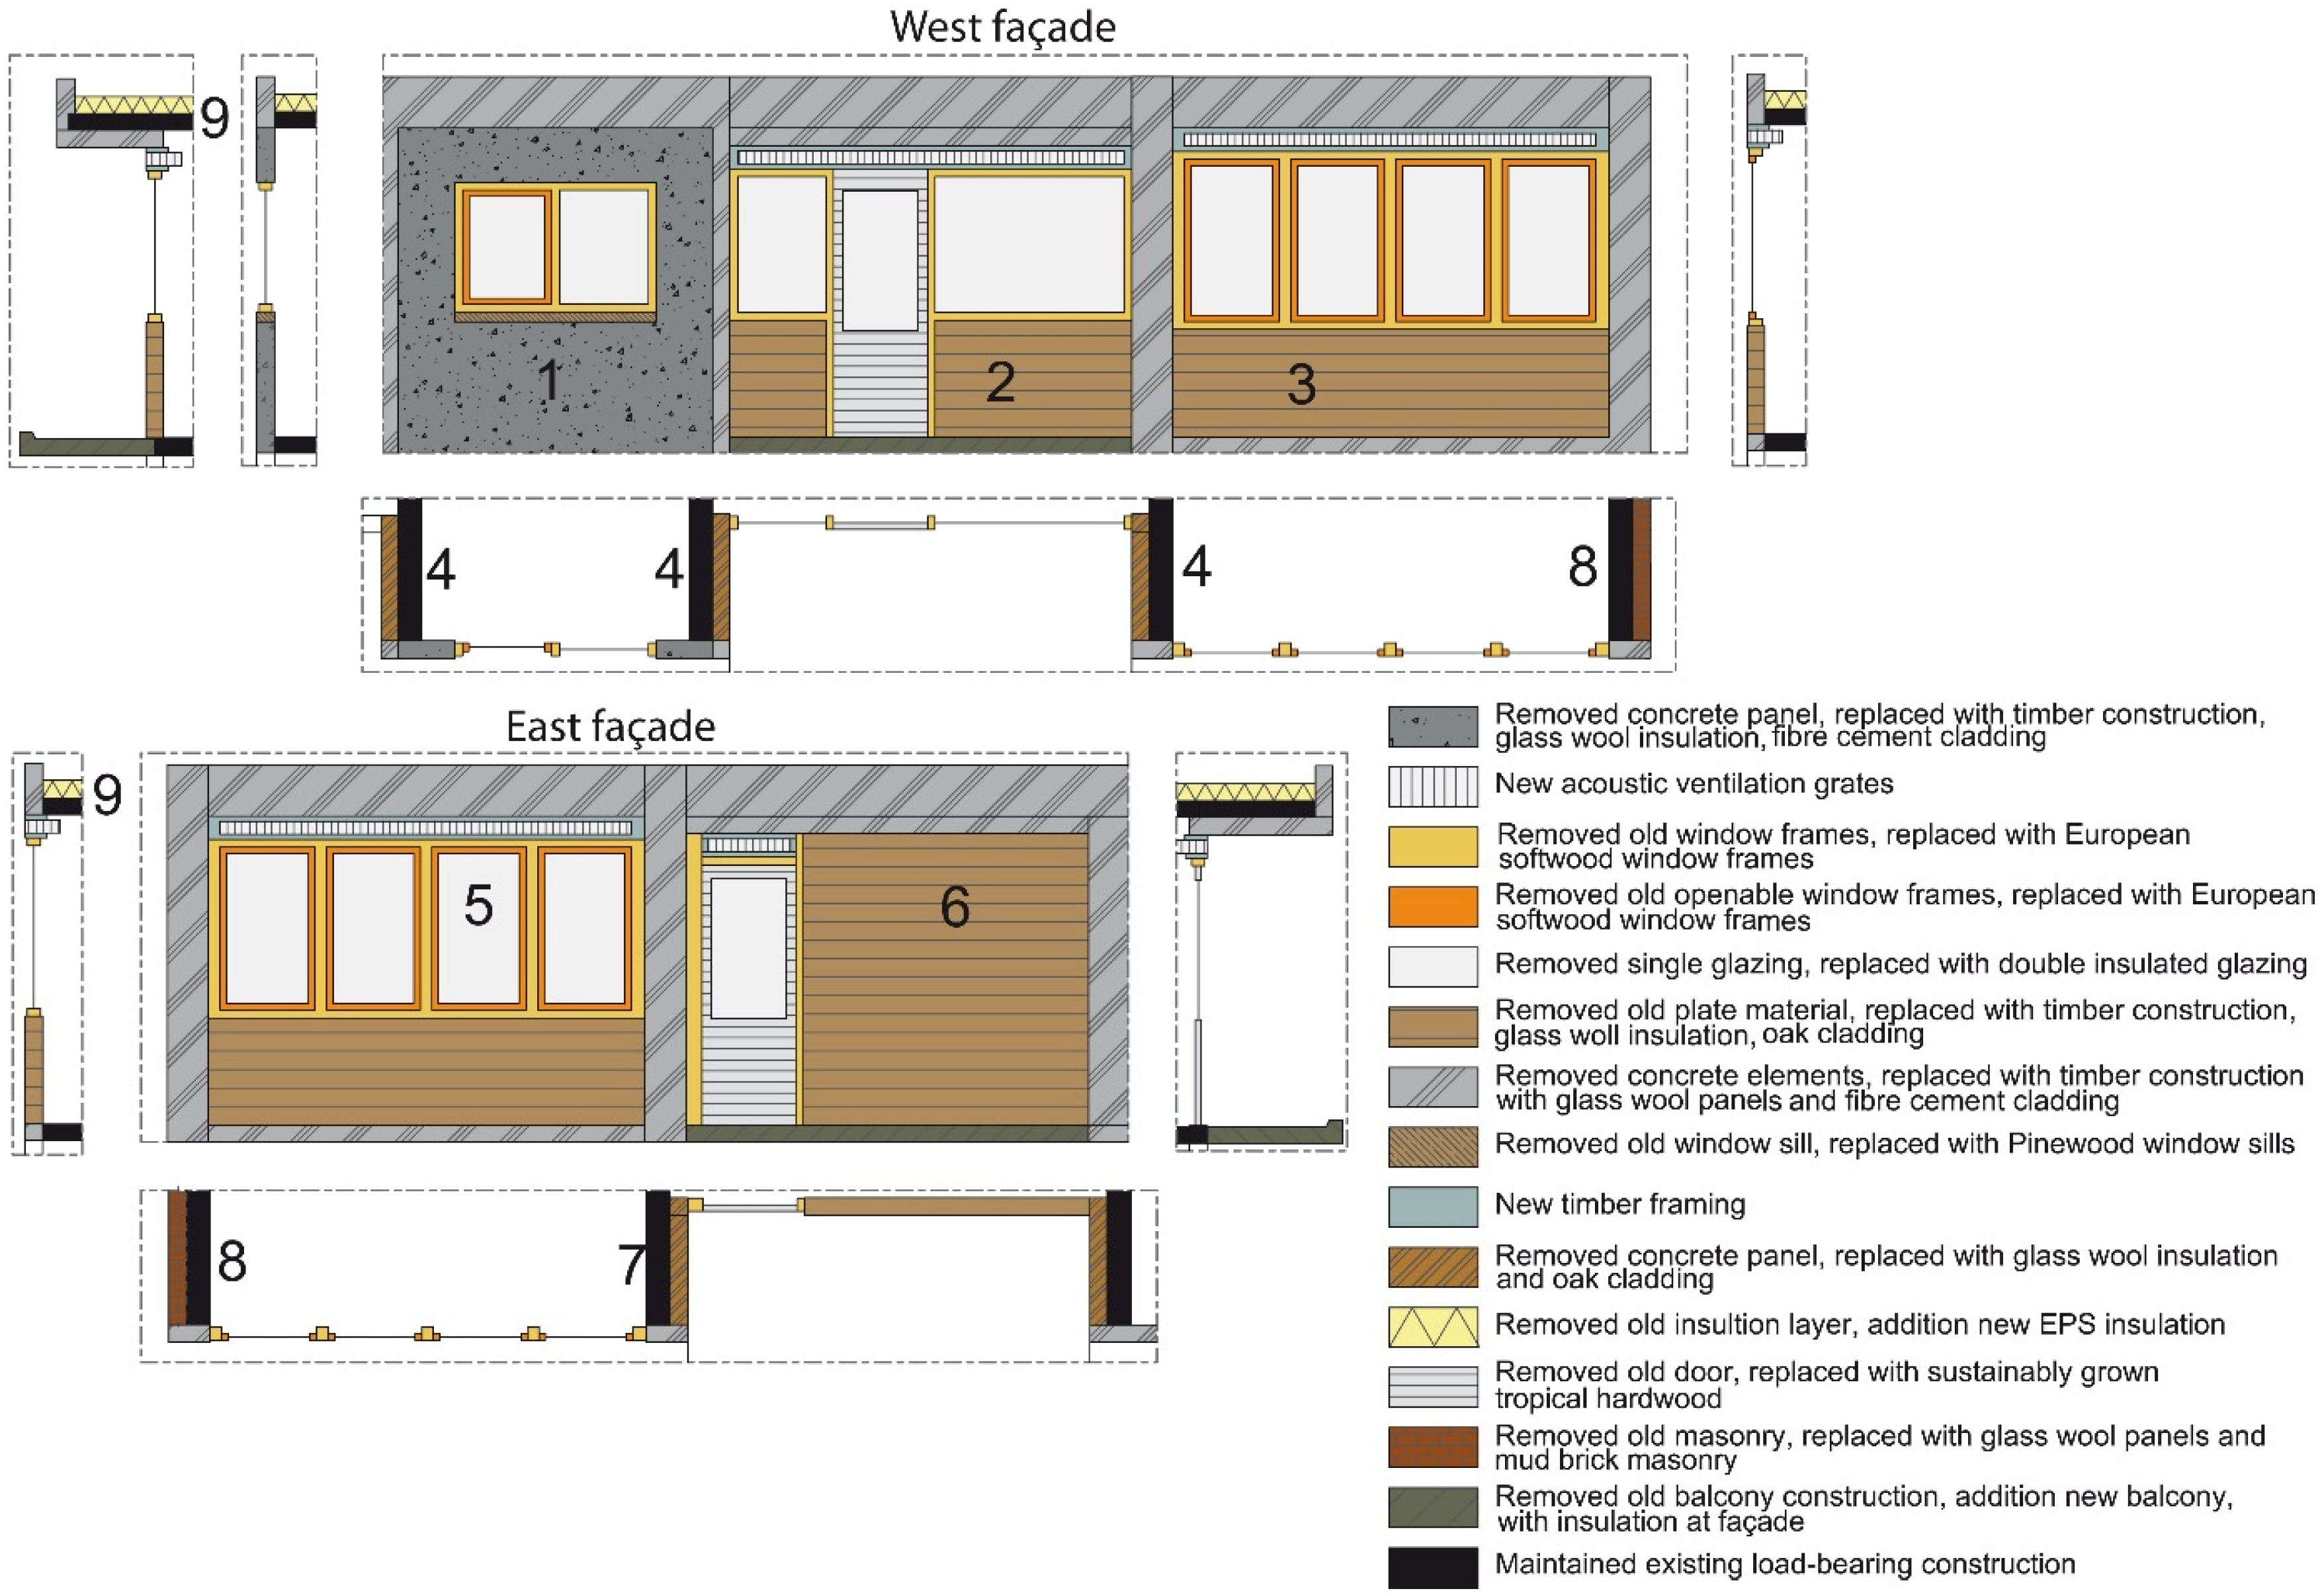
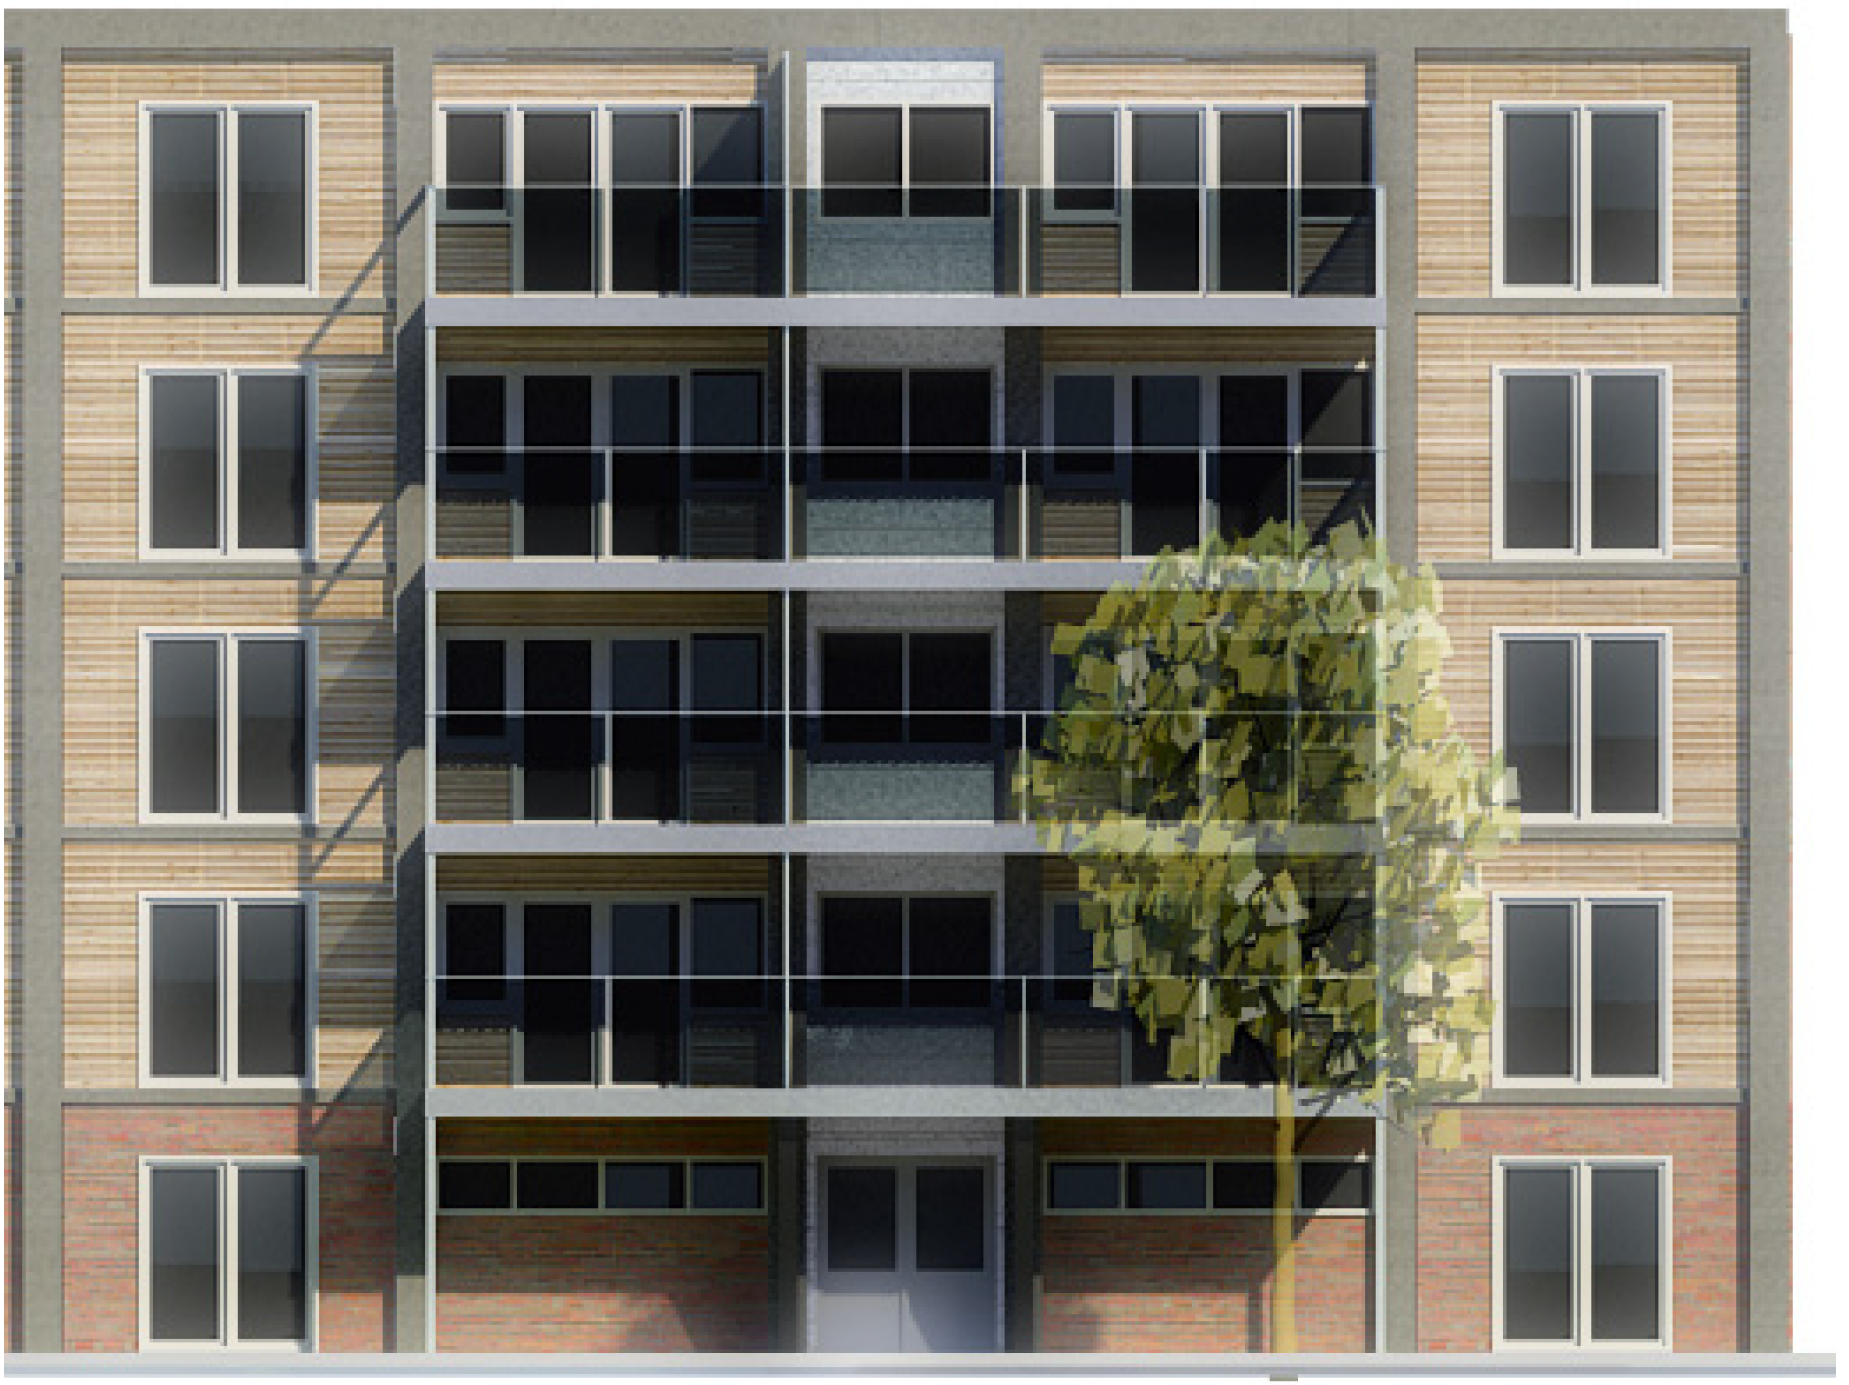
Figure 14 shows the new façade design of the top corner apartment.
Figure 15 and
Figure 16 show the elevations of a part of the building. In the apartment building on both the West and East façade new balconies were added. For this balcony, a steel construction with timber flooring was used. The railing was made out of steel with a glass filling, for a transparent view.
The appearance of the old façade was preserved in the new design; at the position of the concrete elements, fiber cement cladding was used. The old panel materials were removed and replaced by new insulation and timber cladding. In the old design concrete elements were framing different façade parts. This architecture was kept in the new design, made out of slightly extruding cladding of fiber cement panels. The old balconies were closed off on the outside with glass wool insulation boards in a timber frame. Timber cladding was used on these parts. Triple glazing was applied, because this resulted in lower operational energy. For the window frames European softwood was used. EPS insulation was placed on the roof, for a lower operational energy.
Even though the comparison of the façade strategies showed that keeping the old façade parts was better than façade replacement, the detailing in most places did not allow this. For example, attachment of new insulation on the existing timber façade panels was not possible. Also, the prefabricated concrete elements framing the façade parts could not be kept, because the uneven shape of the elements did not allow easy attachment of new elements. This lead to a slightly higher embodied energy due to removal of the old elements. However, the prefab concrete sandwich panels were kept, because an attachment of insulation and cladding was possible on these parts.
The masonry on the South and North façades was kept, due to the high-embodied energy needed to remove them. Also, since the masonry was still in good shape, inside insulation was added with cavity insulation between the masonry and load-bearing wall to save space inside the apartments for insulation.
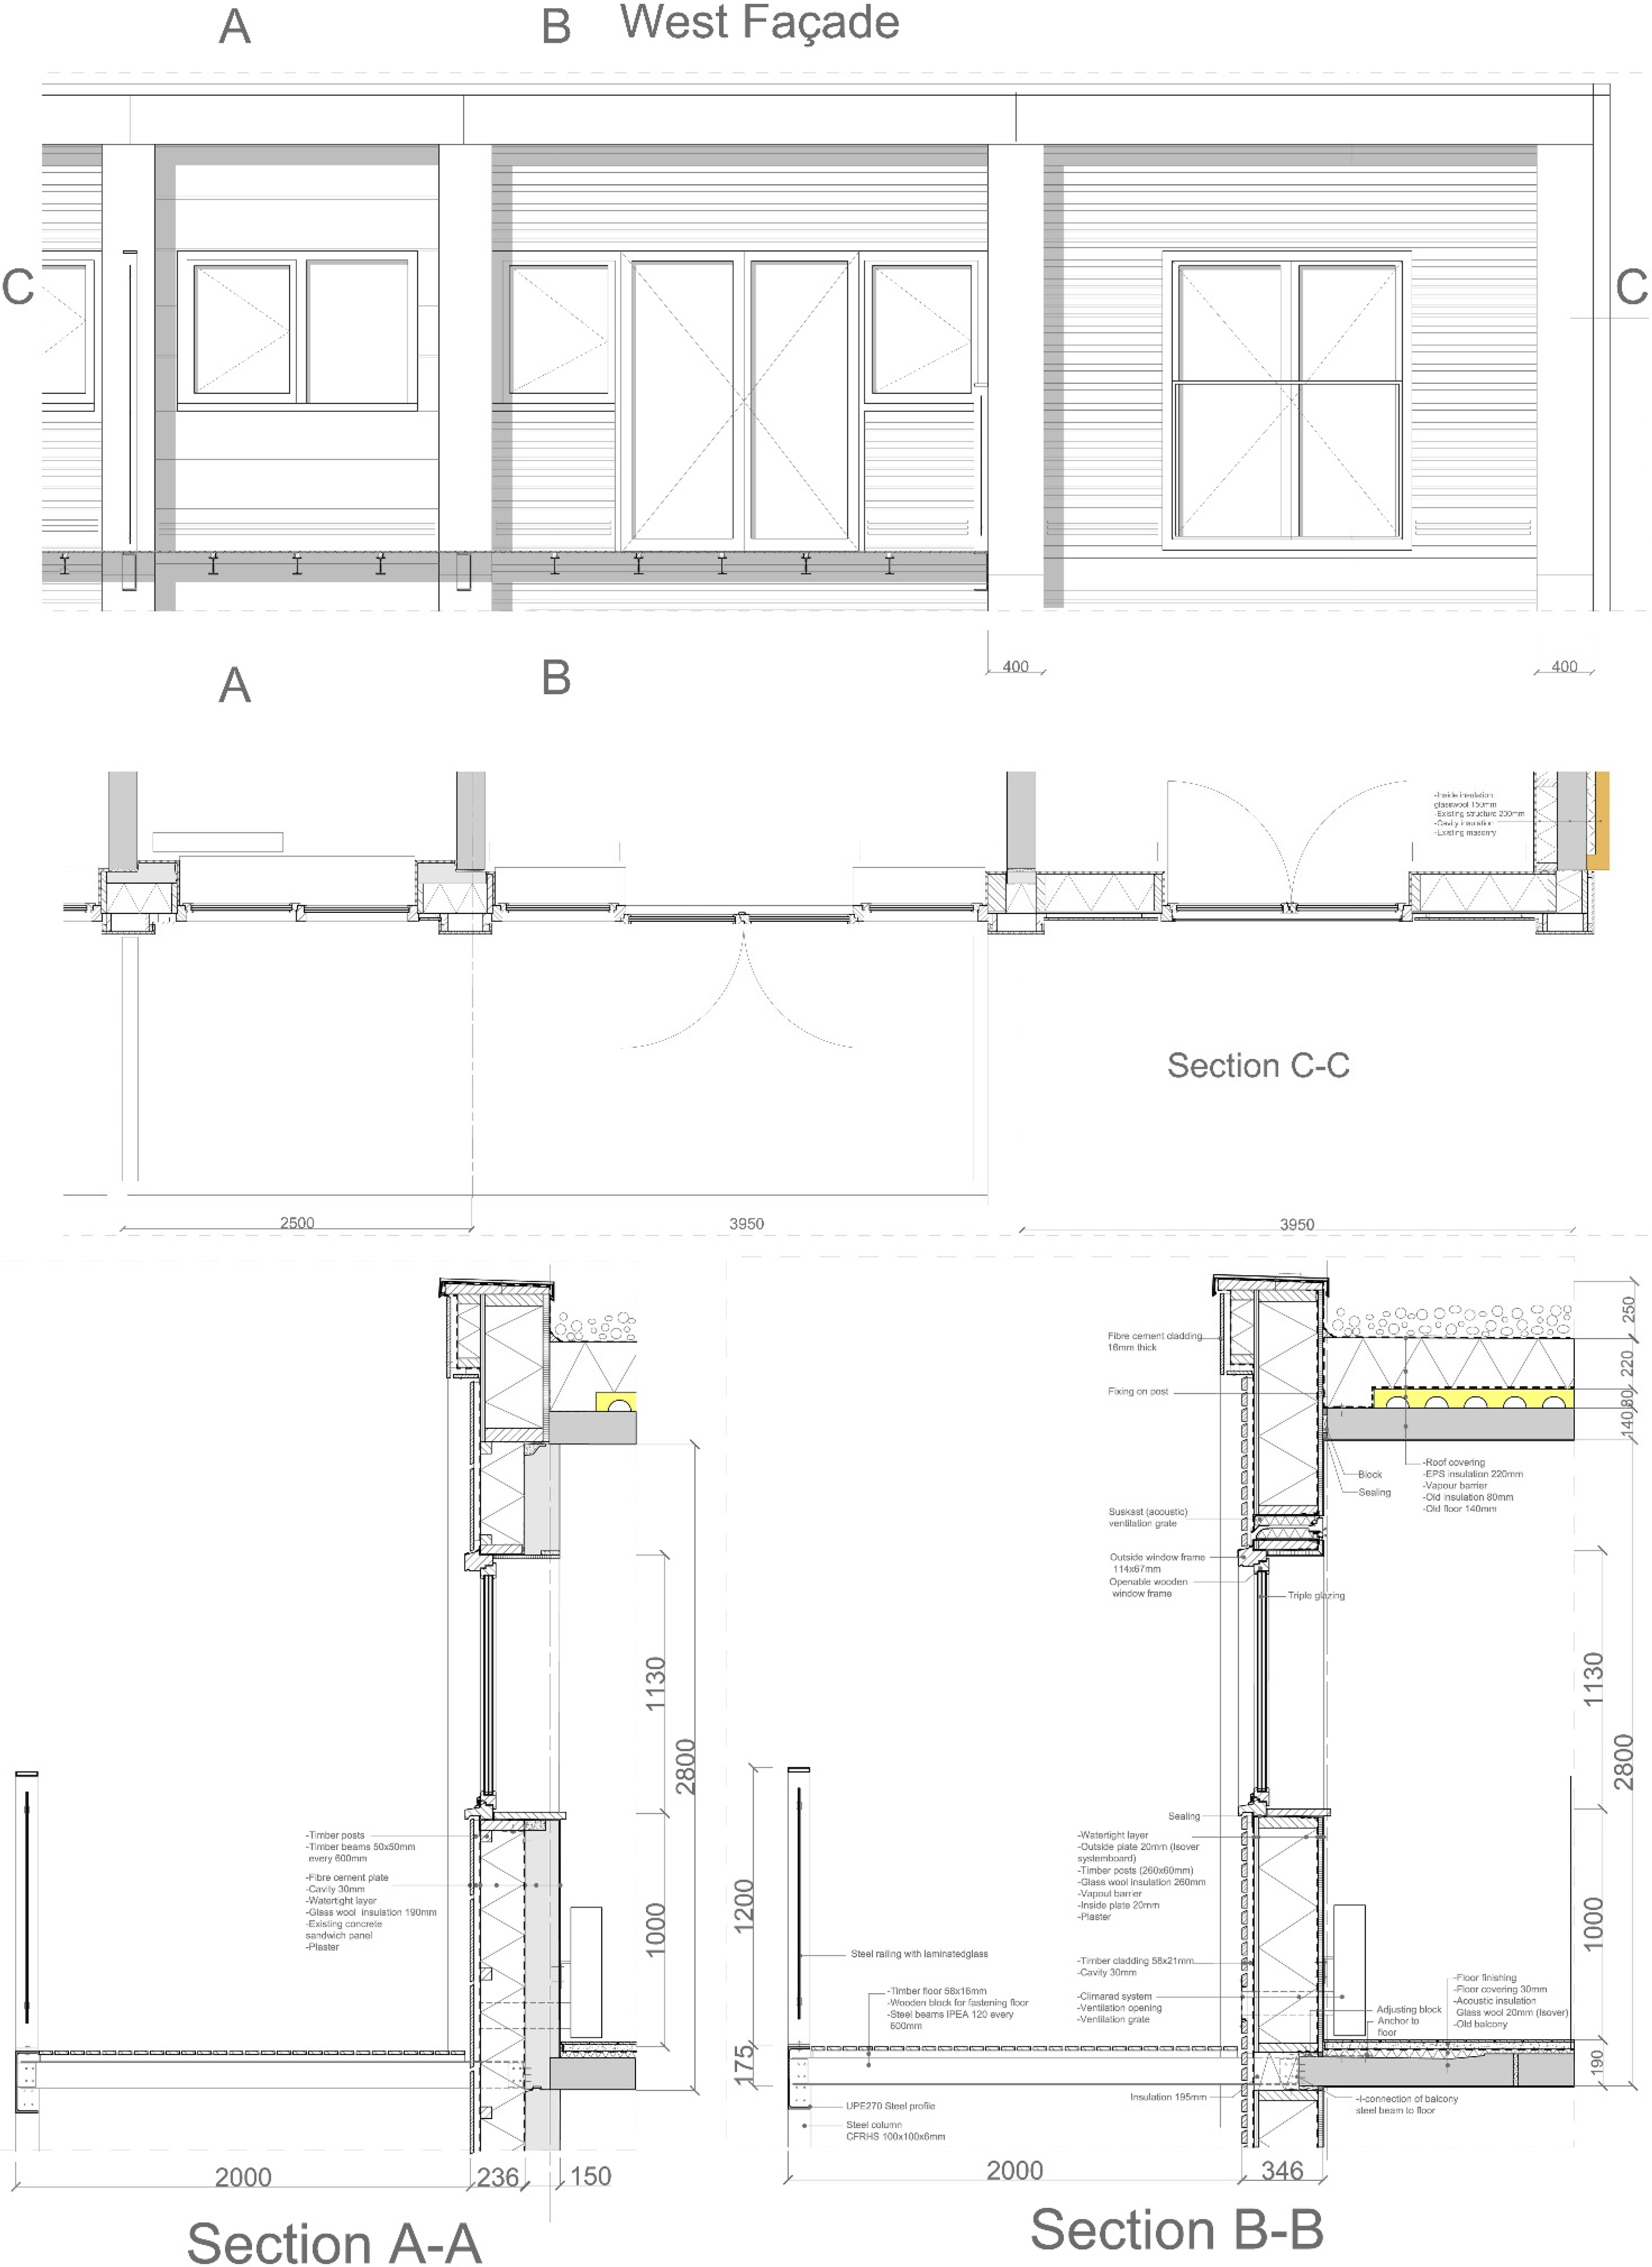
Figure 14.
West façade and detailing of the top corner apartment of the new design. The east façade is comparable to the west façade.
Figure 14.
West façade and detailing of the top corner apartment of the new design. The east façade is comparable to the west façade.
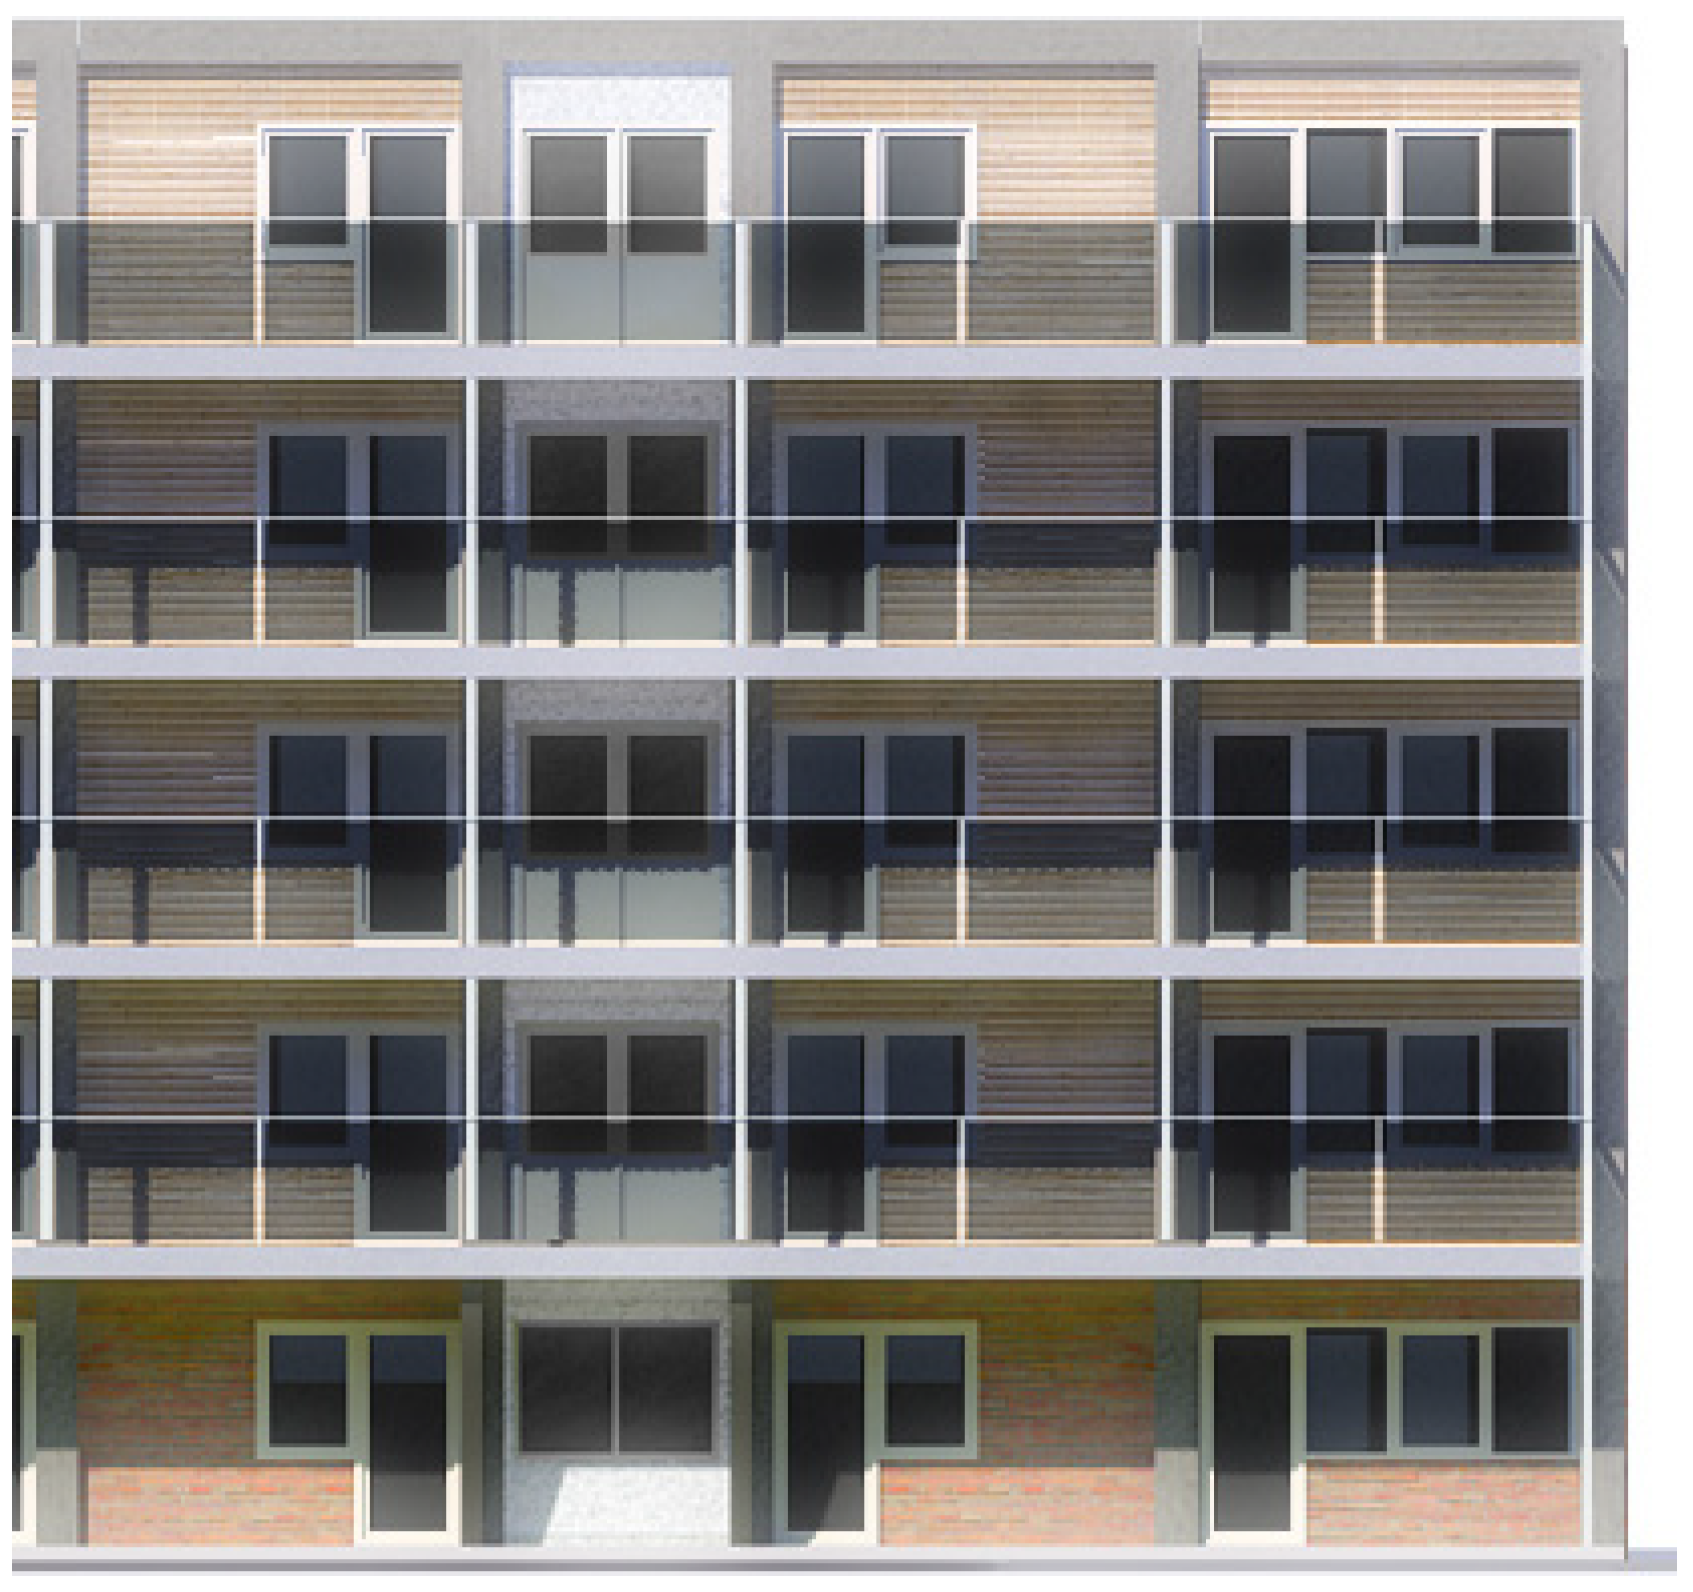
Figure 15.
Front façade (west) of the refurbishment design.
Figure 15.
Front façade (west) of the refurbishment design.
Figure 16.
Back façade (east) of the refurbishment design.
Figure 16.
Back façade (east) of the refurbishment design.
Even though a detailed design was made for the top corner apartment, for the final results of the building and the comparison of the operational and embodied energy of the old situation to the new design, all apartment types were calculated. The building with different apartment types is shown in
Figure 7. The weighted average of the life cycle energy per apartment was calculated for the final comparison (see
Figure 17 and
Figure 18).
The boundary conditions from
Section 6.1 were used in the new design. The
R-value of the roof was 7.6 m
2K/W; the old existing roof insulation was kept and a new insulation with a thermal resistance of 7.0 m
2K/W was added. The thermal resistance of the façade was between 5.2 and 5.6 m
2K/W in the new design, depending on the thermal resistance of the façade elements that were kept. Triple glazing was used with a
U-value of 1.4 W/m
2K and a
g-value of 0.55 without sun shading.
The new building services had heating with an electric heat pump exchanging heat with the underground (providing a temperature of 35 °C < T ≤ 40 °C). Domestic hot water was realized with external heat supply, with an efficiency of 100%. No cooling was needed in the residences. A balanced ventilation system was used, with a decentralized heat recovery system per room.
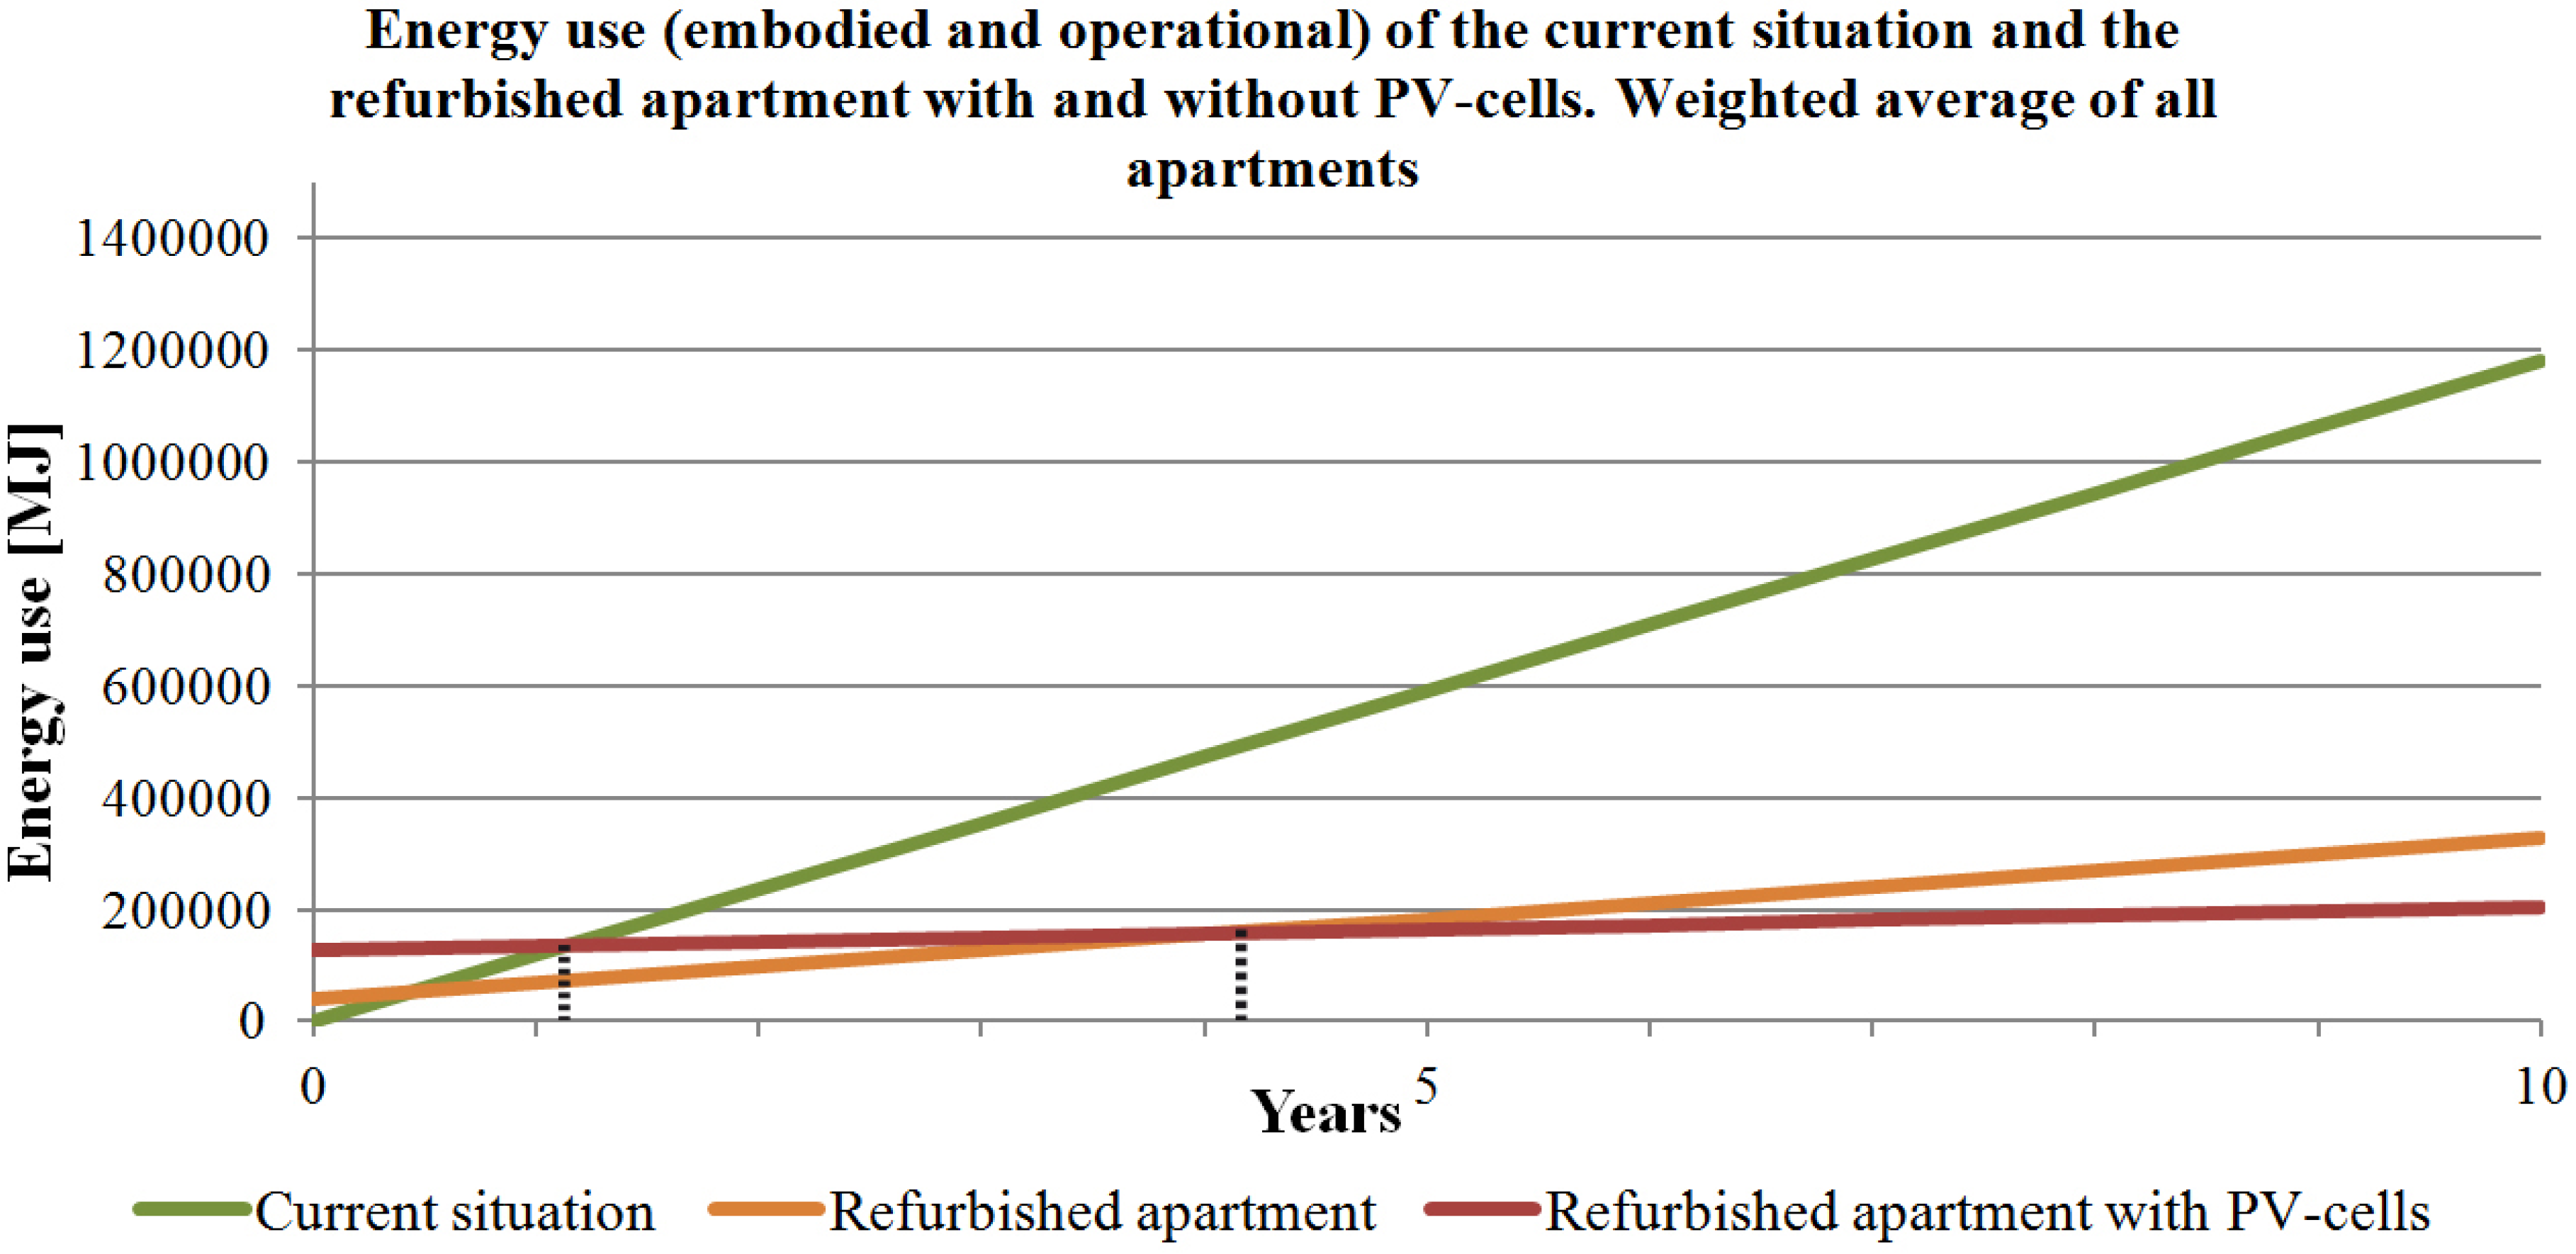
Figure 17.
Embodied and operational energy accumulated over a lifespan of 35 years for the current building, refurbished building and refurbished building with the use of photovoltaic (PV)-cells. The current situation shows the energy use of the existing building without any refurbishment. The orange line gives the energy use of the refurbishment strategy as is described in
Section 6.2. This design does not have PV-cells on the roof. In the red line the energy use of the exact same design is given with the use of PV-cells on the roof.
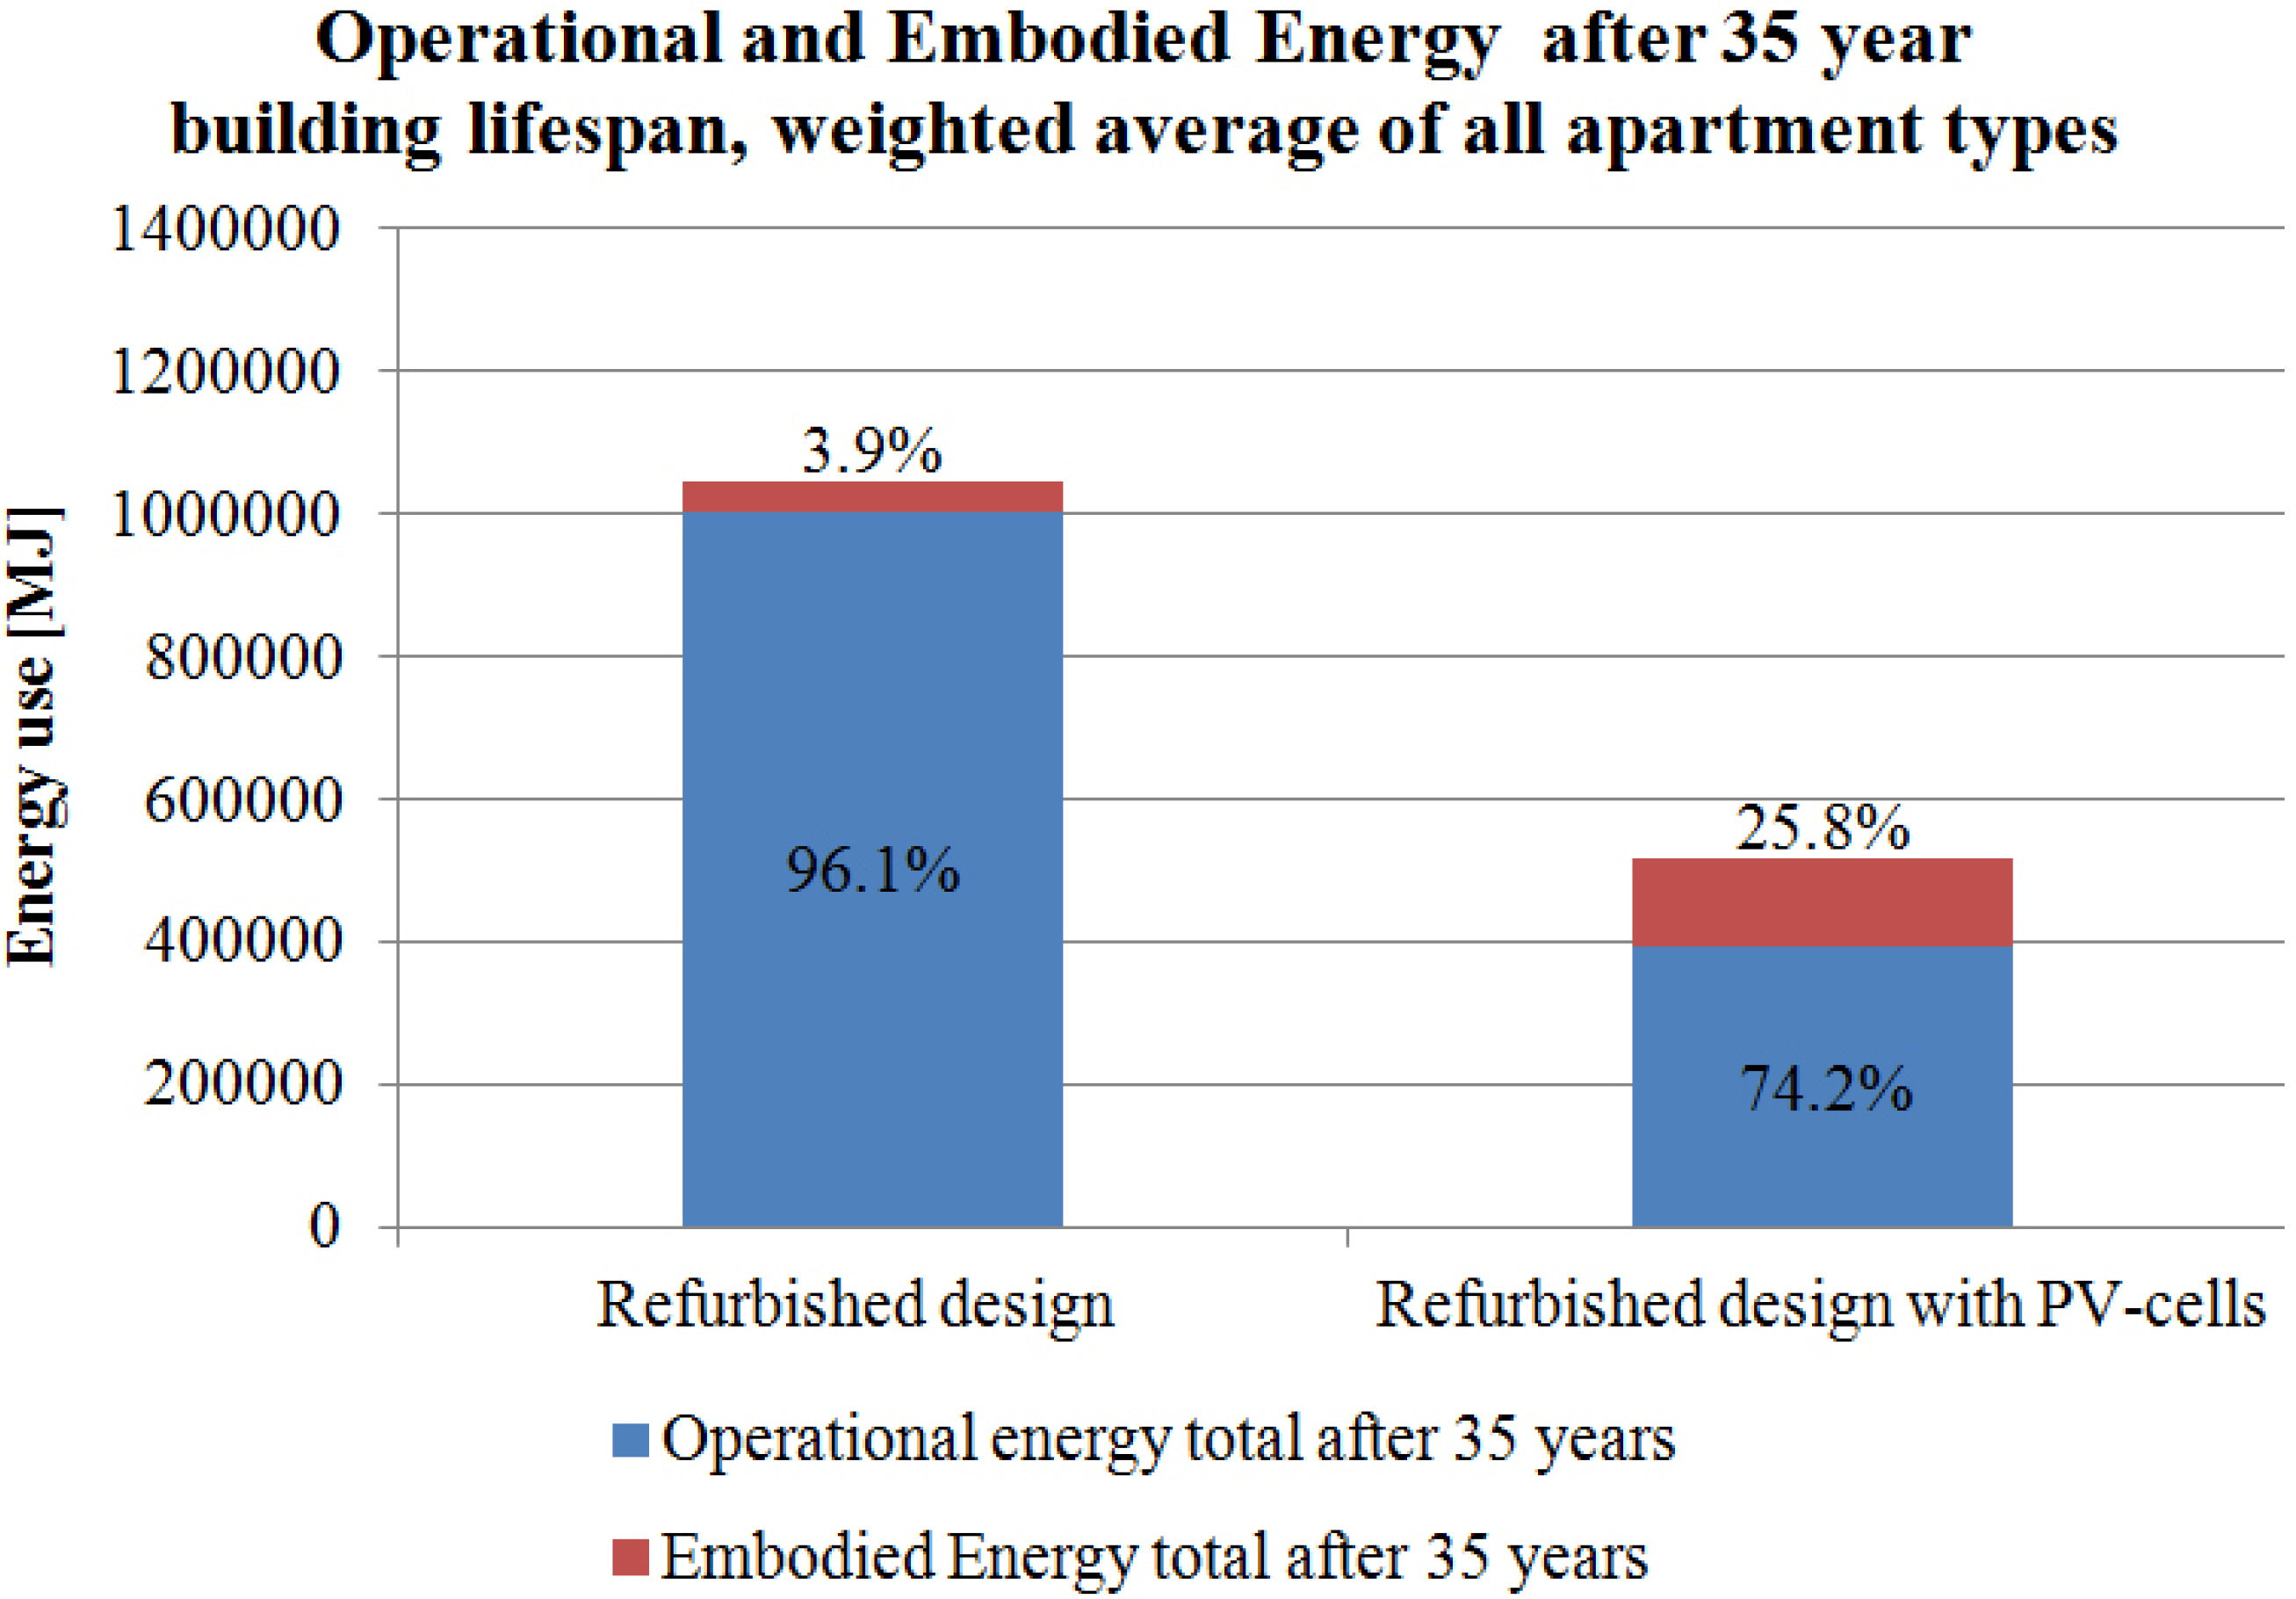
Figure 18.
Operational and embodied energy use total over a lifespan of 35 years for the refurbished design and the same design with PV cells.
Figure 18.
Operational and embodied energy use total over a lifespan of 35 years for the refurbished design and the same design with PV cells.
The embodied energy was calculated in the same way as with the façade strategies, in Excel spreadsheets and taking into account the initial embodied energy and replacement at the end of the lifespan. The residual embodied energy in the existing materials was again taken into account. Also, the embodied energy of the balconies was taken into account. A hand calculation of the embodied energy gave a needed 8315 MJ per apartment for the balconies [
37]. This included the railings, beams, columns and flooring. This only included the initial embodied energy, not the energy needed for maintenance.
The design described above reduced the embodied and operational energy total by 75% after a lifespan of 35 years for the whole building, compared to the current situation. This reduction was achieved when retrofitting the façade and building services, improving the operational energy from 410.6 kWh/m
2 to 88.3 kWh/m
2, which is very similar to a new building performance standard [
30,
31]. If extra photovoltaic (PV) panels were applied on the entire roof area, the energy consumption was reduced to 10% compared to the current situation, accounting only 23.3 kWh/m
2. This calculation takes into account 20 m
2 of PV per apartment, which was the available roof space in the case-study building. The initial embodied energy of PV cells, however, is high, which makes the payback time longer. The embodied energy used for the monocrystalline PV-cells was 4750 MJ/m
2 [
16]. Nevertheless, after a lifespan of 35 years, the total energy used is much lower compared to the design without PV cells.
Figure 17 shows the accumulated operational and embodied energy in time, for the current situation and the new redesign with and without PV cells. The initial embodied energy used for the refurbishment is shown at 0 years; the initial embodied energy for the refurbished apartment with PV-cells is higher than without. Per year there is an operational energy use; this is accumulated together with the previous embodied and operational energy use. The current situation has a much higher operational energy per year, although it needs no initial embodied energy. The payback time when refurbishing the apartment, concerning energy, is already within a year compared to the current situation; the accumulated energy use for the existing situation is higher from that point on. When PV cells are also used, the initial embodied energy is higher (see
Figure 18), but the eventual energy savings are larger; the energy payback time of the PV-cells are after five years, which can be seen in
Figure 17. The eventual energy savings are much greater after the 35 years lifespan of the building, which can be seen in
Figure 18.
7. Conclusions
7.1. Conclusions
The aim of the paper was to develop a design methodology for existing residential buildings, which decreases the operational as well as the embodied energy as much as possible. This method followed has four steps. Firstly a material comparison was made to determine façade materials with the lowest embodied energy. Secondly three different façade strategies were compared per façade part, concerning embodied energy, with the use of materials with the lowest embodied energy. Thirdly these three strategies were compared for a whole apartment for the embodied and operational energy. Last but not least, a design was made for the case study residence and the weighted average of embodied and operational energy of all apartment types were compared with the old existing building, as a result of the approach developed in the previous steps.
Using this design method has resulted in a design with a very low embodied energy. The façade materials are only 3.9% of the total operational and embodied energy after 35 years. By additionally applying PV-cells on the roof, the embodied energy increases. However, it decreases the operational energy significantly, reducing the total energy by 90% compared to the current situation. By applying PV cells in the final design, the embodied energy is 25.8% of the total energy, proving that by making a building with a very low operational energy, the embodied energy becomes a larger part of the total life cycle energy.
Overall, the present study suggested a refurbishment design strategy with the embodied energy as a starting point. This design was made by applying the methodology that was developed in this research, with the four steps described previously. This approach is different from the traditional way of decision making in the design. In a traditional design method, the operational energy, in general, is more important at the starting point of the design; the embodied energy comes as an additional—if at all—consideration at the end of the design.
The methodology and conclusions made during the study can be further applied in the refurbishment designs of other residential buildings. The study of façade materials can be generally applied for other designs, since it indicates which materials have a very low embodied energy, also depending on the predicted future lifespan of the building. Also the conclusions made when comparing the façade strategies can be partially used; it gives indicators which factors have a large influence on the combined embodied and operational energy. Finally, the design can be used as an example of how to implement the methodology on an existing building.
7.2. Research Limitations
The limitations of the research are related to the assumptions and the tools used in the study. Firstly, the EPC software used limits the design possibilities that could be examined. Furthermore, the EPC is based on the NEN 7120 for the determination method of the energy performance of buildings. This gives an operational energy that is based on the building components and its installations. This characteristic operational energy use and the actual energy consumption can differ, for example by differences in occupancy patterns and outdoor climate.
Moreover, the NIBE database did not give embodied energy for the materials; therefore a conversion factor was used. This gives less accurate data then when the true embodied energy is used. Moreover, NIBE gives an estimation of the material element lifespan. However, the true lifespan will depend on many factors, including the environmental surroundings, the technical quality of that particular product and the maintenance during its lifespan. The demolition energy of the materials was not taken into account, which can result in a longer payback time than shown here. The embodied and demolition energy of the changes in building services were also not taken into account. In reality, this probably increases the payback time.
The short payback time can be explained by the use of materials with a very low embodied energy. If materials with a higher embodied energy were used, this could result in a considerably higher total embodied energy after 35 years.
7.3. Future Research
A further step towards an embodied and operational zero-energy (re-)design, would be to make the approach and the relevant information easily accessible to the designers. Calculating both the operational and the embodied energy is a time-consuming task, especially if different strategies and materials are to be calculated. For designers and architects, it would be useful to have a tool that simultaneously determines the operational and embodied energy of a design option. Also, the addition of determining the demolition energy would be an asset, especially for refurbishment of existing buildings. This way, small changes can easily be made in the design, to see what the influence is on the life cycle energy. This would be an easier process that will lead to a building with a low life cycle energy. If the tool is further integrated with much used software such as 3D modeling, making an embodied and operational zero-energy (re-)design would be fast, easy to use and readily applied by all designers.
Furthermore, the building costs influence the most suitable refurbishment strategy. Even though a design with a very low embodied and operational energy is the best choice for the energy use, the costs are often the decisive factor. To make a completely integrated decision for the best retrofitting design, this should also be taken into consideration. However, at the time of the research, the NIBE did not give the life cycle costs for every material in their database. Therefore a good comparison could not be made within the scope of the present research, but it is suggested as an important addition to the applicability of the method.


