Article

Effect of Banana Fibers on the Compressive and Flexural Strength of Compressed Earth Blocks

Department of Civil, Construction and Environmental Engineering, University of Alabama at Birmingham, Birmingham, AL 35294, USA
*
Author to whom correspondence should be addressed.
Buildings 2015, 5(1), 282-296; https://doi.org/10.3390/buildings5010282
Submission received: 5 January 2015 / Revised: 6 March 2015 / Accepted: 11 March 2015 / Published: 18 March 2015

Abstract

:
Sustainable development of the built environment in developing countries is a major challenge in the 21st century. The use of local materials in construction of buildings is one of the potential ways to support sustainable development in both urban and rural areas. Building with Compressed Earthen Blocks (CEBs) is becoming more popular due to their low cost and relative abundance of materials. The proposed Green-Compressed Earth Block (GCEB) consists of ordinary CEB ingredients plus Banana fibers, which will be the focus of this study. Banana fibers are widely available worldwide as agricultural waste from Banana cultivation. Banana fibers are environmentally friendly and present important attributes, such as low density, light weight, low cost, high tensile strength, as well as being water and fire resistant. This kind of waste has a greater chance of being utilized for different application in construction and building materials. This focused on the use of banana fiber and its effect on the compressive and flexural strength in CEB. The deflection at the mid-span of the blocks studied was calculated using the Linear Variable Differential Transformer (LVDT). The results of this study will highlight general trends in the strength properties of different soil mixes for CEBs. These efforts are necessary to ensure that GCEB technology becomes more widely accepted in the world of building materials and is considered a reliable option for providing low-cost housing.

Graphical Abstract

1. Introduction

The demand for low cost sustainable building materials is growing as social, economic, and environmental issues evolve in today’s society. The urgent need to develop suitable and affordable housing is born as a consequence of the fact that over one billion people in the world, most of whom live in developing nations, are either homeless or live in very poor housing. Today, 30% of our planet’s people live in earth houses. The extensive use of earth is due to its low cost, availability, and its proven usefulness over time. Affordable housing for all income levels is an ever-present need. High material, labor and transportation costs have adversely affected the ability for some to reside even in developing communities. Natural building materials offer a number of environmental benefits, which are typically produced using simple, quick processes without the need for highly skilled labor, with low embodied energy, and by using raw materials from plant waste and construction materials. Compressed Earth Blocks (CEBs) are historically local masonry building materials, which are now in increasing demand by the sustainable building community. Building with CEB has become more popular due to it being an environmentally friendly process, with low cost, readily available raw materials, and making possible faster and easier construction [1].
CEBs offer a competitive alternative to conventional building materials because they utilize local resources that can be both cost effective and energy efficient, and closely follow existing masonry construction practices. Typically, CEBs are formed using a mixture (by weight) of angular sand aggregate (40%–70%), clayey soil (30%–60%), cement (4%–10%), and water (8%–12%) [2]. Compressive strength has become a basic and universally accepted unit of measurement to specify the quality of the masonry units. However, the CEB has limited compressive strength (2–3 MPa), which restricts their applications to only one-story buildings. Using traditional stabilizers, like cement or lime, with a high percentage increases, the CEB compressive strength significantly, but these additives also increase the material costs and use a lot of energy.
This study is going to show that these traditional binders can be replaced by environmentally friendly and sustainable alternatives from unutilized waste (i.e., banana fibers). Over 10 million hectares of Banana plantation, with an average of 1500 plants per hectare, exist in more than 160 countries globally, creating tons of banana waste, which have been left over to decompose, emitting a huge amount of methane gas and carbon dioxide. These emissions have a negative impact on the environment, which increases global warming every year. Every ton of banana waste emits, on average, a half-ton of carbon dioxide per year. This study advances the utility of the CEBs by adding banana fibers, thereby creating an innovative Green Compressed Earth Block (GCEB) that further improves the mechanical properties of CEBs.

2. Materials and Specimens Preparation

2.1. Materials

The materials used include local soil (from Cairo, Egypt), commonly available type I Ordinary Portland Cement (OPC), and banana fibers. The fiber is “stick-like” with an embossed surface to create deformations that provide mechanical anchorage. The lengths of the banana fibers were between 50 mm and 25 mm and cut from full-length fibers. These lengths were based on work done by Prochazka et al. (2010) [3].
Since banana fiber is acidic fruit material that has a pH value less than 7, and the CEB is an alkaline material compound that has a pH value more than 7, chemical pretreatment has to take place in order to increase the pH value of the banana fibers. Previous studies have shown that appropriate surface treatments enable mechanical bonding, and thereby improve matrix-reinforcement interaction. Alkali treatment of cellulosic fibers is the usual method to produce high quality fibers. Alkali treatment improves the fiber-matrix adhesion due to the removal of natural and artificial impurities. Therefore, the development of a rough surface topography and enhancement in aspect ratio offer better fiber-matrix interface adhesion and an increase in mechanical properties [4].

2.2. Characteristics of Banana Fibers

Banana fibers are generally lignocelluloses material, consisting of helically wound cellulose micro-fibrils in amorphous matrix of lignin and hemicelluloses. The cellulose content serves as a deciding factor for mechanical properties along with micro fibril-angle. A high cellulose content and low micro-fibril angle impart desirable mechanical properties for banana fibers. Lignins are associated with the hemicelluloses and play an important role in the natural decay resistance of the lignocelluloses material [5]. The composition of banana trunk obtained by elemental analysis, as given in Table 1.
Table 1. Composition of studied banana trunk fibers [5].
ConstituentsPercentage
Cellulose56%
Lignin17%
Extractives7%
Moisture11%
Ashes9%

2.3. Characteristics of Banana Fibers

2.3.1. Fiber Linear Density

The fiber diameter was evaluated from optical observations under microscope as the average of five diameter measurements taken at different locations along the fiber with a range of standard deviation from 0.05 to 0.1. Based on the diameters of the fiber, the whole fiber samples were divided into four broad categories. The diameter of the fiber was then measured at 100 different places along the length of four fibers. One hundred fibers were also taken at random from the sample and their diameter measured at 10 different places. The tex of the fiber was calculated assuming the density of banana fibers to be 1.4 g/cc, determined using a density gradient column prepared from xylene (0.865 g/cm3) and carbon tetrachloride (1.595 g/cm3) [5,6].

2.3.2. Fiber Stress-Strain Curves

Tensile testing was performed on four different strain rates of banana. Results of tensile testing revealed that strain rates played a significant role in the nature of the stress strain curves, the strength of the fibers and the nature of failure. The stress, as shown in Table 2, increased when the strain rate was increased to 0.5 min−1 but ultimately decreased with an increment in speed.
Table 2. Stress–strain average results and the effect of variation on strain rate [5,6].
Fiber No.Strain Rate (min−1)Stress (MPa)Strain (%)
10.1167.23.0
20.5203.42.7
31168.62.3
410146.21.2
The representative stress-strain curves for banana fiber, with average values from 20 tests each on fibers of 7 tex, is shown in Figure 1. There was some initial compliance of the system. The averaged curves show the tendency of a dominantly brittle fracture for the fibers, except at the lowest strain rate of 0.1 min−1. Some of the fibers showed verification for strain-hardening. This fact can be taken as a progressive reorientation of micro-fibrils, which occur for some of the fibers. Apparently from the stress–strain curves, higher strain rates resulted in higher apparent modulus values.
Banana fibers have shown high variability along the length and between fibers, which is a characteristic of natural fibers. The Stress of banana fibers was a function of the testing speed. At lower strain rate, an increase in strain facilitates the amorphous to crystalline sharing of load. At higher speeds, however, the faults dominate with catastrophic failure at the highest strain rates. Therefore, there is an inversely proportional relationship between the strain rate and the strain. Some of the stress strain curves showed signs of strain hardening.
Figure 1. Representative stress–strain curves of banana fibers. Reproduced with permission from Journal of Engineered Fibers and Fabrics [5].
Buildings 05 00282 g001

2.4. Banana Fibers Chemical Treatment

Alkali treatment increases surface roughness resulting in better mechanical bonding and the amount of cellulose exposed on the fiber surface. This increases the number of possible reaction sites and allows better fiber wetting. The possible reaction of the fiber and Sodium Hydroxide (NaOH) is represented in Equation (1) [7]:
Fiber–OH + NaOH → Fiber–O–Na+ + H2O
The banana fibers were cleaned and immersed in 6% NaOH solution for 2 h at room temperature as shown in Figure 2, and then thoroughly washed by immersion in a clean water tank to remove the non-reacted alkali until the fibers were alkali free. They were next rinsed under running water and filtered. The filtered fibers were then dried in an oven at 80 °C for 24 h [8].
Figure 2. Submerging banana fibers in NaOH solution.
Buildings 05 00282 g002

2.5. Specimens Preparation

Dry soil, including sand and clay to be used for GCEB production were run through a manual sieve with a 3.40 mm2 (0.00527 in2) mesh size to remove lumps. The samples produced consisted of 10 plain CEBs (control) and 60 banana-fiber-reinforced GCEBs. Based on the typical CEBs mix ratios, GCEBs are formed using a mixture (by weight) of sand (35%), 5 mm aggregate (30%), clay (35%), cement (7%), and water (10%). With the exception of fiber length, all the identified factors were kept constant in all mixes to allow for observation of the influence of fiber length on strength of tested specimens. The development of strength properties of soil-cement-fiber mixes mostly depends on the formation of fiber-matrix adhesion, matrix-matrix cohesion and fiber-fiber cohesion. These identified bonds can be affected by dimensions, surface conditions and the quantity of fiber present [9]. Previous studies have recognized that reinforced CEB with 0.4% of the Polypropylene fibers recorded the highest compressive strength; also, these studies prove that increasing fiber content more than 0.4% reduces the strength significantly [10,11]. The designed mix is presented in Table 3.
Table 3. Seven design mixes of treated and untreated banana fibers.
Mix TypeOPC %Banana FibersFibers Content (Weight Portion %)
25 mm50 mmTotal
# 1 (control)7%No Fibers000
# 27%Untreated0.35%00.35%
# 37%Treated0.35%00.35%
# 47%Untreated0.175%0.175%0.35%
# 57%Treated0.175%0.175%0.35%
# 67%Untreated00.35%0.35%
# 77%Treated00.35%0.35%
Mixing was continued until the matrix was observed to be consistent, and the fibers were added gradually while mixing. The dry mix was watered gradually in a uniform manner without stopping the mixing process. The mixing process was continued until the mix was visually deemed to be homogeneous and also satisfied the “drop test”.

3. GCEBs Production

3.1. GCEBs Mixing

Once the soil-cement-fiber matrix had satisfied the drop test and visual inspection, the mix was fed into the mold by an appropriate bucket from the manual compressed earth block’s machine. The CEB’s manual machine is designed to compress matrices from the bottom of the mold with the top plate flash by man force (this process is illustrated in Figure 3). After compression, the blocks were ejected from the mold, carefully moved, and placed on sieved sand outdoors as shown in Figure 4.
Figure 3. (a) Filling the mold with the mix using a bucket; (b) Manual pressing using Compressed Earthen Block (CEB) machine.
Buildings 05 00282 g003
Figure 4. (a) Ejecting the Green-Compressed Earth Block (GCEB) from the mold; (b) Placing the blocks outdoors.
Buildings 05 00282 g004

3.2. Curing Process

The GCEBs were covered with a plastic sheet after placement and sprayed lightly with water the next day. The blocks were stacked after two days but still kept under the plastic sheet and moisture-cured daily for a minimum of seven days. The relative humidity was about 100% under the plastic sheet. The purpose of the initial curing done during the first two days was to minimize the occurrence of cracks and the breaking off of pieces of the block during stacking [12]. The temperature was about 26 °C. The blocks were tested 28 days after production.

4. Experimental Work

4.1. Compressive Strength Test

The nominal dimensions of blocks produced were 12 cm × 12 cm × 9 cm for compressive test. The specimens for the compressive strength tests were tested according to American Society for Testing and Materials (ASTM) international C67-07 [13]. A total of 35 GCEBs were tested for compressive strength; 5 blocks for each of the 7 mix designs. The blocks were tested under uniaxial compression load using a COMTEST Impact 2000 KN block (Impact, North Ayrshire, Scotland), cube and cylinder compression machine with a maximum load capacity of 2000 KN. The rate of compression was set at 300 N/s (67 lbs/s) until failure.

4.1.1. Compressive Test Results and Discussion

Reinforced blocks with randomly distributed natural banana fibers yielded higher compressive strength results compared to the unreinforced blocks, as shown in Table 4 and Figure 5. At 0.35% banana fiber content by weight, the percentages of increase in compressive strength compared to the unreinforced specimens, #1, are presented in Table 5.
Table 4. Average compressive strength results of GCEBs.
Sample# 1# 2# 3# 4# 5Average Compressive Strength (MPa)Standard Deviation
Mix
# 1 (control)3.213.263.473.363.393.330.10
# 23.914.694.564.034.704.370.38
# 34.084.834.775.685.454.960.63
# 44.293.923.293.493.743.760.39
# 54.344.013.853.814.144.030.22
# 65.634.925.125.166.135.360.49
# 75.965.666.185.476.305.920.35
A research study attributed similar observations made in compressive strength of Polypropylene (PP) fiber reinforced concrete specimens to the confinement provided by the PP fiber bonding [14]. There was a noticeable increase of 17% in the strength of the treated fibers by 6% NaOH concentration relative to the untreated fibers. In this study, the matrix reinforced with only 50 mm fibers (mix # 7) recorded the highest compressive strength with value of 5.92 MPa. A research study also observed that longer PP fibers (12 mm) performed better in compressive strength at 28 days compared to shorter fibers (6 mm) [15]. Cracks typically formed before peak load was reached during testing. This observation was true for both plain and fiber reinforced specimens.
Figure 5. Average compressive strength results for GCEB mixes.
Buildings 05 00282 g005
Table 5. Percentage increase in compressive strength.
Mix Type% Increase
# 231%
# 349%
# 413%
# 521%
# 661%
# 778%

4.1.2. Failure Mode of Plain and Reinforced Blocks

The failure mode of the plain and reinforced CEBs are very close to the failure mode of the typical concrete blocks. However, there is a slight difference in failure mode between the plain and the reinforced blocks as shown in Figure 6. Soil spalling is observed in the plain CEB compression failure leading to a void in the block, while in the reinforced GCEB compression failure sample, fibers held the soil, preventing a void.
Figure 6. (a) Plain CEB failure mode; (b) Reinforced GCEB failure mode.
Buildings 05 00282 g006

4.2. Flexural Tensile Strength Test

Flexural strength testing was done according ASTM C67-07 [13]. The loading scheme was modified from third-point loading to center-point loading. A total of 5 samples were tested for each of the seven mix designs. A Universal Hydraulic UH Series Shimadzu universal testing machine with a maximum load capacity of 1000 KN was used. The machine was set up with a Linear Variable Differential Transformer (LVDT) displacement sensor to record mid-span deflection as shown in Figure 7. The values for flexural strength were computed using Equation (2):
S = 3WL/2bd2
where:
  • S = Modulus of rupture of the block at the plane of failure, PSI (Pound per Square Inch) (MPa);
  • W = Maximum load indicated by the testing machine, lbs (N);
  • L = Span length, in (mm);
  • b = Average width of the block at the plane of failure, in (mm);
  • d = Average depth of the block at the plane of failure, in (mm).
Figure 7. (a) Leveling the two supports and centering Linear Variable Differential Transformer (LVDT); (b) Flexural strength test set-up.
Buildings 05 00282 g007
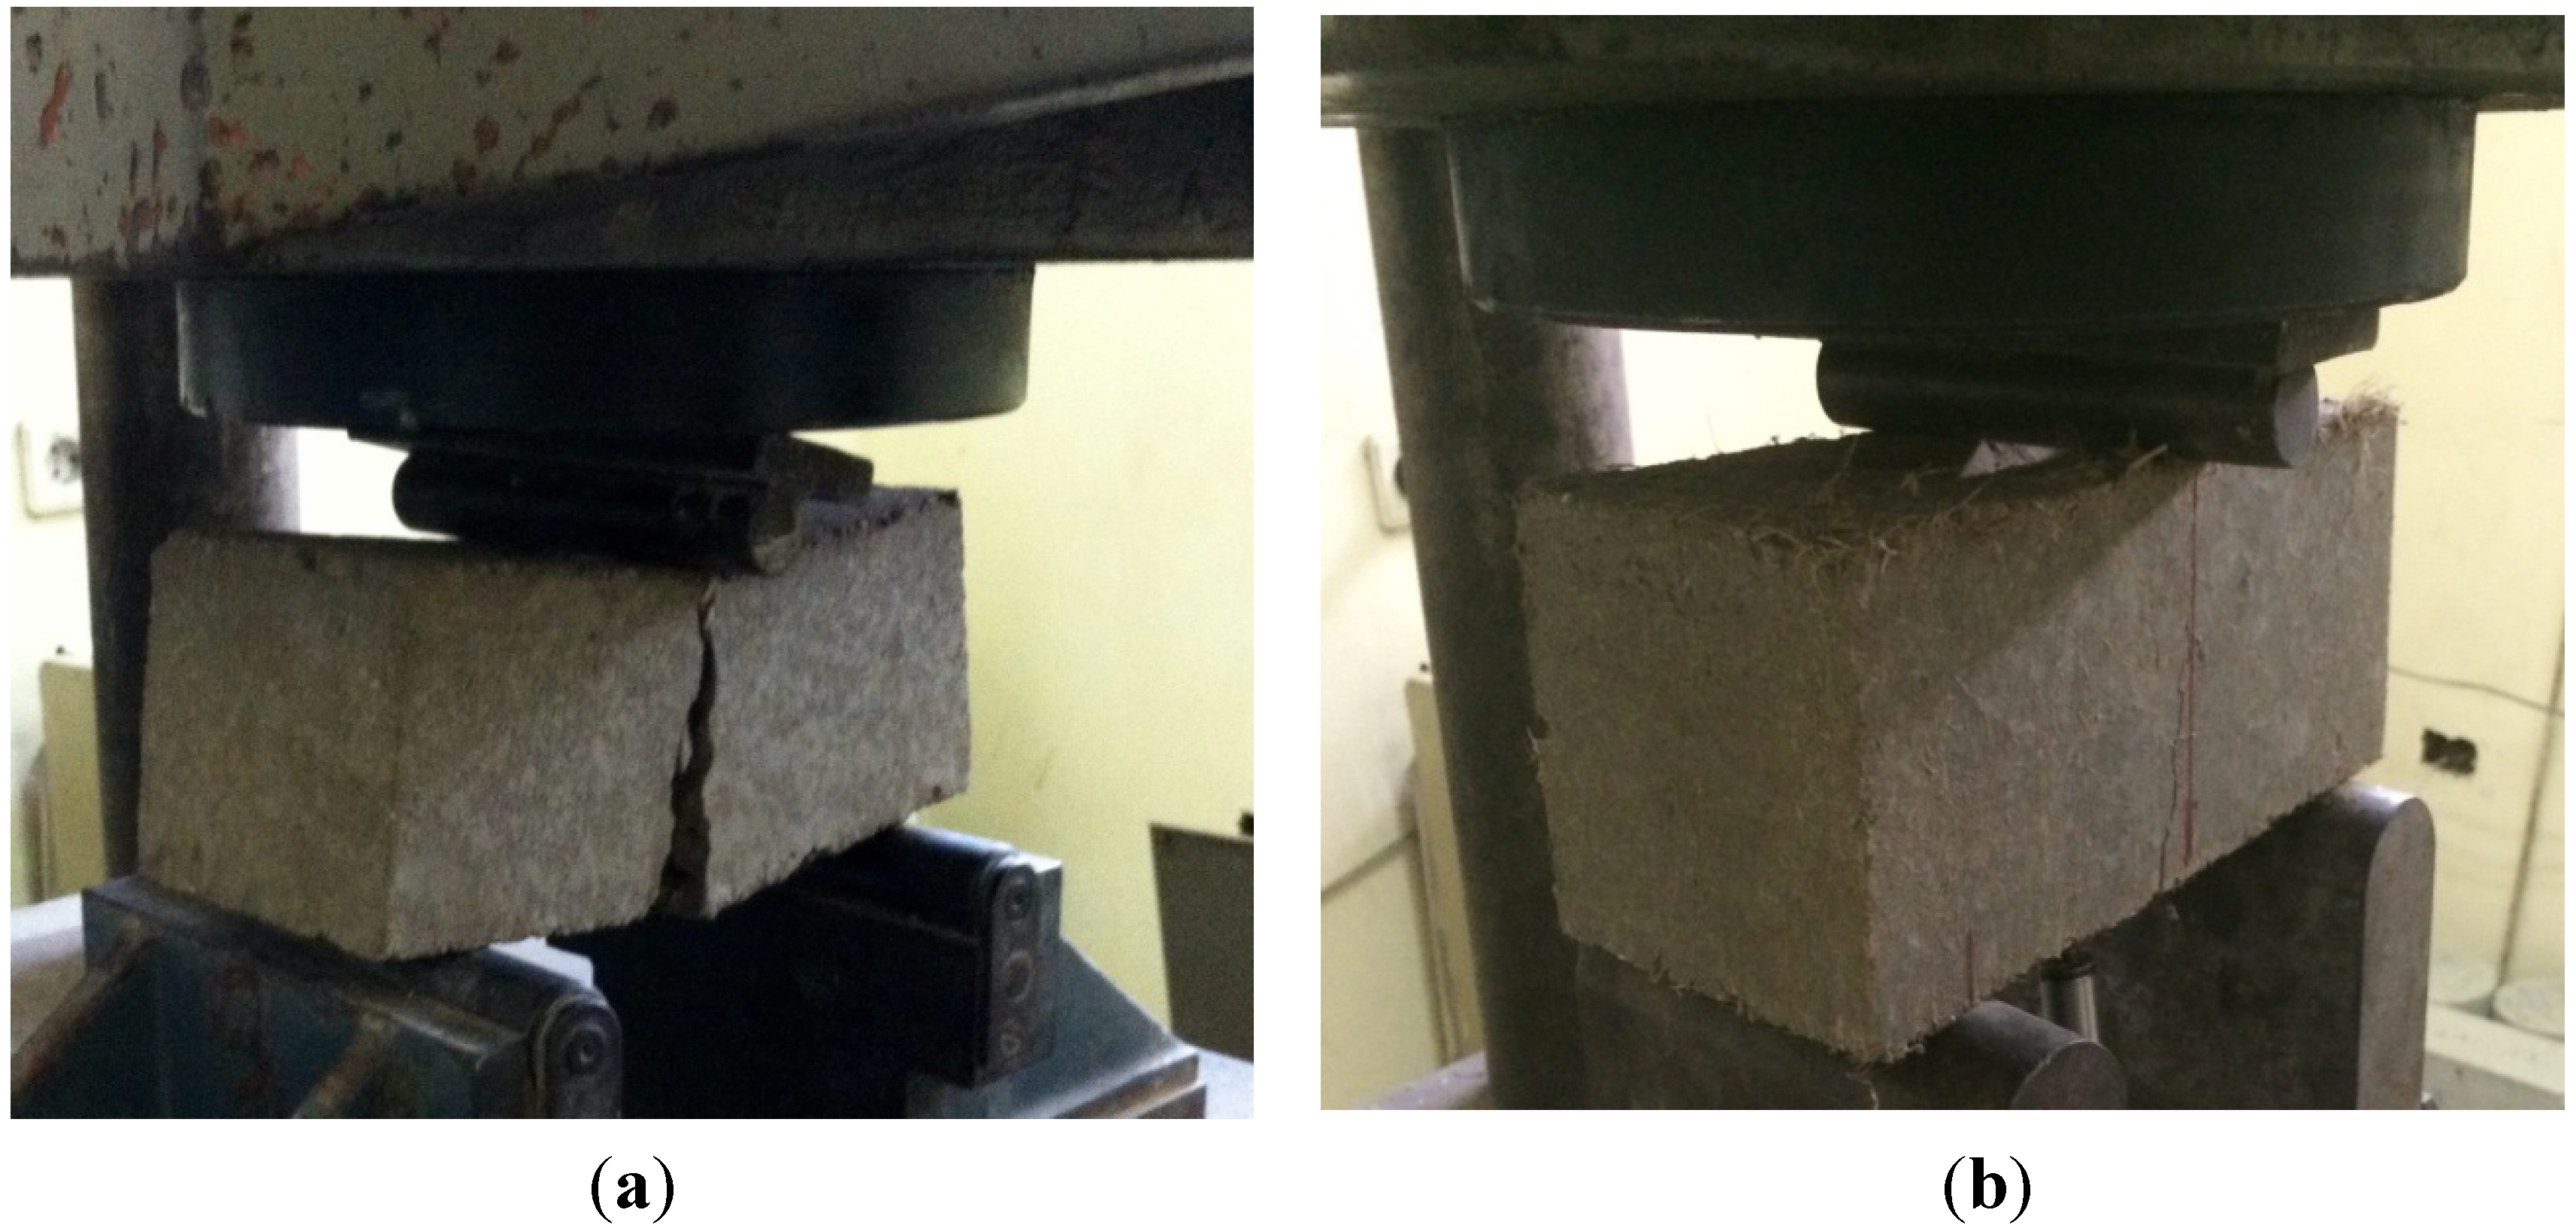
Using center point loading, flexural strength is determined assuming simple, pure bending. In this case the span to depth ratio was approximately 2. Failure of the tested blocks did not always occur at the mid-point. During testing, all the unreinforced blocks experienced sudden failure, while none of the fiber reinforced blocks did, as shown in 
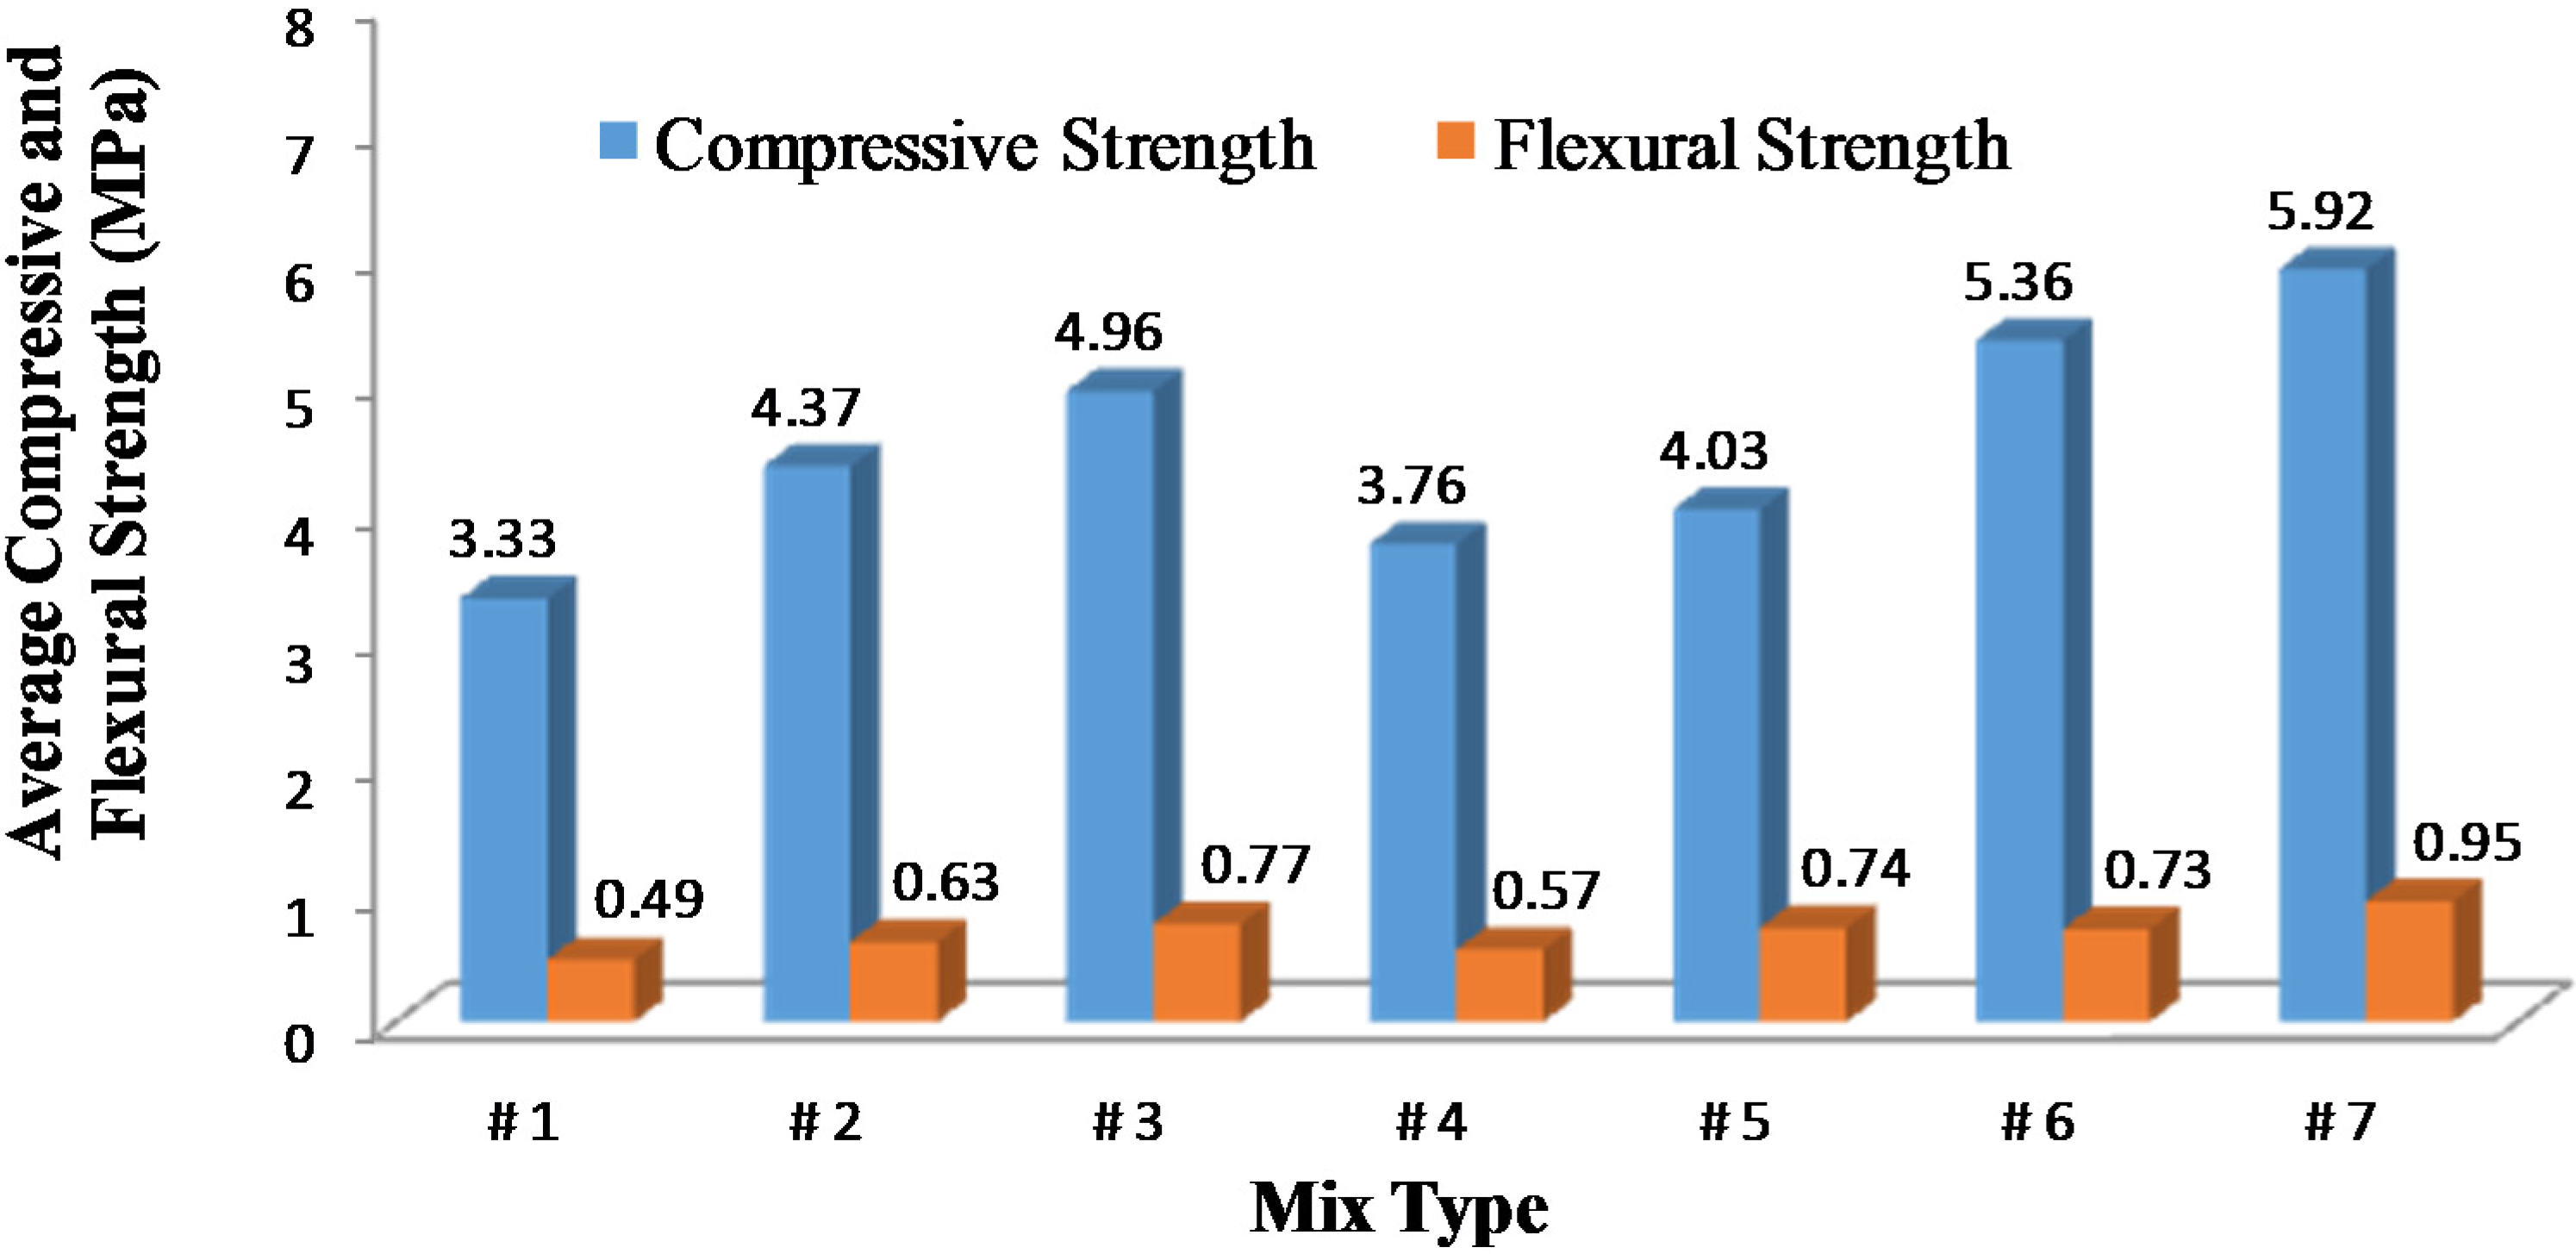
Figure 8. The reinforced GCEBs with treated 50 mm of banana fibers (mix #7) yielded the highest average modulus of rupture (MOR) with a value of 0.95 MPa; also, the average flexural strength and the maximum displacement of the blocks are shown in Table 6. Table 7 presents the percentage of increase in flexural strength compared to mix # 1 with a value of 0.49 MPa.
Figure 8. (a) Plain CEB flexural failure; (b) Reinforced GCEB flexural failure.
Buildings 05 00282 g008
Table 6. Average flexural strength and maximum mid-span displacement results of GCEBs.
Sample Mix# 1# 2# 3# 4# 5Avg. Flexural Strength (MPa)Standard DeviationMaximum Displacement (mm)
# 10.570.620.400.410.570.490.100.8
# 20.610.590.530.700.700.630.071.5
# 30.820.750.740.690.840.770.062.8
# 40.460.730.430.660.580.570.133.0
# 50.790.710.770.730.700.740.042.0
# 60.810.640.730.770.680.730.072.3
# 70.880.960.991.000.940.950.053.4
Table 7. Percentage increase in flexural strength.
Mix Type% Increase
# 228%
# 358%
# 417%
# 551%
# 649%
# 794%
Fibers are known to oppose crack formation in step with increasing stress and also bridge micro cracks from expanding [15,16]. The block geometry did not provide enough span to allow for failure to occur at the center of the blocks, which would have allowed for a better assessment of the influence of the fibers. Also, the center point is not always the weakest point in the block, therefore values reported using center-point loading could be higher compared to third-point loading results.
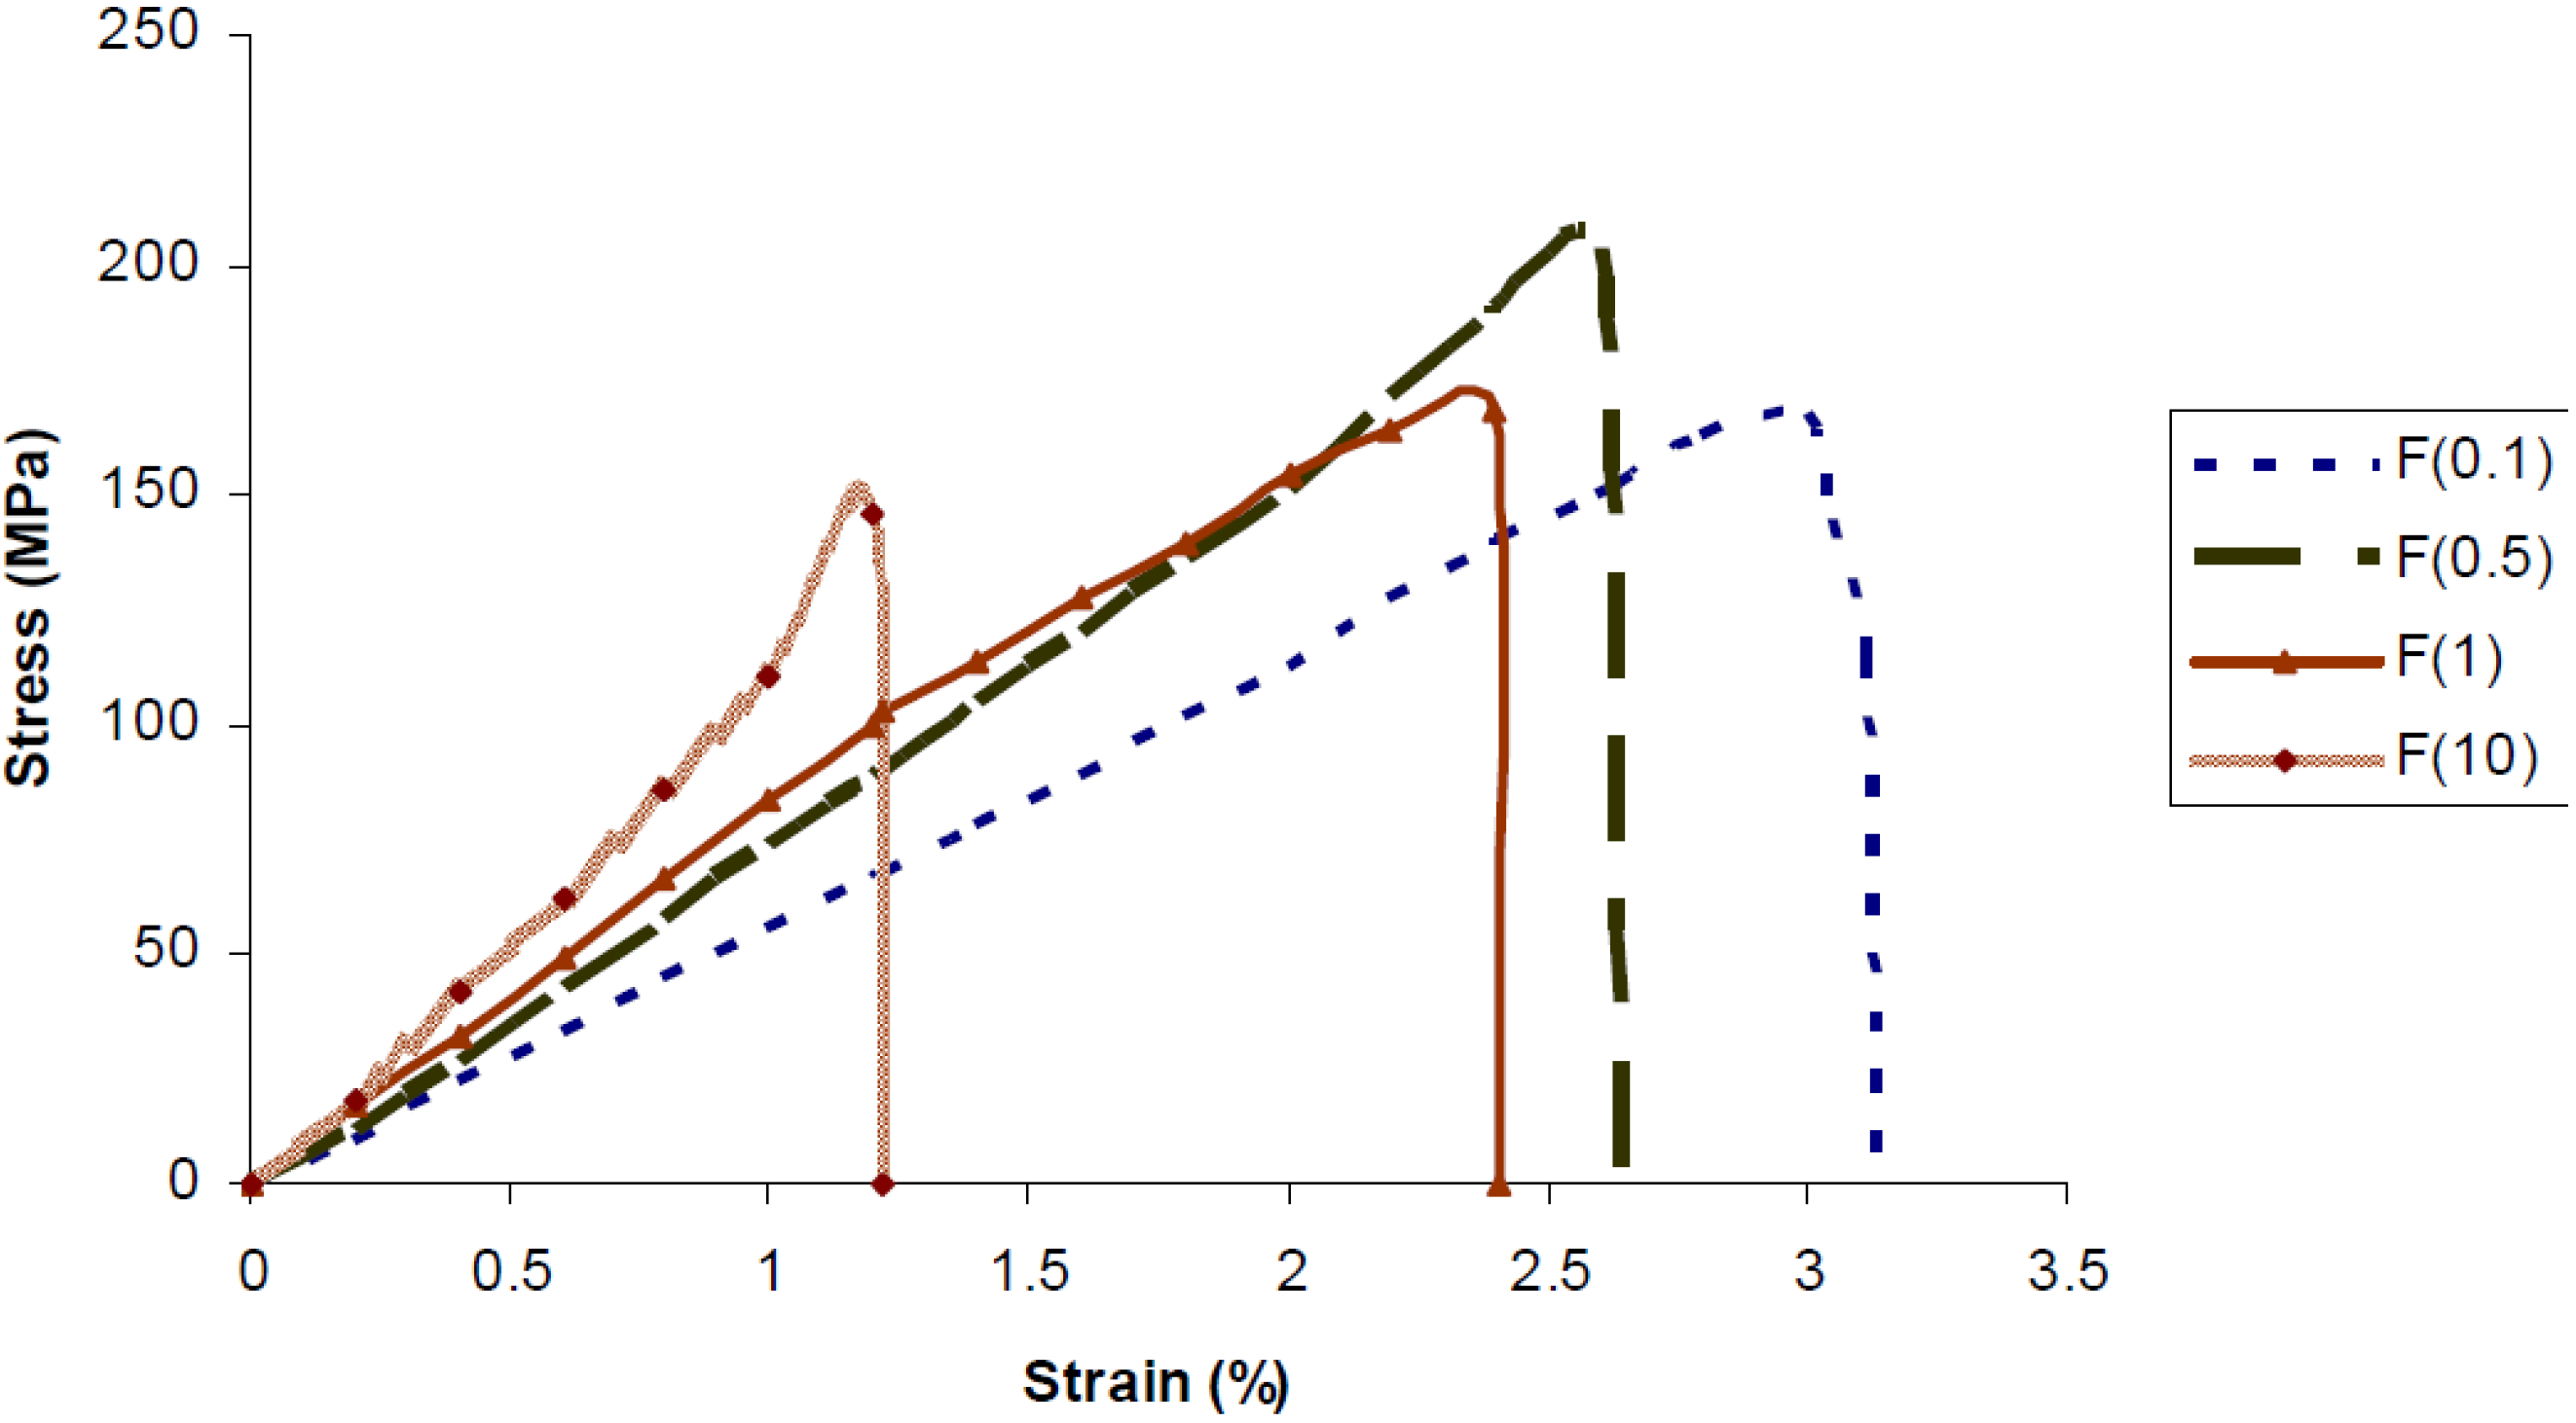
Most of the 35 tested samples’ failures occurred at the mid-point. Each tested sample exhibited linear elastic characteristics prior to initial crack, which typically occurred at peak load. The load-deflection responses of the fiber-reinforced samples were different from the unreinforced ones. Typical load-deflection curves of the tested samples are presented in 
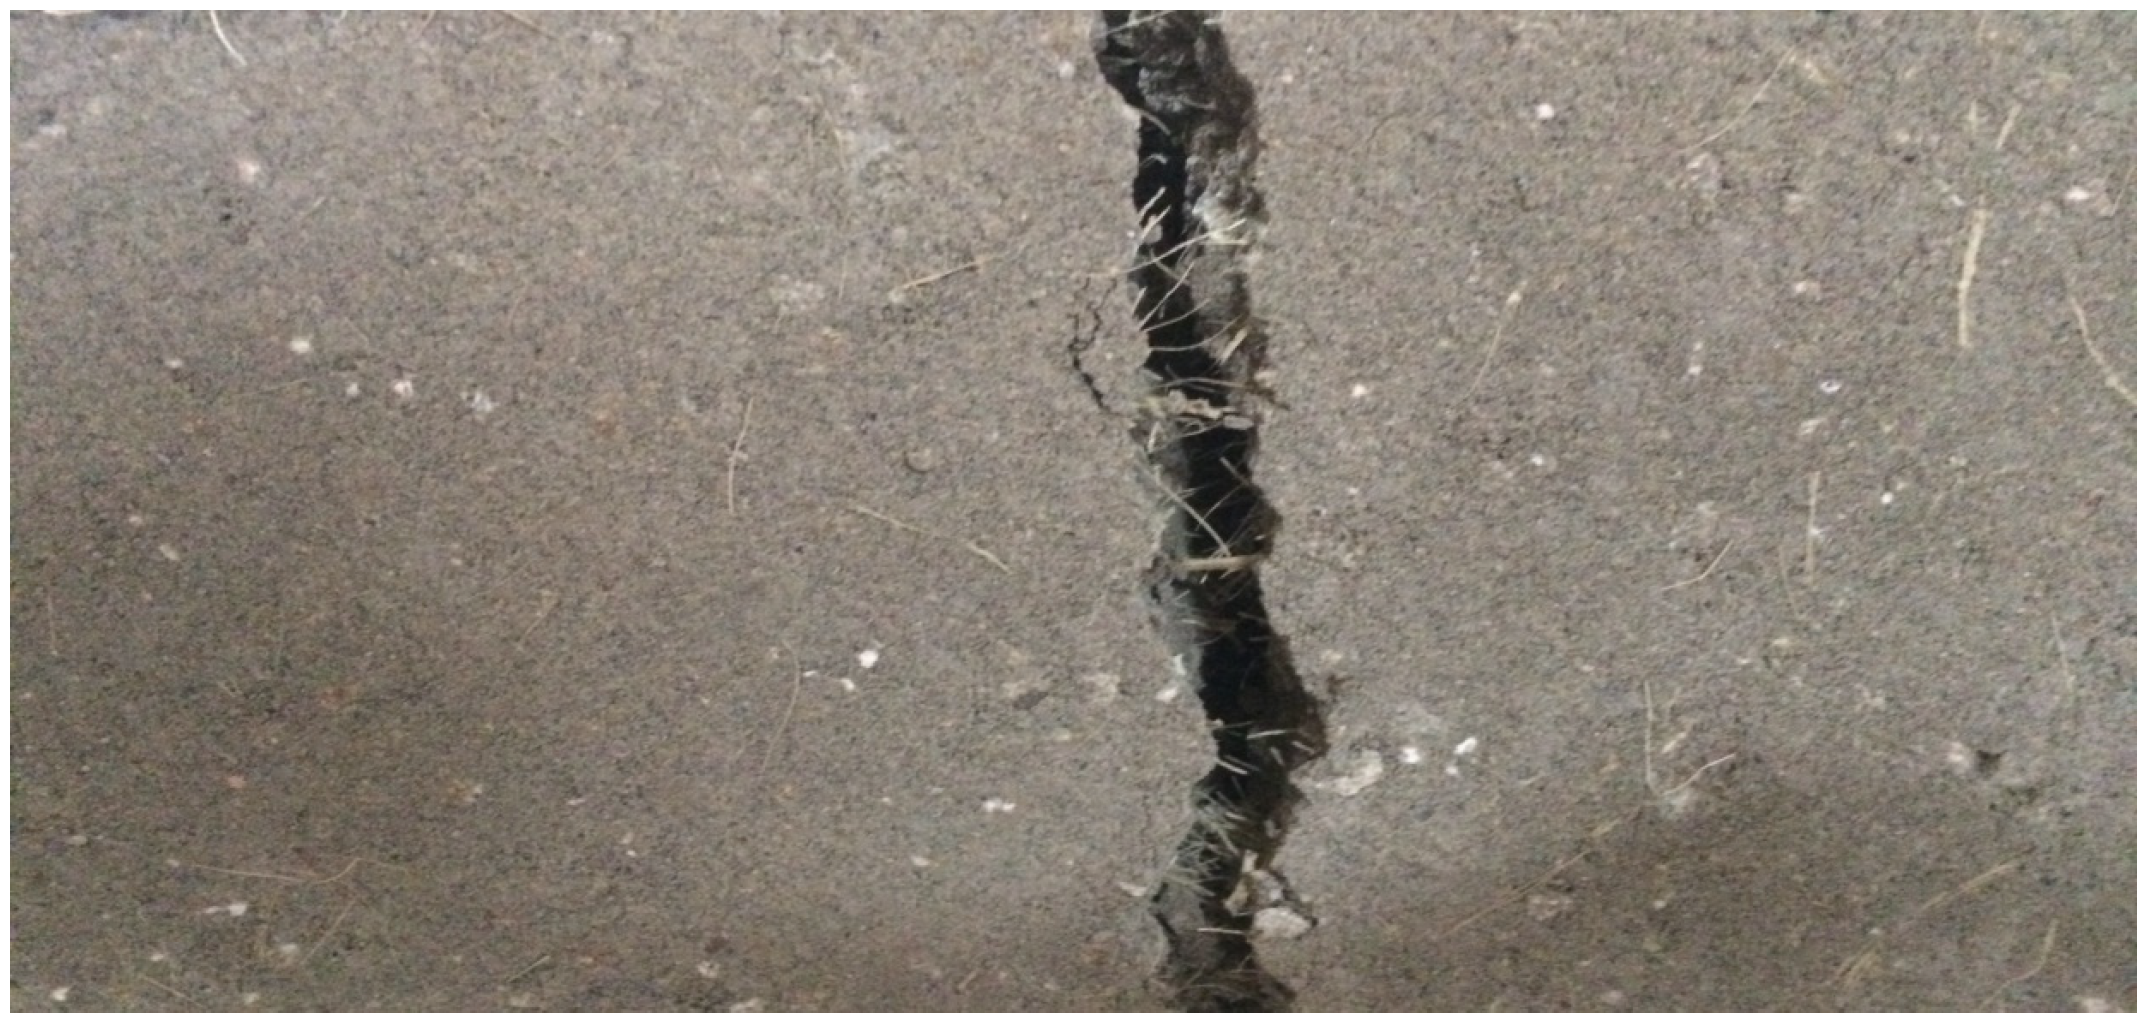
Figure 9. In general, the fiber-reinforced blocks performed better in post-initial crack behavior compared to the plain matrix. The results also suggest that the fibers affect the brittle behavior of the matrices. The unreinforced samples exhibited sudden failure in all instances. Most of the fiber-reinforced matrices experienced complete failure at more than 2 mm deflection, while the plain samples experienced complete failure at less than 1 mm displacement. It was also observed that some of the fibers’ cracks bridged. That could explain the cause of gradual failure as shown in Figure 10.
The fibers at the crack zone bear the tensile stress transferred from the rupture section. Previous studies established a relationship between increased aspect ratio of fibers and the ability of fibers to bridge micro cracks. In this study, the 50 mm fibers had a higher aspect ratio and produced a higher tensile strength in matrices compared to the 25 mm fibers, suggesting that their embedded length was insufficient to develop full tensile capacity. Observations during testing showed that the strength rebound occurred when fibers kicked in. The maximum post-initial crack load for the matrices reinforced with treated 50 mm fibers (mix #7) was the highest peak load recorded for all matrices.
Figure 9. Typical load-deflection curves for GCEBs Mixes.
Buildings 05 00282 g009
Figure 10. Banana fibers bridging the GCEB cracks during failure.
Buildings 05 00282 g010
The findings point out that extensible banana fibers did not totally pull out of matrices when specimens reached peak strength. It was also noted that gradual fiber slipping and stretching resulted in a high post-peak strength even at high deformation levels. Comparing the results from the different matrices in this study, matrices with different proportions of the shorter fibers (25 mm) did not sustain as much fiber slippage as matrices with only 50 mm fibers. Subsequently, more gradual failure, after initial crack of all the fiber-reinforced matrices, suggests an improved performance in ductility that can be attributed to the banana fibers. Also, both fiber pullout and breakage were observed in GCEBs.

4.3. Water Absorption Test

The specimens from the flexural tests were used for the water absorption test. The water absorption test is basic in nature but may be the most useful in assessing the durability of GCEBs. After 28 days curing, GCEBs were weighed and recorded. This was the dry weight (Wd). The weighted samples were then totally immersed in a water tank for 24 h. They were then taken out, wiped with a cloth, and reweighed. The weight of each specimen was recorded. This was the wet weight (Ws). The water absorption of the samples was calculated using Equation (3):
WA (%) = 100 × (WsWd)/Wd
where:
  • WA = Block water absorption;
  • Ws = Saturated weight of the block after submersion in cold water;
  • Wd = Dry weight of the block.
The absorption measures the unit’s total capacity to absorb moisture. The measure of plain-CEB recorded approximately 7.4% water absorption, while the water absorption of the GCEB with banana fibers recorded an average of 10.6%. The final density of the block is 128 PCF (Pound per Cubic Feet). Blocks with banana fibers have a slightly higher water permeability or absorption than plain blocks. The higher water absorption capacity of fiber-reinforced blocks may be attributed to the amount of water absorbed by the cellulose fiber. It can be concluded that fibers increase block permeability to water. The resulting data, however, shows that all the processed GCEBs were either in the 10%–20% water absorption range or below. Therefore, with respect to this parameter, all the GCEBs met the minimum requirements for their use in building construction [17].

4.4. Relationship between Flexural Strength, Compressive Strength, and Fiber Length

Table 8 and Figure 11 summarize the average compressive and flexural strength results in each of the seven GCEB mixes. The ratios between the values of such strengths are also presented. The recorded compressive strength values were, on the average, 5.45 to 7.35 times higher than the flexural strength values. Mix # 5 recorded the lowest compressive strength to flexural strength ratio of 5.45, while mix # 6 recorded the highest ratio of 7.35. The average compressive strength to flexural strength ratio for the banana fiber reinforced blocks was 6.5.
Table 8. Ratio and average values of compressive and flexural strength.
AverageCompressive Strength (MPa)Flexural Strength (MPa)Ratio
Mix
# 13.330.496.80
# 24.370.636.94
# 34.960.776.44
# 43.760.576.60
# 54.030.745.45
# 65.360.737.35
# 75.920.956.23
Average4.530.706.54
Figure 11. Average compressive and flexural strength.
Buildings 05 00282 g011

5. Summary and Conclusions

The meaning of this experimental study was to evaluate the influence of banana fiber length on the compressive and flexural strength of GCEBs. The results presented in this study provide important insights into the influence of fiber length on the flexural and compressive strengths of GCEBs. In GCEB matrices, soil constituents, fibers content, level of chemical stabilization (OPC content), compaction effort, and curing conditions all contribute to high mechanical properties. All these variables were kept constant throughout the study to enable observation of the influence of the banana fibers on the flexural strength, compressive strength, and post-initial crack behavior of fiber-reinforced GCEBs.
On average, specimens reinforced with 50 mm fibers performed better, in both flexural and compressive strength, compared to the unreinforced specimens and specimens reinforced with different variations of 25 mm fibers. The highest flexural and compressive strength values were recorded at reinforcement with 50 mm fibers and 0.35% fiber content by weight. The results made plain that the treated 50 mm fibers were the better performing fiber in this study. Compared to the unreinforced specimens, specimens reinforced with 50 mm fibers at 0.35% by weight, were 94% and 77% higher, in terms of flexural and compressive strength, respectively. The incorporation of fibers into the matrices prevented sudden failure of the tested samples during the MOR test.
Material properties of banana reinforced GCEB are largely influenced by fiber type, fiber volume, fiber geometry and length (aspect ratio), fiber surface conditions, method of production, and composition of matrices. All these factors were considered when selecting the engineered natural banana fibers used. The findings show that with an adequate understanding of GCEBs specimens, such fibers can enhance the lateral load performance of earthen masonry. Consequently, experimental work and sample size will be increased to validate these initial findings.

Author Contributions

Marwan Mostafa and Nasim Uddin conceived and designed the experiments; Marwan Mostafa performed the experiments; Marwan Mostafa and Nasim Uddin analyzed the data; Nasim Uddin contributed reagents/materials/analysis tools; Marwan Mostafa wrote the paper.

Conflicts of Interest

The authors declare no conflicts of interest.

References

  1. Walker, P.J. Strength and erosion characteristics of earth blocks and earth block masonry. J. Mater. Civ. Eng. 2004, 16, 497–506. [Google Scholar] [CrossRef]
  2. Minke, G. The Building Material Earth in Modern Architecture. In Earth Construction Handbook; WIT Press: Southampton, UK, 2000. [Google Scholar]
  3. Prochazka, P.; Trčková, J.; Dolezel, V. Mixture Reinforced by Polypropylene Fibres at Higher Temperature Conditions. In Proceedings of the 35th Conference on Our World in Concrete and Structures, Singapore, 25–27 August 2010.
  4. Bessadok, A.; Roudesli, S.; Marais, S.; Follain, N.; Lebrun, L. Alfa fibers for unsaturated polyester composites reinforcement: Effects of chemical treatments on mechanical and permeation properties. Compos. A 2009, 40, 184–195. [Google Scholar] [CrossRef]
  5. Samrat, M.; Raul, F.; Yusuf, A. Banana fibers variability and fracture behavior. J. Eng. Fibers Fabr. 2008, 3, 39–45. [Google Scholar]
  6. Sandeep, K.; Varma, K. Degradation studies of polycaprolactone in banana fibers reinforced thermoplastics composites. J. Macromol. Sci. B 2006, 45, 153–164. [Google Scholar] [CrossRef]
  7. Girisha, C.; Sanjeevamurthy; Guntiranga, S. Effect of alkali treatment, fiber loading and hybridization on tensile properties of sisal fiber, banana empty fruit bunch fiber and bamboo fiber reinforced thermo-set composites. Int. J. Eng. Sci. Adv. Technol. 2012, 2, 706–711. [Google Scholar]
  8. Lina, H.E.; Pillay, S.; Vaidya, U. Fiber Composites for Automotive and Transportation Applications. In Proceedings of the 8th Annual Automotive Composites Conference and Exhibition, Troy, MI, USA, 16 September 2008.
  9. Khedari, J.; Watsanasathaporn, P.; Hirunlabh, J. Development of fibre-based soil-cement block with low thermal conductivity. Cem. Concr. Compos. 2005, 27, 111–116. [Google Scholar] [CrossRef]
  10. Prasad, C.K.; Nambiar, E.K.; Abraham, B.M. Plastic fiber reinforced soil blocks as a sustainable building material. Int. J. Adv. Res. Technol. 2012, 1, 42–45. [Google Scholar]
  11. Elenga, R.G.; Mabiala, B.; Ahouet, L.; Goma-Maniongui, J.; Diris, G.F. Characterization of clayey soils from congo and physical properties of their compressed earth blocks reinforced with post-consumer plastic wastes. J. Sci. Res. Geomater. 2011, 1, 88–94. [Google Scholar]
  12. Bland, D.W. In-Plane Cyclic Shear Performance of Interlocking Compressed Earth Block Walls. Master’s Thesis, California Polytechnic State University, San Luis Obispo, CA, USA, April 2011. [Google Scholar]
  13. ASTM. Standard Test Methods for Sampling and Testing Brick and Structural Clay Tile; ASTM International: West Conshohocken, PA, USA, 2007. [Google Scholar]
  14. Patel, P.A.; Desai, A.K.; Desai, K.A. Evaluation of engineering properties for polypropylene fiber reinforced concrete. Int. J. Adv. Eng. Technol. 2012, 3, 42–45. [Google Scholar]
  15. Bagherzadeh, R.; Pakravan, H.R.; Sadeghi, A.; Latifi, M.; Merati, A.A. An investigation on adding polypropylene fibers to reinforce Lightweight Cement Composites (LWC). J. Eng. Fibers Fabr. 2012, 7, 13–21. [Google Scholar]
  16. Tang, C.; Gao, W.; Fengjun, C.; Cai, Y. Strength and mechanical behavior of short polypropylene fiber reinforced and cement stabilized clayey soil. Geotext. Geomembr. 2007, 25, 194–202. [Google Scholar] [CrossRef]
  17. Ugwuishiwu, O.; Mama, O.; Okoye, M. Effects of natural fiber reinforcement on water absorption of compressed stabilized earth blocks. IJSR Int. J. Sci. Res. 2013, 2, 165–167. [Google Scholar]

