
Impacts of an Innovative Residential Construction Method on Internal Conditions

Abstract
:
1. Introduction
“Warm subtropical in the far north to cool temperate climates in the far south, with severe alpine conditions in the mountainous areas. Mean annual temperatures range from 10 °C in the south to 16 °C in the north of New Zealand. Most of New Zealand would have at least 2000 sunshine hours annually.”
2. Research Design and Methods

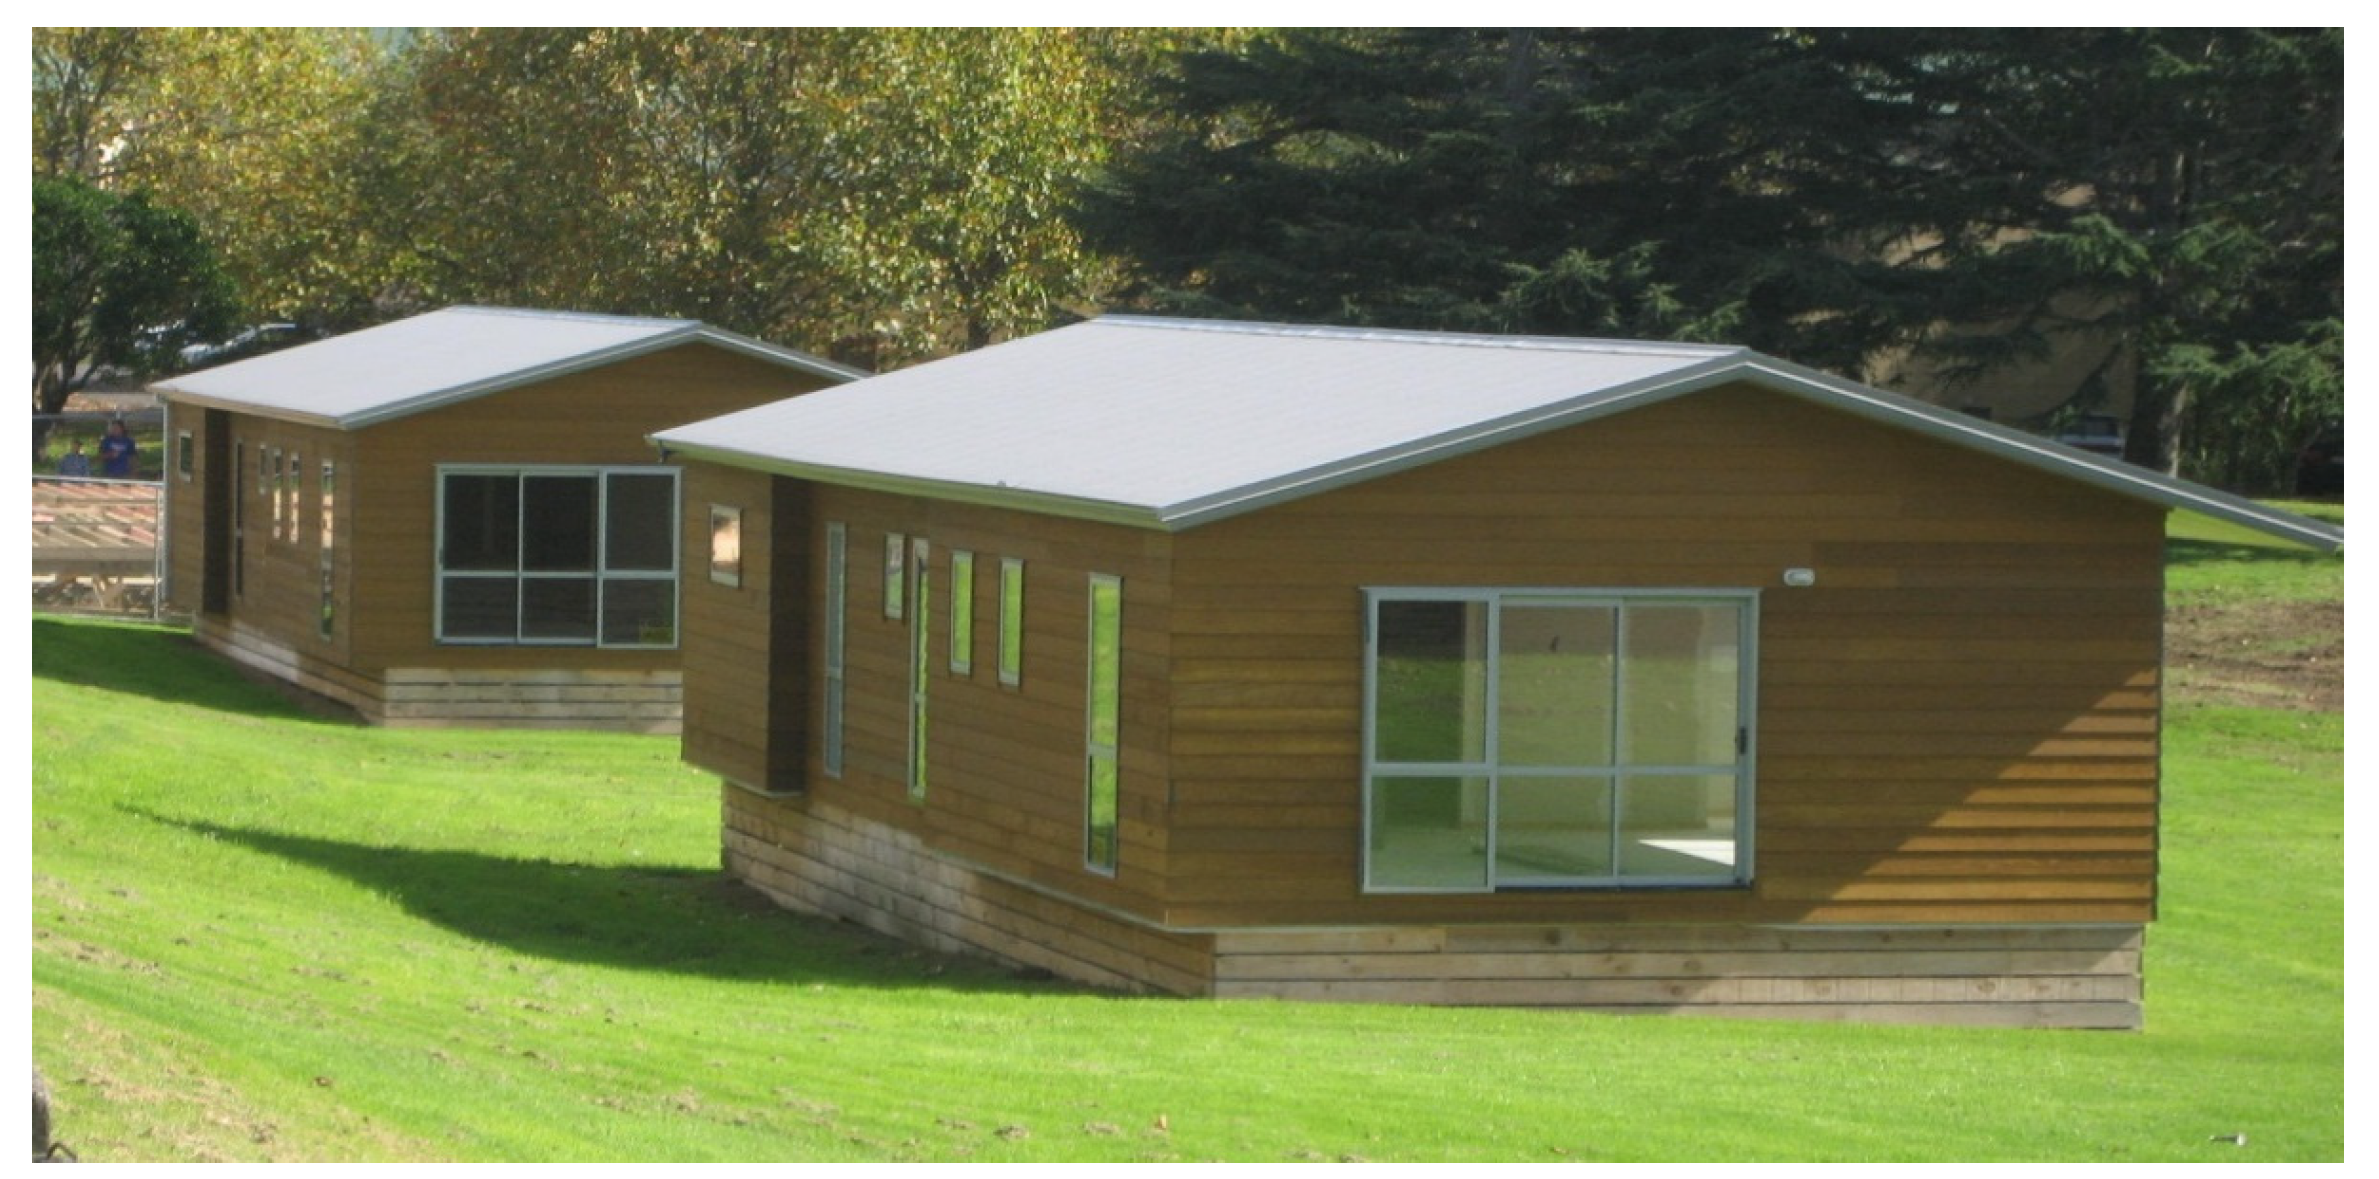
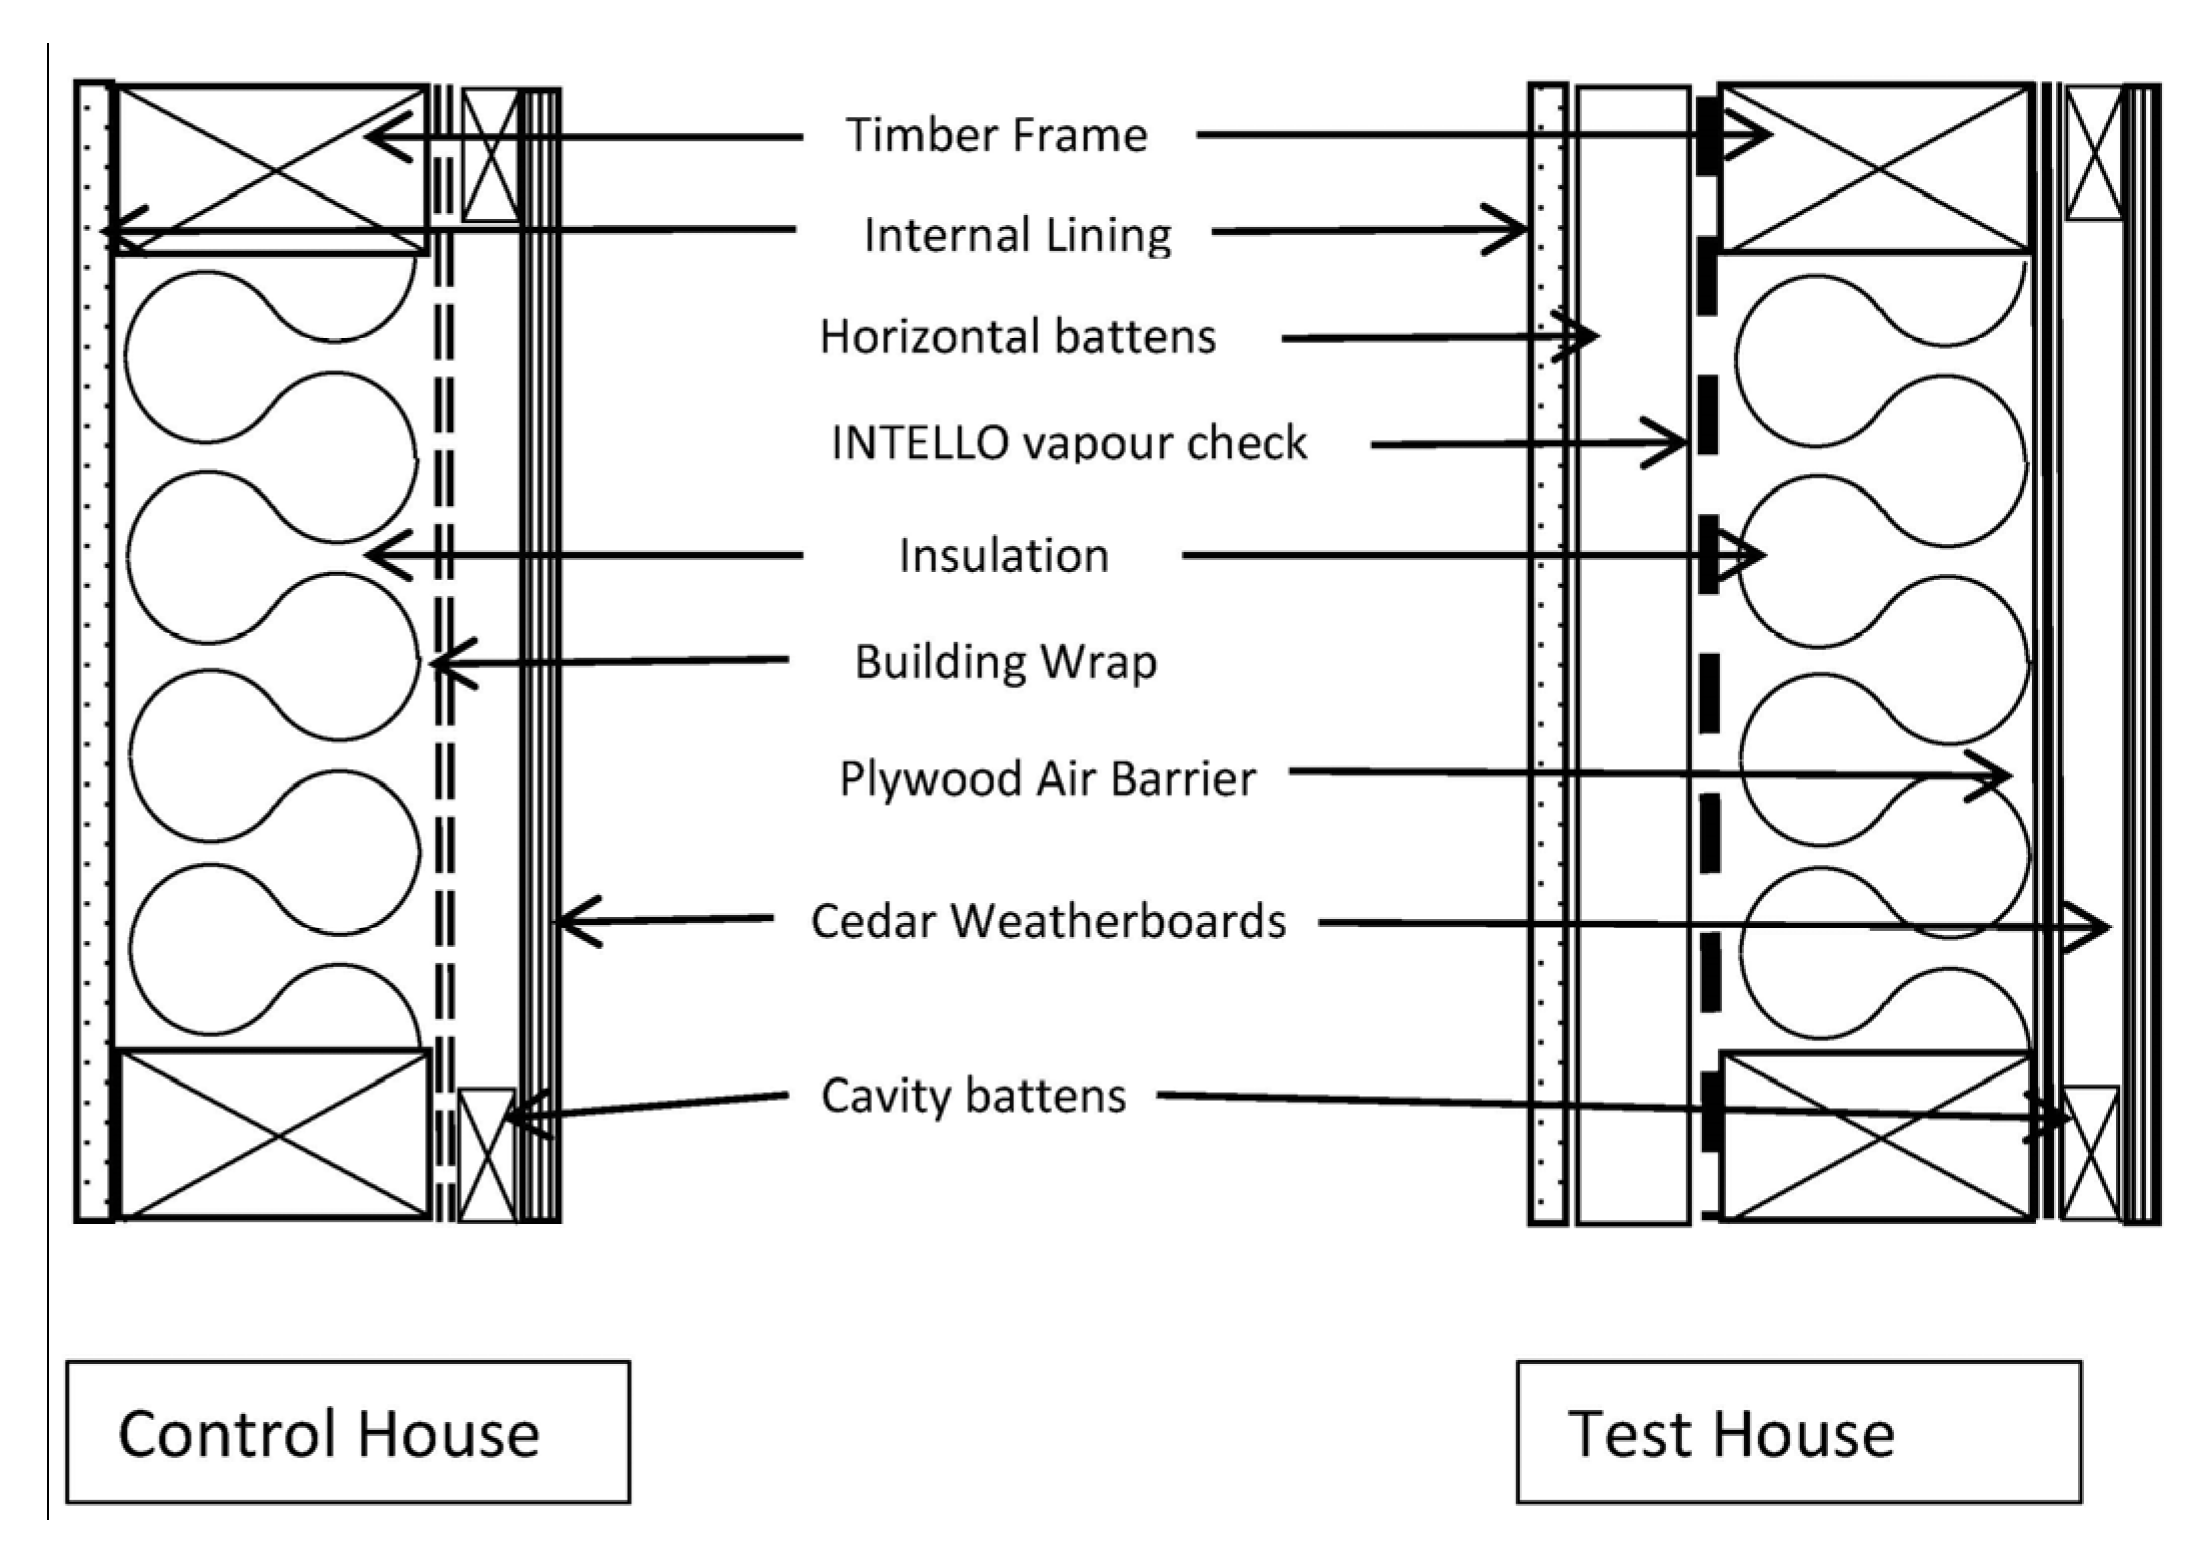
2.1. Control House


| Common to Control House and Test House | |
|---|---|
| Timber Frame on pile foundation | |
| Sub floor cladding 150 mm × 25 mm radiata pine boards with 20 mm gaps | |
| Particle board, floor foil insulation draped between 190 mm × 45 mm joists | |
| 140 mm polyester ceiling batts, 10 mm plasterboard | |
| Double glazed windows | |
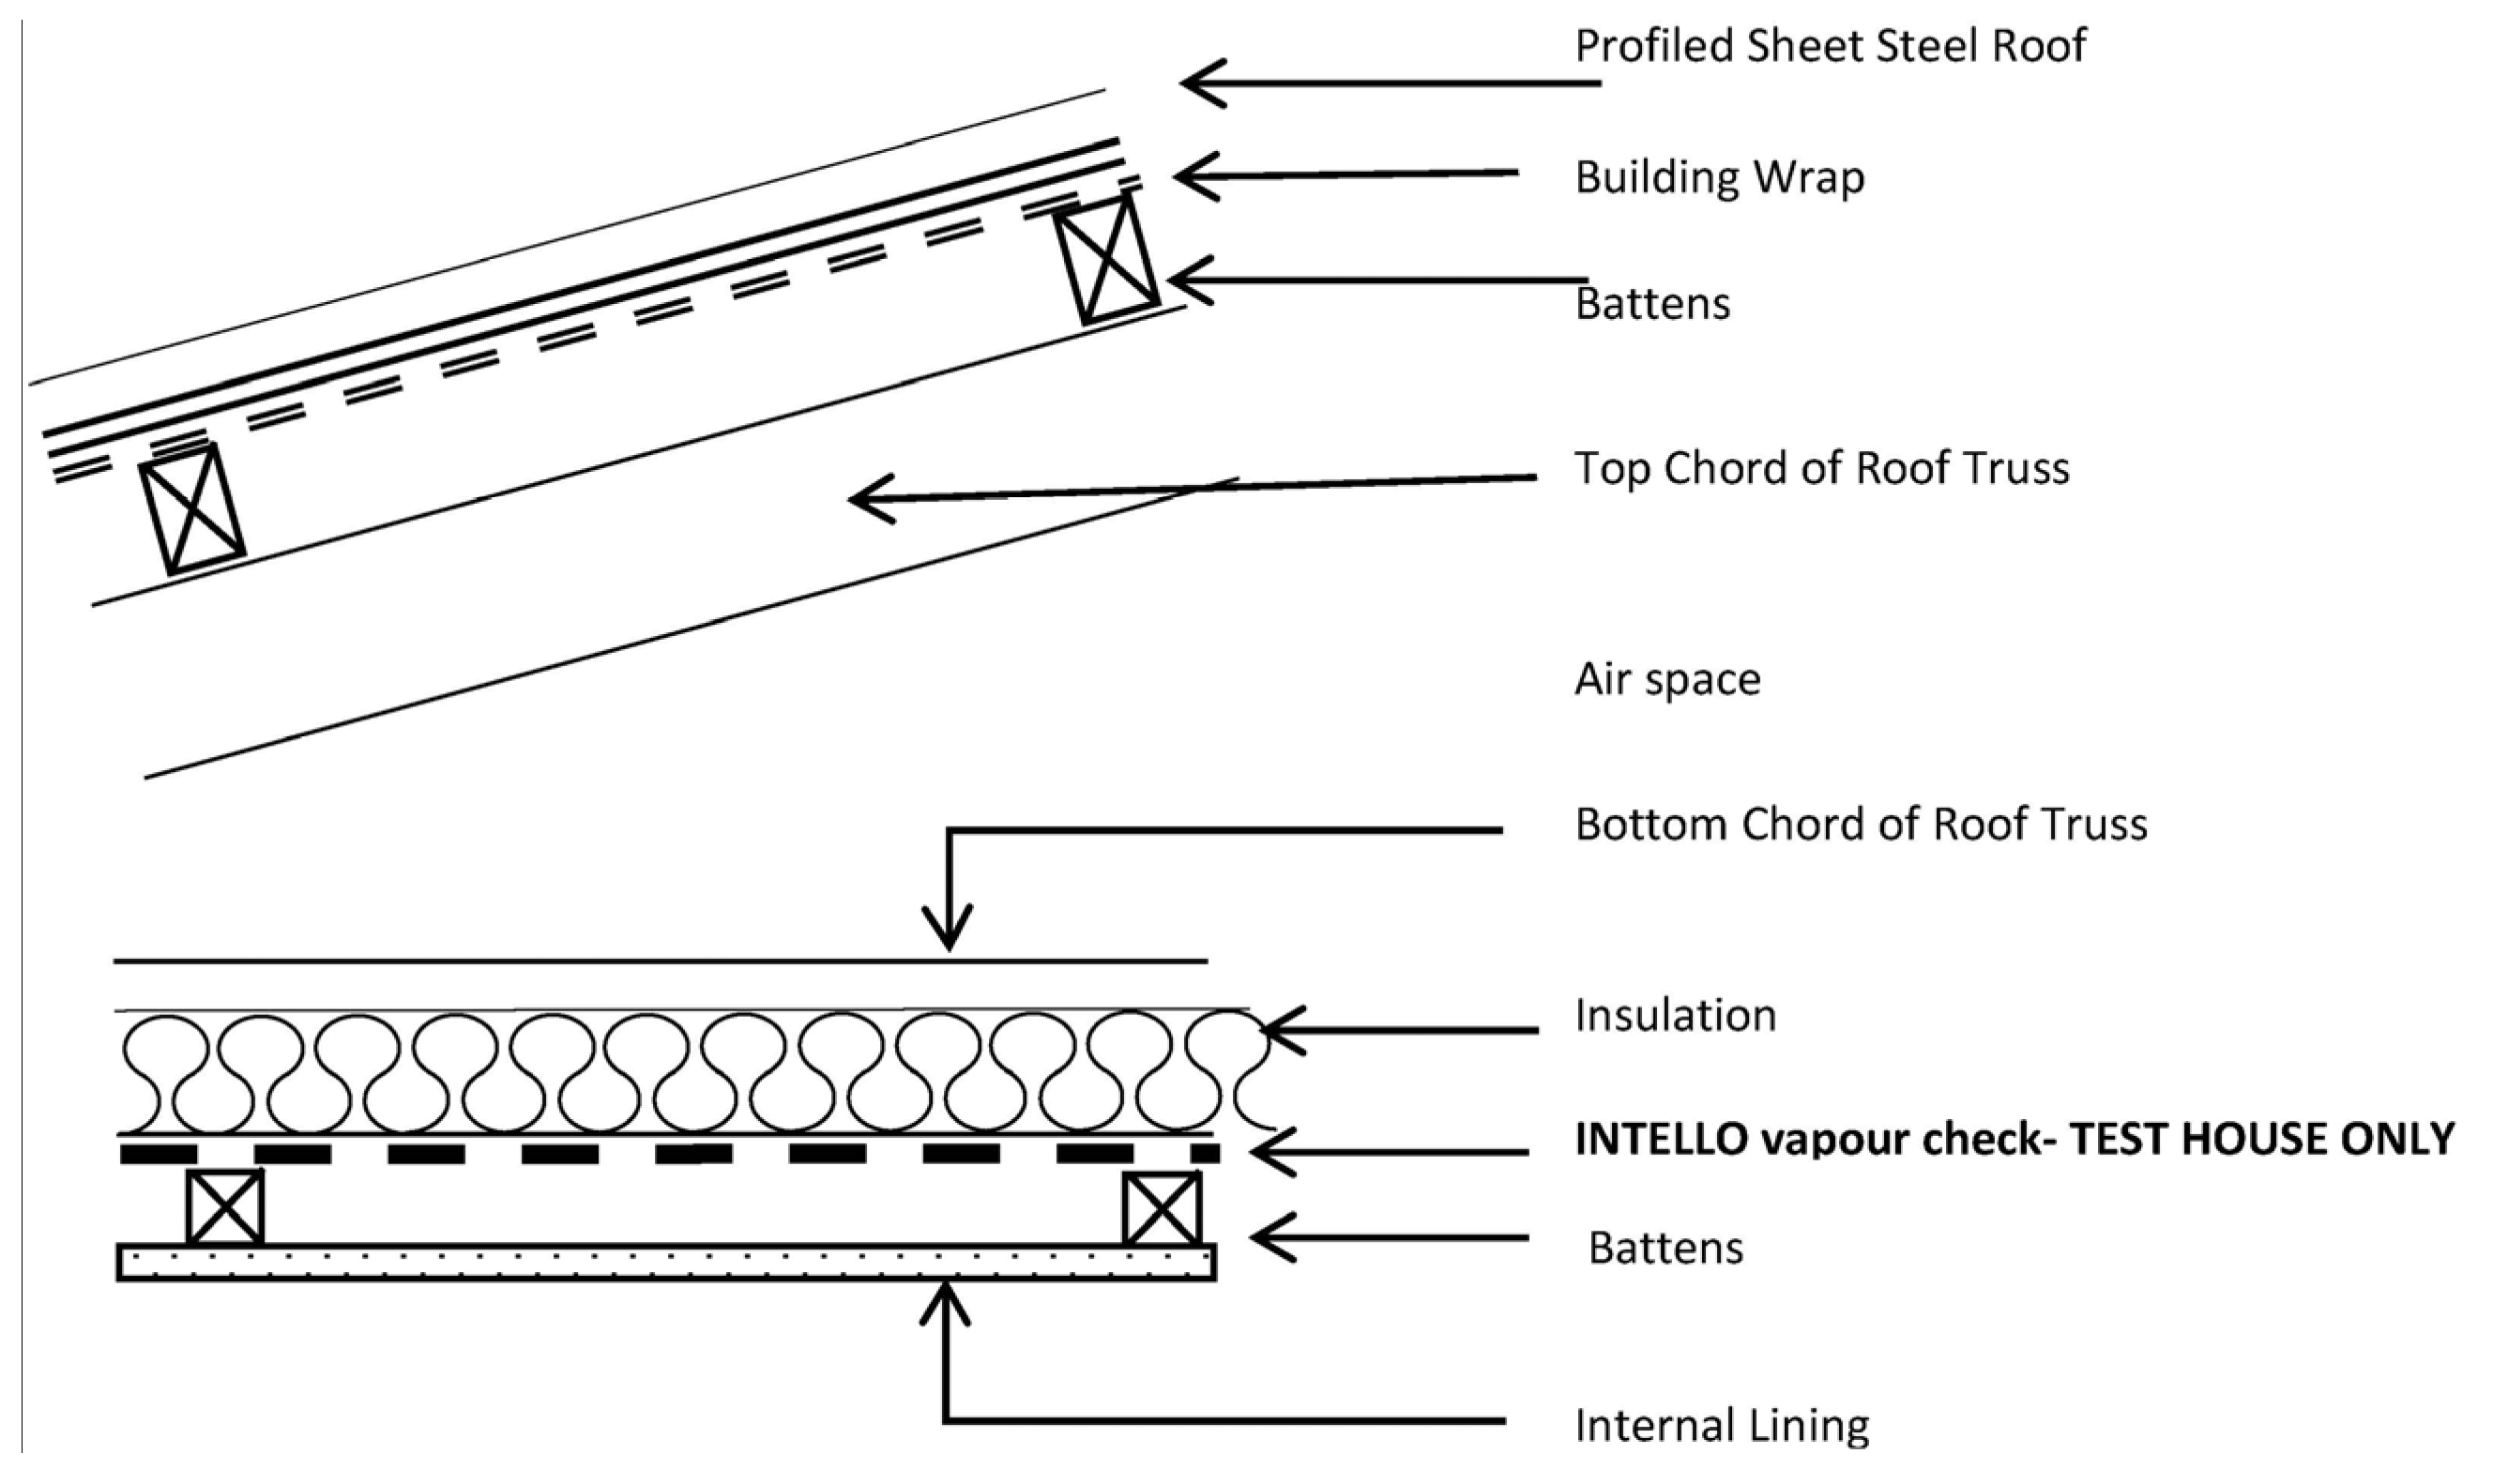
| Control House | Test House |
| Trussroof (radiata pine treated) Coloursteel roofing on building paper | Trussroof (radiata pine treated) Coloursteel roofing on building paper, INTELLO wrap on bottom chord of trusses |
| cedar weatherboard cladding, natural finish | cedar weatherboard cladding, natural finish |
| 20 mm cavity battens | 20 mm cavity battens |
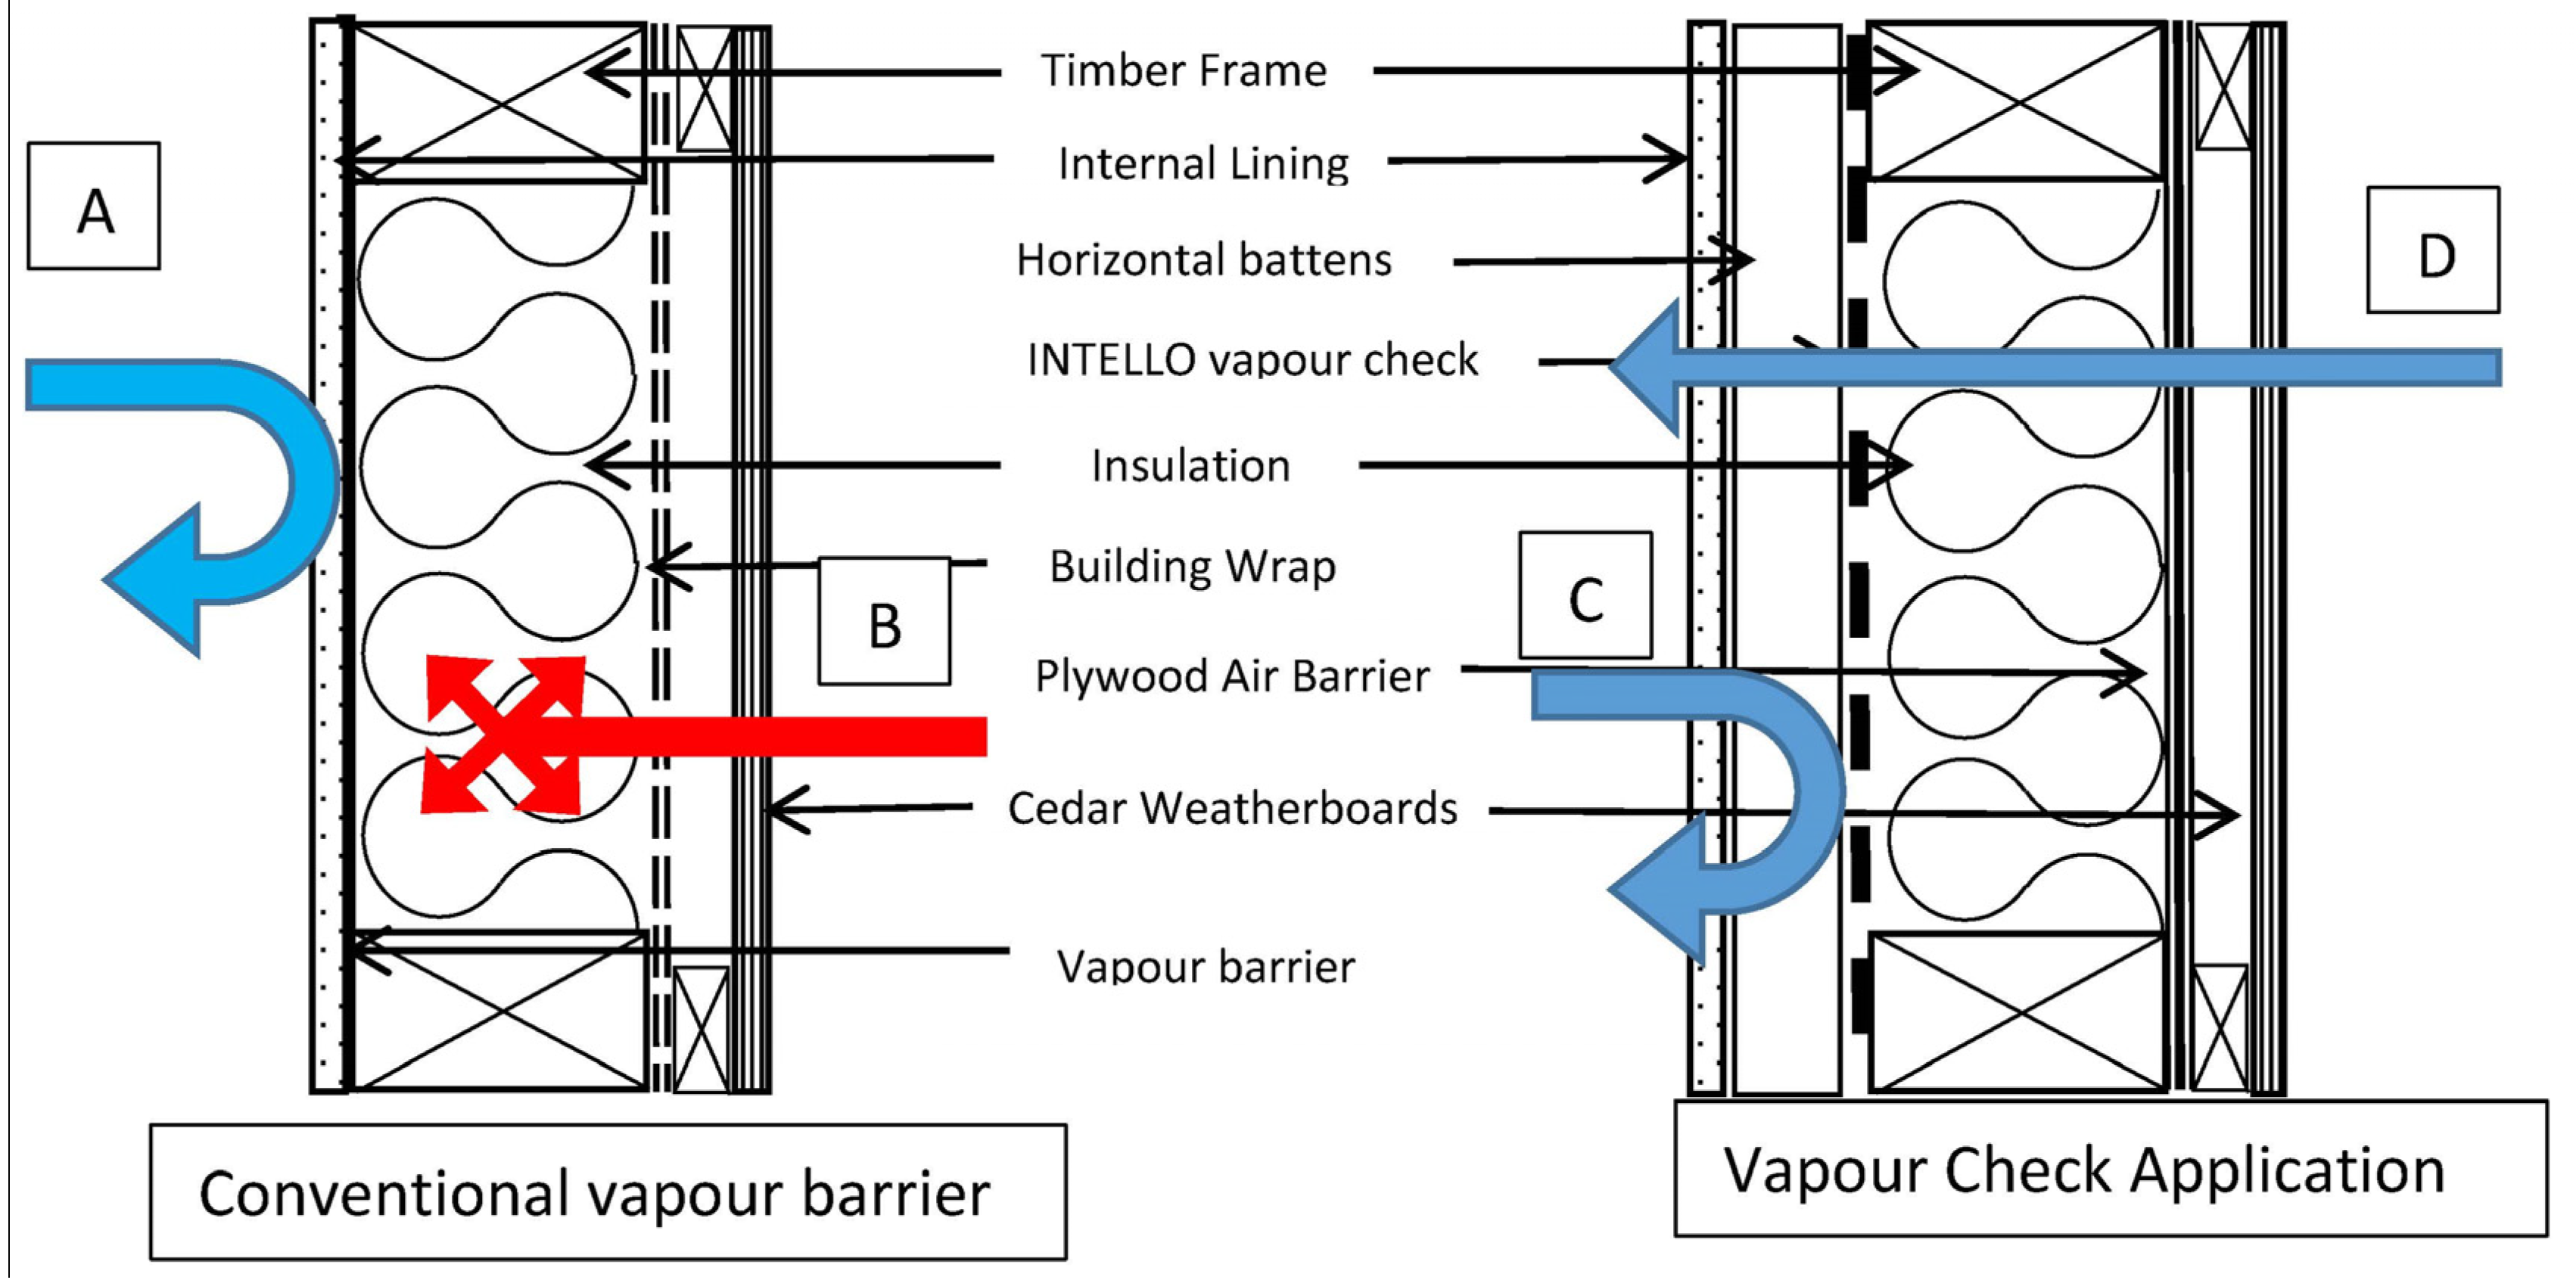
| Building wrap | 7 mm Plywood |
| 90 mm × 45 mm radiata pine framing | 90 mm × 45 mm radiata pine framing |
| Polyester insulation | Polyester insulation |
| - | INTELLO Vapour check |
| - | 45 mm × 45 mm battens |
| 10 mm plasterboard | 10 mm plasterboard |
- Roof 2.9 m2K/W
- Wall 1.9 m2K/W
- Windows 0.26 m2K/W
- Floor 1.3 m2K/W
| Material | Thickness t | Conductivity k | Resistance R | Vapour Resistivity rv | Vapour Resistance G |
|---|---|---|---|---|---|
| - | mm | W/mK | m2K/W | MNs/gm | MNs/g |
| External Walls | - | - | - | - | - |
| Plasterboard | 10 | 0.22 | 0.05 | 60 | 0.6 |
| Air gap (Test House) | 45 | - | 0.18 | - | 5 |
| Vapour Check (Test House) | 3 | - | - | - | see Table 3 |
| Insulation | 90 | 0.041 | 2.20 | 7 | 0.63 |
| Building Wrap (Control House) | 3 | n/a | n/a | 2300 | 6.9 |
| Plywood Air Barrier | 7 | 0.13 | 0.05 | - | 2.2 |
| Ventilated Air Gap | 20 | - | 0.09 | - | - |
| Cedar Weatherboard | 19 | 0.11 | 0.09 | - | 0.26 |
| Plasterboard | 10 | 0.22 | 0.05 | 60 | 0.6 |
| Air gap (Test House) | 45 | - | 0.18 | - | 5 |
| Vapour Check (Test House) | 3 | - | - | - | see Table 3 |
| Air Gap | 300 | - | 0.16 | - | 5 |
| Building Wrap | 3 | - | - | 2300 | 6.9 |
| Profiled Sheet Steel Roof | 4 | - | - | - | 2000 |
2.2. Test House

| Testing Conditions | Vapour Diffusion Resistance (MNs/g) | |
|---|---|---|
| Average Ambient Humidity | 20% | 85% |
| Direction of Diffusion Flow | Out towards the air barrier | Inwards towards the air barrier |
| INTELLO | 125 | 1.25 |
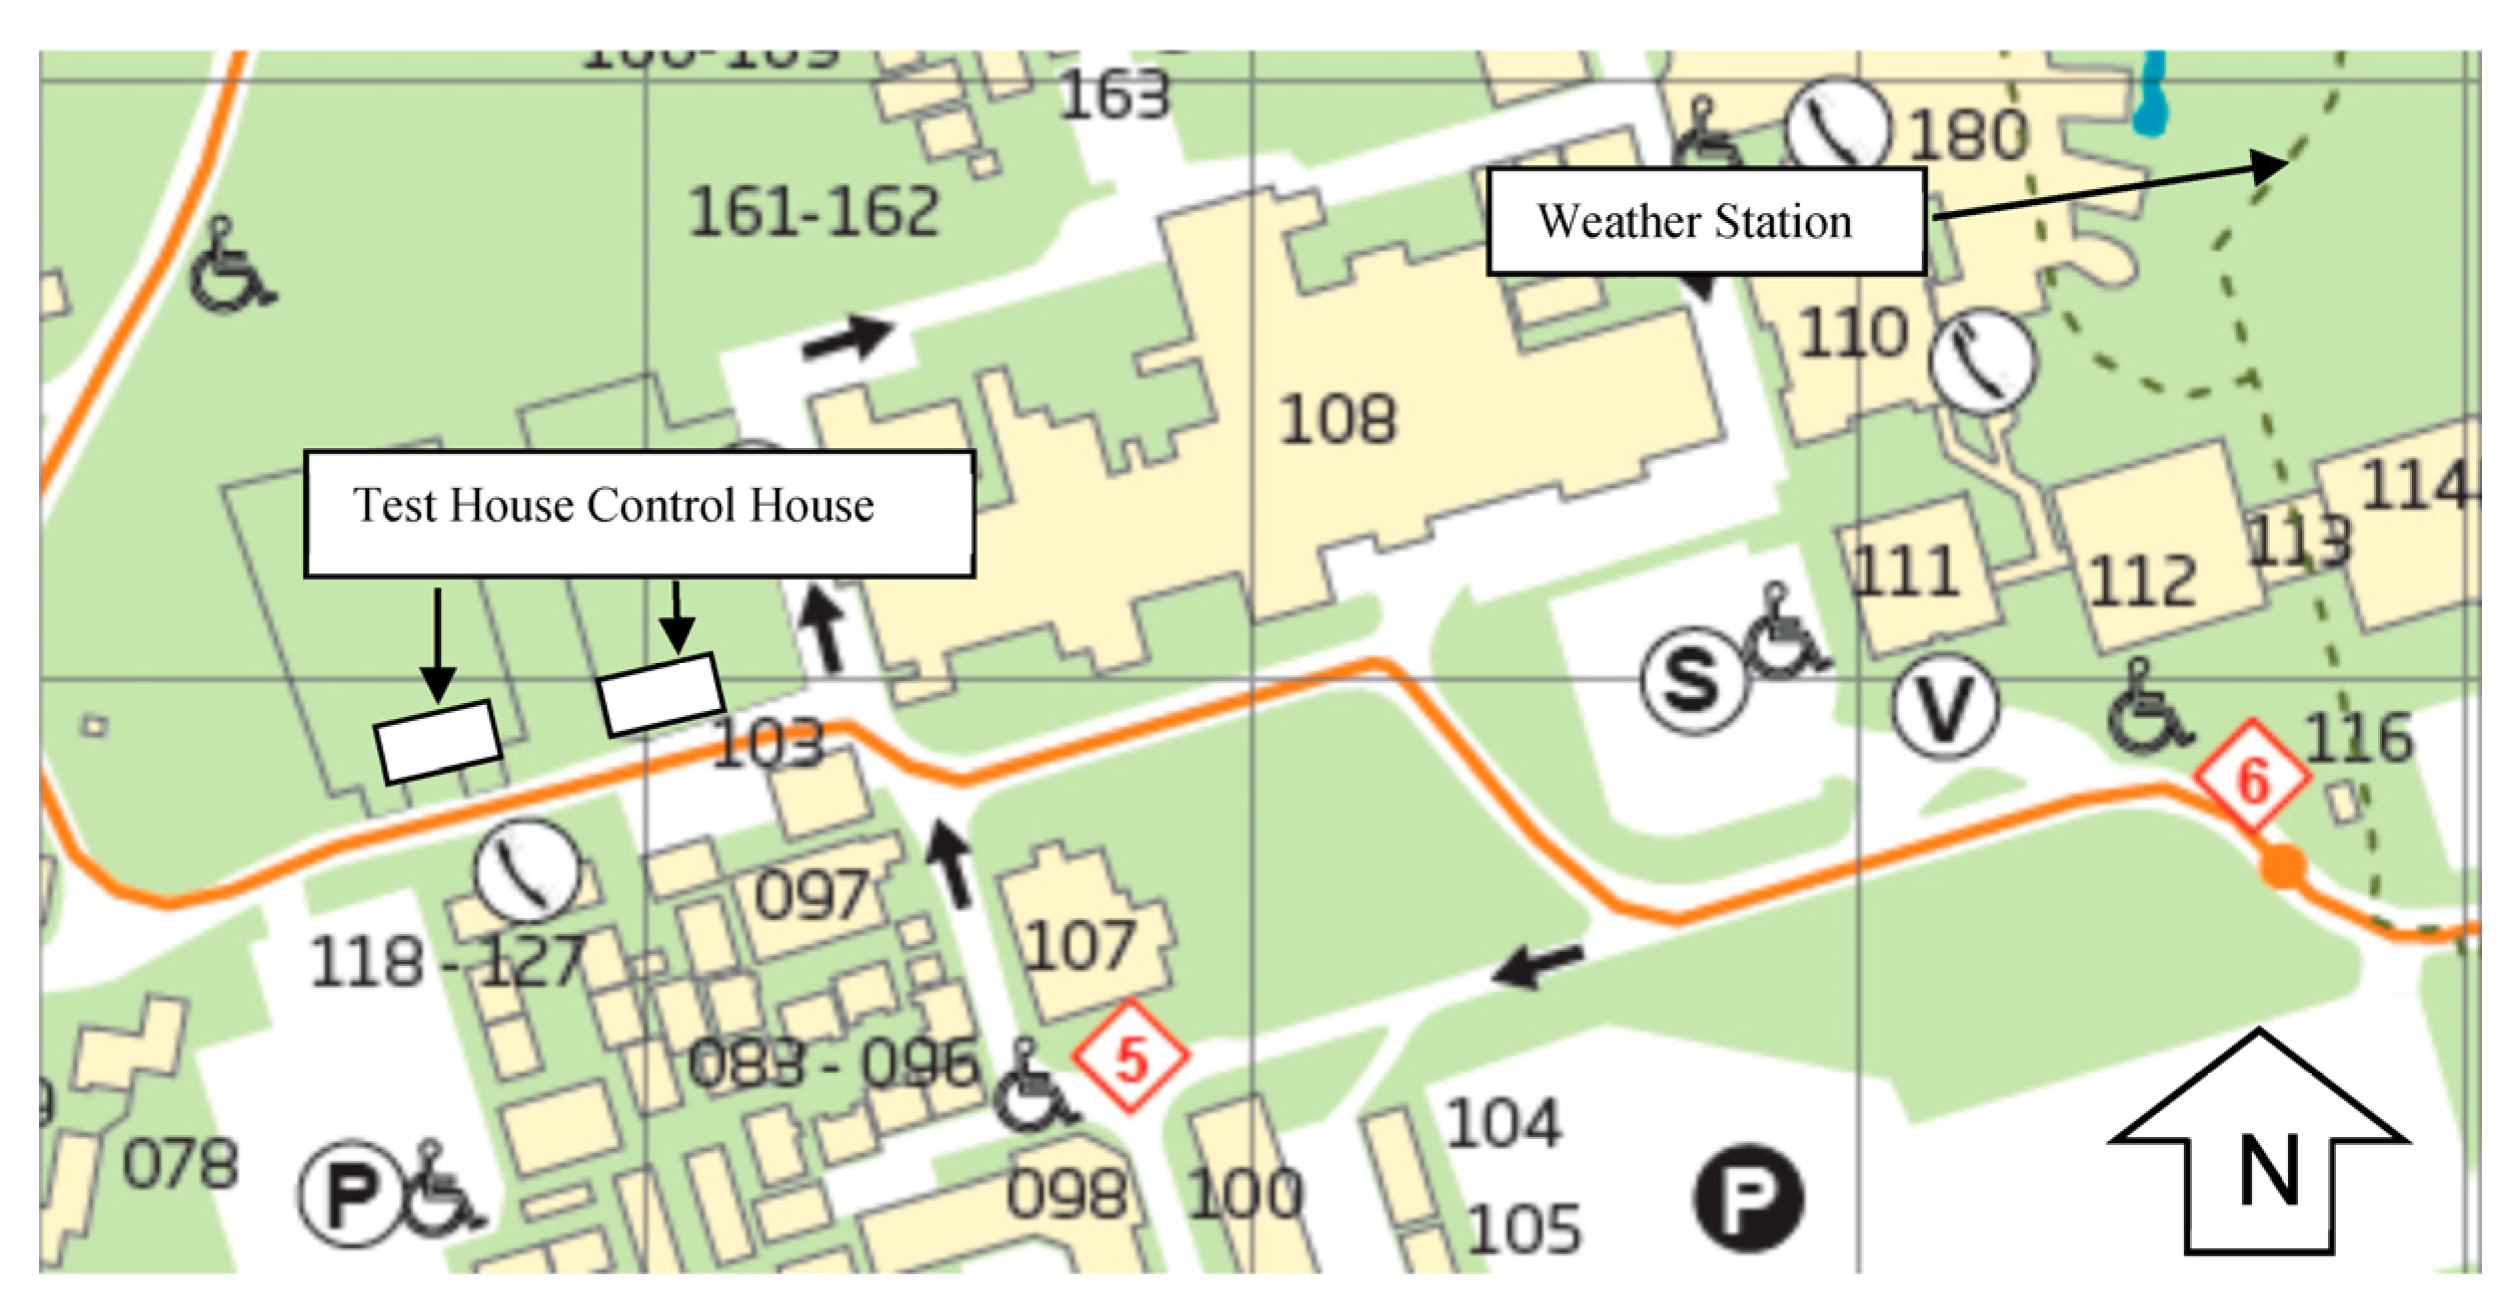
2.3. Site
2.4. Monitoring Process


2.5. Air Tightness
| Testing Conditions | Control House (ac/h) | Test House (ac/h) |
|---|---|---|
| Depressurisation | 6.58 | 1.92 |
| Pressurisation | 6.93 | 2.10 |
| Average | 6.75 | 2.01 |
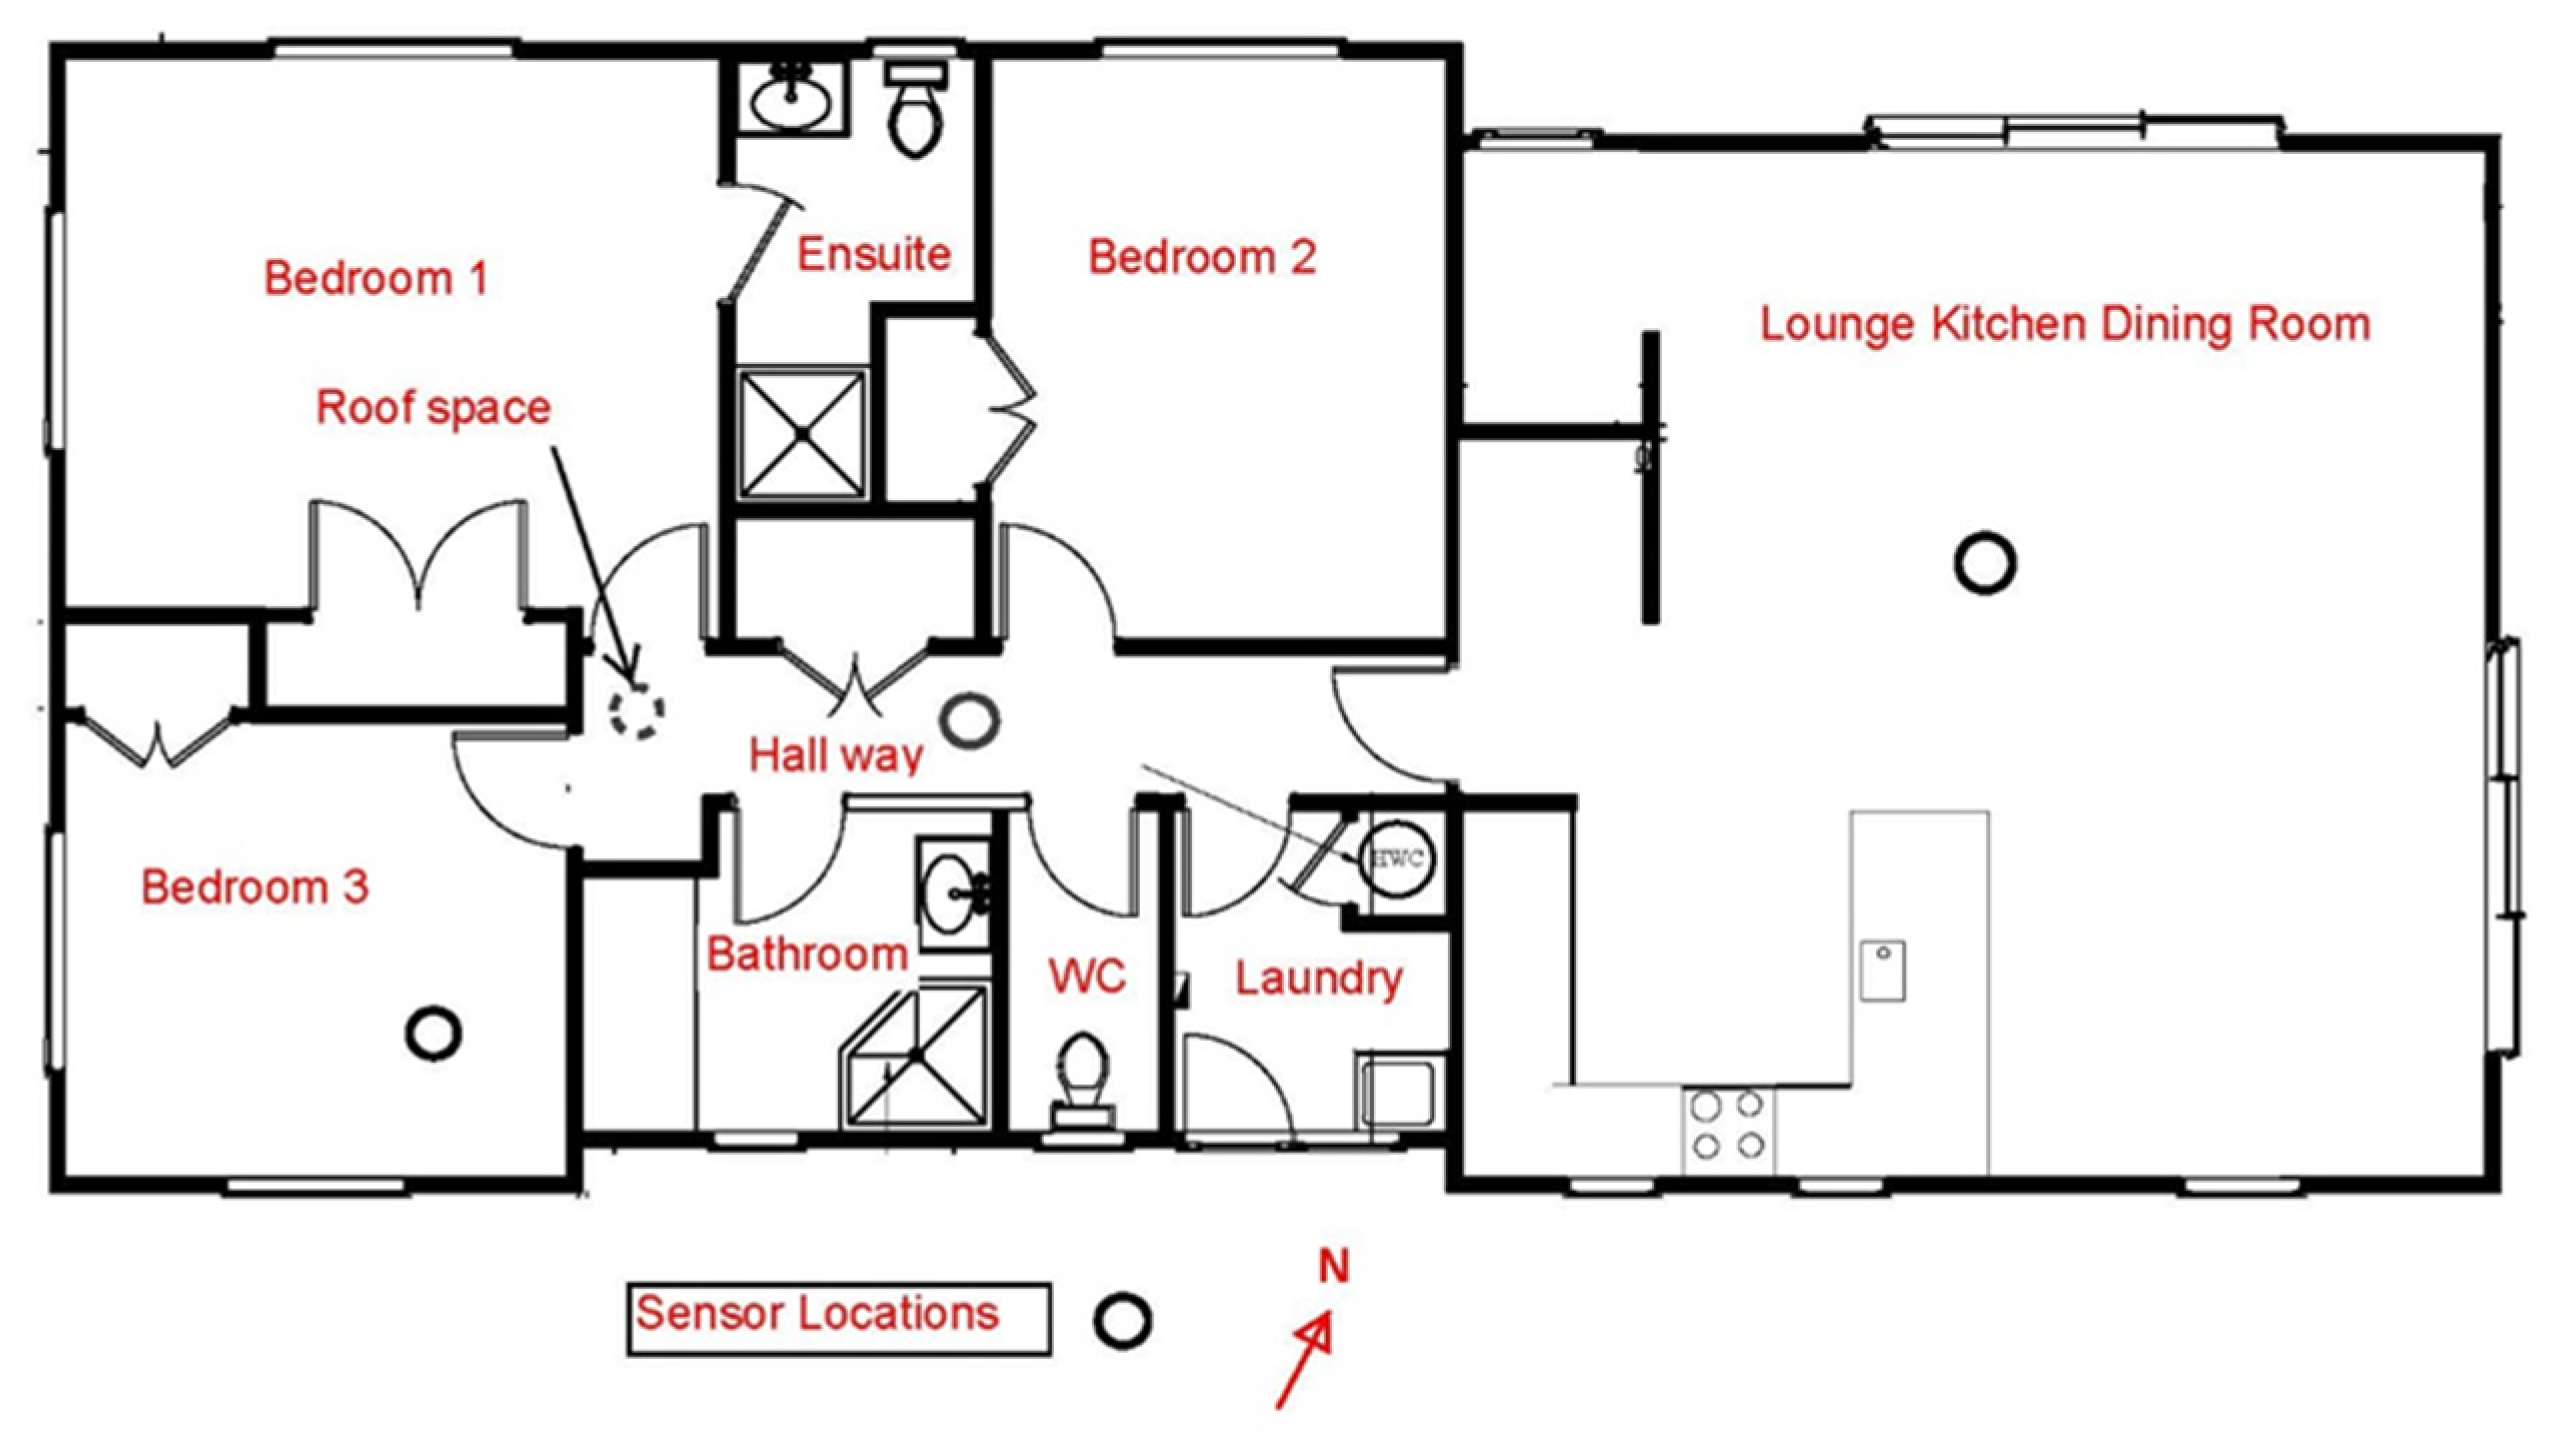
2.6. Rooms Being Analysed
| Room | Floor Area (m2) | Net External Wall Area (m2) |
|---|---|---|
| Lounge Kitchen Dining room | 46.4 | 33.6 |
| Bedroom 3 | 9.8 | 11.07 |
| Hall | 5.6 | Nil |
| Roofspace | 120.5 | Nil |
3. Results and Discussion
3.1. Seasonal Data
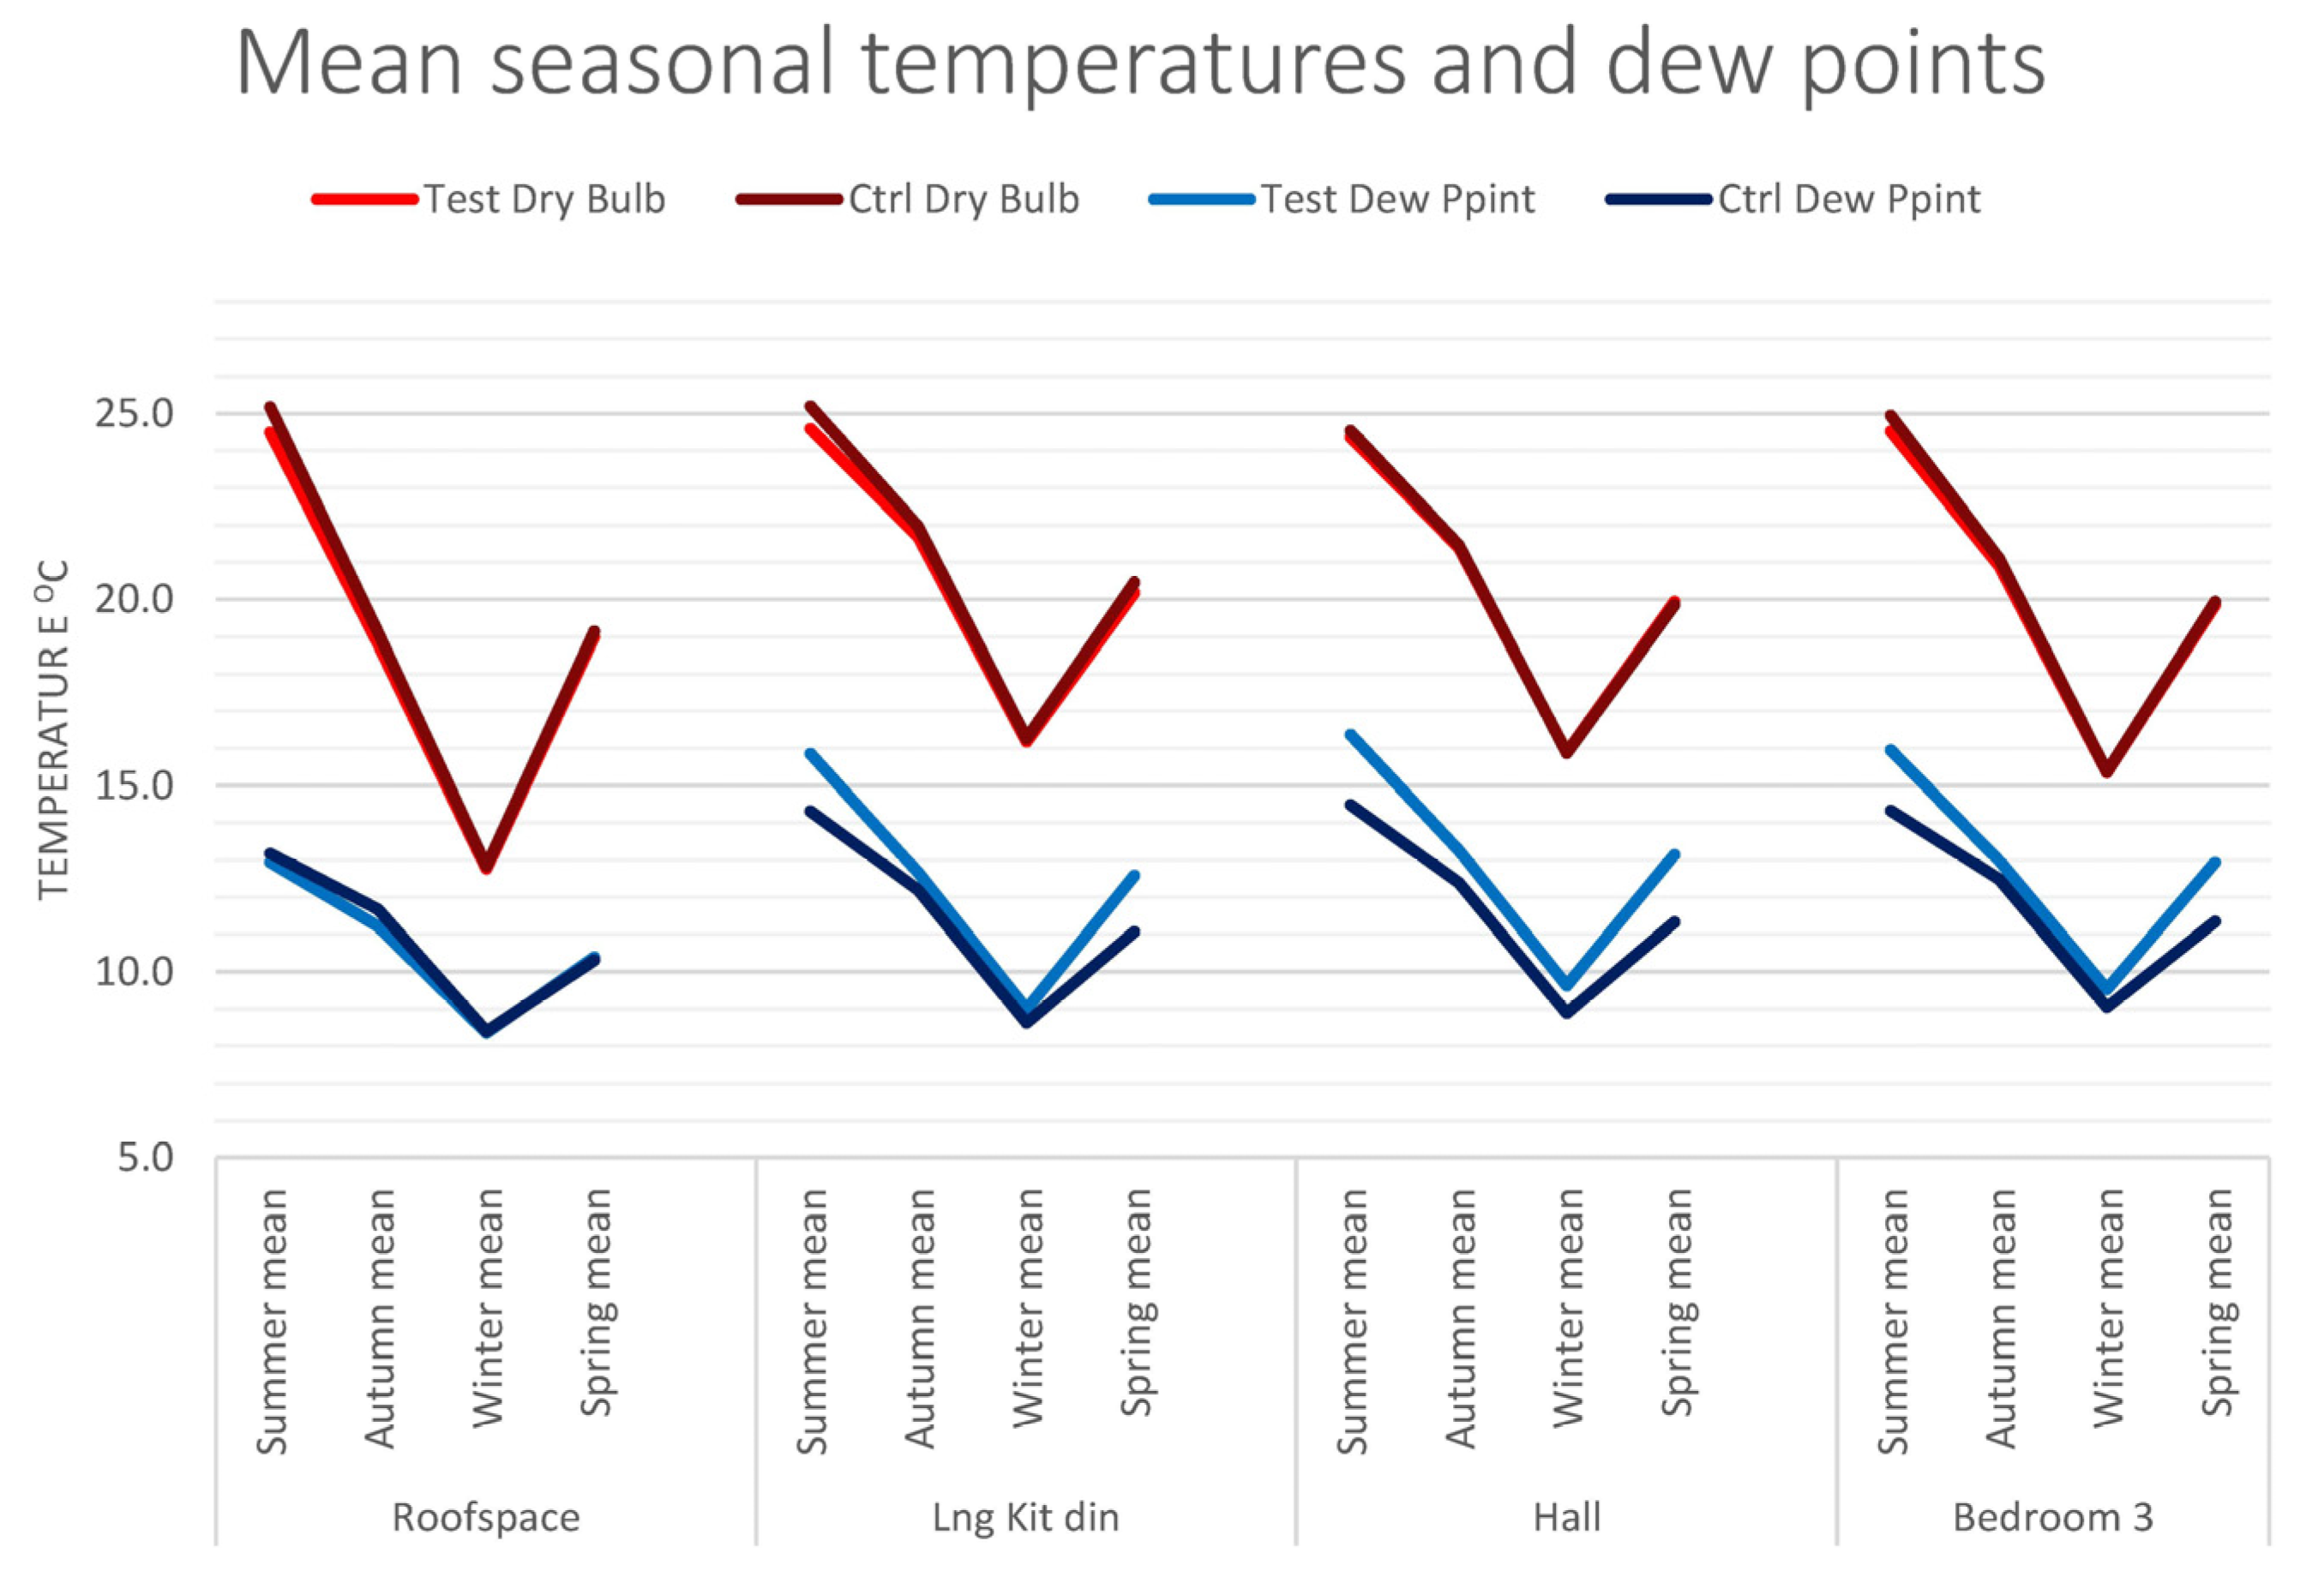


| Season | Space | Dry Bulb | Dew Point |
|---|---|---|---|
| - | - | p | p |
| Summer | LoungKitDin | 0 | 0 |
| Roofspace | 0 | 0 | |
| Autumn | LoungKitDin | 0 | 0 |
| Roofspace | 0 | 0 | |
| Winter | LoungKitDin | 0 | 0 |
| Roofspace | 0.1007 | 0.3745 | |
| Spring | LoungKitDin | 0 | 0 |
| Roofspace | 0 | 0.0263 |
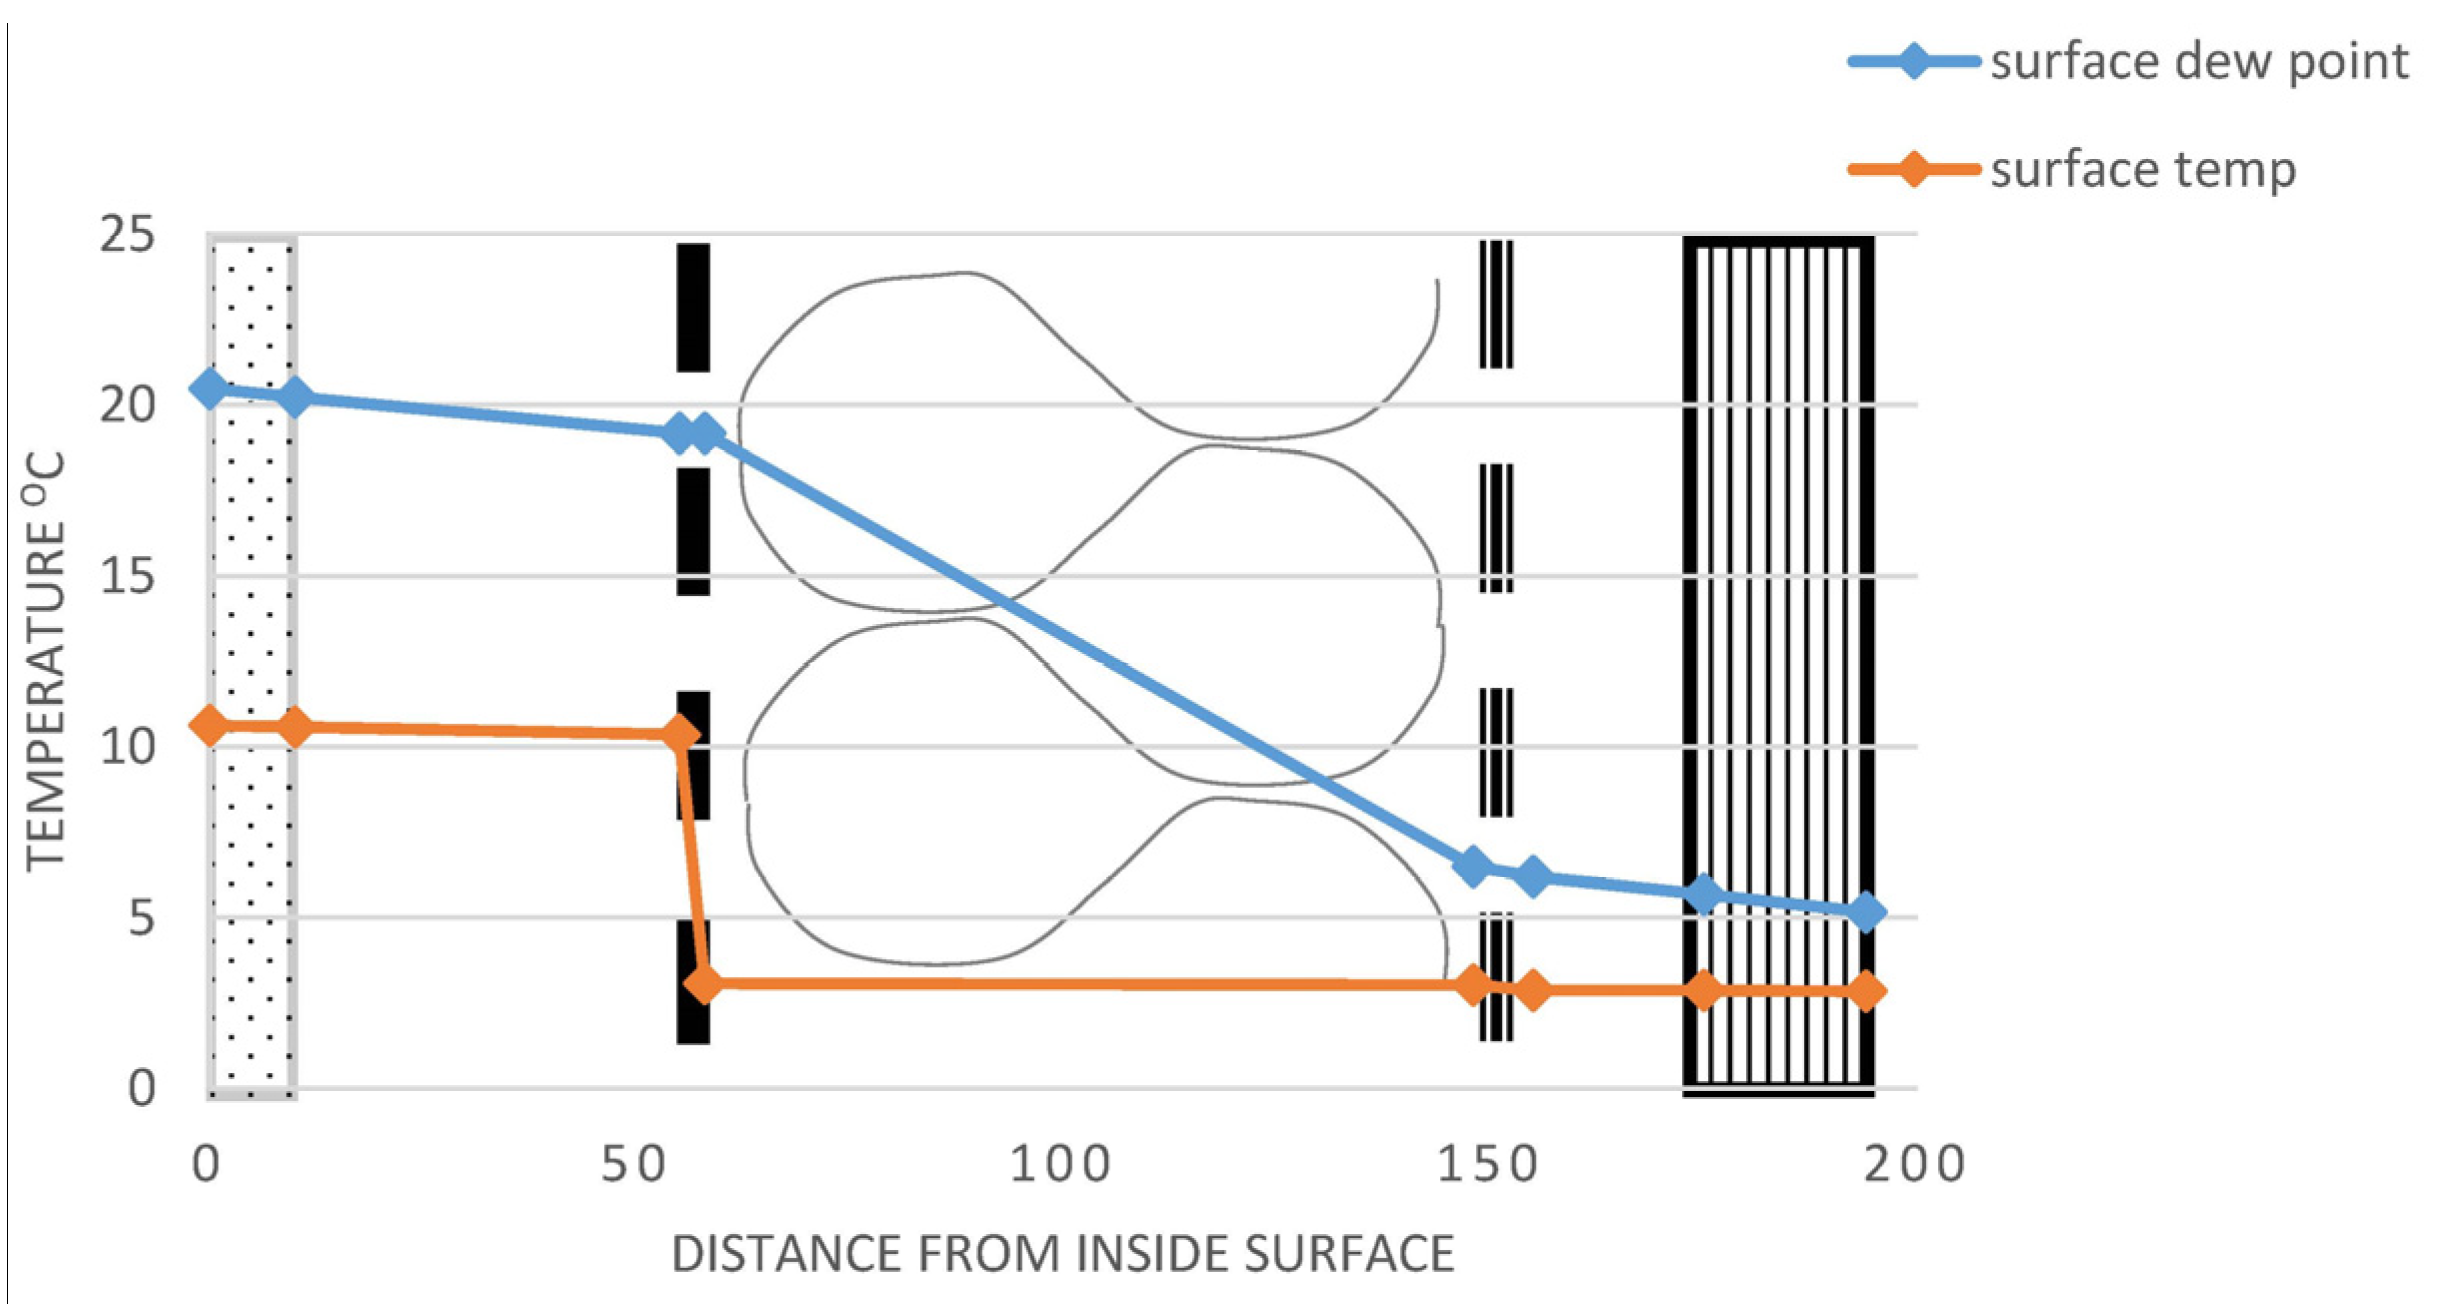
3.2. Detailed Results of Selected Days
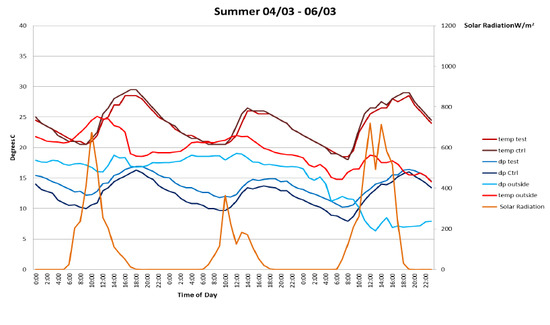
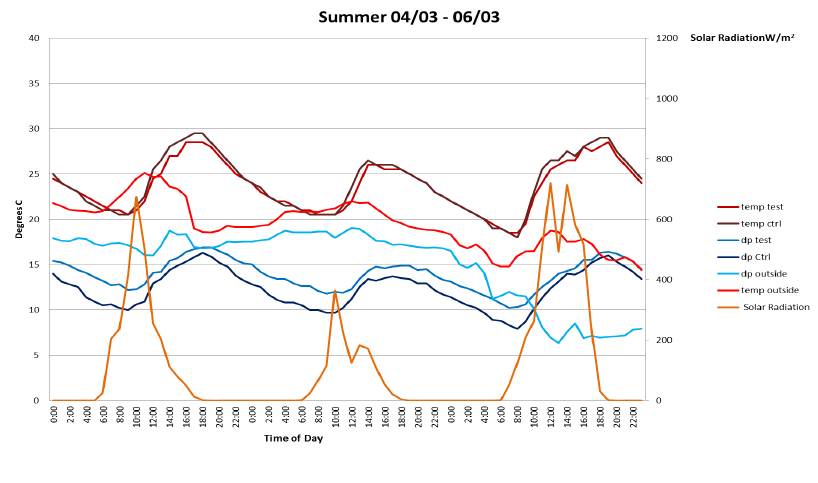
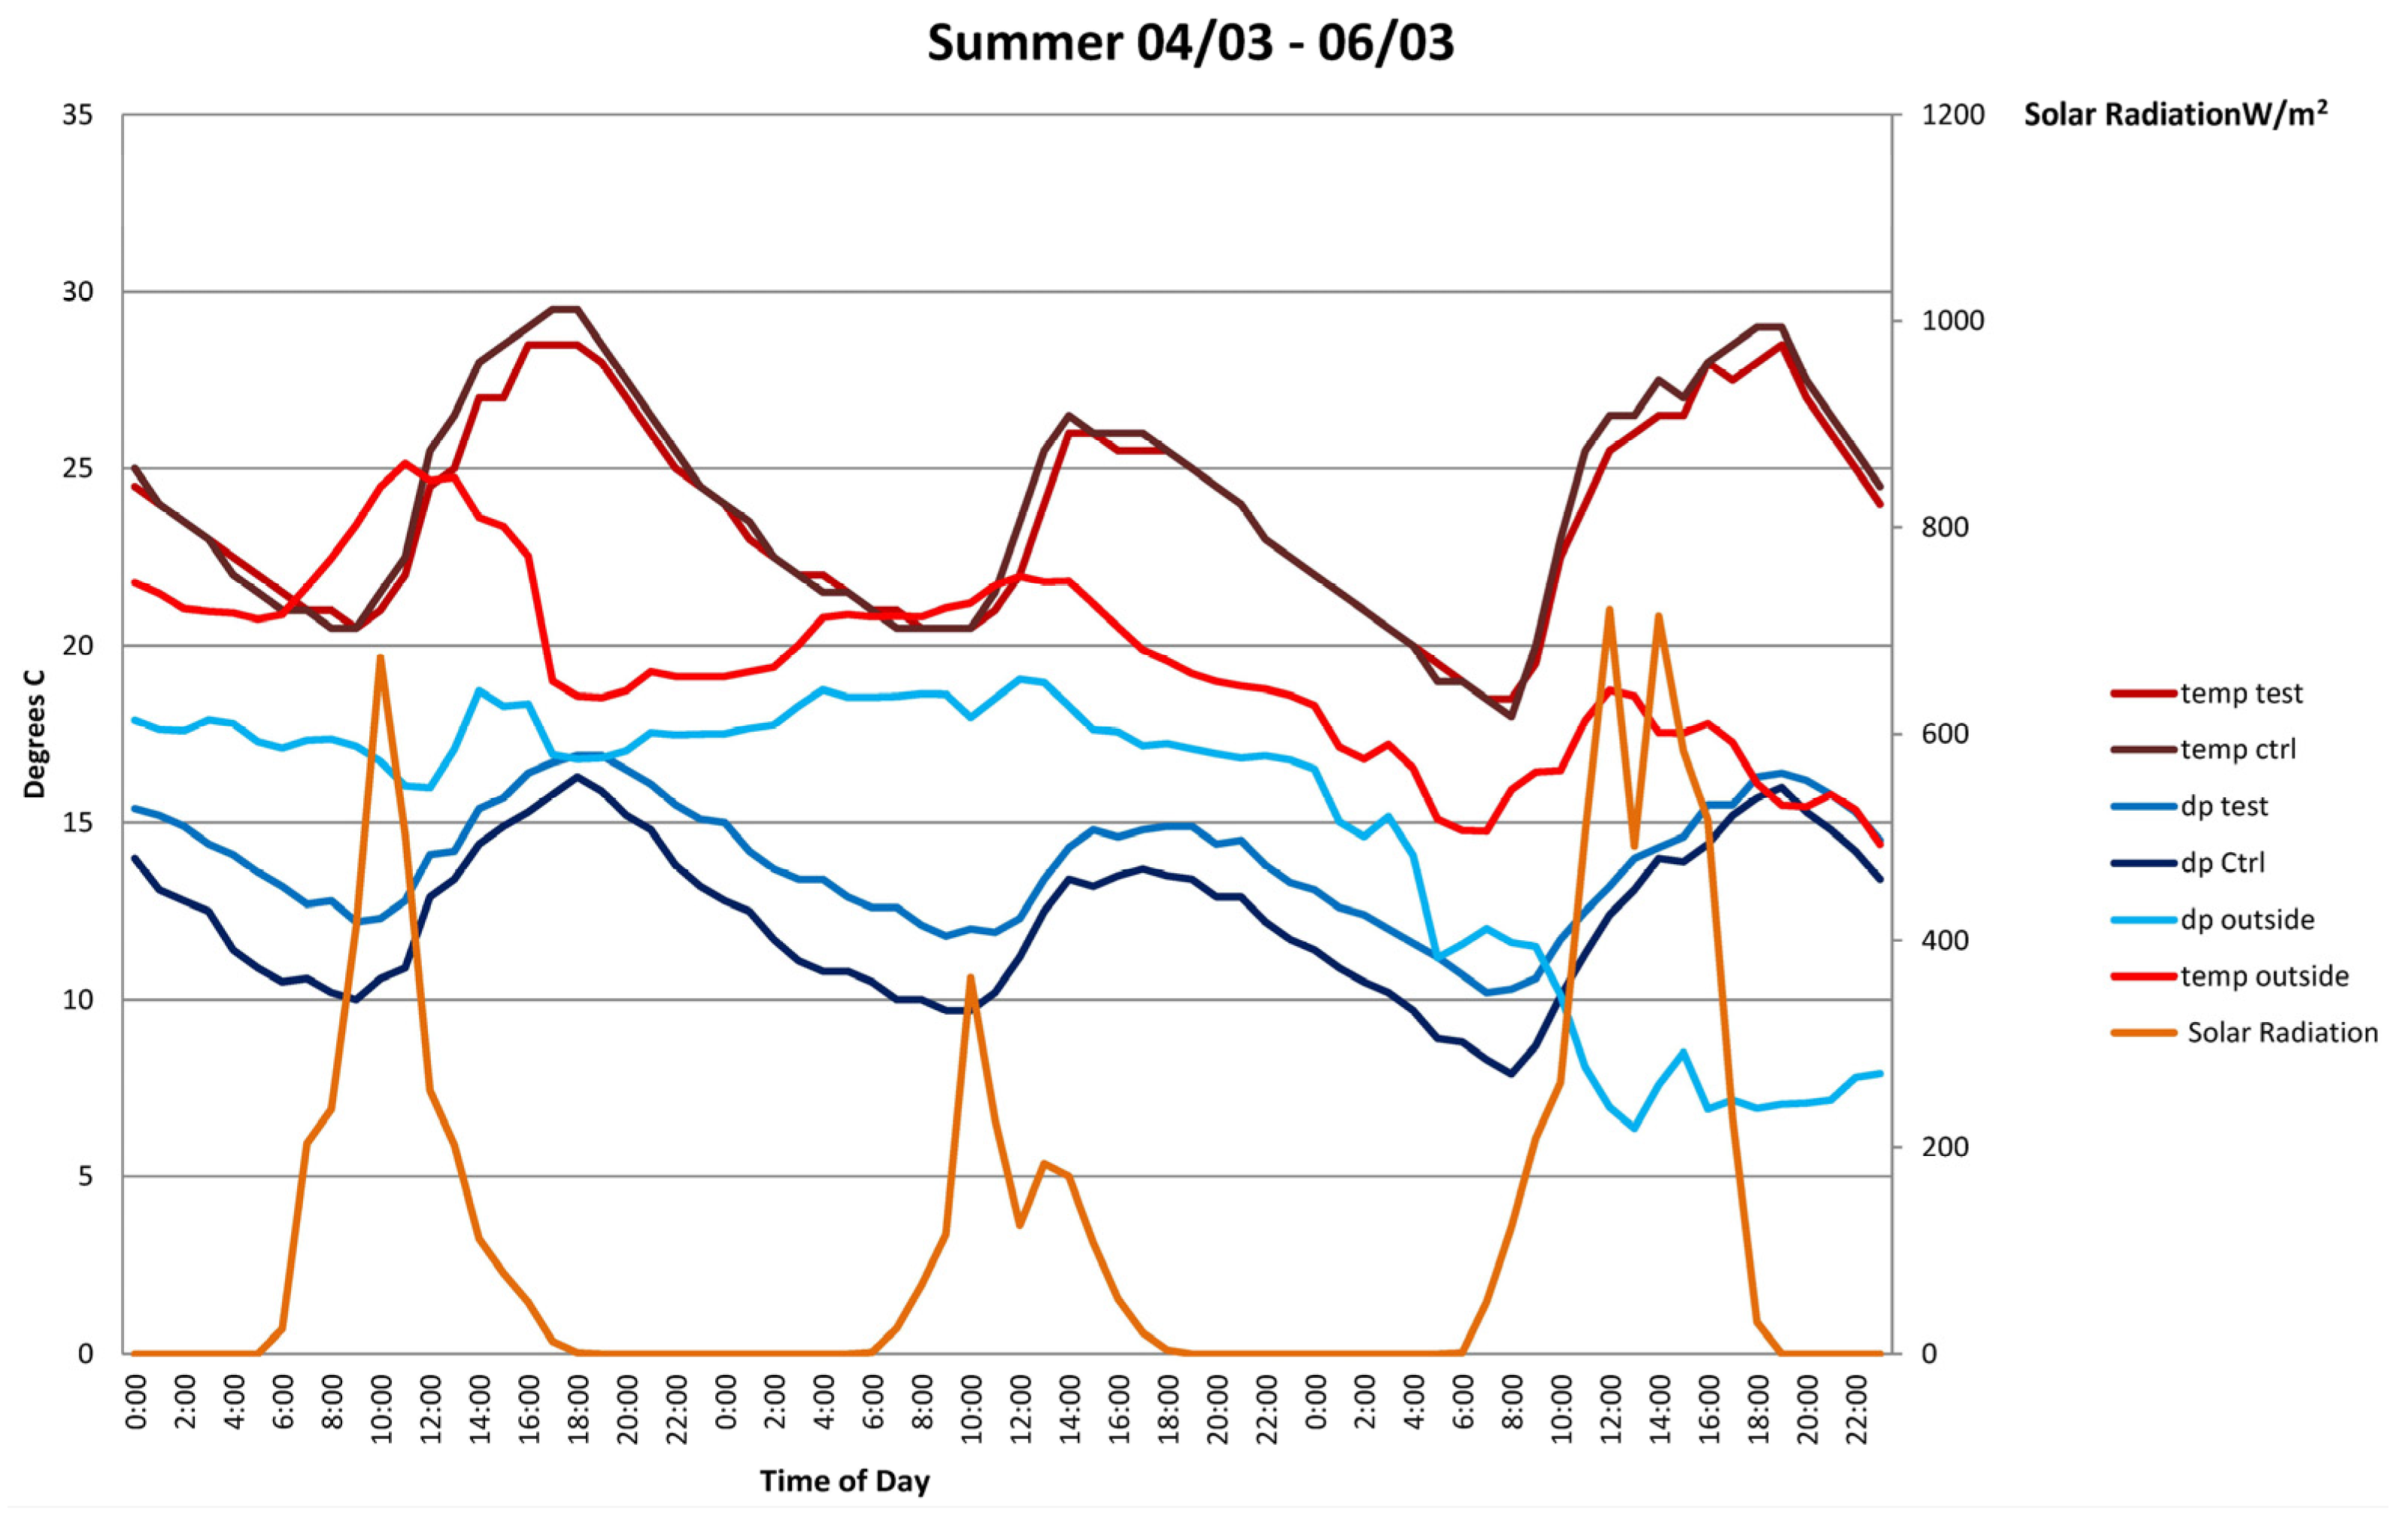
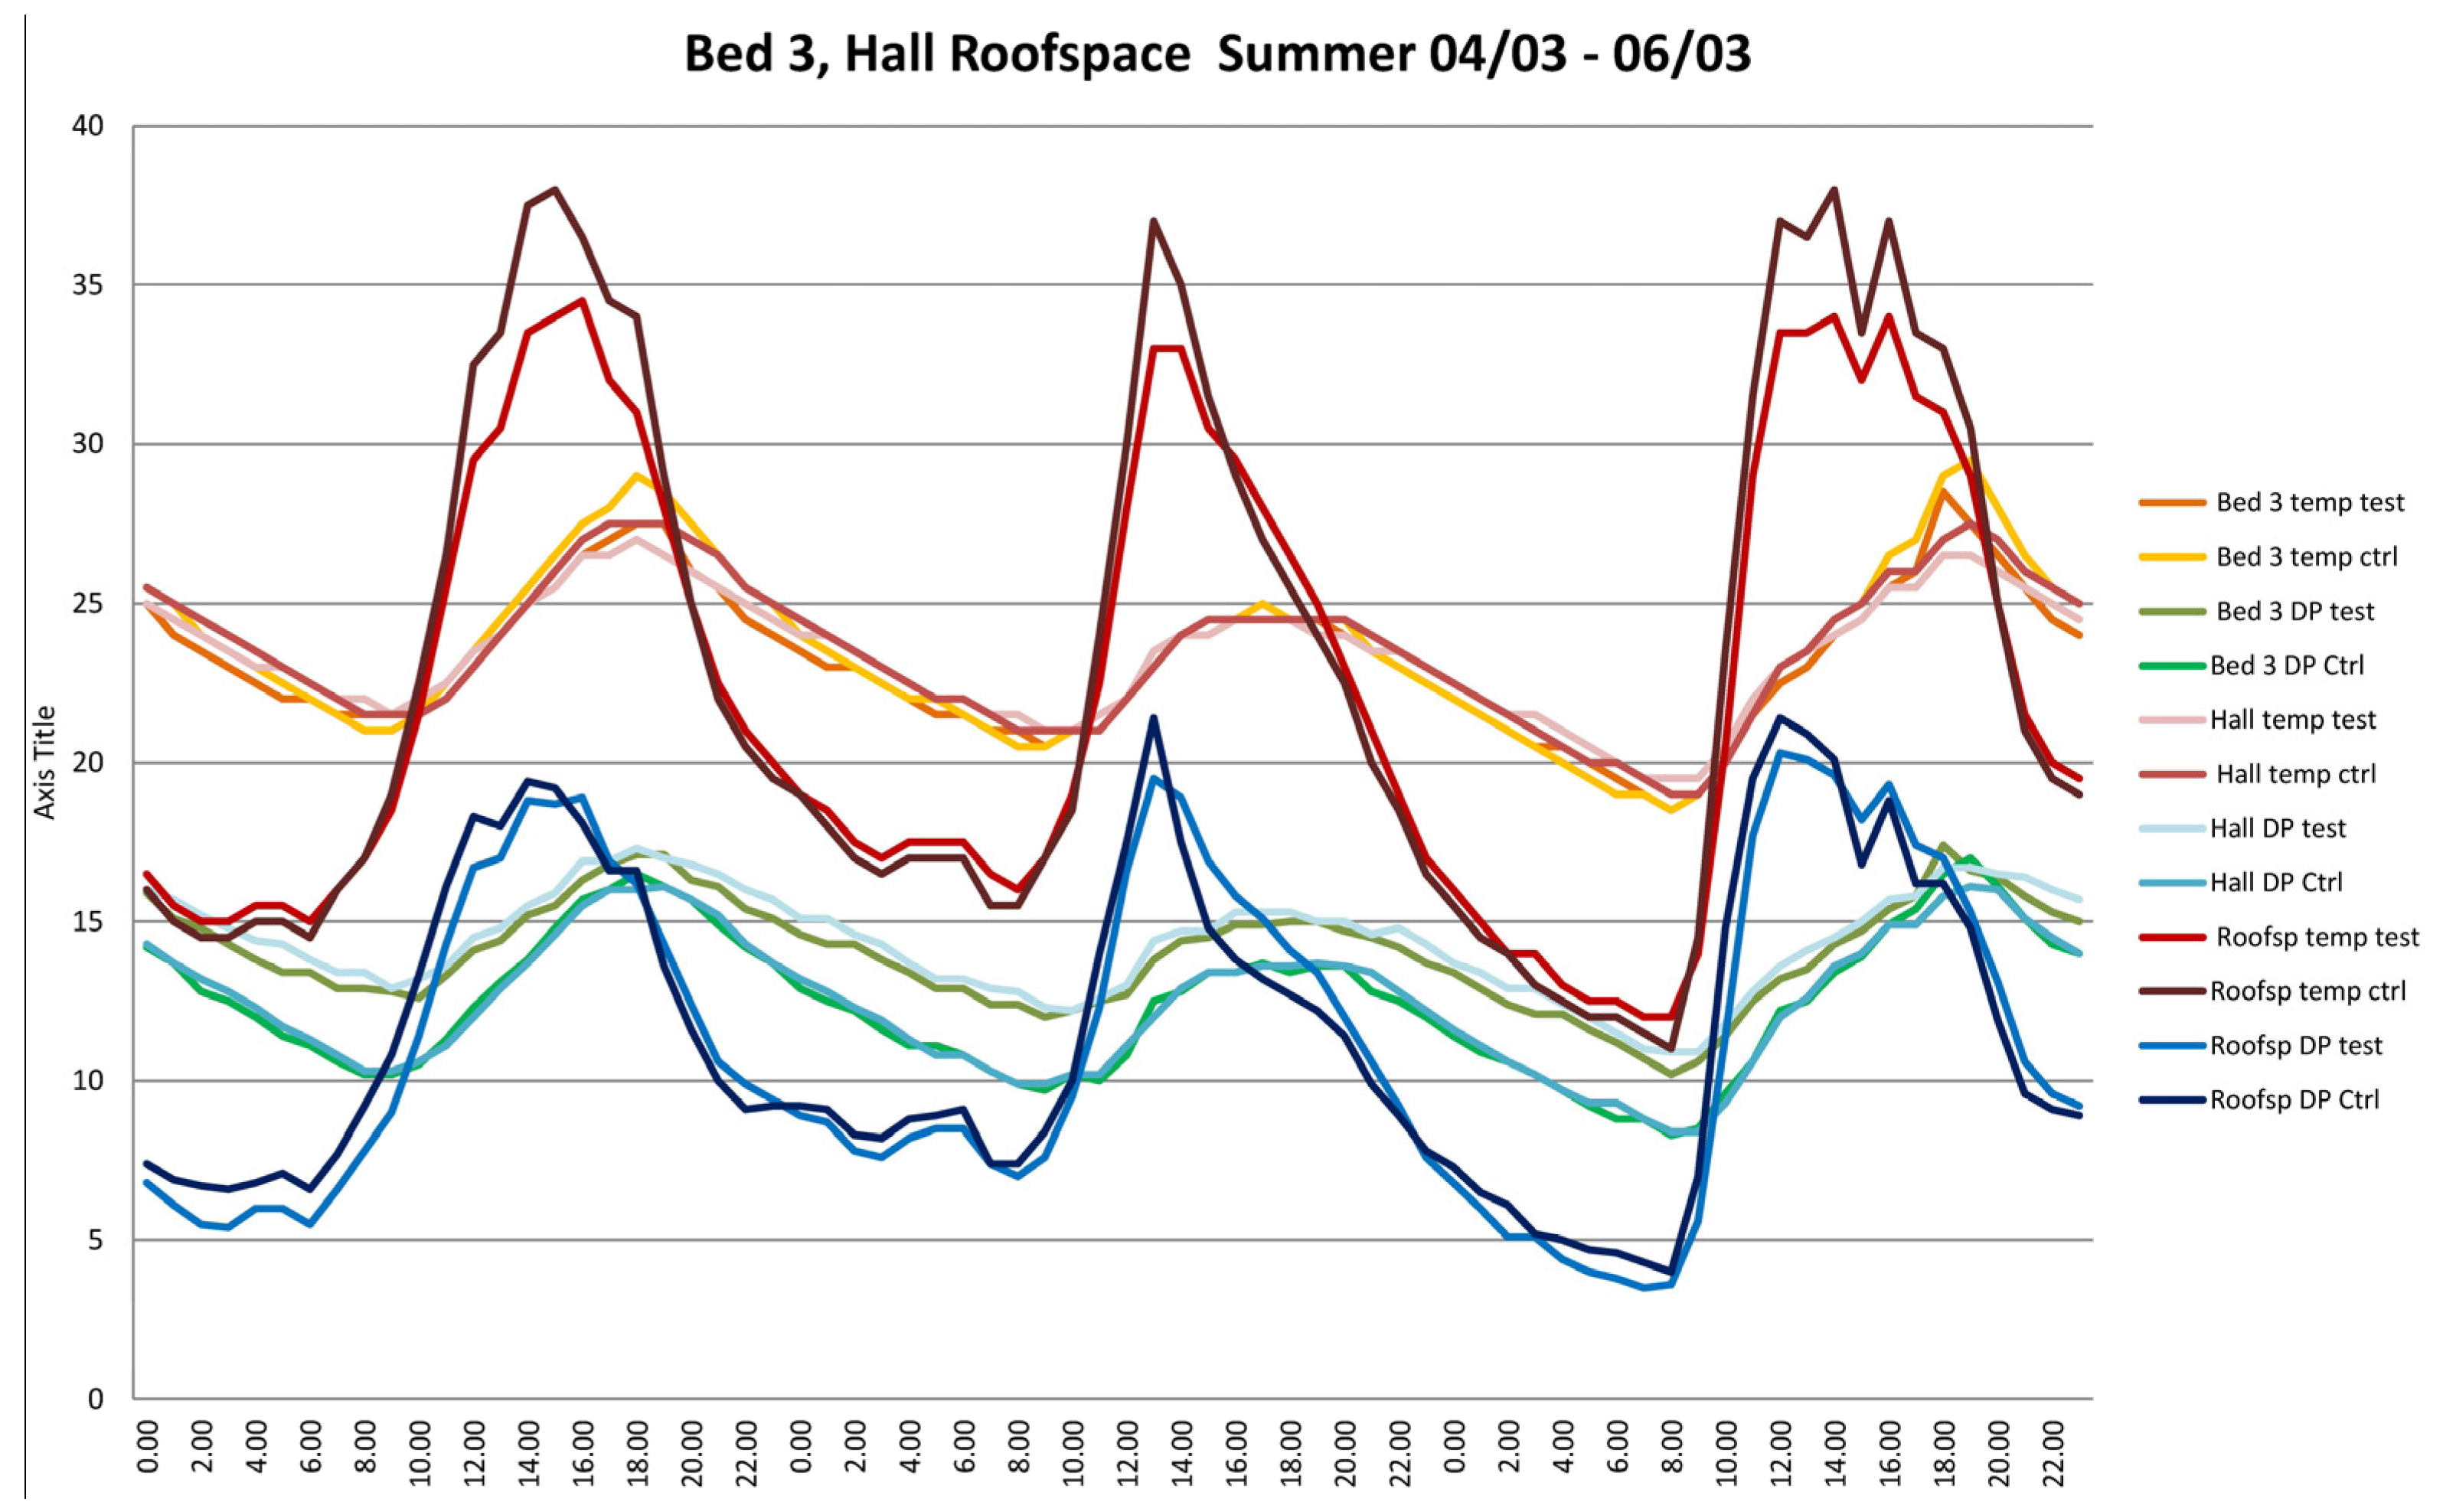
3.2.1. Summer

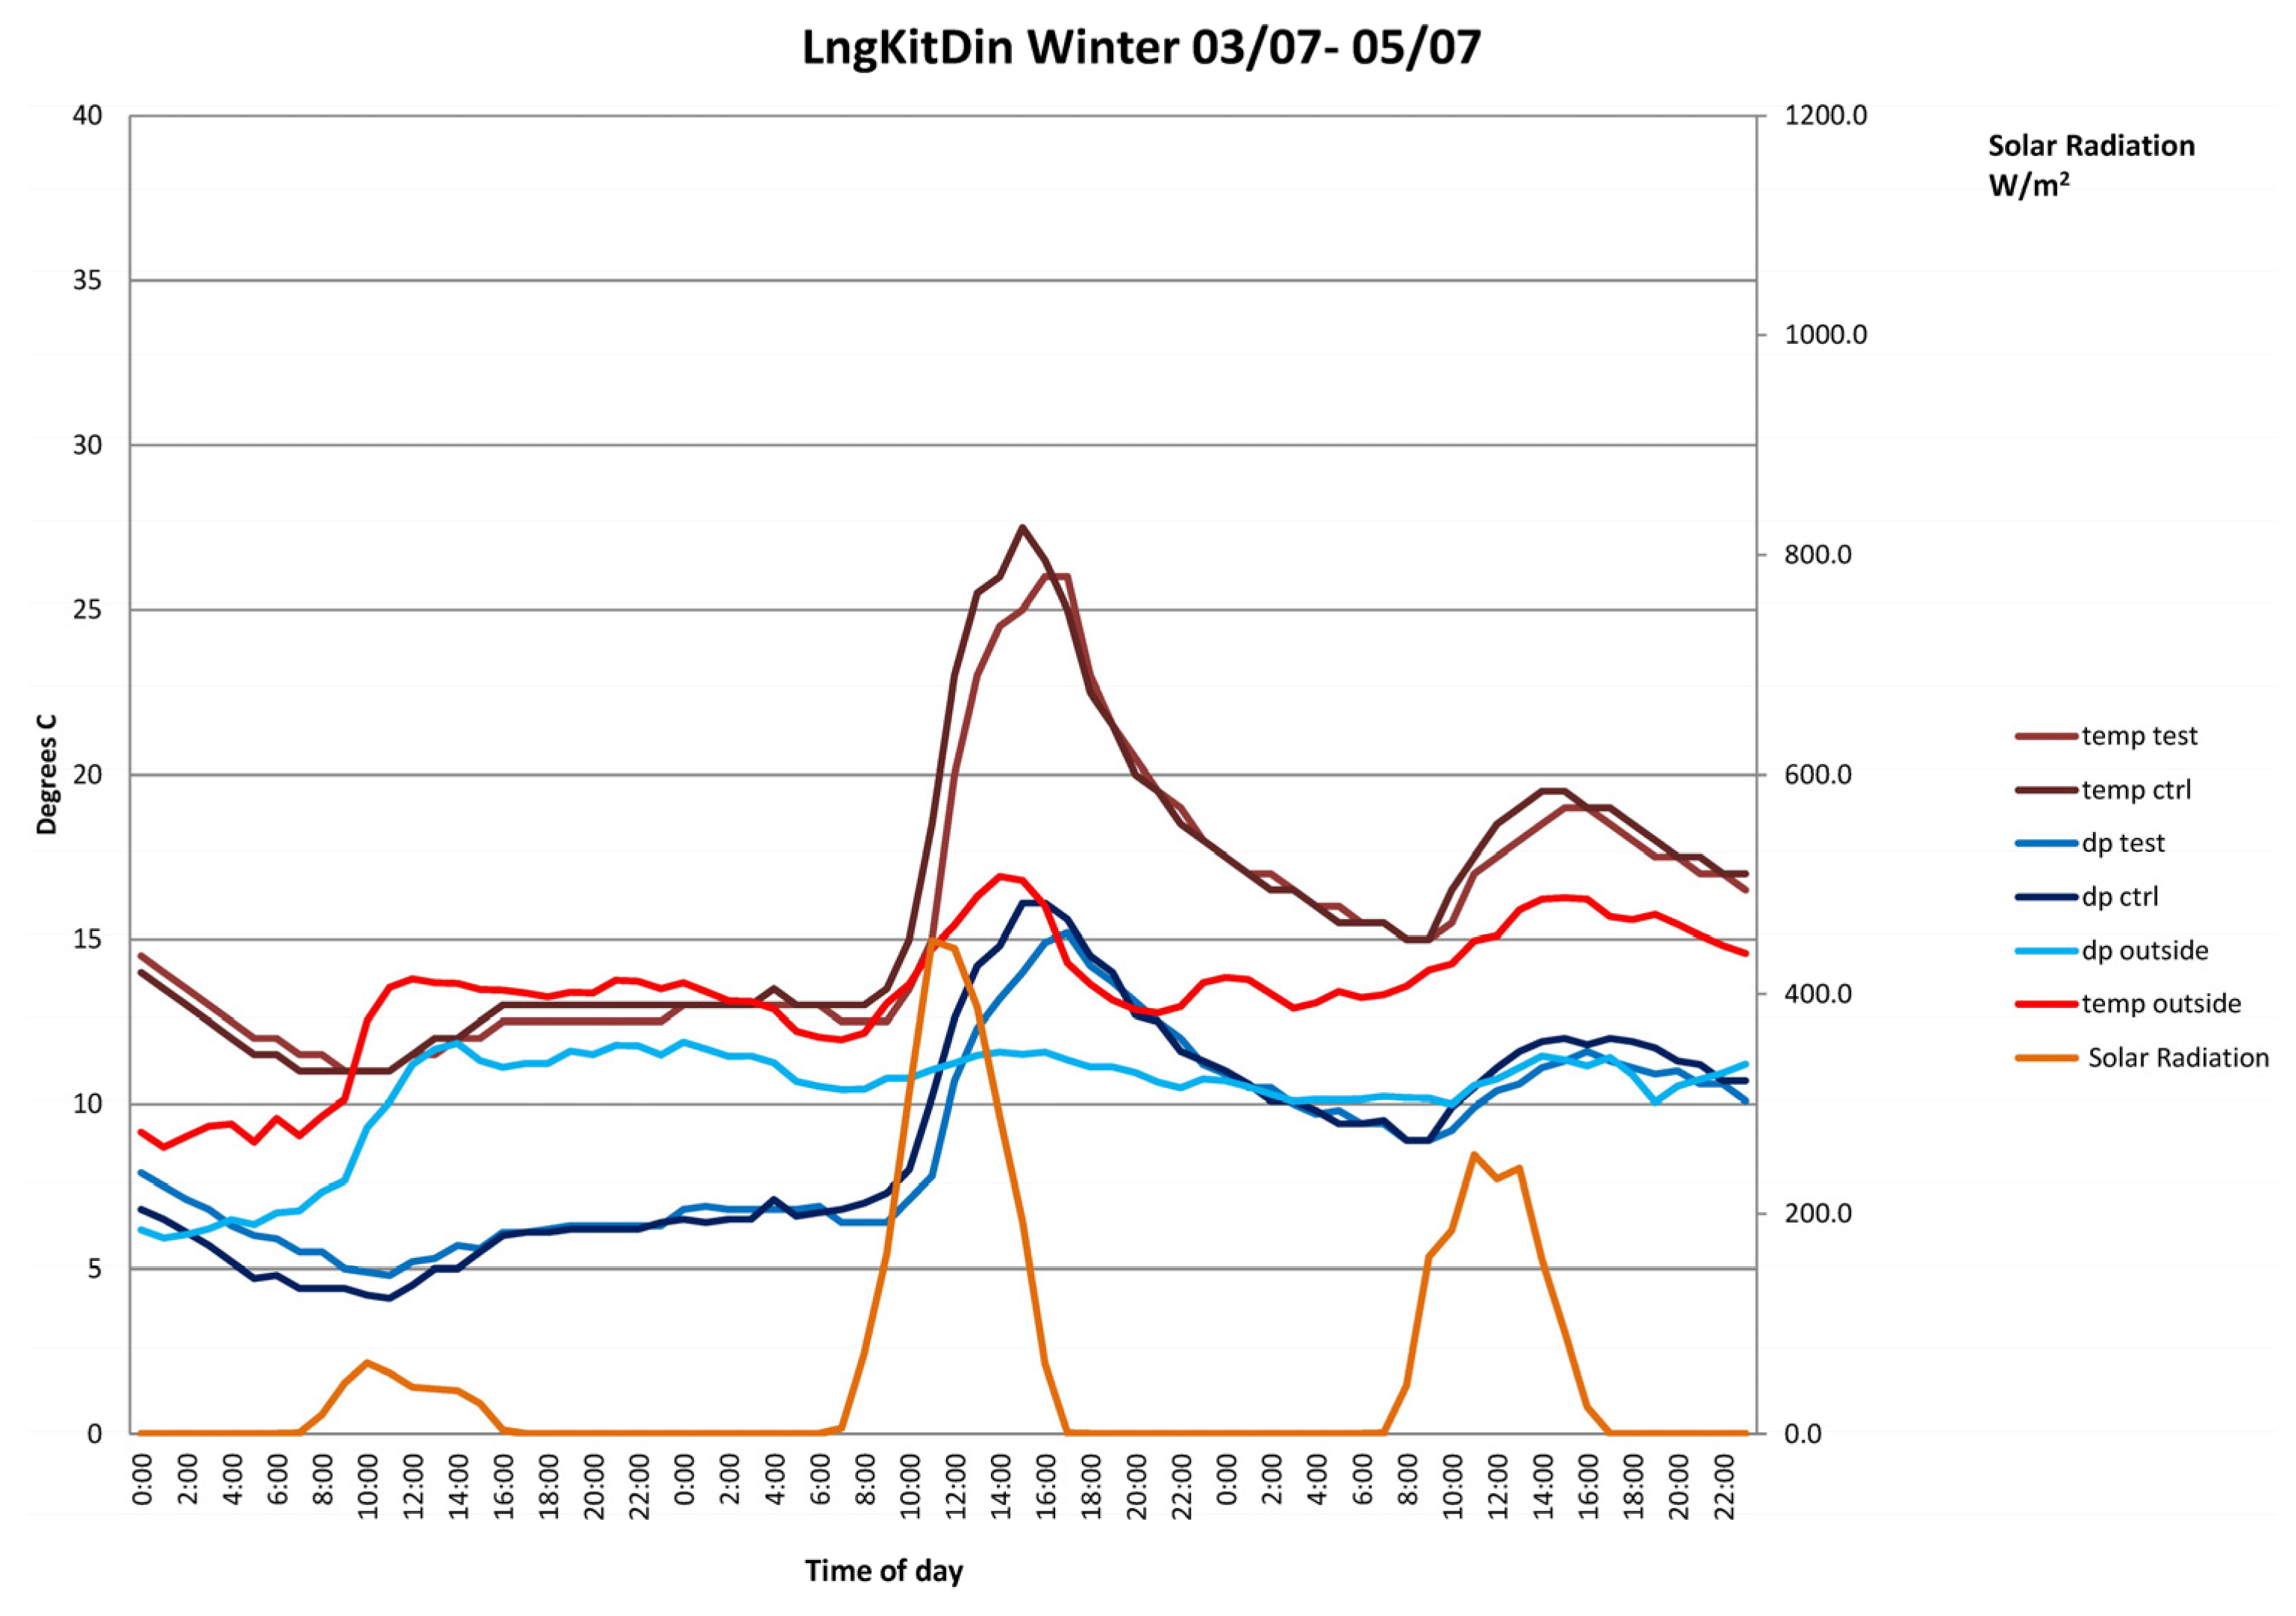
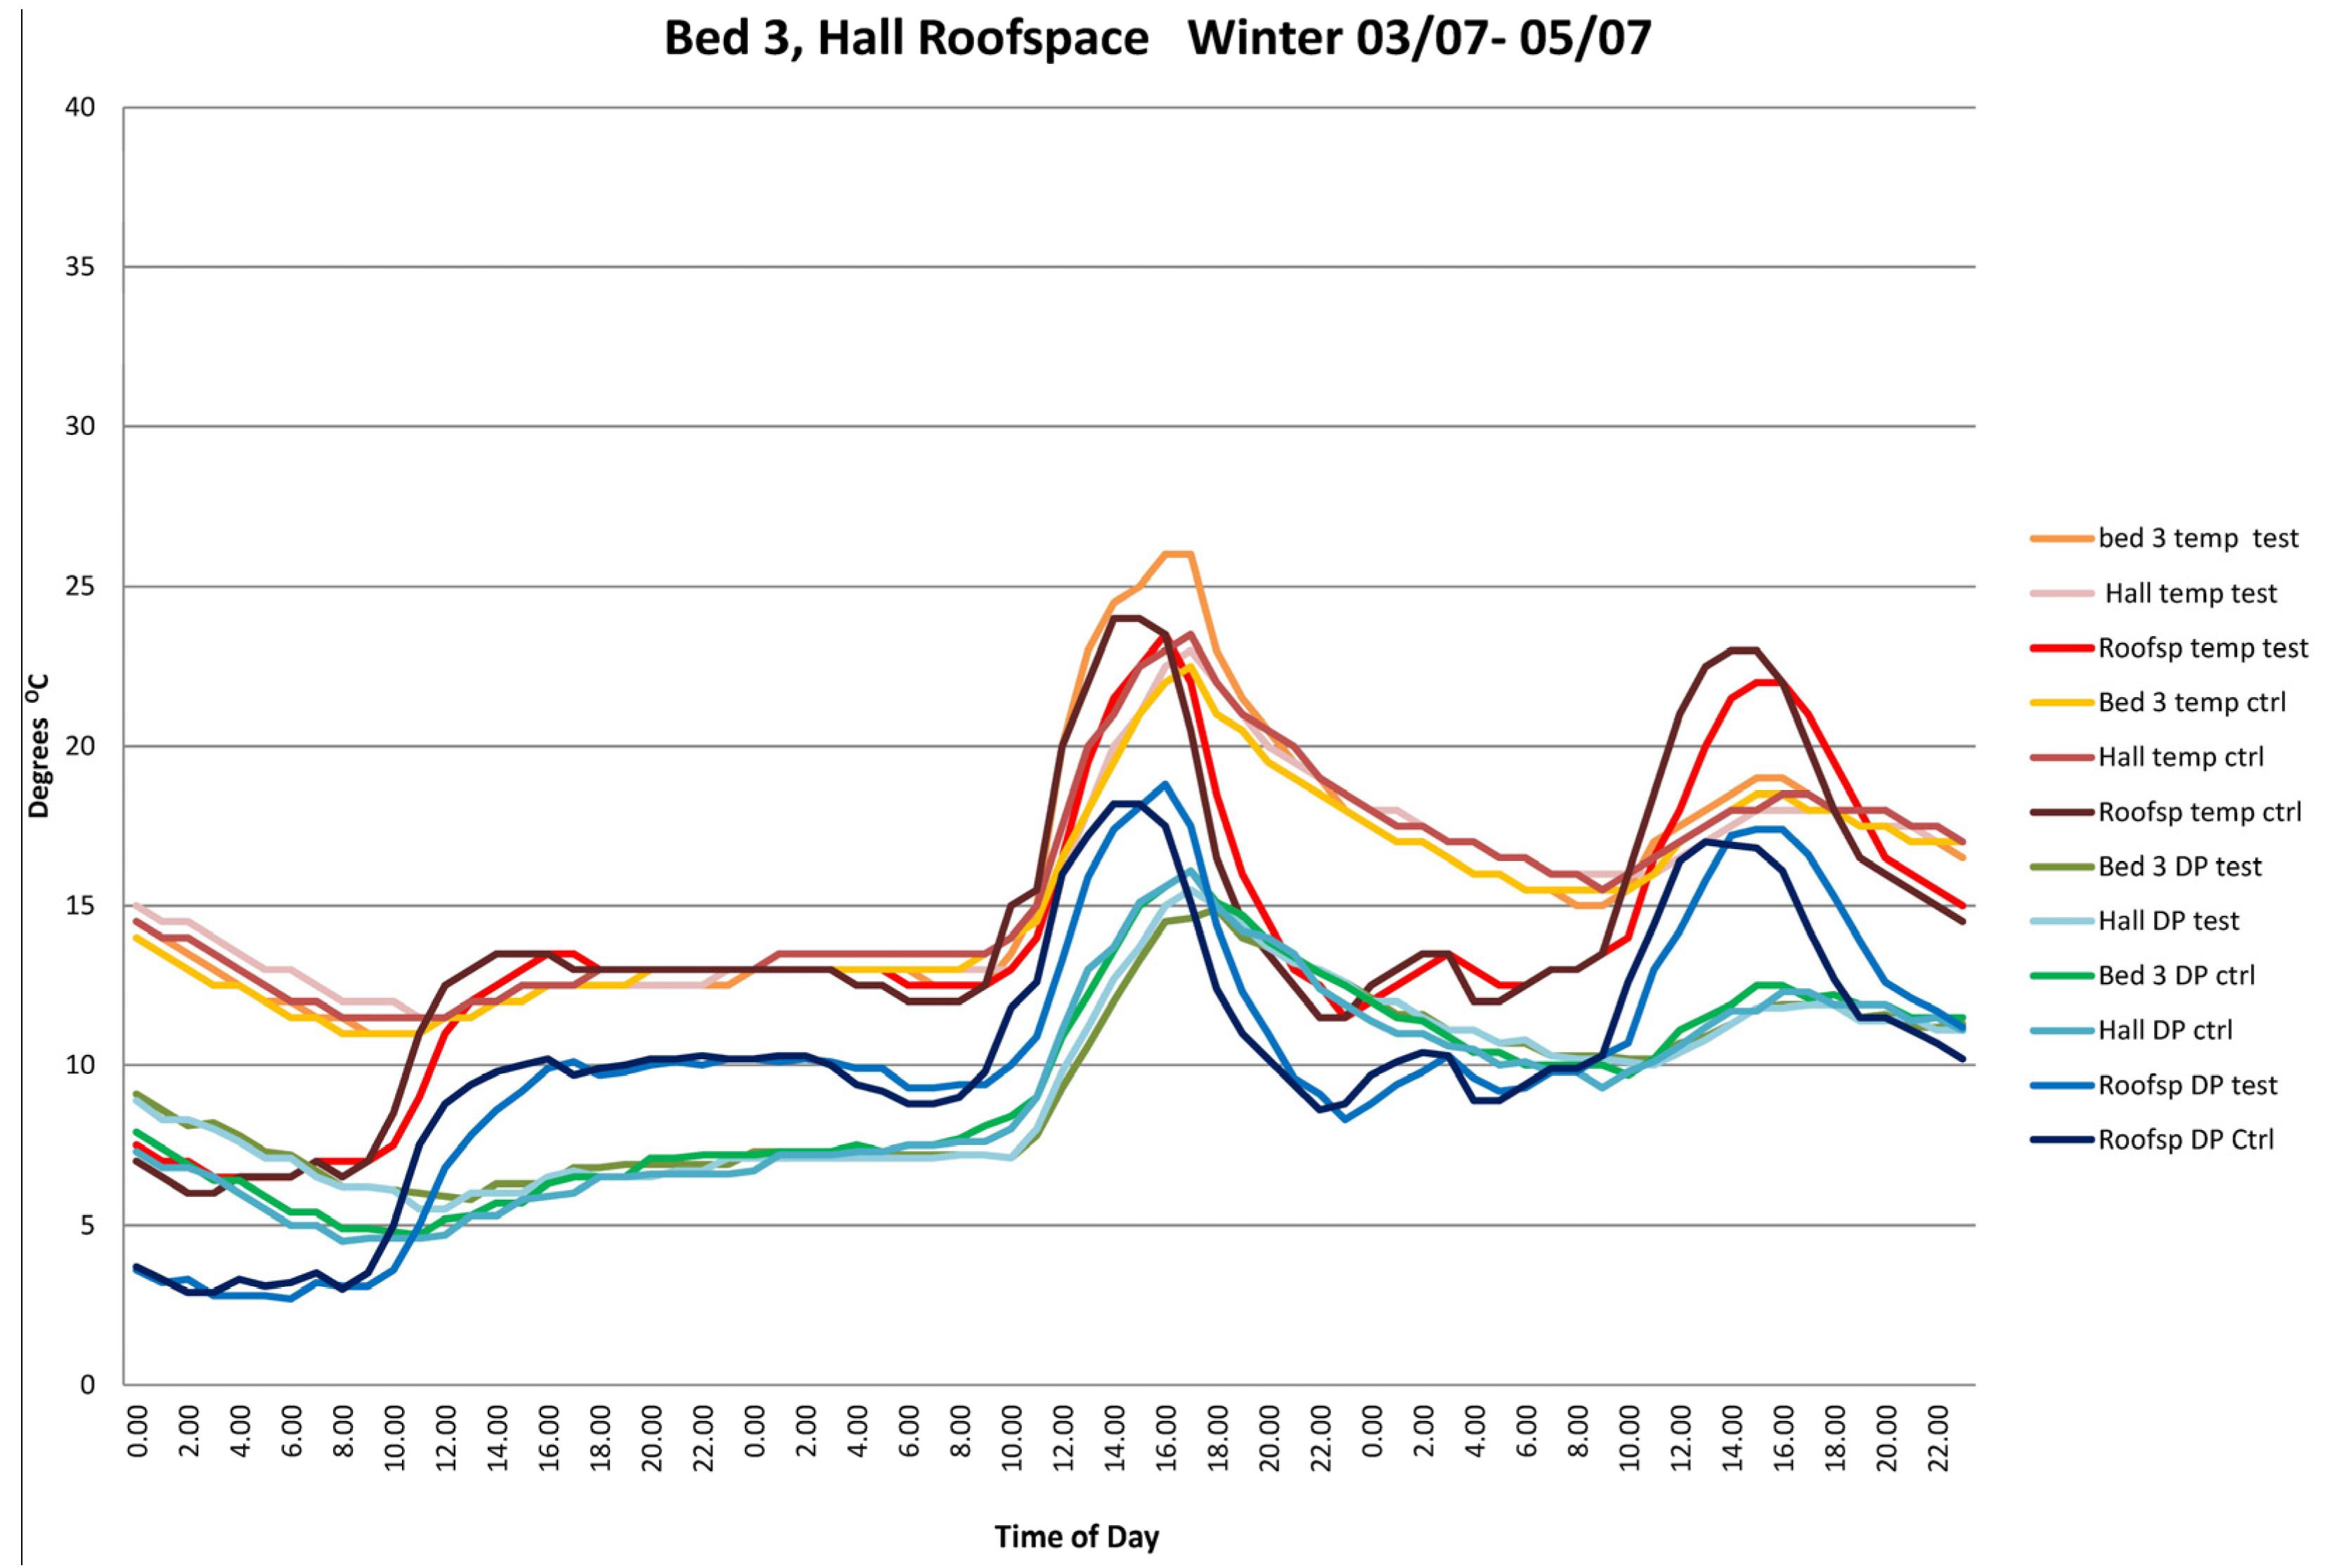
3.2.2. Winter
| Summer 1st Dec | |||
|---|---|---|---|
| Dry Bulb (°C) | Dew Point (°C) | Density (kg/m3) | Moisture Content (kg/kg) |
| Max 25.5 | 15.4 | 1.163 | 0.0109 |
| Min 15.5 | 8.6 | 1.211 | 0.0069 |
| Difference | 6.8 | - | 0.004 |
| Mean density (kg/m3) | - | 1.187 | - |
| Space volume (m3) | 108.54 | - | - |
| Space mass (kg) | 128.809 | - | - |
| Moisture mass (kg) | 0.52 | - | - |
| Moisture volume (L) | 0.52 | - | - |
4. Conclusions
Acknowledgments
Author Contributions
Conflicts of Interest
References
- Mackintosh, L. NIWA Overview of New Zealand Climate. 2001. Available online: https://www.niwa.co.nz/education-and-training/schools/resources/climate/overview (accessed on 11 June 2014).
- BizEE Degree Days. Weather Data for Energy Professionals. Available online: http://www.degreedays.net/# (accessed on 22 December 2014).
- De Groot, H. Indoor Air Quality and Health. An Analysis of the Indoor Air Quality and Health in New Zealand’s Homes. 2009. Available online: http://www.archigraphic.de/_originals/pdfs/indoor_air_quality_and_health.pdf (accessed on 11 June 2014).
- Howden-Chapman, P.; Saville-Smith, K.; Crane, J.; Wilson, N. Risk factors for mould in housing: A national survey. Indoor Air 2005, 15, 469–476. [Google Scholar] [CrossRef] [PubMed]
- Howden-Chapman, P.; Crane, J.; Chapman, R.; Fougere, G. Improving health and energy efficiency through community-based housing interventions. Int. J. Public Health 2011, 56, 583–588. [Google Scholar] [CrossRef] [PubMed]
- New Zealand Business Council for Sustainable Development (NZBCSD). Media Release: $20 Billion Cost of Fixing Country’s Homes Less than 4% of Their Value. 2008. Available online: http://www.scoop.co.nz/stories/BU0812/S00020.htm (accessed on 11 June 2014).
- World Health Organisation. Guidelines for Indoor Air Quality: Dampness and Mould. 2009. Available online: http://site.ebrary.com/lib/unitech/Doc?id=10367463&ppg=55 (accessed on 11 June 2014).
- Sargent, S. Getting Clear on Vapour Barriers and Underlays. 2007. Build 99. Available online: http://www.buildmagazine.org.nz/articles/show/getting-clear-on-vapour-barriers-and-underlays/ (accessed on 4 February 2015).
- Howden-Chapman, P.; Matheson, A.; Crane, J.; Viggers, H.; Cunningham, M.; Blakely, T.; Cunningham, C.; Woodward, A.; Saville-Smith, K.; O’Dea, D.; et al. Effects of insulating existing houses on health inequality: Cluster randomised study in the community. Br. Med. J. 2007, 334, 460. [Google Scholar] [CrossRef]
- Easton, L.; Saville Smith, K. Homesmart Renovations—Testing Tools to Promote Sustainable Renovation. In Proceedings of the New Zealand Sustainable Building Conference, Wellington, New Zealand, 26–28 May 2010.
- Callau, M. Upgrading Housing in NZ for Thermal Efficiency. In Proceedings of the New Zealand Sustainable Building Conference, Wellington, New Zealand, 26–28 May 2010.
- Burgess, J.C.; Buckett, N.R.; Camilleri, M.J.T.; Burrough, L.J.; Pollard, A.R. Papakowhai Retrofit Project—Improving the Thermal Envelope and Space Heating. In Proceedings of the New Zealand Sustainable Building Conference, Wellington, New Zealand, 26–28 May 2010.
- Su, B. Prevention of inter mould growth in housing. Archit. Sci. Rev. 2006, 49, 385–390. [Google Scholar]
- Su, B. Indoor moisture control of Auckland houses with different ventilation systems. Int. J. Civ. Archit. Sci. Eng. 2013, 7, 411–415. [Google Scholar]
- Leardini, P.M.; van Raamsdonk, T. Design for Airtightness and Moisture Control in New Zealand Housing. In Proceedings of the New Zealand Sustainable Building Conference, Wellington, New Zealand, 26–28 May 2010.
- WUFI Pro, 2D, Plus Software 2013. Fraunhofer-Institute fur Bauphysik (IBP): Holzkirchen. Available online: http://www.wufi.de/index_e.html (accessed on 21 January 2015).
- De Groot, H.; Leardini, P.M. Indoor Air Quality and Health in New Zealand’s Traditional Homes. In Proceedings of the 44th Annual Conference of the Architectural Science Association, Unitec Institute of Technology, Auckland, New Zealand, 24–26 November 2010.
- Love, J. Mapping the Impact of Changes in Occupant Heating Behaviour on Space Heating Energy Use as a Result of UK Domestic Retrofit. Retrofit Conference, University of Salford, UK; 2012. Available online: http://www.salford.ac.uk/__data/assets/pdf_file/0005/142385/023-Love.pdf (accessed on 21 January 2015).
- Clevenger, C.M.; Haymaker, J. The Impact of Building Occupation on Energy Modelling Simulations. Joint International Conference on Computing and Decision Making in Civil and Building Engineering, Montreal, Canada; 2006. Available online: http://web.stanford.edu/group/peec/cgi-bin/docs/people/profiles/The%20Impact%20of%20the%20Building%20Occupant%20On%20Energy%20Modeling%20Simulations.pdf (accessed on 21 January 2015).
- Department of Building and Housing Compliance document for New Zealand Building Code Clause H1 Energy Efficiency—Third Edition. Available online: http://www.dbh.govt.nz/UserFiles/File/Publications/Building/Compliance-documents/H1-energy-efficiency-3rd-edition-amendment-2.pdf (accessed on 21 January 2015).
- Specification for Preservative Treatment Part 3: Plywood; SNZ 2012 AS/NZ 1604.3; Standards New Zealand: Wellington, New Zealand, 2012.
- Plywood—Structural Part 0: Specifications; SNZ, 2012b, AS/NZS 2269.0:2012; Standards New Zealand: Wellington, New Zealand, 2012.
- Moll, L.; van Raamsdonk, T. A New Zealand Based Study on Airtightness and Moisture Management; ProClima, NZ Ltd: Wellington, New Zealand, 2009. [Google Scholar]
- Barley, D.; Deru, M.; Pless, S.; Orcellini, P. Procedure for Measuring and Reporting Commercial Building Energy Performance; Technical Report NREL/TP-550–38601; National Renewable Energy Laboratory, Battelle: Golden, CO, USA, 2005. [Google Scholar]
- LASCAR Certificate of Calibration. Available online: http://www.lascarelectronics.com/pdf-usb-datalogging/data-logger0237687001331303304.pdf (accessed on 21 January 2015).
- Thermal Performance of Buildings—Determination of Air Permeability of Buildings—Fan Pressurization Method; European Committee for Standardization CEN/TC 89 2000. EN 13829:2000; British Standards Institution: London, UK, 2001.
- Stoecklein, A.; Bassett, M. ALF3—A Design Tool for Energy Efficient Houses; Building Research Association of New Zealand: Judgeford, New Zealand, 1999. [Google Scholar]
- Passive House Institute Passive House Requirements. Available online: http://www.passiv.de/en/02_informations/02_passive-house-requirements/02_passive-house-requirements.htm (accessed on 11 June 2014).
- TenWolde, A.; Pilon, C. The Effect of Indoor Humidity on Water Vapor Release in Homes. Available online: http://web.ornl.gov/sci/buildings/2012/2007%20B10%20papers/071_TenWolde.pdf (accessed on 11 June 2014).
- Mitamura, T.; Rode, C.; Schultz, J. Full-Scale Testing of Indoor Humidity and Moisture Buffering in Building Materials. In Proceedings of the Indoor Air Quality 2001, Moisture, Microbes, and Health Effects: Indoor Air Quality and Moisture in Buildings; ASHRAE: Atlanta, GA, USA, 2001. [Google Scholar]
© 2015 by the authors; licensee MDPI, Basel, Switzerland. This article is an open access article distributed under the terms and conditions of the Creative Commons Attribution license (http://creativecommons.org/licenses/by/4.0/).
Share and Cite
Birchmore, R.; Pivac, A.; Tait, R. Impacts of an Innovative Residential Construction Method on Internal Conditions. Buildings 2015, 5, 179-195. https://doi.org/10.3390/buildings5010179
Birchmore R, Pivac A, Tait R. Impacts of an Innovative Residential Construction Method on Internal Conditions. Buildings. 2015; 5(1):179-195. https://doi.org/10.3390/buildings5010179
Chicago/Turabian StyleBirchmore, Roger, Andy Pivac, and Robert Tait. 2015. "Impacts of an Innovative Residential Construction Method on Internal Conditions" Buildings 5, no. 1: 179-195. https://doi.org/10.3390/buildings5010179