The construction industry has become increasingly concerned about understanding the whole life impact of buildings as different stakeholders in the industry are shifting their focus towards declaration of the greenhouse gas (GHG) emissions and carbon footprints of buildings [
30]. A widely used procedure for better understanding and reducing environmental impacts of buildings is life cycle assessment (LCA), a framework defined by the International Organization for Standardization (ISO) 14,040 [
31] and 14,044 [
32] standards. While Scheuer
et al. [
33] assert the importance of LCA of whole buildings to identify and evaluate how key design parameters will influence a building’s environmental performance, Li [
34] states that LCA and carbon footprinting approaches can not only quantify the building environmental burden but can also show reduction measures.
The whole life of a building may be presented in three distinct stages namely the initial impact, the operational impact, and end of life impact for the purpose of carbon footprinting. The initial impact occurs prior to handover of the building to the occupier, operational impact occurs during the life of the building and finally end of life impact occurs when the building is deconstructed at its end of life [
30]. The whole life building emissions are therefore the sum of the following emissions:
All these stages involve a set of different calculations and modelling. The first two stages could be estimated at the outset of the project whilst the total emissions could be calculated as the project progresses. Stage 3 could be modelled with energy performance simulation tools however the actual measured data needs several years of monitored data recordings. Stage 4 is currently speculative and it is hoped that the future research in deconstruction would help in reducing uncertainties and improving accuracy at the end of life of buildings [
35]. In the UK, the standard for life cycle carbon footprinting of products (with buildings seen as a particularly complicated type of product) is primarily based on ISO standards [
31,
32] and PAS 2050 [
36].
6.3.1. Materials
Materials impact occurs because of up-front energy investment for extraction of natural resources, manufacturing, transportation, and installation of materials during the construction phase of the project. For this process to be effective, data used for converting quantities of materials to CO
2 emissions must be appropriate to the specific products to be constructed in the building as they are identified from generic databases [
30]. As there is an increase of imported materials in recent times to the UK’s construction market [
37], it may prove difficult in some cases to accurately estimate the impacts of imported materials due to lack of credible data e.g., for transportation emissions and the impacts of up-front energy investment at the source.
Carbon footprinting of construction products in the UK can be drawn from two generic sources; Bath Inventory of Carbon and Energy (ICE) [
11] and Ecoinvent [
38] held within proprietary LCA software. Bath ICE [
11] is one of the most useful and frequently quoted references providing data for a range of generic construction materials in the UK. For more specific products for which the data is not included in the Inventory, one may need to consult manufacturers and suppliers with limited levels of comparability in calculations.
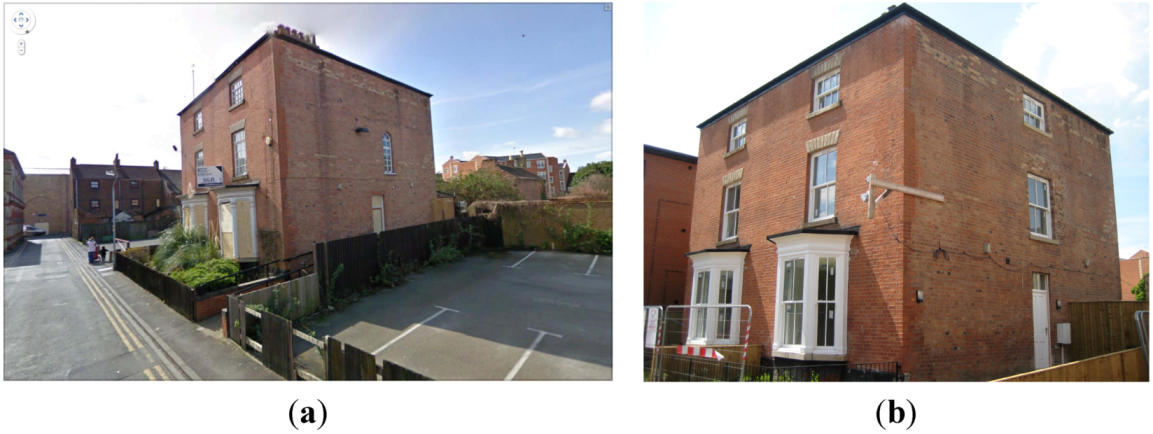
The embodied energy of materials for the refurbished housing development at Cross Street is calculated based on mass of materials used in refurbishment of the building using Bath ICE [
11]. Only the embodied emissions of the main materials used in the refurbishment of the Cross Street Building are considered. The effects of materials used for minor repairs, fixtures and fittings, sanitary services, electrical and mechanical services, sealants, and other minor elements are excluded.
Table 6 lists the breakdown of CO
2e emissions of building elements of the refurbished housing development at the Cross Street. The table shows the carbon cost of refurbishing the building. It does not include the embodied CO
2e of the original materials and elements that were retained in the refurbished building. The total materials emissions is 29317 kgCO
2e, resulting in a rate of 111.90 kgCO
2e per square meter of gross internal floor area. This figure is slightly higher than the average figure of 104 CO
2/m
2 for the three refurbished houses in a study conducted by the Empty Homes Agency (EHA) [
8]. The embodied energy figures are however much less than an average 475 kgCO
2/m
2 for conventionally constructed new build homes reported by the EHA [
8]. EHA [
8] and Yates [
39] report that new homes may use four to eight times more resources than an equivalent refurbishment. This is because a considerable amount of existing structure and building elements may be saved depending on the nature of the building and the extent of the refurbishment. The Empty Homes Agency [
8] finds that the potential saving in materials by reusing empty homes could result in an initial saving of 35 tonnes of carbon dioxide (CO
2) per property by removing the need for the energy locked into new build materials and construction.
Table 6.
Breakdown of CO2e emissions of building elements of the refurbished housing development at Cross Street (all three new housing units).
Table 6.
Breakdown of CO2e emissions of building elements of the refurbished housing development at Cross Street (all three new housing units).
| Building Elements | Initial kgCO2e | % of total initial impact | Replacement Cycle(year) | Whole life | % of total whole life impact |
|---|
| Ground Floor | 10,927.69 | 37.3 | Nil | 10,927.69 | 23.8 |
| Floors and ceilings | 7074.14 | 24.1 | Nil | 7074.14 | 15.4 |
| Roof slates | 177.78 | 0.6 | Nil | 177.78 | 0.4 |
| External walls | 4375.48 | 14.9 | Nil | 4375.48 | 9.5 |
| Party walls | 2094.08 | 7.1 | Nil | 2094.08 | 4.5 |
| Internal walls | 591.58 | 2 | Nil | 591.58 | 1.3 |
| Windows and External doors | 835.77 | 2.9 | 25 | 2507.31 | 5.4 |
| Internal doors | 72.73 | 0.3 | Nil | 72.73 | 0.2 |
| Internal finishes | 3000.02 | 10.2 | 10 | 18,000.12 | 39.1 |
| Staircases | 167.73 | 0.6 | Nil | 167.73 | 0.4 |
| Total material emissions | 29,317 | 100 | - | 45,988.64 | 100 |
| kgCO2e/m2 | 111.90 | - | - | 175.53 | - |
The life expectancy of the refurbished building at Cross Street is assumed to be of 60 years. This is a typical life expectancy used in LCA for domestic buildings. Replacement and decoration could considerably increase the materials burden of buildings during their useful life. As seen in
Table 6, replacement of internal finishes, in this case mainly carpets and other floor finishes which assumed to take place every 10 years will considerably increase the whole life impact of the development. The replacement cycle of 10 year is based on assumptions made regarding the frequency of tenancy change in rented social housing and the fact that the housing provider or tenants may change the carpets at each handover stage. This necessitates careful consideration of interior design of buildings so that through robust design the need for frequent replacement of materials and components may be minimised.
6.3.2. Project Management and Construction Process
The project management impact includes design stage emissions as before a project reaches the site a considerable amount of time and money, depending on the size and complexity of the project, may be expended in the design and planning of the project. The impacts may also be because of stakeholders’ office utilities overheads, meetings organized in different places and transport to site,
etc. The impact of construction process occurred on the site includes carbon emissions as a result of using fuels and utilities on site, transporting materials to site, removing waste from site, and emissions attributed to project management. In the UK, Building Research Establishment Environmental Assessment Method [
40] best practice advocates documenting all fuel data and engine types for incoming/outgoing deliveries and water and mains supply. Emissions from removing waste from site may be calculated from the detailed breakdown of the type of waste produced and quantities sent for recycling or reuse recorded by waste-handling contractors.
In addition to savings made in material impacts, further savings are expected to be made in refurbishment and conversion compared with new build due to reduced construction time and waste. This is an important benefit of refurbishment as e.g., in the UK there is an increasing emphasis currently paid towards reducing construction waste as waste from construction and demolition accounts for around one quarter of all waste entering landfill with just 4% of the 70 million tones of building waste produced annually being recycled [
41]. Due to the substantial impacts which may result from construction waste, the UK government in its Strategy for Sustainable Construction states that 25% of all materials used in construction need to be purchased through approved responsible sourcing schemes by 2012 [
42].
The contractor of the Cross Street Building was not required to record emissions impact of the construction process. In absence of such data, it is assumed that the impact of the construction process and project management to be of the order of 5% of the embodied impact of materials used in the refurbishment of the building [
43]. Similarly, a figure of 5% waste for the materials used is assumed for the Cross Street Building [
43].
6.3.3. In-Use Energy
Operational energy of a building is the energy required to heat, cool, lit and to provide electrical services during its life span. Operational life of a building becomes an important factor considering the fact that a significant impact of building may occur during the useful life of the building. Operational energy of building varies considerably by the influence of parameters such as building envelope, building use patterns, building management and maintenance, climate and season, and the efficiency of the building and its systems [
44]. Results reported in the literature indicate that the operational energy is still the largest component (approximately 85–95%) of the life-cycle energy consumption in the housing sector [
45,
46,
47].
The operational energy demands of the three housing units after the refurbishment at Cross Street are calculated using Standard Assessment Procedure SAP [
12]. Standard Assessment Procedure which utilises standardised regional climatic data is adopted by the UK government as part of the national methodology for demonstrating compliance with building regulations and for providing energy ratings for dwellings.
Table 7 shows the annual energy breakdown requirements and the associated CO
2e emissions for the individual housing units together with those for the whole development. The space heating and hot water are provided by gas condensing boilers. Conversion factors for gas and electricity suggested by Defra [
13] are used for converting energy use (kWh) to carbon emissions (CO
2e).
Table 7.
Breakdown of annual in use energy and the associated CO2e emissions.
Table 7.
Breakdown of annual in use energy and the associated CO2e emissions.
| Energy Requirements | Housing Units | kWh | kgCO2e /kWh | Kg CO2e | kWh/m2 | kgCO2e /m2 | Relative kWh % | Relative CO2e % |
|---|
| Space Heating | Flat 7 | 2834 | 0.18523 | 524.9 | 76.6 | 14.2 | 47.3 | 30.3 |
| Flat 9 | 4660 | 0.18523 | 863.2 | 49.6 | 9.2 | 48.6 | 31 |
| House 11 | 7947 | 0.18523 | 1472 | 60.7 | 11.2 | 60.1 | 41.5 |
| Hot water heating | Flat 7 | 1432 | 0.18523 | 265.3 | 38 | 7.2 | 23.9 | 15.3 |
| Flat 9 | 2115 | 0.18523 | 391.8 | 22.5 | 4.2 | 22.1 | 14.1 |
| House 11 | 2252 | 0.18523 | 417.1 | 17.2 | 3.2 | 17 | 11.8 |
| Electricity | Flat 7 | 1728 | 0.54522 | 942.1 | 46.7 | 25.5 | 28.8 | 54.4 |
| Flat 9 | 2813 | 0.54522 | 1533.7 | 29.9 | 16.3 | 29.3 | 54.9 |
| House 11 | 3032 | 0.54522 | 1653.2 | 23.1 | 12.6 | 22.9 | 46.7 |
| Total | Flat 7 | 5994 | - | 1732.3 | 162 | 46.8 | 100 | 100 |
| Flat 9 | 9588 | - | 2788.7 | 102 | 29.7 | 100 | 100 |
| House 11 | 13231 | - | 3542.3 | 101 | 27 | 100 | 100 |
| Whole Refurbished building (Flat 7+Flat 9+House 11) | Space heating | 15441 | 0.18523 | 2860.1 | 59 | 10.9 | 53.6 | 35.5 |
| Hot water Heating | 5799 | 0.18523 | 1074.2 | 22.1 | 4.1 | 20.1 | 13.3 |
| Electricity | 7573 | 0.54522 | 4129 | 28.9 | 15.8 | 26.3 | 51.2 |
| Total | 28813 | - | 8063.3 | 109.9 | 30.8 | 100 | 100 |
The annual space heating demands of housing units range from 49.6 to 76.6 kWh/m
2. Annual hot water demands range from 17.2 to 38 kWh/m
2. The total annual emissions of the housing units range from 1732.3 to 3542.3 kgCO
2e. The estimated emissions are smaller than the average UK home which is responsible for between five and six tones of Co
2 emissions every year [
8]. The total annual operational emissions for all three units are of the order of 8063.3 kgCO
2e.
Flat 7 with the smallest floor area has the highest hot water demand per square floor area. The energy use patterns, e.g., in terms of relative percentages, follow the trends reported in the literature. As buildings become more energy efficient in space heating with increased insulation levels and better air tightness, the relative contribution of hot water and household electricity to the total energy demand of the house will become more significant. This is especially the case for small dwellings, which usually have a greater energy use for water and electricity per unit of floor area [
48].
The energy efficiency measures adopted are to bring the energy efficiency of the refurbished building to the level of typical new build developments currently built by the Housing Association.
Table 8 compares the annual energy demands of the refurbished building with three other developments recently built by the Housing Association in the region. The operational energy demands of all developments are estimated using the Standard Assessment Procedure SAP [
12]. The average annual energy demand per square metre of floor area for Jubilee Way development is 15% smaller than that of the Cross Street. The average annual energy demand per square metre of floor area for the Cross Street is however smaller than the corresponding values for Nettleham Mews and Cherry Blossom by 33% and 21% respectively.
Table 8.
Comparison of the annual energy demands of different developments.
Table 8.
Comparison of the annual energy demands of different developments.
| Developments | No of dwellings in the development | Floor area range m2 | 1Annual Energy use range kWh/m2 | 2Average energy use kWh/m2 | Average energy use difference compared with Cross Street % |
|---|
| Cross Street | 3 | 37–131 | 101–162 | 109.97 | NA |
| Jubilee Way | 24 | 61–83 | 89–103 | 93.68 | 85 |
| Nettleham Mews | 19 | 59–92 | 129–165 | 146.14 | 133 |
| Cherry Blossom | 18 | 62–69 | 129–144 | 133.01 | 121 |
| Specifications | Cross Street Gainsborough
DN21 2AX | 3Dwelling types: 2 GFF, 1 SDH |
| Main heating: Gas Boiler and radiators |
| Main heating controls: time and temperature zone control |
| Secondary heating: none |
| Hot water: From main system |
| U-Values (W/m2K): Walls 0.29, Ground floor 0.20, Roof 0.16 |
| Windows: double glazing |
| Lighting: low energy lighting |
| Air tightness: not tested |
Jubilee Way Navenby Lincoln
LN5 0BF | 3Dwelling types: 3 GFF, 3 TFF, 10 SDH, 2 ETH, 2 MTH, 4 SDB |
| Main heating: Gas Boiler and radiators |
| Main Heating controls: programmer, room thermostat and TRVs |
| Secondary heating: none |
| Hot water: From main system, plus solar |
| U-Values (W/m2K): Walls 0.24, Ground floor 0.24, Roof 0.15 |
| Windows: double glazing |
| Lighting: low energy lighting |
| Air tightness: air permeability 5.9 m3/h.m2 (as tested) |
Nettleham Mews Lincoln
LN2 4GU | 3Dwelling types: 4 GFF, 4 MFF, 3 TFF, 4 ETH, 4 MTH |
| Main heating: Air source heat pump, radiators, electric |
| Main Heating controls: programmer, TRVs and bypass |
| Secondary heating: room heaters, electric |
| Hot water: From main system |
| U-Values (W/m2K): Walls 0.18, Ground floor 0.16, Roof 0.09 |
| Windows: double glazing |
| Lighting: low energy lighting |
| Air tightness: air permeability 3.9 m3/h.m2 (as tested) |
| Cherry Blossom, Cambridge Road, Grimsby DN34 5TR | 3Dwelling types: 6 GFF, 4 MFF, 8 TFF |
| Main heating: Air source heat pump, radiators, electric |
| Main Heating controls: time and temperature zone control |
| Secondary heating: room heaters, electric |
| Hot water: From main system(compliant) |
| U-Values (W/m2K): Walls 0.25, Ground floor 0.20, Roof 0.11 |
| Windows: double glazing |
| Lighting: low energy lighting |
| Air tightness: air permeability 3.6 m3/h.m2 (as tested) |
Similar conclusions regarding the potential of refurbishment in reducing the annual energy demands have been reported in the literature. For example, a study by the Empty Homes Agency [
8] shows that refurbished houses can be as efficient as new homes. Power [
18] discusses the environmental benefits of refurbishment arguing that existing homes can achieve as high environmental efficiency standards as current new build. Based on evidence reported by Sustainable Development Communities [
49] bringing the energy efficiency of existing buildings to the level of current new build through refurbishment should reduce their energy in use by 60% or more. A sensitivity analysis carried out for Peabody housing stock to identify the potential of refurbishment also suggests that an average emission reduction of 60% could be achieved for a range of stock type [
50]. The report suggests that the greatest percentage reduction up to 74% may be achieved for old buildings built before 1951 typically solid-walled bocks of flats [
50]. The study also reports that in the old refurbished housing stock the rate of emissions per resident per annum is around 600 KgCo
2. The estimated emission rates in the Cross Street refurbished units are 697 kgCO
2e and 708 kgCO
2e per resident per annum for Flat 9 and House 11 respectively. In Flat 7 in which there is only one resident the calculated emission rate is 1732 kgCO
2e per annum. The higher rate emission in Flat 7 is partly due to the higher rate of floor area per resident if compared with Flat 9 and House 11.
The whole life environmental impacts of buildings should be evaluated by considering distribution of the life cycle burdens of its all stages of LCA. It may take up 35–50 years for the new built to compensate for the initial savings achieved in refurbishment [
8]. In another study carried out in the United States it has been concluded that it may take 16 to 20 years for a new multifamily residential building that is 30 percent more efficient than an average-performing existing domestic building to overcome, through more efficient operations, the negative climate change impacts that were created during the construction process [
4].
6.3.4. End of Life Impact
In LCA the uncertainties involved in estimating the environmental impacts of buildings is the highest for the end of life stage of a building as this involves making assumptions for the distant future and the fact that buildings may be dealt with in different ways when they come to their useful end of life. At the end of the life of the building a decision will be made to either demolish the building or refurbish perhaps also with an alternative use. Refurbishment should be preferred where possible with a view to make the demolition and disposal ideally the last stage of a product life cycle as incineration or land filling is an environmental concern [
51]. In order to reduce the environmental burden of buildings at their end of service life, buildings must also be designed for disassembly to facilitate the reuse and recycling of materials and components.
The market conditions, which provide financial value to “scrap” materials and tax incentives, have also a significant role to play in the way in which materials are salvaged [
30]. Landfill tax in the UK has helped to reduce construction waste in recent years and is anticipated to do this further due to increased landfill cost in future. It is however unlikely that in the near future tax will rise to a level that gives a true representation of the environmental impact of the release of CO
2 and Methane.
Sodagar and Fieldson [
52] have demonstrated benefits associated with sustainable deconstruction of buildings together with the issues associated with end of life impact. Jones [
53] highlights the methodological challenge of recycling at the end of building lifetime and explains advantages and disadvantages of three different methods of the allocating for recycling namely the recycled content method, the substitution method and the 50:50 method. The method used in PAS 2050 [
36] is the recycled content method in which credit is given to the use of recycled materials.
The energy used for demolition of buildings is typically small (1–3%) in relation to the energy used for material production and building assembly [
43]. For the Cross Street building, it is assumed that the deconstruction impact of the building will equal to 1% of the combined impacts of materials used and construction process.
6.3.5. Whole Life Impact
Table 9 lists the emissions for the Cross Street refurbished building development over 60 years for different lifecycle stages. The whole life CO
2e emissions of the building comprising three new dwelling units over 60 years new design life is 533,026.17 kgCO
2e. The in-use emissions are 90.76% of the total lifetime CO
2e emissions of the building. The relative contribution of in-use emissions in the LCA of the development at Cross Street is significant partly due to the savings made in materials, and other associated impacts inherent in refurbishment compared with new build scenarios.
Table 9.
Whole life emissions for the refurbished building (all three new housing units) at Cross Street over 60 years.
Table 9.
Whole life emissions for the refurbished building (all three new housing units) at Cross Street over 60 years.
| Elements | kgCO2e | Relative CO2 (%) |
|---|
| Materials (with replacement) | 45,988.64 | 8.63 |
| Construction process1 | 1465.85 | 0.28 |
| Materials waste1 | 1465.85 | 0.28 |
| In-use | 483,798 | 90.76 |
| Deconstruction process2 | 307.83 | 0.06 |
| Total | 533,026.17 | 100 |
| Total kgCO2e/m2 | 2034.45 |
| kgCO2e per year | 8883.77 |
The whole life CO
2e emissions of the building at Cross Street per square meter are 2034.45 kgCO
2e. In a study carried out by the Empty Homes Agency (EHA) [
8] the average life time CO
2 emissions for the three refurbished houses over a 50-year period are of the order of 1.7 tonnes of CO
2 per square metre of floor area. In their analyses, EHA did not consider the impacts of construction process, materials waste and end of life. For comparison reasons, if for the Gainsborough project we adjust our LCA assumptions and boundary conditions to mach them more closely with those assumed in EHA study by reducing the life expectancy from 60 to 50 years, ignoring the impacts from materials replacement, construction process, materials waste and end of life, the adjusted life time CO
2e will be 1650.7 kgCO
2e. Another methodological difference in the research reported in this paper and that of EHA’s is that Carbon Dioxide Equivalent (CO
2e) is used as the unit of measurement in this study. This is due to the fact that CO2e better represents the collective environmental impacts of buildings. The latest version of Bath Carbon Inventory (Version 2.0) [
11] which was used in this study to calculate the materials impact uses CO
2e while in the previous version of the Inventory (Version 1.6a) [
54] which has been used by EHA, CO
2 was the unit of measurement. For the building analysed in this paper, instead of an initial impact of 111.90 kg CO
2e, if ICE version 1.6a had been used the estimated initial impact would have been 101.45 kgCO
2. This represents an underestimation of materials impact of the order of 10.3%.
In the analyses carried out for this paper, the storage carbon potential of renewable materials such as timber is excluded. Sodagar
et al. [
55] have demonstrated that by including the carbon sequestration potential of renewable materials in LCA, the distribution of life cycle burdens may significantly change.


