Abstract
Seismic assessment of masonry structures is plagued by both inherent randomness and model uncertainty. The former is referred to as aleatory uncertainty, the latter as epistemic uncertainty because it depends on the knowledge level. Pioneering studies on reinforced concrete buildings have revealed a significant influence of modeling parameters on seismic vulnerability. However, confidence in mechanical properties of existing masonry buildings is much lower than in the case of reinforcing steel and concrete. This paper is aimed at assessing whether and how uncertainty propagates from material properties to seismic capacity of an entire masonry structure. A typical two-story unreinforced masonry building is analyzed. Based on previous statistical characterization of mechanical properties of existing masonry types, the following random variables have been considered in this study: unit weight, uniaxial compressive strength, shear strength at zero confining stress, Young’s modulus, shear modulus, and available ductility in shear. Probability density functions were implemented to generate a significant number of realizations and static pushover analysis of the case-study building was performed for each vector of realizations, load combination and lateral load pattern. Analysis results show a large dispersion in displacement capacity and lower dispersion in spectral acceleration capacity. This can directly affect decision-making because both design and retrofit solutions depend on seismic capacity predictions. Therefore, engineering judgment should always be used when assessing structural safety of existing masonry constructions against design earthquakes, based on a series of seismic analyses under uncertain parameters.
1. Introduction
Modeling uncertainties have a crucial role in performance-based earthquake engineering (PBEE) because they propagate throughout each step of seismic loss estimation according to the Pacific Earthquake Engineering Research (PEER) Center framework [,]. Some approaches to characterize uncertainties in ground motion hazard, building response, damage to building components, and losses (i.e., casualties, financial losses, and business interruption) have been proposed by Baker and Cornell []. They assessed uncertainty propagation with the PEER framework up to the estimation of the expected value and variance of mean annual loss, mean rate of collapse, and mean rate of exceeding a given cost. Past research on reinforced concrete (RC) buildings has indicated that modeling uncertainties associated with material strengths have a relatively small effect on seismic pre-collapse performance predictions [,]. On the contrary, Ibarra and Krawinkler [] have shown that uncertainties associated with deformation capacity and post-peak softening branch of force–displacement diagrams of individual structural components can significantly affect the predicted collapse performance. Liel et al. [] have assessed seismic collapse risk of both standard (i.e., ductile) and substandard (i.e., non-ductile) RC framed buildings, incorporating structural modeling parameter uncertainties. Based on the use of Monte Carlo methods and response surface analysis [,], a response surface has been derived to describe each median collapse capacity parameter as a multivariate function of modeling random variables. The analysis of fragility curves has shown that modeling uncertainties related to both the structure and earthquake ground motion have greater impact on seismic capacity estimation when modeling parameters are more uncertain and their relationship with structural response is highly nonlinear. In this case, modeling uncertainties cause a dispersion increase and a shift in the median of the structural response fragility, which may decrease by as much as 20%.
In the case of masonry structures high dispersion in material properties and highly nonlinear response under earthquake actions are to be considered. The intrinsic randomness of material mechanics and the limited knowledge provided by experimental tests on material properties can significantly affect the confidence in structural analysis results. The assignment of physical properties is a difficult task even in the presence of regular assemblages, such as running and American bond masonries. In fact, several factors of uncertainty arise from workmanship techniques, including partial or complete filling of joints with mortar, constant or variable size ratio between joints and bricks, etc. Another problem is related to the acquisition of experimental data from past investigations: the same masonry property can be characterized through different laboratory or in situ experimental tests, test setups, and specimens. In many cases nonstandard procedures have been employed in the past for masonry characterization. These factors clearly induce a significant dispersion in results, so engineering judgment is needed to select reliable values from an experimental data set, or ranges suggested by building codes and handbooks. Comprehensive studies on ranges of masonry properties and empirical/analytical formulations available for their estimation have been carried out by Augenti [] and Tassios []. Experimental data on sliding shear properties of different masonry types are summarized and discussed in []. The Italian Building Code Commentary (IBCC) [] provides typical ranges of a number of masonry types to be used for structural assessment of existing masonry constructions. In view of an IBCC revision, Augenti and Parisi [] have performed a statistical analysis of experimental data on tuff masonry selected from the former release of MADA, which is an online database of masonry properties collected in more than 400 files []. More recently, Oropeza [] has collected relevant data on the variability of masonry properties. However, anyone could find high variance in both experimental data and empirical/analytical estimates of properties.
Figure 1 shows the typical stress-strain behavior of masonry under uniaxial compression, which is highly nonlinear even at small strain levels. Mechanical nonlinearity can also be detected under shear deformations. Microcracking in the elastic range and material instability caused by fracture in the inelastic range call for a probabilistic characterization of masonry mechanics. Uncertainties affect both limit strains and the corresponding strengths of masonry. Cracking strain εp associated with peak strength σp is less uncertain than ultimate strain εu and residual strength σu. Strain softening of masonry induces lower confidence in the simulation of plastic behavior given that the fracture process is noticeably sensitive to local material discontinuities. For instance, pumice inclusions and voids can be detected in tuff stones, which are widely spread in many earthquake-prone regions. Compressive tests on tuff masonry in the direction orthogonal to bed joints [] have shown a coefficient of variation (CoV) equal to 12.5% and 9.1% for σp and εp, respectively; such values increase even to 23.4% and 73.1% for strength and limit strain at collapse. Young’s and shear moduli at σp/3 have been found to have CoV equal to 16.7% and 17.7%, respectively, whereas CoV = 26.8% has been computed for the relevant Poisson’s ratio. Different CoV-values have been detected under compression parallel to bed joints. The representation of confidence interval under varying axial strain has confirmed that uncertainty increases with inelasticity. It is emphasized that such an outcome depends on the randomness of fracture process and the ability of the test setup in capturing cracks. Figure 1 also shows probability density functions (PDFs) of peak and ultimate strengths, as well as conditional PDFs of cracking and ultimate strains. This is a typical representation for strains’ uncertainties because they are usually estimated at given strength levels. Ultimate strain is associated with a predefined strength drop.
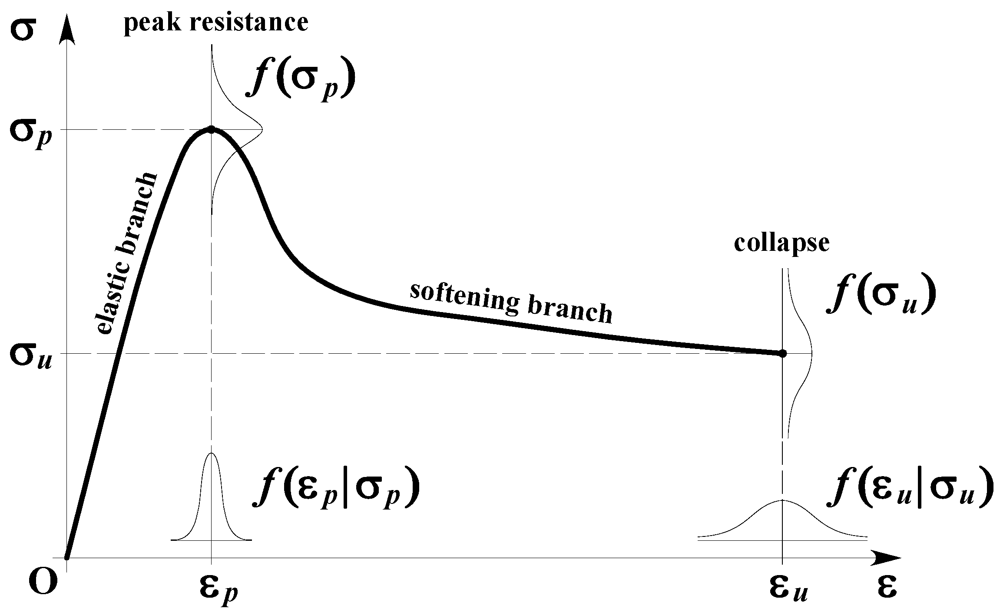
Figure 1.
Typical stress–strain diagram of masonry in compression and uncertainties.
The aforementioned studies motivated this paper, which investigates the uncertainty propagation within nonlinear seismic analysis of unreinforced masonry (URM) buildings. A case-study building was analyzed to estimate mean and variance of seismic capacity parameters under uncertain material properties, regardless of ground motion uncertainty whose influence on seismic vulnerability of URM buildings has already been assessed by Pasticier et al. []. This investigation attempts to provide an answer to the following question of practical interest: are numerical results sufficiently reliable to assess structural safety of URM buildings, or does engineering judgment still play a key role in decision-making?
2. Accounting for Uncertainty in Seismic Capacity Estimation of a Case-Study Masonry Building
The effects of masonry uncertainties were assessed in the case of an ideal two-story URM building, which was composed by seven load-bearing walls with openings (Figure 2). Each wall was made of tuff masonry. The case-study building was selected from typical residential buildings of southern Europe [,]. The fundamental period of the masonry buildings was estimated as T1 = 0.24 s through a simplified code formula []. A simulated design procedure was employed in accordance to Eurocode 8 (EC8)—Part 3 [] on the basis of practice rules, without considering specific seismic design provisions.
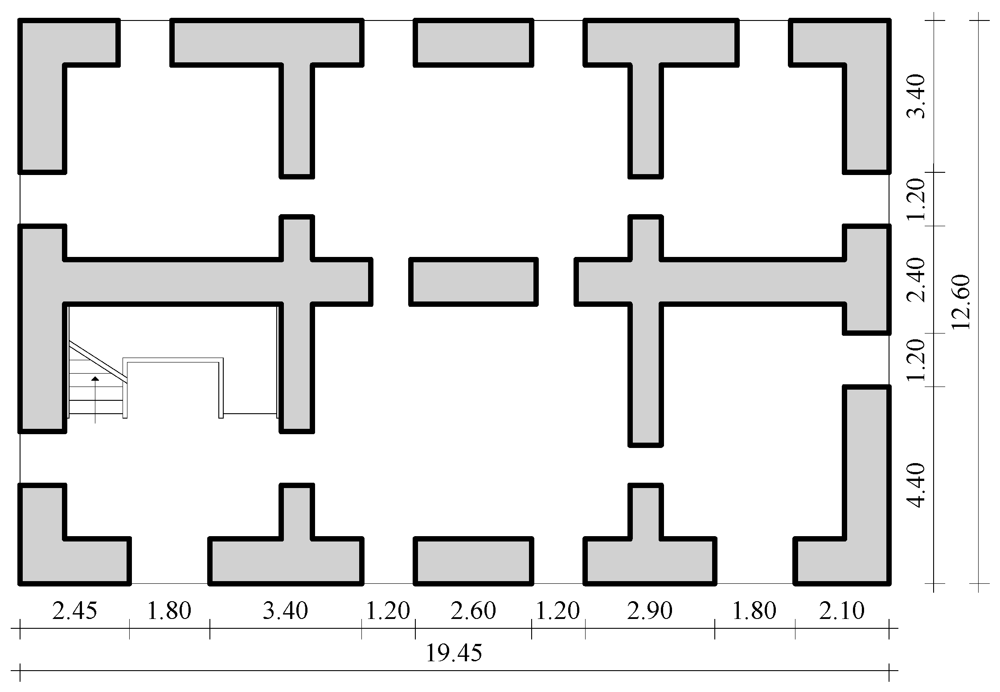
Figure 2.
Typical floor plan of case-study building (dimensions in meters).
Actually, no seismic design codes for masonry buildings have been released in many European countries prior to EC8—Part 1 []. Assuming parapets to be nonstructural components, wall openings were considered to have the same size and to be both vertically and horizontally aligned in elevation. The staircase system was assumed to be made of RC slabs with 15 mm thickness, which were supported by three walls belonging to a corner masonry cell of the building. Perimeter and internal load-bearing walls had a thickness of 1.00 and 0.70 m at the ground floor, and 0.90 and 0.60 m at the first floor, respectively. RC bond beams connected all walls at each floor level and one-way RC joist slabs with thickness of 250 mm were introduced to distribute earthquake actions among walls. Finally, wooden lintels were placed above openings and were supposed to be well anchored within surrounding masonry. Orthogonal walls were assumed to be well connected through masonry interlocking and sufficient flange lengths. The building was 19.45 × 12.60 m2 in plan and 8.16 m high, given that interstory height was set to 4.08 m.
2.1. Material Properties and Related Uncertainty
Based on statistics derived for tuff masonry [], a uniform PDF was assumed for unit weight (γ) and a Gaussian PDF was assumed for the following parameters: uniaxial compressive strength (fm); shear strength at zero confining stress (τ0); Young’s modulus (Em); shear modulus (Gm); and available ductility in shear (µs). Lower and upper bounds, mean and standard deviation of such modeling variables are listed in Table 1, where one can note that CoV was equal to: 15% in the case of fm, Em, and Gm; 12.19% in the case of τ0; and 23.90% in the case of µs. Young’s modulus was about 1000 times compressive strength, whereas shear modulus was 0.4 times Young’s modulus. According to EC6 [], friction coefficient of masonry was assumed to be 0.4 at any confining stress level. The spatial distribution of material properties was assumed to be uniform throughout the building and wall sizes were assumed to be deterministically known. Realizations of the random modeling vector Θ = [γ, fm, τ0, Em, Gm, µs] were generated through the full Monte Carlo method.

Table 1.
Random properties and their statistics.
| Parameter | γ [kN/m3] | fm [MPa] | τ0 [MPa] | Em [MPa] | Gm [MPa] | µs |
|---|---|---|---|---|---|---|
| Lower bound | 14.00 | 1.40 | 0.038 | 1746 | 698 | 2.64 |
| Upper bound | 18.00 | 2.40 | 0.057 | 2444 | 978 | 3.71 |
| Mean | – | 1.90 | 0.047 | 2090 | 836 | 3.18 |
| Standard deviation | – | 0.28 | 0.006 | 314 | 125 | 0.76 |
2.2. Capacity Modeling
Simplified macroelement models are widely used to assess seismic performance of standard masonry buildings, like that investigated in this study. Such models are based on an equivalent frame idealization of masonry walls with openings and their three-dimensional (3D) assemblage through floor diaphragms and, if any, RC bond beams or other tying elements (e.g., steel or wooden ties). Continuous masonry strips along the height and length of the wall are referred to as piers and spandrels. Their intersection allows the definition of: (1) rigid macroelements named joint panels; and (2) flexible macroelements named pier panels or spandrel panels, depending on whether they are vertical or horizontal structural components, respectively (Figure 3).
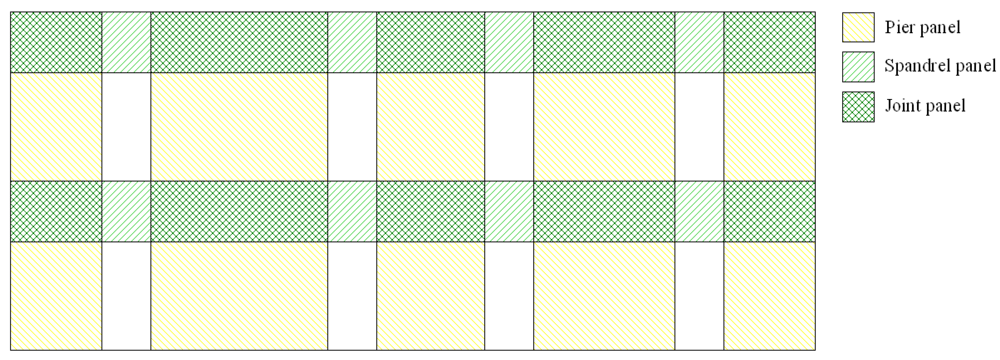
Figure 3.
Macroelement model of masonry wall with openings.
Figure 4 shows the 3D macroelement model of the case-study building where shadows indicate floor slab spanning. The 3D model was developed in RAN Code, a computer program which performs nonlinear macroelement analysis of masonry buildings according to RAN method []. Pier and spandrel panels had axial, flexural and shear flexibilities and their effective resistant volume Ω changed with the given lateral drift as a result of tensile cracking and masonry crushing at compressed corners (see [] for details).
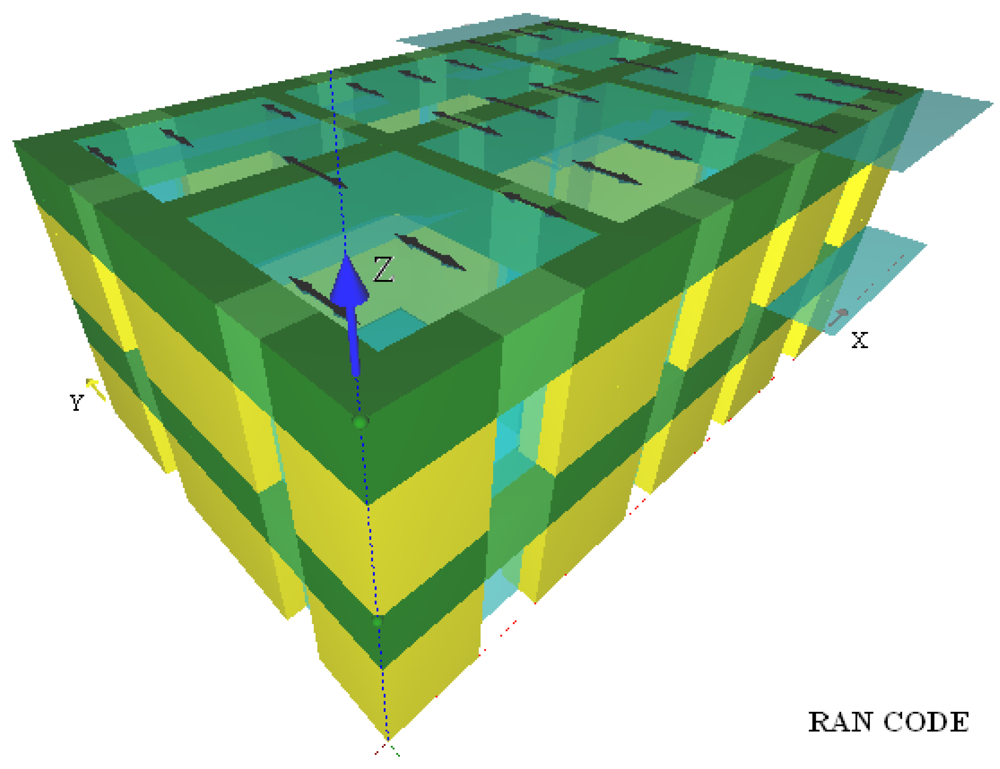
Figure 4.
3D macroelement model of case-study masonry building.
Nonlinear behavior of each URM macroelement under lateral loading was simulated by a force-displacement diagram where the lateral resisting force is derived as the maximum axial strain on the end sections is increased. Assuming a plane axial strain distribution within the macroelement, the flexural component of lateral displacement is derived through double integration of axial strains over Ω and the corresponding lateral resisting force is computed according to closed-form balance equations of end sections under eccentric compression. A constitutive model with strain softening [] was assumed, considering deterministic limit strains at cracking and collapse equal to 0.20% and 0.35%, respectively (note that the statistical characterization of such mechanical properties have not yet been carried out in the case of tuff masonry). Consequently, the available ductility in compression was 1.75. Furthermore, masonry was considered as equivalent homogeneous material with zero tensile strength. The shear component of lateral displacement was then computed at any lateral resisting force, accounting for Ω evolution []. In this computation the available ductility µs was used to amplify the total displacement of the macroelement in the case of shear failure.
3. Static Pushover Analysis
Four hundred response-controlled static pushover (SPO) analyses of the case-study building were carried out. Out-of-plane mechanisms were not included in the SPO analysis because they were inhibited by the presence of rigid floor diaphragms and RC bond beams connecting walls at each floor. SPO analysis included a step-by-step updating of (1) lateral strength of macroelements on the basis of current axial force demands and limit strength domains; and (2) stiffness center at each floor level to account for inelastic torsion. RAN Code uses the procedure presented in [] and extended to 3D macroelement models of masonry buildings. Accidental eccentricities of mass centers were set to 5% of the building plan dimensions in both directions according to EC8—Part 1 [], so four load combinations for each direction of the building plan were accounted for the SPO analysis. Two lateral load patterns were considered: uniform load pattern (ULP) and inverse triangular load pattern (ITLP), which are a mass- and a first mode-proportional distribution of lateral actions. Figure 5 shows a typical outcome for regular building structures according to EC8 criteria, where SPO curves related to ULP provide an upper bound for earthquake resistance. Each curve is represented as first-mode spectral acceleration Sa versus roof lateral displacement dc up to the collapse of the building, which was assumed to occur when all piers minus one at the same story reached their displacement capacity. It is emphasized that displacement capacity of the whole building is different from that of a macroelement, opposed to the case of other structural systems (e.g., RC frames) where the attainment of the limit chord rotation in a member is also assumed to be a global limit state. In the case of masonry constructions, the building displacement capacity at life safety (du) is typically defined as the lateral displacement of a control point on the roof corresponding to 20% resistance drop on the post-peak descending branch of the SPO curve. Therefore, one can estimate spectral acceleration capacity Sa|du as the intensity measure causing the life safety limit state.
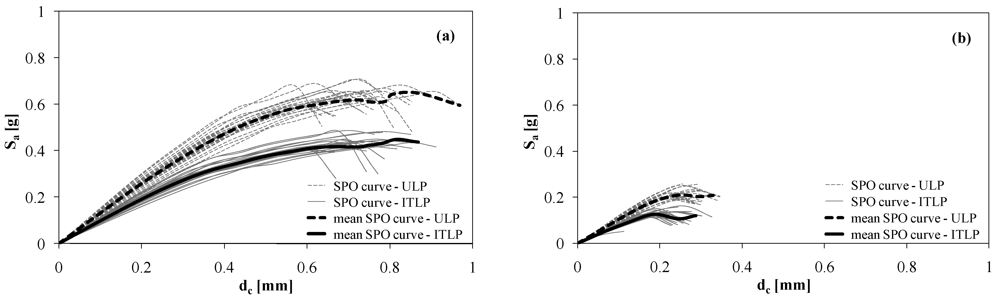
Figure 5.
Static pushover (SPO) curves and their means related to the analysis cases: (a) 1X; (b) 1Y.
The curves in Figure 5 is related to specific analysis cases, but it could be shown that the same occurred in other cases. Spectral acceleration capacity of the case-study building in the X-direction is more than three times that related to the Y-direction. This can be motivated on one hand by the fact that gravity loads on floors were mainly distributed to walls parallel to the X-axis, and on the other hand by the presence of more piers and spandrel panels in those walls. Figure 6 shows all SPO curves of the case-study building.
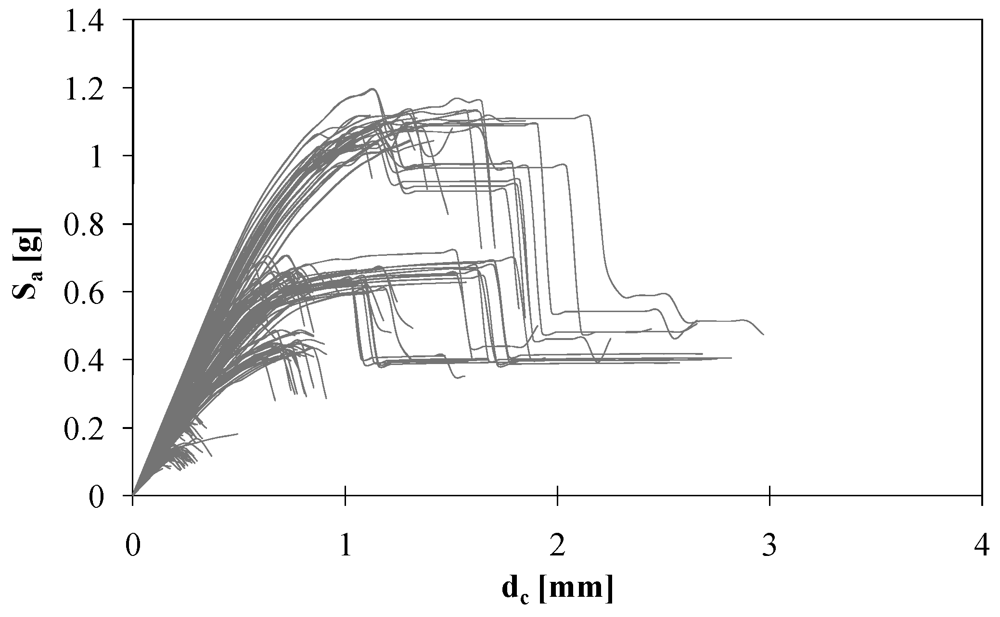
Figure 6.
SPO curves related to all analysis cases.
The case-study building has an actual elastic first-mode period ranging between 0.06 and 0.08 s (corresponding to a frequency between 12.50 and 16.67 Hz). Such values can be estimated for each SPO curve as 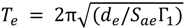 , where de is the limit elastic displacement, Sae is the spectral acceleration associated with de, and Γ1 is the first-mode participation factor of the structure. Therefore, Te is about one-fourth of the fundamental period T1 estimated in accordance with EC8 [] (see Section 2). This produces a low deformation capacity, but also a limited displacement demand on the structure. Note that the mean limit elastic displacement of the building is 0.6 and 0.2 mm in the X- and Y-direction, respectively.
4. Estimation of Seismic Capacity Uncertainty
Based on SPO analysis results, mean and standard deviation of spectral acceleration conditioned on dc, denoted by µSa|dc and σSa|dc respectively, were investigated for each loading direction (Figure 7 and Figure 8). It is confirmed that the earthquake resistance of the case-study building is not the same for both loading directions and lateral load patterns. In addition, different SPO curves were obtained for positive and negative orientations of seismic actions, especially in the case of the X-direction. This was caused by the lack of symmetry in plan which induced higher seismic response sensitivity to axial forces in piers generated by overturning moments at each floor level. Variations in axial forces produce a change in lateral capacity of pier panels, as analytically shown by Augenti []. It is worth noting that dispersion of conditional spectral acceleration increases until collapse of some macroelements is attained, Figure 8.
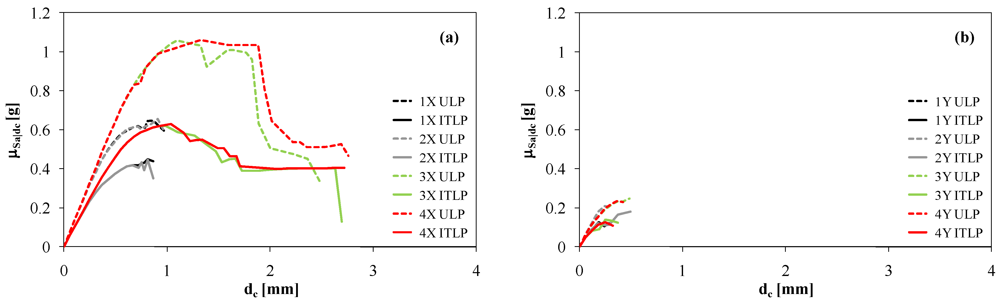
Figure 7.
Mean of conditional spectral acceleration: (a) X-direction; (b) Y-direction.
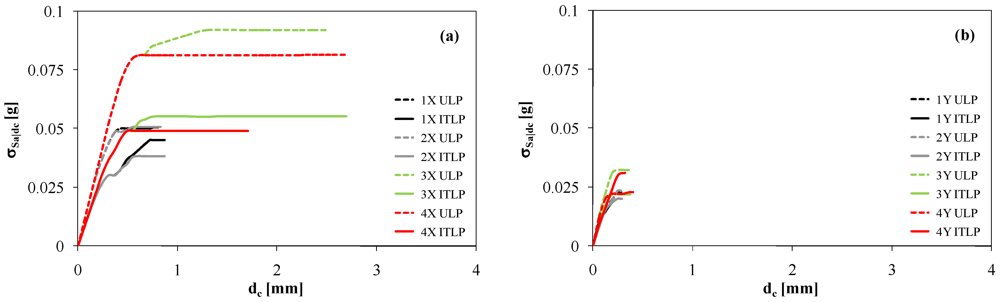
Figure 8.
Dispersion of conditional spectral acceleration: (a) X-direction; (b) Y-direction.
At larger displacement demands, σSa|dc reaches a constant value falling in the ranges [0.04 g, 0.09 g] and [0.02 g, 0.03 g] for seismic actions acting in the X- and Y-direction, respectively. This also indicates a reliable estimation of seismic capacity uncertainty, which is quantified in Table 2. In particular, one can note that CoV is 9%–26% in the X-direction and 12%–55% in the Y-direction, in the case of du. Uncertainty reduces in the case of spectral acceleration capacity Sa|du for which CoV is 8%–11% in the X-direction and 11%–24% in the Y-direction. For each code-based load combination, uncertainty in the Y-direction is higher than that in the other direction of the building plan.
Table 2.
Statistics of displacement capacity and conditional spectral acceleration.
| Analysis Case | Load Pattern | μd [mm] | CoVd | µSa|du [g] | CoVSa|du |
|---|---|---|---|---|---|
| 1X | ULP | 0.77 | 12% | 0.61 | 8% |
| ITLP | 0.76 | 11% | 0.42 | 11% | |
| 2X | ULP | 0.77 | 11% | 0.61 | 8% |
| ITLP | 0.75 | 9% | 0.41 | 9% | |
| 3X | ULP | 1.51 | 22% | 1.02 | 9% |
| ITLP | 1.28 | 19% | 0.57 | 10% | |
| 4X | ULP | 1.30 | 26% | 1.06 | 8% |
| ITLP | 1.32 | 21% | 0.55 | 9% | |
| 1Y | ULP | 0.29 | 12% | 0.20 | 11% |
| ITLP | 0.21 | 25% | 0.11 | 16% | |
| 2Y | ULP | 0.28 | 13% | 0.20 | 11% |
| ITLP | 0.24 | 29% | 0.11 | 18% | |
| 3Y | ULP | 0.20 | 55% | 0.16 | 19% |
| ITLP | 0.18 | 51% | 0.09 | 24% | |
| 4Y | ULP | 0.26 | 51% | 0.20 | 11% |
| ITLP | 0.18 | 37% | 0.11 | 20% |
Uncertainty levels provided by SPO analysis were estimated by using PDFs of masonry properties, each of them expressed as fθ(θ,Θf) where the vector Θf included the mean µθ and standard deviation σθ estimated over experimental data available in the literature. Actually, such properties depend on mechanical parameters and relative size of masonry constituents (i.e., masonry units and mortar joints), as well as masonry bond and boundary conditions [,]. This means that, in line of principle, the overall uncertainty could be reduced assuming that it is partly aleatory and partly epistemic []. Aleatory uncertainty cannot be reduced by increasing the size of the data set of modeling parameters or modeling rules, because it is assumed to be dependent on the randomness of the phenomenon to be modeled. Conversely, epistemic uncertainty is treated as a variable which decreases as the knowledge level increases []. In the case of existing building, material and geometric properties are epistemic variables, whereas loads and their associated demands on the structure, be it existing or future, have always future realizations so their uncertainty is typically classified as aleatory. An important source of epistemic uncertainty is also due to the use of a physical structural model which is a simplification of the real construction. On the material side, experimental data sets on parameters of both masonry assemblages and their constituents are still lacking to be reliably used, especially in the case of tuff masonry. This causes the following missing submodels: (1) physical submodels θ = g(β,Θg) + ε describing each tuff masonry property θ as a function of the vector β of geometric and mechanical parameters of masonry constituents, which is characterized by the vector of parameters Θg fitted to experimental data and statistical uncertainty (residual) ε; and (2) probabilistic submodels of masonry constituent properties fβ(β,Θf). When such an information will be available, the use of Monte Carlo-type or other methods to obtain realizations of masonry constituent properties will enable to reduce uncertainty in tuff masonry properties, and hence in seismic capacity of tuff masonry structures. Nevertheless, at this state of knowledge, the identification of epistemic variables ensures transparency in the quantitative analysis presented above, because one can know which reducible uncertainties have been left unreduced in the modeling phase. The present paper thus provides a first estimation of seismic capacity of a typical existing URM building which could be improved in the future on the basis of more observed data on mechanical properties.
5. Conclusions
This paper has dealt with the issue of seismic capacity uncertainty. After uncertain properties of masonry have been identified and discussed, their influence on seismic capacity estimation has been assessed for an ideal case-study URM building which falls in the class of residential buildings located in southern Europe. The case-study building was designed assuming a low-seismicity area, according to EC8 and past rules of practice. Based on a statistical characterization of six fundamental masonry properties, realizations of a random modeling vector were implemented in a macroelement capacity model of the structure and SPO analysis was performed for each code-based load combination and lateral load pattern.
Analysis results demonstrate that seismic capacity estimation of masonry buildings can be affected by a large dispersion, as shown for other building structures in the literature. Dispersion in SPO curves increases up to the failure of one or more macroelements, after which standard deviation of spectral acceleration remains almost constant up to collapse. Most part of the uncertainty lies in (1) the definition of the building displacement capacity rather than spectral acceleration capacity; and (2) seismic capacity estimation related to lateral actions applied in the plan direction corresponding to the minimum earthquake resistance. Such observations confirm that, at the present state of knowledge, engineering judgment still plays a key role when assessing structural safety of existing masonry buildings against design earthquakes. This has a direct consequence in decision-making because both design and retrofit solutions depend on seismic capacity predictions. It is recommended to use a set of values for each of the most uncertain parameters and to perform seismic analysis for each vector of parameter realizations, in order to get a reliable idea of the actual safety of a masonry building. Future research could explore the influence of an uncertain location of material properties in the building and uncertain size of load-bearing walls. Nevertheless, uncertainty in seismic capacity could be reduced by increasing the amount of experimental data on masonry units and mortar, provided that correlation models to estimate their relevant masonry properties will be developed and/or validated.
Finally, a key issue is how the information on seismic capacity uncertainty provided in this study could be used to estimate the actual seismic intensity measure (IM) at collapse (e.g., the peak ground acceleration PGAC or elastic spectral acceleration Sae,C), as well as the corresponding probability of failure Pf in a given time interval, which are crucial for decision-making in PBEE. This computation should include the uncertainty in seismic demand, which has not been estimated in this study. To this end, in the context of SPO-based approaches, two alternative procedures are available to determine the relationship between IM and a given engineering demand parameter (EDP), e.g., the roof displacement dc, without using incremental dynamic analysis (IDA) [] for a large suite of earthquake ground motion records: SPO2IDA tool [,] and incremental N2 (IN2) method []. Both methods could provide approximate IDA curves, but different procedures should be employed to estimate central values (i.e., mean or median) and dispersion in seismic performance, accounting for aleatory uncertainty due to record-to-record variability. Then, the inclusion of seismic hazard uncertainties could allow to fully estimate Pf under varying IM, deriving the fragility curve at collapse. Nevertheless, further research is needed to assess the applicability of SPO2IDA tool and IN2 method to URM buildings. Furthermore, extensive sensitivity studies will have to be performed in order to define reliable default values for dispersion measures associated with displacement demand.
Acknowledgments
This research was carried out in the framework of the ReLUIS-DPC 2010-2013 project (Line AT1-1.1—“Evaluation of the Vulnerability of Masonry Buildings, Historical Centers and Cultural Heritage”) funded by the Italian Department of Civil Protection.
References
- Porter, K.A. An overview of PEER’s performance-based earthquake engineering methodology. In Proceedings of the 9th International Conference on Applications of Statistics and Probability in Civil Engineering, San Francisco, CA, USA, 6–9 July 2003.
- Deierlein, G.G. Overview of a comprehensive framework for earthquake performance assessment. In Proceedings of the International Workshop on Performance-BasedSeismic Design Concepts and Implementation, Bled, Slovenia, 28 June–1 July 2004.
- Baker, J.W.; Cornell, C.A. Uncertainty propagation in probabilistic seismic loss estimation. Struct. Saf. 2008, 30, 236–252. [Google Scholar] [CrossRef]
- Porter, K.A.; Beck, J.L.; Shaikhutdinov, R.V. Sensitivity of building loss estimates to major uncertain variables. Earthq. Spectr. 2002, 18, 719–743. [Google Scholar] [CrossRef]
- Lee, T.H.; Mosalam, K.M. Seismic demand sensitivity of reinforced concrete shear-wall building using FOSM method. Earthq. Eng. Struct. Dyn. 2005, 34, 1719–1736. [Google Scholar] [CrossRef]
- Ibarra, L.; Krawinkler, H. Global Collapse of Frame Structures under Seismic Excitations; Report No. 152; John A. Blume Earthquake Engineering Center: Stanford, CA, USA, 2005. [Google Scholar]
- Liel, A.B.; Haselton, C.B.; Deierlein, G.G.; Baker, J.W. Incorporating modeling uncertainties in the assessment of seismic collapse risk of buildings. Struct. Saf. 2009, 31, 197–211. [Google Scholar] [CrossRef]
- Rubinstein, R.Y. Simulation and the Monte Carlo Method; John Wiley & Sons: New York, NY, USA, 1981. [Google Scholar]
- Pinto, P.E.; Giannini, R.; Franchin, P. Seismic Reliability of Structures, 2nd ed; IUSS Press: Pavia, Italy, 2007. [Google Scholar]
- Augenti, N. II calcolo sismico degli edifici in muratura (in Italian), 2nd ed; Unione Tipografico-Editrice Torinese: Turin, Italy, 2004. [Google Scholar]
- Tassios, T.P. Seismic engineering of monuments. In Earthquake Engineering in Europe; Garevski, M., Ansal, A., Eds.; Springer: Berlin, Germany, 2010; pp. 1–42. [Google Scholar]
- Augenti, N.; Parisi, F. Constitutive modelling of tuff masonry in direct shear. Construct. Build. Mater. 2011, 25, 1612–1620. [Google Scholar] [CrossRef]
- Italian Ministry of Infrastructures and Transportation, Circ. 02.02.2009, No. 617: Istruzioni Per l’applicazione delle «Nuove Norme Tecniche per le Costruzioni» di Cui Al Decreto Ministeriale 14 Gennaio 2008 (in Italian); Italian Ministry of Infrastructures and Transportation: Rome, Italy, 2009.
- Augenti, N.; Parisi, F. Experimental data analysis on mechanical parameters of tuff masonry. In Proceedings ofWorkshop on Design for Rehabilitation of Masonry Structures (Wondermasonry 2009), Lacco Ameno, Italy, 8–10 October 2009.
- Augenti, N.; Parisi, F.; Acconcia, E. MADA: Online experimental database for mechanical modelling of existing masonry assemblages. In Proceedings of the 15th World Conference on Earthquake Engineering, Lisbon, Portugal, 24–28 September 2012.
- Oropeza, M. Fragility Functions for Seismic Risk in Regions with Moderate Seismicity.
- Augenti, N.; Parisi, F. Constitutive models for tuff masonry under uniaxial compression. J. Mater. Civ. Eng. 2010, 22, 1102–1111. [Google Scholar] [CrossRef]
- Pasticier, L.; Amadio, C.; Fragiacomo, M. Non-linear seismic analysis and vulnerability evaluation of a masonry building by means of the SAP2000 V.10 code. Earthq. Eng. Struct. Dyn. 2008, 37, 467–485. [Google Scholar] [CrossRef]
- Kappos, A.J. Seismic vulnerability assessment of existing buildings in Southern Europe. In Proceedings of the 10th Italian conference on earthquake engineering, Potenza-Matera, Italy, 9–13 September 2001.
- Bramerini, F.; Di Pasquale, G. Aggiornamento delle mappe di rischio sismico (in Italian). Ing. Sismica 2008, 2, 5–23. [Google Scholar]
- Comité Européen de Normalisation, Eurocode8: Design of Structures for Earthquake Resistance—Part 1: General Rules, Seismic Actions and Rules for Buildings; Comité Européen de Normalisation: Brussels, Belgium, 2004.
- Comité Européen de Normalisation, Eurocode8: Design of Structures for Earthquake Resistance—Part 3: Assessment and Retrofitting of Buildings; Comité Européen de Normalisation: Brussels, Belgium, 2005.
- Comité Européen de Normalisation, Eurocode 6: Design of Masonry Structures—Part 1-1: General Rules for Reinforced and Unreinforced Masonry Structures; Comité Européen de Normalisation: Brussels, Belgium, 2005.
- Parisi, F.; Augenti, N. Seismic capacity of irregular unreinforced masonry walls with openings. Earthq. Eng. Struct. Dyn. 2012, in press.. [Google Scholar]
- Turnšek, V.; Čačovič, F. Some experimental results on the strength of brick masonry walls. In Proceedings of the 2nd International Brick and Block Masonry Conference, Stoke-on-Trent, UK, 12–15 April 1970.
- Der Kiureghian, A.; Ditlevsen, O. Aleatory or epistemic? Does it matter? Struct. Saf. 2009, 31, 105–112. [Google Scholar] [CrossRef]
- Faber, M.H. On the treatment of uncertainties and probabilities in engineering decision analysis. J. Offshore Mech. Arct. Eng. 2005, 127, 243–248. [Google Scholar] [CrossRef]
- Vamvatsikos, D.; Cornell, C.A. Incremental dynamic analysis. Earthq. Eng. Struct. Dyn. 2002, 31, 491–514. [Google Scholar] [CrossRef]
- Vamvatsikos, D.; Cornell, C.A. Direct estimation of the seismic demand and capacity of oscillators with multi-linear static pushovers through IDA. Earthq. Eng. Struct. Dyn. 2006, 35, 1097–1117. [Google Scholar] [CrossRef]
- Fragiadakis, M.; Vamvatsikos, D. Fast performance uncertainty estimation via pushover and approximate IDA. Earthq. Eng. Struct. Dyn. 2010, 39, 683–703. [Google Scholar]
- Fajfar, P.; Dolšek, M. A practice-oriented estimation of the failure probability of building structures. Earthq. Eng. Struct. Dyn. 2012, 41, 531–547. [Google Scholar] [CrossRef]
© 2012 by the authors; licensee MDPI, Basel, Switzerland. This article is an open-access article distributed under the terms and conditions of the Creative Commons Attribution license (http://creativecommons.org/licenses/by/3.0/).