1. Introduction
According to the authors of the HOPE Study [
1] “From the perspective of the occupants of a building, the ideal situation is an indoor environment that satisfies all the occupants (
i.e., they have no complaints) and does not unnecessarily increase the risk or severity of illness or injury. The current situation is far from ideal and the potential for improving the indoor environment is high.” In a similar vein, Zweers
et al. [
2] found that lower levels of indoor climate complaints were associated with higher job satisfaction and the authors of the COPE Study [
3] noted that “For knowledge workers, job satisfaction is likely a far more important predictor of organizational success”, with Veitch
et al. [
4] going so far as to assert that “… these findings, and others reveal that a satisfactory physical environment is one component of a satisfied workforce and an effective organization.”
Anecdotal evidence from facilities managers is that they receive mainly negative comments—perhaps it is the nature of the job that they get only complaints in response to some building malfunction. The tendency appears to be for building occupants to point out problems that are affecting their comfort adversely or interfering with their work. Matters that have a positive influence remain un-noticed in the background or are simply taken for granted, and arguably that is how it should be—most occupants probably just want to get on with their work without having to be concerned with the operation of the building.
The thought was that perhaps it would be useful for facilities managers to know what level of complaint should be taken as an indicator of a serious issue irritating the majority of occupants, and what level might indicate just a few disaffected users. While simply logging and counting complaints would certainly serve as a preliminary indicator, it was speculated that relating these to the total number of occupants might add a further level of sophistication to such a process. A complaint index was employed in the TOBUS Study, for example, [
5,
6] to prioritise aspects requiring upgrading in twelve European office buildings. It was also felt that with the possible future development of Building (Sustainability) Rating Tools for buildings in operation [
7], the intended implementation of occupant surveys in the German Certification system for sustainable office and administrative buildings [
8], and the recently developed NABERS protocol [
9] for indoor environmental quality in Australia, for instance, the results of this study might provide some potential indicators of user satisfaction.
In terms of survey methodologies, a recent review of ten such by Peretti and Schiavon [
10] concluded that “Occupants can be a useful and inexpensive source of information about indoor environmental quality.” However seven of these methodologies were no longer in use, having been used for specific research projects. The three remaining methods were those of the Center for the Built Environment, Berkeley [
11], the Technical University of Denmark [
12] and Building Use Studies, London [
13].
As part of a broader investigation of the performance of sustainable buildings, the authors used the Building Use Studies methodology to investigate the users’ perceptions of the indoor environment of a range of commercial and institutional buildings worldwide [
14].
Thirty-one buildings in eleven countries were studied—in all cases either recipients of national awards for sustainable design or highly rated in terms of a relevant building sustainability rating tool. These investigations involved the personal distribution and collection of a questionnaire survey seeking the occupants' perceptions (scored on a 7-point scale) of some 45 factors: Operational (including image, meeting rooms, and storage); Environmental (including temperature, air quality, lighting, and noise); Personal Control; and Satisfaction (including design, needs, comfort overall, productivity, and health). The resulting scores were combined in various ways to produce indices for different aspects of performance, such as Comfort and Satisfaction and an overall Summary Index
Occupants were also invited to comment on several aspects of the building, most of which corresponded directly to one of the above factors. While not all respondents took up that invitation a significant number did so, and although it was not one of the main aims of the project, the researchers were curious to see if the comments correlated in any meaningful way with the scores. The factors Productivity and Health were selected for a ‘pilot’ study and preliminary analysis revealed some intriguing findings [
15].
In terms of the nature of the comments, these were placed into three categories: positive, negative, and balanced. As would be anticipated, the greater the number of positive comments, the better the perception score, and vice-versa. However, it appeared that it only required around 25% of the comments to be positive for the perception score to exceed the mid-point of the seven-point scale, whereas 50% or more of negative comments were needed before the score fell under that point. In both instances, Productivity and Health, the relevant correlation coefficients (ranging from 0.40 to 0.63) indicated moderate to strong relationships between the scores and the comments. That pilot study was later extended to factors related to the amount of Personal Control occupants had over different aspects of their internal environmental conditions—heating, cooling, ventilation, lighting, and noise [
16]. In this case the only correlation of any note was between the amount of control over noise and the corresponding set of negative comments, and even that was relatively weak with a correlation coefficient of only 0.28.
Intrigued by these finding, the authors resolved to investigate the matter further by expanding the survey programme to include more buildings, undertaking the analysis for more of the factors, checking how well individual’s comments corresponded with their scores, and exploring how this feature (assuming it was proven to be real, consistent and predictable) could be used in practice.
In this paper the authors outline the nature of the buildings and their occupants in this larger sample; list the specific questions for which comments were invited; tabulate the correlations found in respect of nine specific factors and the overall Summary Index, together with some sample plots; show graphically some examples of the scores and the nature of the corresponding comments; and speculate on the potential application of this knowledge in the analysis and prediction of building performance from the perspective of the user.
2. Research Design and Methods
Accordingly then, the sample was extended by a further sixteen to give a total of forty-seven buildings, and all nine aspects for which a comment was sought were analysed to determine the level of correlation between the nature of the comments and the average scores for each.
The forty-seven buildings were located in the following countries:
Australia 7
Canada 4
Germany 1
India 2
Ireland 1
Japan 2
Malaysia 2
New Zealand 19
Singapore 1
the UK 6
the USA 2
The ‘original’ thirty-one had been selected on the basis of their sustainability ‘credentials’. This was also the case for eight of the additional sixteen, all of which were located in New Zealand. All forty-seven were commercial or institutional in nature, housing anything from 15 to around 350 staff. Twenty-seven of the buildings accommodated office activities predominantly, twelve were tertiary-level academic teaching buildings, four housed laboratories or research organisations, two were libraries and two contained a combination of light industrial and administrative functions. Most of the buildings were in temperate climates of one kind or another (ranging from warm-temperate to cold-temperate). Their systems of ventilation ranged from full air conditioning, through mixed-mode, to natural ventilation.
Of course, willingness on the part of the building owner and tenants to be surveyed was also an essential prerequisite, and not all building owners approached felt in a position to accept our invitation. Much as one would like the sample of buildings to be random or structured in some way, it is rarely feasible in this kind of research. Hence, one has to be aware of the context for each case study and ever vigilant for potential bias in the mix. As noted earlier, these investigations involved the researchers in visiting each building to distribute and collect the completed questionnaires in person and to be available to answer any queries from individual respondents. This ensured a very high response rate (anything from 85 to 100 per cent) from the staff present in the building. Given that we wished to compare the nature of the comments with the average scores, a high response rate was vital in order to ensure we ‘captured’ the ‘silent majority’ as well as those who were sufficiently motivated to make a comment, of whatever nature, about some aspect of the building.
The questionnaire has evolved over several decades, from a 16-page format used for the investigation of sick building syndrome in the UK in the 1980s, to a more succinct 2-page version.
Developed by Building Use Studies [
13] for use in the Probe investigations [
17], it is available under licence to other investigators. Analysis of the responses yielded a mean value (on a 7-point scale) for each variable.
These were subsequently entered into an SPSS spreadsheet for further analysis by the authors.
The relevant questions (i.e., those where respondents were invited to provide a comment as well as a score on the 7-point scale) were as follows:
Overall Design—“All things considered, how do you rate the building design overall?”
Needs Overall—“In the building as a whole, do the facilities meet your needs?”
Meeting Rooms—“Availability of meeting rooms?”
Storage—“Suitability of storage arrangements?”
Comfort Overall—“All things considered, how do you rate the overall comfort of the building environment?”
Noise Overall—“How would you describe noise in your normal work area, overall?”
Lighting Overall—“How would you describe the quality of lighting in your normal work area, overall?”
Health—“Do you feel less or more healthy when you are in the building?”
Productivity—“Please estimate how you think your productivity at work is decreased or increased by the environmental conditions in the building?”
In the case of these last two, Health and Productivity, occupants were asked “please try to evaluate this building with respect to your experience of using buildings in general”, while in the case of Productivity occupants were asked to indicate their response on a 9-point scale ranging from ‘–40% or less’ to ‘+40% or more’ with 10% intervals, rather than the 7-point scale employed for all the other aspects. In addition, respondents were invited to give examples of “things which usually work well” and “things which can hinder effective working” in respect of their specific work requirements.
The subsequent analysis involved the calculation of three indices, all of which are based on a ‘–3’ to ‘+3’ scale, where ‘+3’ is considered ‘best’: a Comfort Index which encapsulatesthe overall scores for Comfort, Lighting, Noise, Temperature in both winter and summer and Air in both winter and summer; a Satisfaction Index which involves the scores for the Design, Needs, Health, and Productivity factors; and a Summary Index which is simply the arithmetical average of the Comfort and Satisfaction Indices. Here, correlation between the Summary Index and total numbers of comments were also investigated.
4. Correlations between Scores and Comments for the Dataset
Given that not all respondents ventured a comment, it was of interest to see if there was any inherent bias or correlation between the nature of the comments and the scores. For this analysis, the positive, negative, and balanced comments for each building (expressed as a percentage of the total number of comments received for that aspect of the building) were correlated against the scores for the corresponding factors. The results are listed in Table 2. Interpreting Correlation Coefficients in the range 1.0–0.8 as very strong, 0.8–0.6 as strong, 0.6–0.4 as moderate, and 0.4–0.2 as weak [
18] it can be seen that the positive and negative sets of comments were at least moderately correlated (R > 0.4) with the scores for virtually all of the aspects considered (the only exception being Needs Overall in terms of negative comments). Reassuringly, the coefficients corresponding to each of the positive and negative comment were also positive and negative respectively. As might have been anticipated, the balanced comments were at best only weakly correlated with the scores—indeed six of them were under 0.2.
Table 2.
Correlation Coefficients (R values) and Coefficients of Determination (R2 values) between average scores and percentages of total comments for nine aspects of the buildings, and the Summary Index.
Table 2.
Correlation Coefficients (R values) and Coefficients of Determination (R2 values) between average scores and percentages of total comments for nine aspects of the buildings, and the Summary Index.
| ASPECT | R VALUES | | R2 VALUES |
|---|
| positive | balanced | negative | | positive | negative |
|---|
| Overall Design | 0.776 | 0 | –0.833 | | 0.602 | 0.694 | |
| Needs Overall | 0.533 | 0.130 | –0.214 | | 0.284 | 0.046 | |
| Meeting Rooms | 0.618 | 0.101 | –0.597 | | 0.382 | 0.357 | |
| Storage | 0.598 | 0.204 | –0.480 | | 0.358 | 0.231 | |
| Comfort Overall | 0.595 | –0.291 | –0.573 | | 0.354 | 0.328 | |
| Noise Overall | 0.394 | 0.359 | –0.536 | | 0.155 | 0.287 | |
| Lighting Overall | 0.539 | –0.117 | –0.466 | | 0.291 | 0.218 | |
| Productivity | 0.674 | 0.045 | –0.818 | | 0.454 | 0.669 | |
| Health | 0.817 | –0.215 | –0.727 | | 0.668 | 0.529 | |
| Summary Index | 0.827 | –0.150 | –0.853 | | 0.683 | 0.727 | |
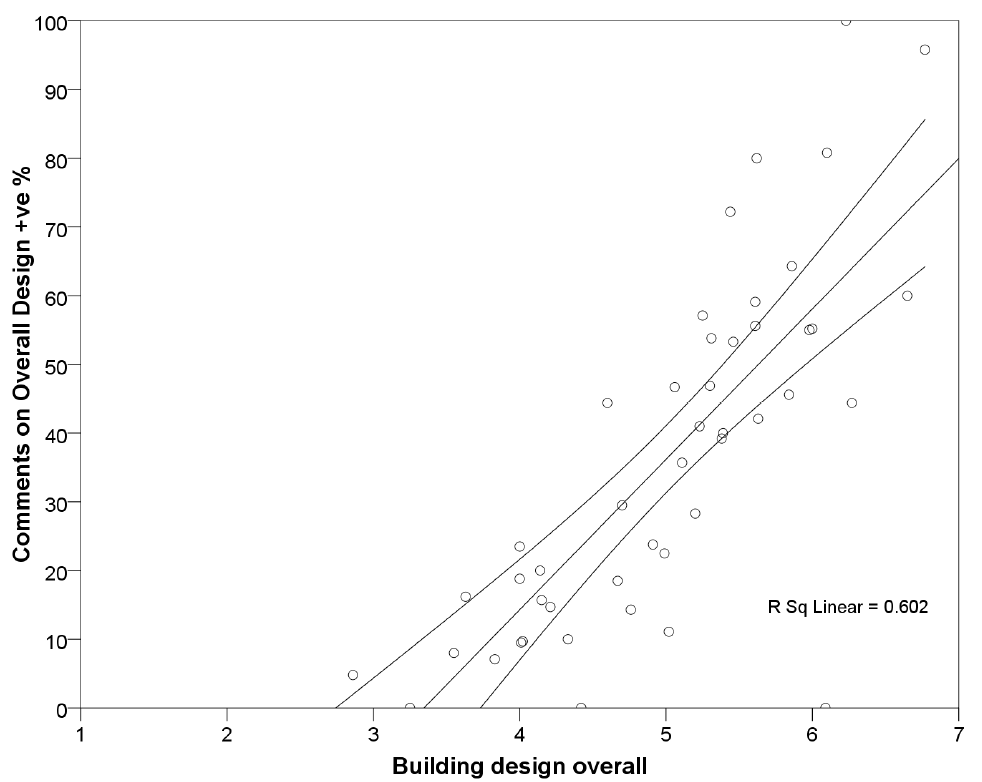
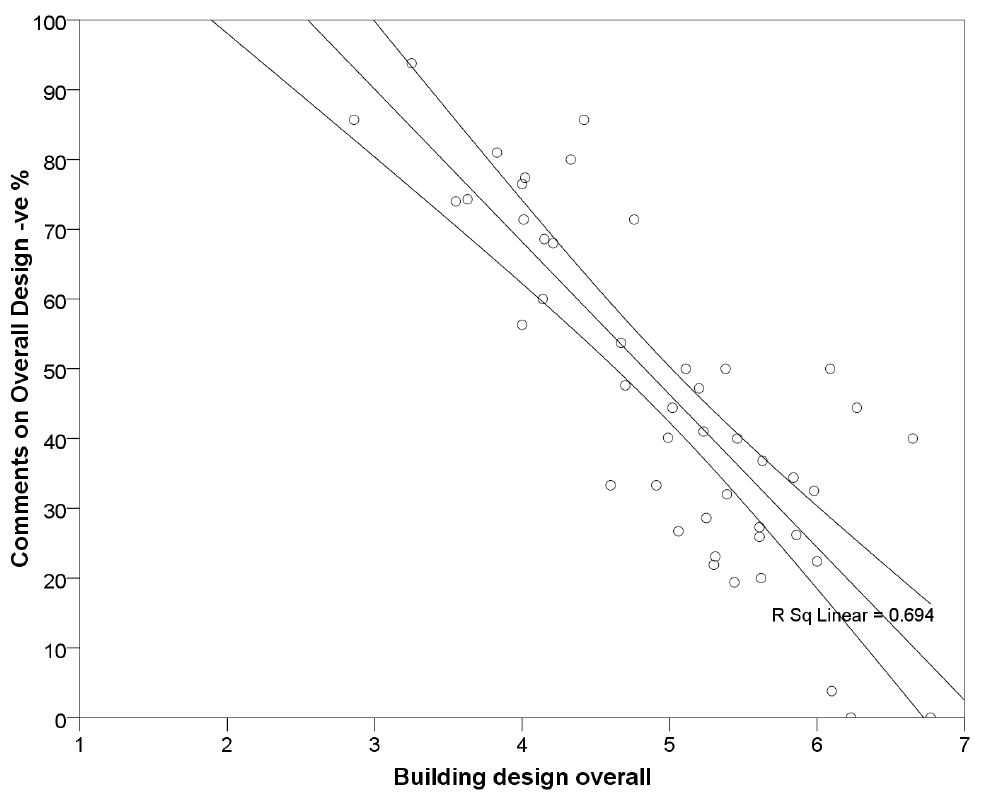
Overall Design, Productivity, Health, and the Summary Index all had correlations in the strong to very strong bands for both positive and negative comments, the last named being particularly strong at 0.827 and –0.853 respectively. Meeting Rooms and Comfort Overall were around the borderline between moderate and strong. By way of illustration, the graphs of the correlations between the average scores for the factor Overall Design for each building in the set, and the percentages of positive and negative comments are presented in Figure 1 and Figure 2. The corresponding Coefficients of Determination are also listed on Table 2 and noted on the figures. These values represent the percentage of variance in the comments that can be explained by the variance in the scores.
The next step taken was to take a closer look at all of the graphs to see if any common features had emerged in terms of the gradients of the lines of best fit or their intercepts with the x-axis (the scores in this case).
Table 3 summarises the relevant information for each aspect and for both positive and negative sets of comments.
Figure 1.
Graph of percentage of positive comments vs average scores for Overall Design.
Figure 1.
Graph of percentage of positive comments vs average scores for Overall Design.
Figure 2.
Graph of percentage of negative comments vs average scores for Overall Design.
Figure 2.
Graph of percentage of negative comments vs average scores for Overall Design.
Table 3.
Correlation Coefficients, Lines of Best Fit and X-axis intercepts for different aspects of the buildings.
Table 3.
Correlation Coefficients, Lines of Best Fit and X-axis intercepts for different aspects of the buildings.
| BUILDING ASPECT AND OVERALL SCORE | CORRELATIONS, EQUATIONS AND INTERCEPTS |
|---|
| POSITIVE | NEGATIVE |
|---|
| R value | Equation | X-intercept | R value | Equation | X-intercept |
|---|
| Overall Design5.01 | 0.776 | y = 21.879x – 73.21 | 3.35 | –0.833 | y = –21.889x + 155.75 | 7.12 |
| Needs Overall5.05 | 0.533 | y = 9.8233x – 32.599 | 3.32 | –0.214 | y = –5.1082x + 92.451 | 18.12 |
| Meeting Rooms4.94 | 0.618 | y = 15.349x – 55.533 | 3.62 | –0.597 | y = –15.663x + 136.14 | 8.69 |
| Storage4.16 | 0.598 | y = 10.214x – 33.376 | 3.27 | –0.480 | y = –13.61x + 132.02 | 9.70 |
| Comfort Overall4.82 | 0.595 | y = 18.964x – 57.348 | 3.02 | –0.573 | y = –18.024x + 135.31 | 7.51 |
| Noise Overall4.35 | 0.394 | y = 6.8903x – 22.553 | 3.27 | –0.536 | y = –14.645x + 138.67 | 9.47 |
| Lighting Overall5.12 | 0.539 | y = 16.525x – 57.083 | 3.45 | –0.466 | y = –14.068x + 128.48 | 9.13 |
| Productivity+ 2.02% | 0.674 | y = 1.5893x + 18.967 | 11.93 | –0.818 | y = –2.1443x + 49.011 | 22.86 |
| Health4.04 | 0.817 | y = 30.179x – 98.243 | 3.26 | –0.727 | y = –28.469x + 164.12 | 5.76 |
| Summary Index | 0.827 | y = 10.267x + 20.391 | –1.99 | –0.853 | y = –9.6631x + 65.563 | 6.78 |
Looking first at the positive comments it can be seen that (other than for Productivity and for the Summary Index which do not use the 7-point scale) there is some consistency in where the line of best fit cuts the x-axis. Values range from 3.02 to 3.62, with an average around 3.32. In terms of the slopes of the graphs, bearing in mind that a 45° gradient would be around 14.3, the values here range from the gradual (approx 6.9 for Noise Overall) to the steep (approx 30.2 in the case of Health). The average of the eight relevant aspects works out to around 16.23.
Turning now to the negative comments, it can be seen that the x-axis intercept ranges from 5.76 in the case of Health to 9.70 in the case of Storage, and averaging around 8.2 (the value of 18.12 in the case of Needs Overall was discarded since its correlation coefficient was particularly weak). Once again there is a range of gradients, from around –13.6 to –28.5, with an average of –18 (again discarding the value for Needs Overall).
5. Individual Case Studies
It was also deemed to be of potential interest to have a look at how individual occupants who made a comment about a particular aspect of their building actually scored that aspect. Would these correspond consistently, or might individuals score an aspect highly, while still offering what could be interpreted as a negative comment, or vice versa? For the purposes of this exercise, two buildings (designated A and B) were selected for further study, one with a particularly high Summary Index in the 2.5–3.0 range, the other more average, in the 0.0–0.5 range. Both had high overall response rates and above average comment rates (38 and 51 per cent respectively). For each aspect,
Table 4 lists the number of respondents who made either a positive, a balanced, or a negative comment, and the number who made no comment, together with the mean score for each of these groups. For both buildings, the mean score for the groups who made positive comments was the highest, and that for the groups who made negative comments was the lowest, for virtually every aspect—the overall averages were 6.78 and 4.32 for Building A and 5.24 and 2.99 for Building B—no surprises there. The means for the group who made no comment (the majority in both cases) lay between these extremes averaging 6.29 and 4.59 respectively over all aspects. On average, these ‘no comment’ means were much closer to the positive than the negative comment means. While the relative proportions of positive and negative comments are in line with what might have been anticipated from their respective Summary Indices, the proportion making no comment remains high in both cases, at around 63 and 53 per cent respectively—a substantial ‘silent majority’.
Table 4.
Number and nature of comments and corresponding average scores for two case studies.
Table 4.
Number and nature of comments and corresponding average scores for two case studies.
| Building A: High Summary Index—2.5–3.0 Range (Scale –3 to +3) |
|---|
| ASPECT | POSITIVE | BALANCED | NEGATIVE | NO COMMENT |
|---|
| Number | Mean | Number | Mean | Number | Mean | Number | Mean |
|---|
| Overall Design | 23 | 6.78 | 1 | 6.00 | 0 | – | 20 | 6.80 |
| Needs Overall | 5 | 7.00 | 2 | 6.00 | 4 | 6.25 | 33 | 6.73 |
| Meeting Rooms | 9 | 7.00 | 2 | 6.50 | 7 | 1.00 | 30 | 6.63 |
| Storage | 3 | 7.00 | 3 | 6.00 | 5 | 4.00 | 32 | 6.28 |
| Comfort Overall | 11 | 6.91 | 2 | 6.00 | 1 | 6.00 | 29 | 6.48 |
| Noise Overall | 3 | 6.00 | 5 | 4.60 | 12 | 3.83 | 23 | 4.96 |
| Lighting Overall | 7 | 6.57 | 3 | 5.67 | 8 | 4.50 | 25 | 6.12 |
| Productivity | 10 | 7.60 | 4 | 6.00 | 1 | 3.00 | 26 | 7.00 |
| Health | 11 | 6.18 | 2 | 5.00 | 1 | 6.00 | 29 | 5.62 |
| Totals/Means | 82 | 6.78 | 24 | 5.75 | 39 | 4.32 | 247 | 6.29 |
| Building B: Low Summary Index—0.0–0.5 range (Scale –3 to +3) |
| ASPECT | POSITIVE | BALANCED | NEGATIVE | NO COMMENT |
| Number | Mean | Number | Mean | Number | Mean | Number | Mean |
| Overall Design | 3 | 5.00 | 10 | 4.00 | 37 | 2.76 | 16 | 4.81 |
| Needs Overall | 4 | 5.25 | 6 | 3.67 | 20 | 3.65 | 36 | 4.94 |
| Meeting Rooms | 2 | 5.50 | 3 | 5.00 | 21 | 3.48 | 38 | 4.87 |
| Storage | 7 | 5.57 | 4 | 4.75 | 13 | 2.54 | 41 | 4.90 |
| Comfort Overall | 7 | 5.71 | 3 | 4.33 | 7 | 2.71 | 49 | 4.47 |
| Noise Overall | 0 | – | 6 | 5.50 | 28 | 3.54 | 31 | 4.74 |
| Lighting Overall | 3 | 4.67 | 5 | 4.80 | 29 | 3.10 | 28 | 4.25 |
| Productivity | 4 | 6.25 | 7 | 5.43 | 20 | 2.85 | 33 | 4.55 |
| Health | 2 | 4.00 | 6 | 3.50 | 19 | 2.32 | 38 | 3.74 |
| Totals/Means | 32 | 5.24 | 50 | 4.55 | 194 | 2.99 | 310 | 4.59 |
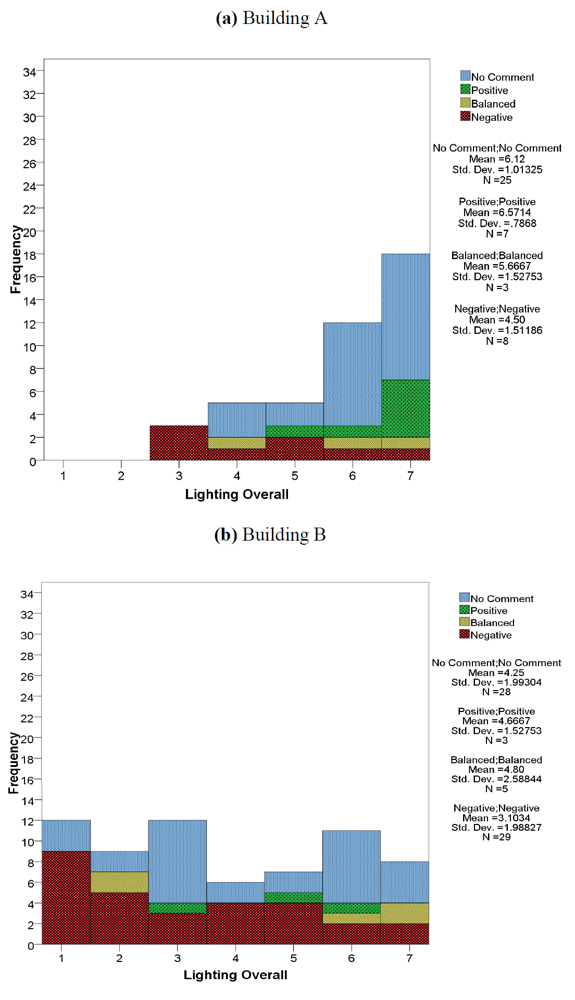
On the question of how closely scores and comments corresponded, all nine aspects were scrutinised. Space does not permit the reproduction of all nine graphs for both buildings, but Figures 3(a) and 3(b) illustrate some of the findings for Lighting Overall. In the case of Building A for example, which had an overall mean score of 5.86 for Lighting Overall, it can be seen that all seven of the positive comments correspond to scores greater than four, the mid-point of the scale. Negative comments on the other hand were spread through the full range of scores, with just as many above the mid-point as below. In the case of Building B, for which the corresponding overall mean score was 3.80, negative comments predominated and again are spread across the full range of scores, though this time skewed to the lower end of the scale. The rather fewer positive and balanced comments are also spread across the range. Overall, it was found that positive comments can accompany low scores and vice versa.
Figure 3.
Histograms indicating scores and nature of the corresponding comments for Lighting Overall.
Figure 3.
Histograms indicating scores and nature of the corresponding comments for Lighting Overall.
6. Discussion
The extended survey reinforced the finding that around one-third of respondents to this questionnaire will make a comment on a range of aspects of their building when invited to do so, and that the majority of these will be negative and outweigh the positive comments by more than 2 to 1 on average. Reassuringly, when asked to note hindrances and things that help, the ratio is close to 1. Nevertheless, when the ratio exceeds a value of 10, as in the case of Storage and of Noise, clearly there are issues requiring attention.
The correlations between the average scores (for all respondents) and the numbers of positive and negative comments (expressed as a percentage of the total number of comments) were mostly in the moderate to strong range. Somewhat surprisingly, the correlations between the Summary Index and the sums of the positive and of the negative of comments (again expressed as a percentage of the total number of comments) turned out to be by far the best, with figures of 0.827 and –0.853 for positive and negative comments respectively. One might have anticipated such an index, being an amalgam of the results from eleven aspects, to have less chance of a good correlation, but clearly the greater numbers of comments (from all nine aspects and with the inclusion of the Work Well and Hinder comments) has resulted in a very strong correlation.
Of particular interest was the percentage of comments corresponding to the break-even point of zero on the Summary Index scale. For positive comments this was 20.4 per cent while for the negative it was 65.6 per cent. If one specifies a higher criteria, say +1, then the corresponding figures are 30.7 and 55.9 per cent. It is not until a Summary Index of around +2.3 is attained that the percentages of positive and negative comments are around the same value (approx 43 per cent) the slopes of the two lines being very close (+10.3 and –9.7 respectively—see
Table 3).
Individual aspects demonstrated a consistent pattern. Although different aspects had different gradients, most of those with good correlations had similar positive and negative gradients (see
Table 3). The percentages corresponding to the break-even points (4 in the case of the 7-point scales) ranged from 5 to 23 with an average around 11 (positive) and from 50 to 80 with an average around 70 (negative) possibly indicating differences in users’ sensitivities.
It was also reassuring to see that respondents’ scores could spread over the full range (1 to 7) no matter their propensity to comment in a particular way, or not. Users appear to be quite capable of scoring the performance of the buildings they occupy to a relatively fine degree, and some respondents had no trouble commenting on specific issues adversely, while still scoring that aspect highly—and vice versa. As Gary Raw aptly said “people are the best measuring instruments. They are just harder to calibrate” [
19].
This paper has attempted just such a calibration. All the indications are that even a moderate proportion of negative comments is not in itself a good indicator of overall building performance. However, the very strong correlation between the Summary Index (which took account of the overall scores for eleven factors) and the proportions of positive and negative comments shows considerable promise as a tool for assessing building performance.
7. Conclusions
On the basis of the above findings and discussion, and bearing in mind the nature of the buildings (a small number of mainly office and institutional facilities, with sustainability credentials and from predominantly western countries) we feel it feasible to put forward the following tentative conclusions:
Generally speaking, negative comments on most aspects of building performance will tend to outweigh the positive. However, a ratio any greater than (say) 5:1 should provide an alert, and any over 10:1 should warrant urgent investigation.
The sums of the positive and the negative comments (expressed as a percentage of the total number of comments) were very strongly correlated with the Summary Index (itself an amalgam of eleven aspects of performance) and thus have the potential to provide an initial indication of overall performance.
A positive comment rate ofaround 20 per cent is all that is required to achieve a Summary Index ofzero (on a –3 to +3 scale); while the equivalent negative rate is around 65 per cent. Individual aspects exhibit a similar pattern.
These findings are further confirmation that building occupants are quite capable of assessing and scoring the performance of the buildings they occupy consistently and to a relatively fine degree.
For the future it would be desirable to continue undertaking such surveys using the same questionnaire—to build up a larger database, enable further analysis of more homogeneous sets of buildings, determine whether the same pattern continues to emerge, and develop a simple tool (or perhaps a valid “
short-cut” to use the term coined by Bluyssen
et al. [
20] in a recent paper) for assessing building performance based on the rate and nature of comments.

