
Lessons Learned from Information Sources on Building Defect Studies

Department of Civil and Environmental Engineering, Norwegian University of Science and Technology (NTNU), 7034 Trondheim, Norway
*
Author to whom correspondence should be addressed.
Buildings 2024, 14(5), 1231; https://doi.org/10.3390/buildings14051231
Submission received: 19 March 2024
/
Revised: 11 April 2024
/
Accepted: 19 April 2024
/
Published: 26 April 2024
(This article belongs to the Section Construction Management, and Computers & Digitization)
Abstract
:Building defects are very prevalent and contribute significantly to a building’s economic value. There are numerous information sources on building defects that have significant potential for learning more about building defects. This study aimed to identify the information sources used in previous building defect studies and to identify the motivation for carrying out such studies. To fulfil this aim, a scoping study was carried out. The information sources identified included insurance companies, private databases, questionnaire surveys, lawsuits, building surveys, client complaint forms, and maintenance reports. This study found that insurance company and client complaint forms include the largest collection of real building defect cases, but such databases may lack detailed descriptions of the causes of the defects. The main purposes of building the defects studies identified here included design challenges, identification of defects, building maintenance management, quality management, systematization in data collection, providing an overview of typical defects, and classifying defects. Identification was found to be the most common purpose, indicating that the industry wants to learn more. This study identified research gaps in the climate perspective in relation to building defects. Most of the studies focused on the economical perspective, and none focused on the carbon footprint perspective. This study provides an overview of information sources, which can motivate stakeholders to collaborate in learning about the physical causes of building defects as well as about other key aspects such as fault, finances consequences, and procedural causes.
1. Introduction
Building defects not only incur great economic cost but also contribute to more material extraction and construction emissions, therefore increasing the building’s carbon footprint. Building defects occur worldwide, and the monetary costs associated with repairing building defects are often used to describe the magnitude of building defects. For example, in residential and industrial buildings in Australia, the costs of rework were found to be 3.15% and 2.40% of the buildings’ value, respectively [1]. Another study in Australia indicated that building defects contribute 4% of the total construction costs [2]. In 2004, a study in Denmark showed that reworking building defects cost about EUR 1.6 billion, which was 10% of the sector’s turnover [3]. According to SINTEF, the cost of repairing building defects in Norway accounts for between 2% and 6% of the annual capital invested in new buildings [4]. Another survey by Norsk takst [5], a professional organization for appraisers in Norway, indicated that this value is much higher, stating that 12% of a building’s costs come from the repair of building defects during construction. The variation in financial estimates may indicate that a reliable overview of the extent of building defects is lacking, for example, due to a lack of systematization in the collection of the defect cases.
To reduce costs, time, and emissions related to buildings, building defects need proper attention so that the stakeholders can gain important knowledge about the issue [6]. A better understanding of defect causes will form a basis for improving the quality of buildings [7]; thus, it is important to gather building defect information systematically and to identify patterns and relations [8,9,10]. Today, it is possible to gain insight from a range of different building defect information sources if provided access to them, for example, by using machine learning and artificial intelligence.
For the present study, the building defect definition given by Ingvaldsen [4] was primarily used: “A damage or flaw that compromises the quality of the building or building part”. Another commonly referred to definition, which is more specific but in line with reference [4], is given by Watt [11]: “A defect is the term used to define a failing or shortcoming in the function, performance, statutory or user requirements of a building, and might manifest itself within the structure, fabric, services or other facilities of the affected building”. Several other definitions of building defects exist. For example, Pedersen et al. [12] limit building defects to “deviation from regulation on technical requirements for construction works”. Furthermore, Mundt-Petersen et al. [13] classify defects as follows: Damage, “when a material or building component has lost its essential properties”, failure, “a clear deviation from proper procedures”, and functional defect, “not fulfilling needed feature requirements”. In addition, quality is defined by Arditi and Günaydın [14] as “meeting the legal, aesthetic, and functional requirements of a project”.
Kvande and Lisø [15] distinguish between three main types of building defects, shown in Figure 1, including defects due to flawed construction (design and execution), due to flawed use, or due to flawed maintenance. Of these, process-induced building defects are caused by faulty design or execution in the as-built building or faulty repair. Damage that occurs because of normal wear is not regarded as building defects by the authors of references [4,15].
There are many scientific studies on building defects with a variation of databases, cases, motivation, and solutions on the issue of building defects. The purpose of this paper was to identify the currently available types of databases on building defect cases and to gain an understanding of the pros, cons, and what kind of learning that may be drawn from the different sources. It is not the intention of this paper to map all of the scientific papers dealing with building defects. To guide the investigation, the following research questions were asked.
- 1.
- What types of information sources are available regarding building defects?
- 2.
- What are the main purposes for the scientific studies of building defects?
- 3.
- How can the findings from the literature survey be used further?
2. Materials and Methods
2.1. Scoping Studies
A scoping study was conducted to obtain an overview of the state of art in the knowledge of building defects and to identify research gaps [16]. Arksey and O’Malley’s [17] approach was used by following the five stages of their framework:
- 1.
- Identifying the research questions;
- 2.
- Identifying relevant studies;
- 3.
- Study selection;
- 4.
- Charting the data;
- 5.
- Collating, summarizing, and reporting the results.
The overall process for this research is illustrated in Figure 2.
Based on the initial search (Step 2), the following key words (Step 3) of the literature survey were “building defects”, “moisture”, and “water”. The key words for the literature survey were limited to “water” and “moisture” defects because such damages are the most widespread and the most prevalent according to reference [6]. However, research on other defects was also included to obtain a broader understanding of the information sources for building defects. Web of Science, Scopus, and ScienceDirect were the databases used for the systematic search (Step 4). These databases were used because they include scientific papers within subject areas such as engineering, material science, law, business, management, and environmental science. The number of documents found using different search strings of these keywords in the databases are shown in Table 1. These are the articles identified after Step 4 in Figure 2. While a range of building defect definitions exist, it may be difficult to compare the findings from the different surveys because some studies may include flaws or faults that are excluded by others.
The evaluation of the articles (Step 5) was performed by assessing the titles and keywords. A total of 70 articles were identified; therefore, no further expansion of the search was made (Step 6). The selection process of the articles (Step 7) started with an assessment of the abstract before the full text was viewed. A total of 36 articles were identified as relevant literature. The other 34 articles were excluded for one or more of the reasons below:
2.2. Reflexive Thematic Analysis
The type of information source and the main purposes of the articles were categorized using a reflexive thematic analysis. The purpose of this method is to obtain an overview of the literature and to identify patterns. The reflexive thematic analysis was performed following the six steps from reference [33]:
- 1.
- Becoming familiar with the data;
- 2.
- Generating initial codes;
- 3.
- Searching for themes;
- 4.
- Reviewing themes;
- 5.
- Defining themes;
- 6.
- Writing-up.
3. Results
3.1. General Overview of the Literature
A general overview of the 36 scientific articles is given in Table 4. The first bullet point for each article is the main categorization for the study, and the remaining bullet points are Supplementary Information about the studies.
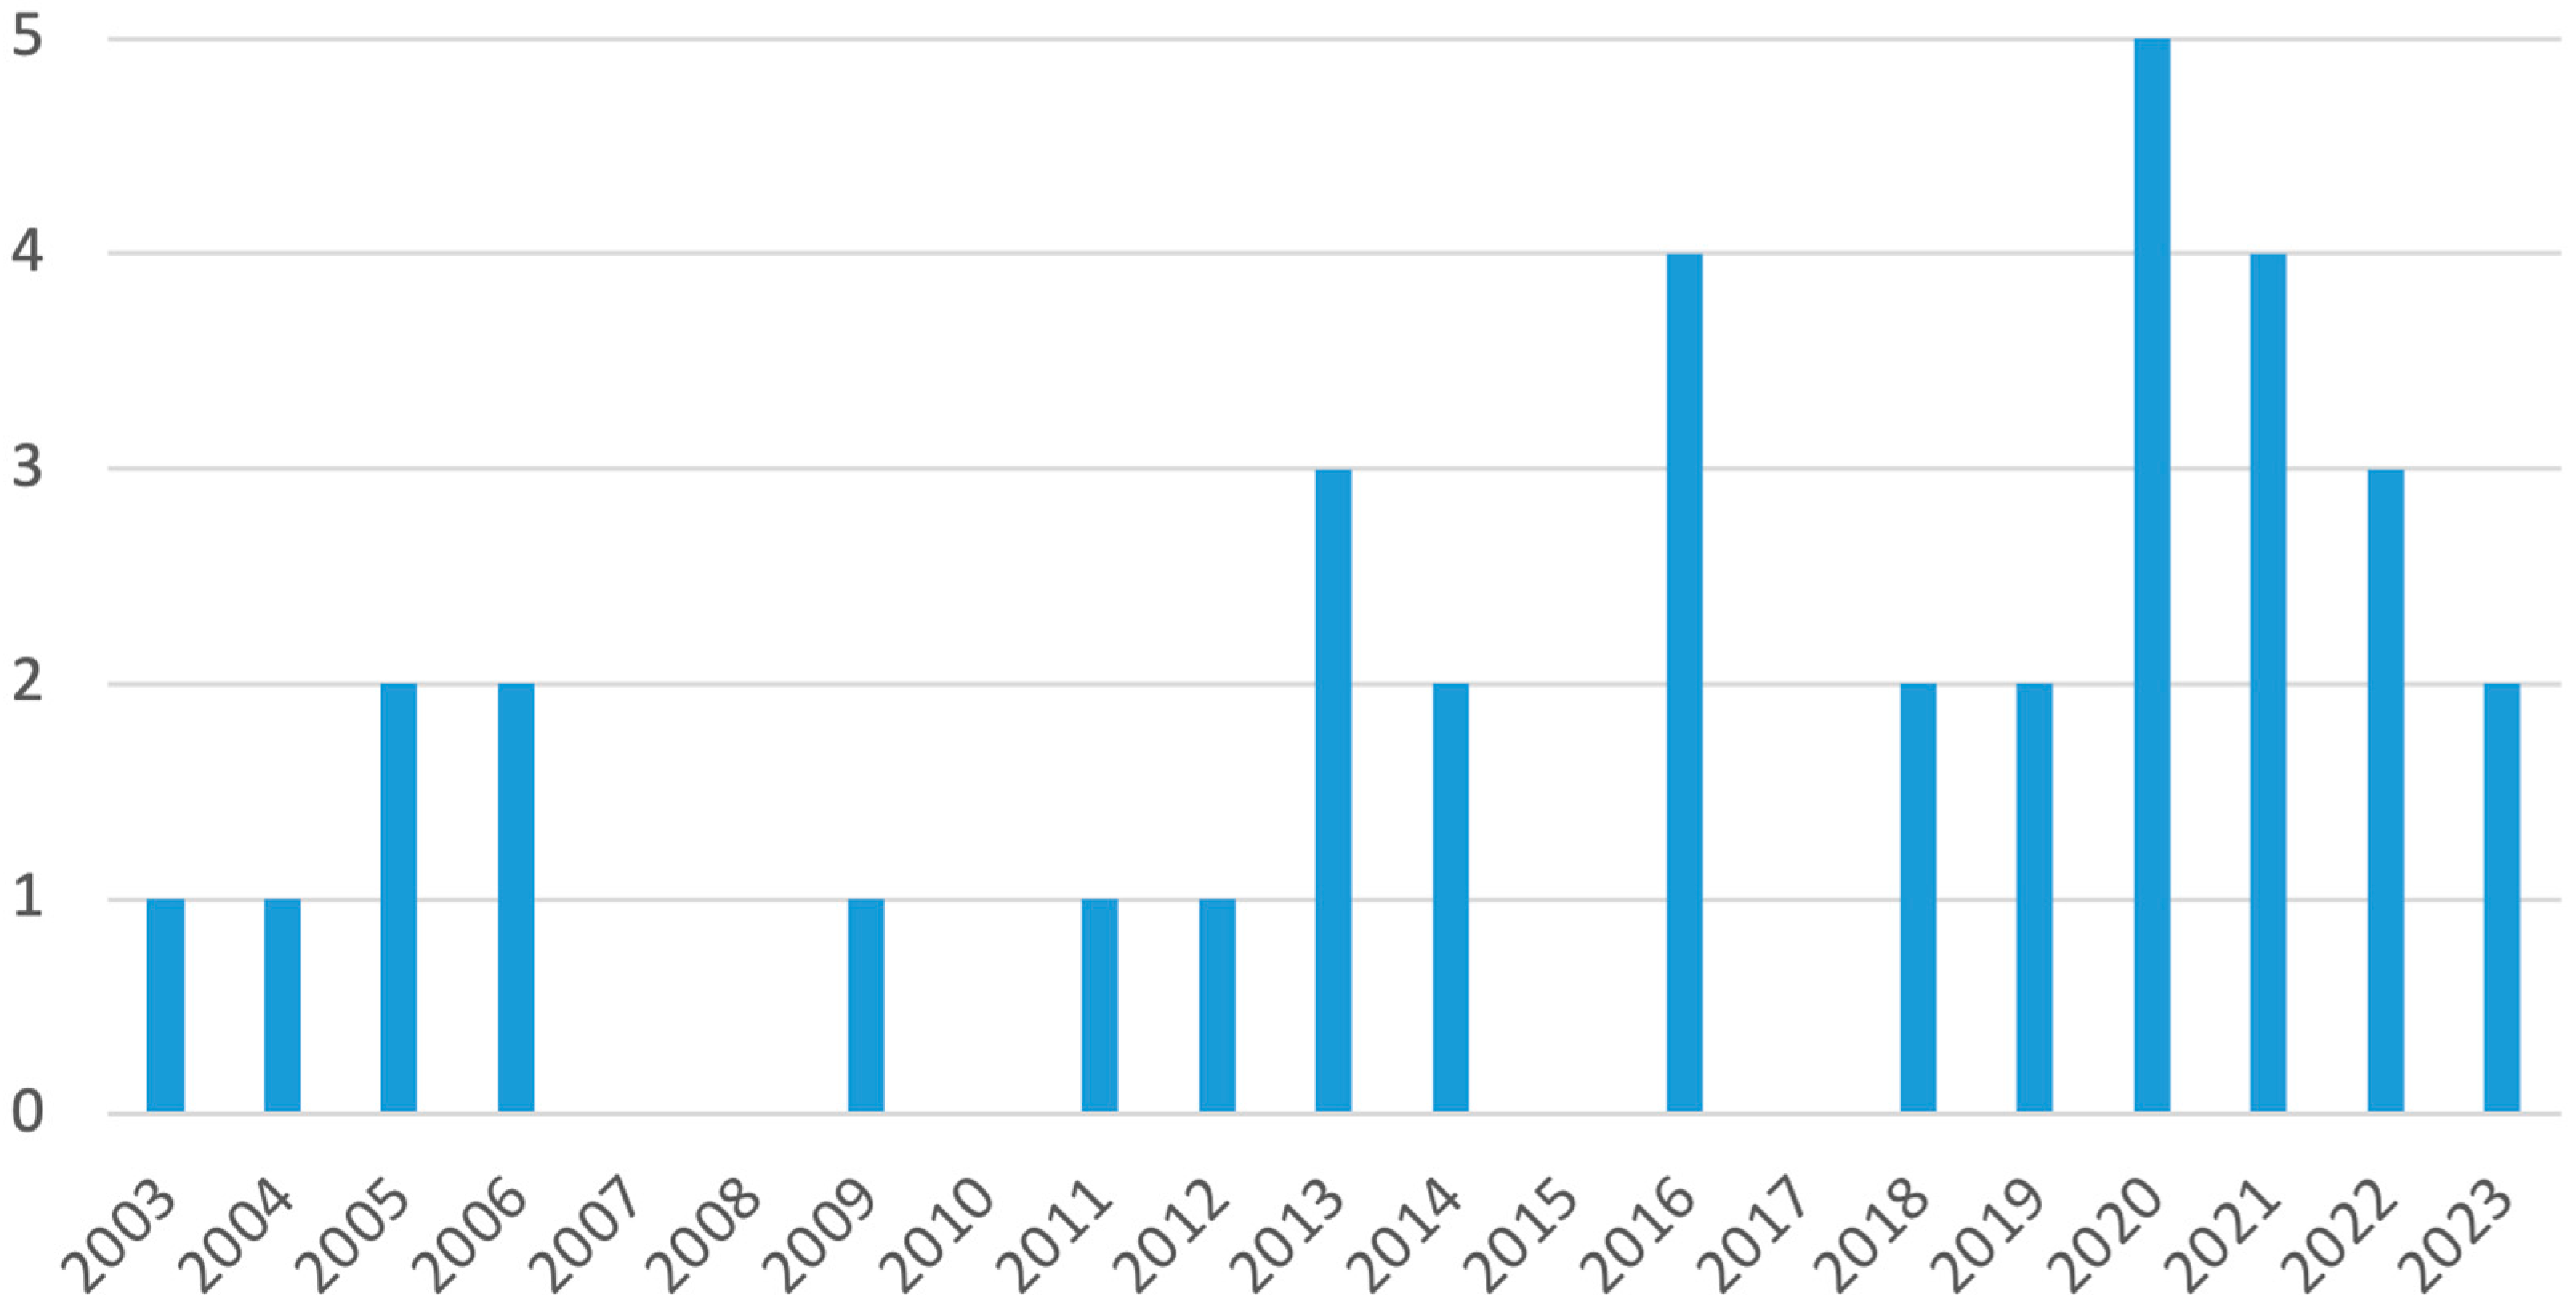
Of the identified articles, the trend shows that the number of articles per year increased. There were 12 scientific articles published between 2003 and 2013 and 24 between 2014 and 2023, as shown in Figure 3. The most attention is given from Malaysia, Norway, and Spain, with 7, 6, and 4 scientific articles, respectively.
3.2. Type of Information Source
The distribution of the information sources used in the articles is given in Figure 4. The articles per category are presented in the following sections.
3.2.1. Insurance Company Database
The papers by De Vos et al. [8] and Van Deen Bossche et al. [9] were based on a collection of building defect cases from 1991 to 2019 provided by the largest Belgian insurance company. The total amount of cases collected was 27,074, which were processed and filed by jurists or engineers. Of these cases, De Vos et al. [8] selected four categories to analyze, which included problems with moisture, stability, cracking, and residential nuisance. These categories included 13,068 of the total number of cases. Van Deen Bossche et al. [9] selected six categories to analyze, which were problems with moisture, stability, neighbor damage, HVAC, acoustics, and energy efficiency. Only 9918 cases remained because the postal code and building category were required for the study.
A similar study from Australia by Sandanayake et al. [2] used data collected by the Victorian Managed Insurance Authority (VMIA) between 2011 and 2018. The insurance company had gathered a total of 8128 defects, and this study analyzed 3048 unique claims of the total.
3.2.2. Private Databases
Lisø et al. [34] investigated building defects by analyzing 175 assignment reports by the former building research institute Norges byggforskningsinstitutt (NBI) from the period between 1963 and 2001. Later, NBI merged with SINTEF, and they assembled a substantial building defect archive gathered from investigation cases and field studies from the Norwegian building industry over the last 60 years [63]. Multiple articles have used the SINTEF archive as a database [6,35,36,37]. Lisø et al. [6] investigated a dataset of 2423 cases collected from the reports between 1993 and 2002. Gullbrekken et al. [36] performed a more thorough investigation on Norwegian pitched roof defects from the same period (1993 to 2002). A special study on masonry defects was conducted by Kvande and Lisø [35] based on 302 process-induced defect assignments from the archive between 1983 and 2002. Finally, Kvande et al. [37] summarized the results of laboratory experiments on external thermal insulation composite systems (ETICS) as well as defect causes. A total of 6% of the defects in the SINTEF archive were related to ETICS between 1993 and 2002 [6]. A total of 61 buildings had ETICS defects in the period of 1993 to 2017, and 150 causes were identified [37].
In Australia, Ilozor et al. [38] studied the Archicentre’s database for residential building defect inspections. A total of 42,753 houses were inspected, and the defects identified were systematically collected in the Archicentre’s database. Another Australian database, collected by The Victorian Civil and Administrative Tribunal (VCAT), was used by Pamera and Gurmu [39] to select five cases so that the most prevalent defects of these could be analyzed further.
In Korea, multiple studies have investigated defects from several residential buildings between 2008 and 2017 [10,40,41]. Lee et al. [40] examined 16,701 defects from 133 residential buildings to make a defect risk profile, while Lee et al. [41] examined 7554 defects from 48 residential buildings to evaluate the impact of defect risk in the user phase. Lee et al. [10] examined 6087 defects from 48 residential buildings and classified them into a defect classification matrix based on the defect liability period.
The database of a Polish developer with collected warranty period reports was used by Plebankiewicz and Malara [42] to identify typical defects and their occurrence between 2018 and 2020. A total of 560 defects were found in the warranty period for 432 flats. The authors validated 353 of the cases.
The collected information from four Malaysian specialist waterproofing contractors was used by Talib and Sulieman [43] to analyze building defect cases. The information was based on 1363 defect cases.
Mundt-Petersen et al. [13] collected building defect data from the private databases of six Swedish accredited damage investigators. A total of 1105 defects from 265 damage investigation reports were investigated.
3.2.3. Questionnaire Surveys
In Malaysia, there were several studies on building defects based on questionnaire surveys. A literature review was conducted by Islam et al. [44], where 42 design challenges and 11 mitigation measures were identified. The authors distributed 300 questionnaires and collected 118 responses. All the respondents had first-hand experience from the maintenance industry. Almost half of the respondents had more than ten years of experience, and 36% of the respondents were facility managers, 23% were consultants, 22% were building supervisors, 11% were quantity surveyors, and 8% were senior management. A study by Abdul-Rahman et al. [45] had users as the respondents, including 310 residents from affordable housing in Malaysia. Ahzahar et al. [46] gathered information for their study by interviewing 12 contractors and 29 consultants and conducting a questionnaire survey. The survey was sent to different actors in the Malaysian construction industry. The study by Jesumoroti et al. [46] used medical officers and nurses as the respondents, and 93% of the respondents had work experience and academic backgrounds. A total of 63 defects were reported. The study by Talib and Sulieman [48] had 86 industry actors as the respondents.
More experienced Swedish respondents answered the questionnaire survey for the study by Jonsson and Gunnelin [48]. The participants in the survey were board members of cooperative owners, and these respondents together had experience from 1107 projects. A total of 1563 surveys were sent out, representing 394 residential buildings.
In order to collect the necessary data for analysis, Waziri [50] sent questionnaire surveys to 60 employees who worked in the offices of consultants, contractors, and building owners in Nigeria. A total of 47 questionnaires, which was a response rate of 73%, were obtained and analyzed. The respondents were in charge of either the design, building, or maintenance of residential buildings.
In Ethiopia, main stakeholders such as consultants, contractors, and clients were the respondents of the questionary survey by Awasho and Alemu [51]. The authors used the survey to gather primary data. A total of 49 respondents answered, of which 18 were consultants, 18 were contractors, and 23 were clients. This was a response rate of 84%. The respondents were distributed across nine projects.
3.2.4. Building Surveys
A building survey of 652 newly constructed residential houses in Iraq was investigated by Wali and Ali [52]. The survey was conducted directly after handover, and 6758 defects were discovered.
In Singapore, Chew [53] studied 56 high-rise non-residential buildings that were randomly selected by conducting a building survey and interviewing the property managers. Another study in Singapore by Chew and De Silva [7] studied cases from 67 high-rise residential buildings, ranging in age from 1 to 35 years old, using data received from site visits and accumulated reports. The reports were gathered from diverse actors in the industry such as maintenance managers, building diagnostic specialists, councils, etc.
3.2.5. Lawsuits
Sassu and De Falco [54] investigated lawsuits from the archives of district court judgments between 2000 and 2011 in Italy and classified the described defects. The court appointed an engineer to conduct an interim technical assessment on the cases to determine the causes and origin of the defects.
3.2.6. Client Complaint Forms
In Spain, there were several studies on building defects using client complaint forms as the dataset [55,56,57,58]. Forcada et al. [55] investigated handovers from 95 residential buildings and looked into the quality of flats and detached houses as reported by the occupants. Forcada et al. [56] and Forcada et al. [57] based their study on the database of four Spanish builders. The builders had collected data based on client complaint forms from post-handover, including 2351 defects from seven buildings. Forcada et al. [57] focused on the most common defects, and Forcada et al. [56] focused on the causes. By analyzing the client complaint forms of 2179 flats, a total of 52,552 defects were identified in the study by Forcada et al. [58].
Another post-handover study from Norway by Shirkavand et al. [59] assessed the most common building defects based on seven projects. In addition, the authors conducted nine interviews with employers from both client and contractor organizations. Of these, one was a construction manager, four were project managers, two were project developers, one was a design manager, and one was an energy consultant. All of them had a key role in the building projects. The seven projects had a total of 1549 building defects, 315 electrical defects, and 183 technical defects.
The client complaint forms from nine residential colleges in Malaysia were used as the dataset in a study by Dzulkifli et al. [60]. The forms collected were from the period of 2012–2017. The authors investigated 55,439 cases from 179 buildings.
3.2.7. Maintenance Reports
Pan and Thomas [61] studied 3209 defects in 327 newly built homes that were built according to the building regulation and the Code for Sustainable Homes in the United Kingdom. The dataset of the study was based on maintenance reports.
By conducting a nine-month survey of 74 buildings, Chong and Low [62] investigated latent building defects in the United States. The dataset of this study was mainly based on maintenance reports from the property managers. In addition, interviews and building surveys were conducted to verify the information from the reports.
3.3. Main Purpose and Findings of the Studies
The categorizations of the main purposes of the articles are given in Figure 5.
3.3.1. Design Challenges
Kvande and Lisø [35] had the main purpose of presenting design challenges related to masonry structures. The investigation of 302 masonry defects found restrained shrinkage and thermal movement to be the most frequent defect category. In addition, driving rain and frost action were found to be the most considered climatic challenges in maintaining high-performance masonry structures. Many of the crucial and often unrecoverable defects were found to be the result of minor errors or mistakes and could have been avoided with more detailed engineering.
Chong and Low [62] investigated design challenges and methods to prevent typical latent building defects. The survey of 74 buildings and systematic data collection showed that the main causes of design-related failures were impacts from weather and occupants and defects related to wet areas.
3.3.2. Identification
The main purpose of the study by Kvande et al. [37] was to identify the variables that affect the performance of ETICS with rendering. The study demonstrated that ETICS are vulnerable to intense driving rain and that the two-stage tightening approach is a more reliable option than ETICS in those locations. One of the most frequent causes of the ETICS defects identified was incorrect assembly of the ETICS components.
Shirkavand et al. [59] had the main purpose of identifying the most frequent building defects at handover in order to improve planning such that defects are reduced. In addition, the authors investigated the causes of the defects, improvement opportunities, and the consequences for the involved parties. Surface damage was the most common defect, but this type of defect is easily fixed at a low cost. The second most common defect was missing items and inappropriate installation. Technical installation faults were found to be the costliest flaws and were brought on by poor design. It was found that construction-related defects occurred in the last phase before handover and were the result of human errors, such as falling tools, due to time pressure caused by poor management. The consequences identified were economic losses, productivity losses, and delays.
To identify the most common defects, Dzulkifli et al. [60] investigated client complaint forms. The main finding was that 62% of the complaints were civil defects, e.g., defects in ironmongery elements, plumbing system issues, flooring issues, ceiling issues, or animal attacks on building components. A total of 60% of these were damaged components, 14% were leakages, and 13% were clogs. In addition, electrical defects represented 35% of the defects, and mechanical defects were 3% of the total.
Talib and Sulieman [48] also had the main purpose of identifying the most common defects. The study found that the origins of 99% of building defects were related to water seepage problems and that watertightness is therefore very important to keep in mind. The article was not clear on what type of water seepage occurred.
The identification of common building defects and finding methods to solve them was the main purpose of Talib and Sulieman [43]. A total of 18 building defects were identified. It was found that gutters and downspouts had the most defects, and that under sizing was the most common cause. The authors pointed out that optimizing the maintenance and operation functions could decrease the number of defects.
Identification of defect types was the main purpose of Mundt-Petersen et al. [13], but the study also looked at their location. The main findings of the study were that 81% of the defects were caused by moisture, and that most of the defects were mold growth. In addition, 70% of the defects were on-going and 20% were latent. The article was not clear on the origin of the moisture. It was also found that 28% of the defects were located in the exterior wall and that wooden materials were the most damaged material, comprising 40% of the cases.
A rather narrow study by Lisø et al. [34] had the main purpose of identifying typical defects that are associated with weather-protective flashing and providing best-practice solutions. It was found that 41% of the defects were related to windowsill/weatherboard flashings and 27% were related to parapet flashing.
A wider study by Pan and Thomas [61] had the main purpose of identifying building defects of new homes built according to the ‘Code for Sustainable Homes’. The authors studied the type of defect, frequency, location, severity, and the ones responsible. The study found that the mean average of defects per home was 9.8. The building defect category “making good or adjustments to the finished dwelling” comprised 709 defects, which was 22% of the total number of defects. Secondly, “malfunctions” comprised 386 defects, which was 12% of the total number of defects. Kitchens and bathrooms were identified as the locations with the most defects. Plumbers (23%), painters/decorators (19%), and electricians (11%) were identified to be the trades out of 14 categories that most often had to perform the rectification work that was reported.
Wali and Ali [52] also had the main purpose of identifying the types of building defects in newly constructed residential houses. An investigation of 652 houses revealed 6758 building defects, which was a mean of 10 building defects per house and thus was in line with the findings of Pan and Thomas [61]. The study identified 25 different types of defects and that gaps between doors/windows and walls were the most common defects (76%). This study also found that 48% of the defects were finish work, 42% were in doors and windows, 5% were electrical work, 3% were plumbing, and 2% were site work.
Jonsson and Gunnelin [49] looked at residential buildings from an owner’s perspective with the main purpose of identifying building defects in newly constructed buildings. In addition, the authors investigated the relation between the defects and the project’s characteristics and company size. This paper found that the most common defects were related to the building envelope, and that newly constructed buildings tend to have problems with HVAC systems. A total of 26% of the severe defects were related to leakage from rainwater, 19% were related to the heating system, and 18% were related to the ventilation system. The authors also found that the number of defects increased in big cities, and this could be because of the high demand due to population growth; therefore, quality is not a priority. In addition, it was found that big projects had an increased severity of defects and that medium-sized companies with 50–250 employees had the highest number of defects reported.
Chew and De Silva [7] limited their study to identifying defects in wet areas of high-rise residential buildings. In addition, they evaluated the significance of design, construction, maintenance, and materials. It was found that 36% of the defects were water leakage, 27% were paint defects, 10% were service pipe defects, 8% were spalling/cracking, 7% were fungi/algae, 4% were mastic failure, 4% were water ponding, 2% were tile staining, and 1% were cracking tiles. Of these, at least 57% were related to moisture or water. The authors found that the main causes of the defects were related to poor workmanship, inadequate detailing in design, poor design for air movement, ad hoc maintenance procedures, and unsatisfying material performance. The authors stressed that design, construction maintenance, and materials need adequate attention to improve the quality of buildings.
The main purpose of Plebankiewicz and Malara [42] was to identify the building defects occurring during the warranty period of residential buildings. They found that only half of the reported defects were valid and that the number of valid defects increased over time. It was also found that in the first three months, defects related to electrical installation were the most common, and the number of these defects decreased over time. However, there were few reports of flaws in windows, door joinery, balconies, terraces, moisture issues, of scuffs on walls throughout the first six months before the frequency of such defects increased.
The main purpose of Chew’s [53] study was to identify the sources of building defects and important risk factors that affect the maintainability level of wet areas in buildings. The study investigated the consequences of maintainability for watertightness, spatial integrity, ventilation, materials, and plumbing on the 14 most common defects in the wet areas of buildings. It was found that 53% of the defects were related to water leakages, 50% were related to the corrosion of pipes, and 47% were related to the spalling of concrete.
A risk matrix was used by Lee et al. [41] to identify the risks related to building defects. They found that defects in reinforced concrete, finishing, and mechanical/electrical/plumbing work resulted in the largest economic losses. The costs related to reinforced concrete were mainly caused by broken items and water problems. The causes in finish work were mainly related to broken items, detachment, incorrect installation, missing pieces, and surface appearance. Mechanical/electrical/plumbing work costs were mostly caused by affected functionality and incorrect installation.
Ahzahar et al. [46] identified the factors that contribute the most to defects so that time and costs can be reduced. This study identified poor quality of materials and faults in the construction phase to be the two most common factors contributing to building defects.
The main purpose of the study by Forcada et al. [55] was to identify the factors that affect the occurrence of building defects in the post-handover stage and to determine if there is a significant difference of the quality between flats and detached houses. The authors discovered that customers in flats reported more defects than those in detached houses, indicating that the developers focused more on quality when constructing detached houses. The study also found that the customers mostly complained about visible defects and were not aware of the quality of nonvisible structural elements. The customers’ dissatisfaction with the contractor’s quality standards was the main cause of their complaints. The authors pointed out that the clients have little influence over the standards of their homes and that increased client involvement might result in fewer complaints.
The main purpose of the study by Forcada et al. [57] was to identify the type and origin of building defects so that measures to prevent them could be found. The main findings of the study were that 64% of the defects were poor workmanship due to building mistakes and omissions. In addition, material quality contributed to 19% of the defects, and lack of protection contributed to 16%. The two most common causes were in line with the findings of Ahzahar et al. [46]. The authors pointed out that these findings may help enhance quality control because they highlight problems that require proper attention.
The main purpose of the study by Ilozor et al. [38] was to identify whether there is a pattern or sequence in the relations between typical building defects. It was found that proper installation of house foundations and proper execution of house framing may reduce the occurrence of various defect types.
3.3.3. Overview of Typical Defects
The main purpose for the study by Gullbrekken et al. [36] was to obtain an overview of typical building defects in pitched wooden roofs. It was found that deficiencies in the design, materials, or workmanship accounted for more than half of the defects by allowing precipitation or indoor moisture to enter the building envelope.
The main purpose of the study by Lisø et al. [6] was to obtain an overview of the typical process behind different defects. This paper found that 66% of the cases were related to the building envelope and that moisture-related defects represented 76% of the 2423 cases registered, while 22% of the cases were located on the roof. The authors also found that numerous defects were recurrent, which indicated that the building industry does not learn from its mistakes and that there is insufficient knowledge exchange.
3.3.4. Classification
Forcada et al. [57] classified building defects based on type, location, and subcontract. Of the 2351 defects investigated, the most common defects identified were missing items or tasks (37%) and surface appearance (20%). The study found that most of the defects were located in the wet areas of the buildings. In addition, the authors found that 38% of the defects arose in door and window subcontracts, 24% in painting subcontracts, and 14% in services subcontracts.
The main purpose of the study by Sassu and De Falco [54] was to analyze building defects based on a classification of the different types of defects. The paper focused on the origins and consequences of building defects, especially water damage. The participating technical staff’s obligations were also evaluated. A total of 36% of the building defects were found to be the result of poor design at the planning stage, whereas 43% of the cases were the result of execution mistakes. In fact, mistakes in both design and execution commonly happened together. The study compared the distribution of the error causes from 1990 to 1999 and from 2000 to 2011. It was found that the share of errors occurring during design or inspection work increased from 24% to 36%, constructive defects were rather stable at 45% and 43%, and lack of or defects in maintenance decreased from 32% to 21%.
The classification of different building defects into a defect risk matrix was the main purpose of Lee et al.’s study [40]. The classification was based on the type of defect and work and the defect’s location. The study found that incorrect installation and missing tasks were the most severe defects.
3.3.5. Building Maintenance Management
Jesumoroti et al. [47] investigated building defects in relation to maintenance management in hospitals so that defects could be prevented. The main findings were related to cracked floors, floor tile failures, wall tile failures, clogged toilets, and damaged windows. These defects were a result of inadequate maintenance planning, which was made worse by subpar design and construction. The defects led to aesthetic problems as well as functional problems for the hospitals.
Another study by Awasho and Alemu [51] evaluated building maintenance procedures and building defects in Mettu building projects in Ethiopia. The study found that the top three effects of building defects were project delays, high maintenance costs, and reputational damage. In addition, it was found that the best ways to reduce the building defects were proper and routine maintenance and periodic construction supervision. The respondents ranked tight budgets, lack of building maintenance guidelines, and cultural aspects as having the greatest impact on the maintenance management.
In Maiduguri, Nigeria, Waziri’s study’s [50] main purpose was to determine the impact that building defects had on building maintenance. The study found that the factors with a significant impact on maintenance are poor materials, lack of supervision and quality control, and lack of compliance with specifications.
Islam et al. [44] investigated the impacts that building defects brought on by design flaws have on maintenance costs as well as strategies to save maintenance expenses. The literature survey identified 42 design challenges and 11 mitigation measures. These were sent to respondents in the maintenance industry so that the respondents could grade the design challenges and measures in terms of how they might increase maintenance costs. It was found that maintenance costs increased mostly in relation to architectural design challenges.
3.3.6. Quality Management
The main purpose of the study by Sandanayake et al. [2] was to develop a methodological framework to improve quality management in buildings. The study systematically collected data and used the dataset to analyze patterns in building defects and to identify the current trends in building defects. It was found that poor workmanship caused 85% of the total defects. Of these, 42% were attributed to structural defects. In addition, the study found that waterproofing defects had the highest cost. The paper resulted in a framework including control and enforcement, innovation and technology use, the promotion of best practices, and the auditing of inspections. The author suggested that this framework can be used to minimize the occurrence of common defects.
Another study by Pamera and Gurmu [39] also sought to develop a framework to improve building quality. This study proposed the defects identification and analysis framework. The framework was based on the causes of the defects and the technologies used to identify the defects. The purpose of the framework is to reduce the frequency of defects by using adequate measures. Some of the most common defects identified were installation errors in pipes, water damage, plumbing defects, internal water leakage, and wall cracking.
Abdul-Rahman et al. [45] found that the most common defects were leaking pipes, total failure of water supply systems, cracking in concrete walls, faulty doorknobs, and concrete wall dampness. According to the study, subpar materials, subpar workmanship, and inadequate routines for inspection and monitoring can all be contributing factors to the faults. The authors suggested that the quality of the finished building might be increased by involving more client-oriented monitoring and supervision on site.
The main purpose of Forcada et al.’s study [58] was to determine whether implemented quality control measures adequately carry out their functions. To address the issue, the authors compared the defects identified by the customers with the remaining defects at handover. This could provide a better understanding of the nature of the defects, who identifies them, and when the defects are resolved so that the quality management can be improved. The study investigated the frequency, distribution, and influence of the defects. The most common defects found in this study were surface appearance defects, which accounted for 65% of the total defects.
3.3.7. Systematization in Data Collection
Finding patterns by systematically collecting data was the main purpose of De Vos et al.’s study [8]. The authors used the collected data from an insurance company to analyze the different types of defects and their frequency in relation to the construction time by systematically mapping the defects. The analysis demonstrated that 49% of all technical defects were moisture problems, and the roof (25%) and basement (21%) were the common locations for problems to occur. A total of 19% of the defects were stability problems, 17% were cracking, and 16% were residential nuisances. The authors also discussed the temporal evolution of claim distribution and the points in the building process at which the claims were made. It was found that the number of claims increased from 1991 to 2019. It was also found that 47% of the defects occurred prior to provisional acceptance (PA), 13% between the PA and the final acceptance (FA), 28% within 5 years after FA, and 12% between 5 and 10 years after FA. In contrast to stability issues, which mainly occurred prior to FA, moisture problems, cracking, and residential nuisances occurred within 5 years after FA.
The study by Van Den Bossche et al. [9] was a follow-up study of reference [8], focusing on the geographical variability of building defects. The authors aimed to identify the external factors that contribute to building defects. The new knowledge that was acquired might contribute to improved quality control and the prevention of defects. The authors found that wind speed and the number of walls the building shared with its neighbors had the greatest effect on the number of building defects. The authors concluded that demographic, geographic, and climate factors did not have a significant impact on the occurrence of the defects.
Lee et al. [10] systematically collected data to classify the defects into a classification matrix based on the defect liability period. The study aimed to give a better distribution of the defect costs among the involved parties and to identify the frequency of the defects by using this matrix. It was found that the highest frequency of defects was in the structural and finish work and that defects and water problems in reinforced concrete were the most serious defects.
4. Discussion
4.1. Type of Information Source
The identification of the various information sources for scientific research offers several lessons. Chong and Low [62] stated: “It is impossible to identify all types of latent defects without a good information source to rely upon”. Based on the literature survey, seven types of information sources were identified. The different types are based on different numbers of building defect cases, which influences the validity of the findings. Table 5 shows the variation per category of information source.
The studies based on databases owned by insurance companies had between 8128 and 13,068 defects. Due to their large number of defect cases and systematic data collection, such information sources might be well suited for ranking typically occurring defects. From a conceptual/theoretical standpoint, these studies advance our understanding of defects and provide a more realistic perspective of defects. On the other hand, the use of insurance company databases has several biases. De Vos et al. [8] point out that there is a possibility of incorrect diagnoses of the defects because some of the cases are processed by lawyers who do not necessarily have the proper knowledge. In addition, the company may make an unconscious selection of information due to their focus on specific criteria during inspections and assessments, and they might not necessarily investigate the cause of the defect. Both De Vos et al. [8] and Van Deen Bossche et al. [9] point out that because insurance companies are only involved in the defect cases when the professional liability insurance of architects and contractors is activated, the analysis only contains more complex cases and does not cover the population of the different cases. Van Deen Bossche et al. [9] also point out that current insurance companies only have a certain market share, which is often related to a specific geographical area. The exploitation of insurance companies has only been done in Belgium and Australia, and there might be several barriers for why this has not been done in other countries, such as competitive advantages and sensitive customer information.
The private databases had a varying number of cases, from 150 to 42,753 cases. This means that the credibility varies from database to database and that each source must be evaluated individually based on the quantity of cases and the organization. Only a few of the articles addressed the biases of using private databases. The private databases have similar biases to the insurance companies, such as the competence of those who have conducted the analysis not always being clear, the impact of the geographical location of the collector [6], and the fact that only large-scale defects are included [35,37]. Plebankiewicz and Malara [42] stated that the results could not be generalized because of the small amount of data, but that they did provide an indication of typical building defects in general. The authors that used the SINTEF archive discussed biases more thoroughly than the other authors. The SINTEF archive is an example of a database that employs experts in the respective field of the specific defect case as data collectors. This expertise, in addition to the large number of defect cases over a long period of time, makes the SINTEF archive a valuable database for understanding the causes of the defects [35].
Questionnaire surveys are a very common method to gather data on building defects. However, the questionnaire surveys often included only a small number of defects because the authors did not provide the information about the number of cases, likely because they did not know how many defects the respondents based their information on. This type of information source therefore relies on the accuracy of the respondents’ answers. Jonsson and Gunnelin [49] point out that the way the respondents interpret the questions could be a potential bias. In addition, there is clearly a bias in that the proficiency level of the respondents is unclear even though relevant respondents are used.
Only one article based on building surveys mentioned how many building defects they based their study on, which was 6758 cases. The number of cases will vary depending on how many buildings are investigated. The biases in these types of information sources are not discussed in the article. The survey of a few selected buildings gives a narrow perspective on the issue of building defects and does not address all possible defects.
The lawsuits also had a low number of defects to base a study on. This could be because many of the defect cases do not become lawsuits but are instead resolved between the parties. According to Sassu and De Falco [54], assessments from lawsuits are unbiased and are made by an expert and therefore are valuable sources of information for understanding the causes of building defects. The authors do not discuss any bias in this method. A benefit of using lawsuits as an information source is that fault is assigned by the court. None of the other sources are clear on the responsibility for the building defects—if responsibility is even investigated at all.
The variation in the cases ranged from 966 to 55,439 in the articles based on client complaint forms. These types of information sources contain data concerning the buyer’s observations and are therefore more of an expression of the observer’s ability than a description of the actual condition of the building. Forcada et al. [55] point out that buyers are more likely to complain about visible defects and not more complex defects such as structural defects.
The articles that based their study on maintenance reports had around 3000 cases in their dataset. According to Chong and Low [62], the use of maintenance reports is an efficient method of collecting data on building defects because the owners already collect such data. Therefore, use of these registers can prevent latent building defects in a timely and cost-efficient way. The bias in the variation in proper records is also mentioned by the writers, and this could lead to less-thorough information about the defect.
4.2. Main Purpose
Eight main purposes were identified from the 36 scientific articles covered by the present survey. To some extent, the purposes seem to vary according to the national origin of the study. They might also vary according to the information sources available for the study. The distribution of purposes of the building defect surveys according to national origin is illustrated in Figure 6. None of the surveys aimed to cover the situation in more than one country.
According to Figure 6, there were studies from several countries that aimed to identify the most common defects, which reflects the national industry’s interest in gaining more knowledge about building defects. The studies investigated different areas of buildings, different periods of the building’s lifetime, and different perspectives, such as the owner’s perspective. Some of the national studies focused on classification and systematic data collection, which shows that the authors were interested in systemizing the defects to obtain a better understanding of the defects. In Norway, there has been a focus on identification and on obtaining an overview of typical defects and design challenges. The Norwegian focus is motivated by an interest in not only identifying issues but also in solving issues by improving fault solutions. A harsh climate, which puts extra demand on the building envelope, is an obvious driver behind the Norwegian focus. The Norwegians do not seem to be concerned with management, which may mean that there is not an issue in this regard. Although lacking an in-depth analysis of causes, there were several studies from other countries focusing on quality and building maintenance management, especially from Malaysia. These studies were motivated by improving management, such as processes, frameworks, and procedures, aiming for better building quality and reduced cost.
The present study revealed a variation in the building defect definition and the categorization used by the different studies. The purpose of the individual studies was likely to determine which building defect definition is relevant for the specific study; however, not every publication discussed the definition used. For instance, there were articles that included damage due to normal wear as building defects, e.g., references [43,47,62], some did not include normal wear, e.g., references [9,54], and some articles were not clear on which defects they included. Of the articles identified in the present survey, there were 15 articles that did not define building defects at all. The absence of information about the building defects covered by the study indicates a lack of agreement on what constitutes a building defect. Even among the articles that did not use a specific definition of building defects, 7 of the 15 articles classified the defects based on type, location, or significance. The definition of building defects by Watt [11] was the most commonly used. This definition is much like the definition by Ingvaldsen [4], but Ingvaldsen relates the defects to the quality of the building. Three of the articles used Ingvaldsen’s definition. Individual definitions were used in references [64,65,66,67,68,69]. The span in building defect definition used for identifying the relevant faults and flaws in the studies covered by the present survey may vary to such a degree that comparisons of the results are difficult.
4.3. Further Use of the Literature Findings
Obtaining an overview of existing information sources of building defects and the main purposes for studies based on the different sources may be of significance in gaining knowledge about the causes of building defects and effective measures to prevent them. The overview of the types of information sources can identify valuable datasets that have untapped potential. It can also show the importance of collaboration between different actors within the construction industry and demonstrate that they can learn from each other. Collaboration between developers, contractors, insurance companies, the judicial system, maintainers, and occupants can give the entire industry valuable insights and motivation for jointly improving on imperfect and costly solutions. De Vos et al. [8], Van Den Bossche et al. [9], and Sandanayake et al. [2] showed the potential for utilizing insurance company databases from Belgium and Australia to pinpoint focus area for improvement. However, competition between insurance companies is a key reason why such studies are not carried out elsewhere.
Knowing the main purpose of studies helps us to understand the context and motivations behind the research, which gives insight into the priorities and concerns of researchers and practitioners. In addition, the diversity of published scientific studies may indicate a variation in the view on building defects. The majority of the articles were motivated by reducing expenses related to building defects, such as construction or maintenance costs, and none of the articles were motivated by the climate perspective of building defects. This shows a research gap on climate impact that the building defects represent. This area of research has significant undiscovered potential as the climate perspective gains more and more importance in the industry.
In Norway, Lisø et al. [70] have observed that climate change can lead to significant local differences in climatic exposure, making robust solutions more important in order to avoid the occurrence of building defects. In Belgium, on the other hand, Van den Bossche et al. [9] reported limited variation in climate, which may stem from small climatic differences within the country. To prepare for the upcoming challenges that Norway will face, Lisø et al. [71] proposed a framework for climate adaptation of buildings in accordance with the Norwegian Planning and Building Act. The framework is motivated by a sorting of building solutions and materials according to the local climatic load, which has been possible as a result of the SINTEF building defect archive. Utilization of other information sources for building defects may expand the library of climate-adapted solutions.
5. Conclusions
The study of building defects is important in order to improve quality and sustainability in the construction industry. This literature survey found 36 scientific studies on building defects with various information sources, including insurance companies, private databases, surveys, lawsuits, client complaint forms, and maintenance reports. The most common information sources used were found to be private databases, with 13 articles; questionnaire surveys, with 8 articles; and client complaint forms, with 6 articles. None of the articles included more than one information source. The credibility of the findings varied depending on the different extent of the datasets, which varied from 63 to 55,439 cases, and varying levels of knowledge among the data collectors. The datasets of insurance companies and client complaint forms can be considered more significant due to their wide number of cases collected, but there are several biases with the information sources that need to be taken into consideration such as the unconscious selection of the included information, the competence and thoroughness of the observer, the inclusion of only more complex defects, and a focus on specific geographical areas.
The main purposes of studying the building defects identified in this paper include the identification of defects, providing an overview of typical defects, classifying defects, systematic data collection, and gaining a better understanding of building performance, design challenges, building quality, and building maintenance management. Most countries have articles on the identification of defects, which demonstrates that the industry is motivated to learn about building defects. The majority of the studies sought to prevent building defects due to economic savings. Malaysia, Norway, and Spain were found to be the countries with the most scientific articles published. It was also found that the building defect definitions used in the studies were different or not clear at all, indicating a lack of coordination in the industry and thus making it difficult to compare the results of various studies.
The novelty of this paper is the discovery of untapped potential in valuable information sources, such as insurance companies, and the identification of research gaps on the climate issue. An overview of the different information sources has not been presented in previous studies, and this study therefore contributes to filling this research gap. The importance of learning from previous studies is that it can motivate collaboration among various stakeholders, enabling researchers to leverage information sources from those who have firsthand knowledge of building defects. This collaboration has proven to be beneficial in several studies, and important aspects and patterns of building defects have been learned. Combining the different sources of information can help to uncover several interesting aspects such as causes, economics, and process-related factors behind building defects. There are several biases and barriers to fully exploiting the different information sources that need to be taking in to consideration when using the sources. Further work in this field should focus on utilizing the full learning potential of the different information sources and should focus more on the potential impact of global warming on building defects.
Supplementary Materials
The following supporting information can be downloaded at: https://www.mdpi.com/article/10.3390/buildings14051231/s1, Spreadsheet: Literature review.
Author Contributions
Conceptualization, L.B.O. and T.K.; methodology, L.B.O. and T.K.; formal analysis, L.B.O.; investigation, L.B.O.; writing—original draft preparation, L.B.O.; writing—review and editing, L.B.O. and T.K.; supervision, T.K. All authors have read and agreed to the published version of the manuscript.
Funding
This research received no external funding.
Data Availability Statement
The literature survey data are available in the spreadsheet attached in the Supplementary Materials in this article.
Acknowledgments
The authors acknowledge the collaboration with the project Norgeshus–Verktøykasse for klimatilpasning av boliger (the Research Council of Norway, grant number 309400).
Conflicts of Interest
The authors declare no conflicts of interest.
References
- Love, P.E.D.; Li, H. Quantifying the Causes and Costs of Rework in Construction. Constr. Manag. Econ. 2000, 18, 479–490. [Google Scholar] [CrossRef]
- Sandanayake, M.; Yang, W.; Chhibba, N.; Vrcelj, Z. Residential Building Defects Investigation and Mitigation—A Comparative Review in Victoria, Australia, for Understanding the Way Forward. Eng. Constr. Archit. Manag. 2021, 29, 3689–3711. [Google Scholar] [CrossRef]
- Nielsen, J.; Hansen, M.H. Svigt i Byggeriet. Økonomiske Konsekvenser Og Muligheder for En Reduktion; Erhvervsog Byggestyrelsen: Copenhagen, Denmark, 2004. [Google Scholar]
- Ingvaldsen, T. Byggskadeomfanget i Norge. Prosjektrapport 163; Norges Byggforskningsinstitutt: Oslo, Norway, 1994. [Google Scholar]
- Oslo Economics. Utredning av Kvalifikasjonskrav i Bygge- og Anleggsbransjen; Norwegian Ministry of Local Government and Modernisation: Oslo, Norway, 2020. [Google Scholar]
- Lisø, K.R.; Kvande, T.; Thue, J.V. Learning from Experience—An Analysis of Process Induced Building Defects in Norway. In Research in Building Physics and Building Engineering; Taylor & Francis Group: London, UK, 2006; pp. 425–432. ISBN 978-0-415-41675-7. [Google Scholar]
- Chew, M.Y.L.; De Silva, N. Maintainability Problems of Wet Areas in High-Rise Residential Buildings. Build. Res. Inf. 2003, 31, 60–69. [Google Scholar]
- De Vos, J.; Blommaert, A.; Van Den Bossche, N. Statistical Analysis on Belgian Building Defects. In Proceedings of the Current Topics and Trends on Durability of Building Materials and Components, Barcelona, Spain, 20 October 2020. [Google Scholar]
- Van Den Bossche, N.; Blommaert, A.; Daniotti, B. The Impact of Demographical, Geographical and Climatological Factors on Building Defects in Belgium. Int. J. Build. Pathol. Adapt. 2022, 41, 549–573. [Google Scholar] [CrossRef]
- Lee, S.; Lee, J.; Ahn, Y. LDA-Based Model for Assessing the Defect Liability System in Residential Buildings’ Maintenance Phase. J. Perform. Constr. Facil. 2020, 34, 04020007. [Google Scholar] [CrossRef]
- Watt, D.S. Building Pathology: Principles and Practice; Blackwell Science: Oxford, UK, 1999; ISBN 978-1-4443-1403-8. [Google Scholar]
- Pedersen, S.; Grønvik, O.; Rødal, M.; Bjørberg, S.; Mattsson, J. Omfang av Byggefeil i Norge; Menon Economics: Oslo, Norway, 2022. [Google Scholar]
- Mundt-Petersen, S.O.; Wallentén, P.; Joelsson, A.; Kläth, M. Distribution and Location of Damages in Swedish Buildings. J. Phys. Conf. Ser. 2023, 2654, 012014. [Google Scholar] [CrossRef]
- Arditi, D.; Günaydın, H.M. Total Quality Management in the Construction Process. Int. J. Proj. Manag. 1997, 15, 235–243. [Google Scholar] [CrossRef]
- Kvande, T.; Lisø, K.R. Byggskader. Oversikt; Byggforskserien 700.110; SINTEF Community: Trondheim, Norway, 2010. [Google Scholar]
- Munn, Z.; Peters, M.D.J.; Stern, C.; Tufanaru, C.; McArthur, A.; Aromataris, E. Systematic Review or Scoping Review? Guidance for Authors When Choosing between a Systematic or Scoping Review Approach. BMC Med. Res. Methodol. 2018, 18, 143. [Google Scholar] [CrossRef] [PubMed]
- Arksey, H.; O’Malley, L. Scoping Studies: Towards a Methodological Framework. Int. J. Soc. Res. Methodol. 2005, 8, 19–32. [Google Scholar] [CrossRef]
- Ingebretsen, S.B.; Andenæs, E.; Kvande, T. Microclimate of Air Cavities in Ventilated Roof and Façade Systems in Nordic Climates. Buildings 2022, 12, 683. [Google Scholar] [CrossRef]
- Johansen, K.S. Internal Rain Gutter for BIPV Dimensioning the Internal Rain Gutter for ZEB Laboratory’s BIPV Roof. Master’s Thesis, NTNU, Trondheim, Norway, 2019. [Google Scholar]
- Park, J.Y.; Lange, J.; Koc, O.; Al-Bakhat, F. Design of an Enhanced Defect Identification System for Commercial Building Construction. In Proceedings of the 2017 Systems and Information Engineering Design Symposium, Charlottesville, VT, USA, 28 April 2017. [Google Scholar]
- Chohan, A.H.; Awad, J.; Jung, C.; Ani, A.I.C. Development of Smart Application for House Condition Survey. Ain Shams Eng. J. 2022, 13, 101628. [Google Scholar] [CrossRef]
- Faqih, F.; Zayed, T. Defect-Based Building Condition Assessment. Build. Environ. 2021, 191, 107575. [Google Scholar] [CrossRef]
- Wahab, S.N.A.; Hamid, M.Y. A Review Factors Affecting Building Defects of Structural Steel Construction. Case Study: Student Accommodation in UiTM Perak. Procedia Eng. 2011, 20, 174–179. [Google Scholar] [CrossRef]
- Gurmu, A.T.; Krezel, A.; Ongkowijoyo, C. Fuzzy-Stochastic Model to Assess Defects in Low-Rise Residential Buildings. J. Build. Eng. 2021, 40, 102318. [Google Scholar] [CrossRef]
- Asmone, A.S.; Chew, M.Y.L. Development of a Design-for-Maintainability Assessment of Building Systems in the Tropics. Build. Environ. 2020, 184, 107245. [Google Scholar] [CrossRef]
- Hauashdh, A.; Jailani, J.; Rahman, I.A.; AL-fadhali, N. Strategic Approaches towards Achieving Sustainable and Effective Building Maintenance Practices in Maintenance-Managed Buildings: A Combination of Expert Interviews and a Literature Review. J. Build. Eng. 2022, 45, 103490. [Google Scholar] [CrossRef]
- Felipo, R.; Charpin, D. Structural Home Defects Are the Leading Cause of Mold in Buildings: The Housing and Health Service Experience. Int. J. Environ. Res. Public Health 2022, 19, 16692. [Google Scholar] [CrossRef] [PubMed]
- Holme, J. Mould Growth in Buildings. Ph.D. Thesis, NTNU, Trondheim, Norway, 2010. [Google Scholar]
- Tarekegn Gurmu, A.; Shooshtarian, S.; Mahmood, M.N. Critical Evaluation of Building Defects Research: A Scientometric Analysis. J. Perform. Constr. Facil. 2022, 36, 03122001. [Google Scholar] [CrossRef]
- Wong, J.T.Y.; Hui, E.C.M. Water Seepage in Multi-storey Buildings. Facilities 2005, 23, 595–607. [Google Scholar] [CrossRef]
- Misar, I.; Novotny, M. Defects and Behaviour of Inverted Flat Roof from the Point of Building Physics. In Proceedings of the 8th International Scientific Conference Building Defects, České Budějovice, Czech Republic, 24 November 2016. [Google Scholar]
- Aktas, Y.D.; Zhu, H.; D’Ayala, D.; Weeks, C. Impact of Surface Waterproofing on the Performance of Brick Masonry through the Moisture Exposure Life-Cycle. Build. Environ. 2021, 197, 107844. [Google Scholar] [CrossRef]
- Braun, V.; Clarke, V. Using Thematic Analysis in Psychology. Qual. Res. Psychol. 2006, 3, 77–101. [Google Scholar] [CrossRef]
- Lisø, K.; Kvande, T.; Thue, J. High-Performance Weather-Protective Flashings. Build. Res. Inf. 2005, 33, 41–54. [Google Scholar] [CrossRef]
- Kvande, T.; Lisø, K.R. Climate Adapted Design of Masonry Structures. Build. Environ. 2009, 44, 2442–2450. [Google Scholar] [CrossRef]
- Gullbrekken, L.; Kvande, T.; Jelle, B.P.; Time, B. Norwegian Pitched Roof Defects. Buildings 2016, 6, 24. [Google Scholar] [CrossRef]
- Kvande, T.; Bakken, N.; Bergheim, E.; Thue, J.V. Durability of ETICS with Rendering in Norway—Experimental and Field Investigations. Buildings 2018, 8, 93. [Google Scholar] [CrossRef]
- Ilozor, B.D.; Okoroh, M.I.; Egbu, C.E.; Archicentre. Understanding Residential House Defects in Australia from the State of Victoria. Build. Environ. 2004, 39, 327–337. [Google Scholar] [CrossRef]
- Pamera, S.; Gurmu, A. Framework for Building Defects and Their Identification Technologies: Case Studies of Domestic Buildings in Melbourne, Australia. In Proceedings of the 54th International Conference of the Architectural Science Association, Auckland, New Zealand, 26 November 2020. [Google Scholar]
- Lee, J.; Ahn, Y.; Lee, S. Post-Handover Defect Risk Profile of Residential Buildings Using Loss Distribution Approach. J. Manag. Eng. 2020, 36, 04020021. [Google Scholar] [CrossRef]
- Lee, S.; Lee, S.; Kim, J. Evaluating the Impact of Defect Risks in Residential Buildings at the Occupancy Phase. Sustainability 2018, 10, 4466. [Google Scholar] [CrossRef]
- Plebankiewicz, E.; Malara, J. Analysis of Defects in Residential Buildings Reported during the Warranty Period. Appl. Sci. 2020, 10, 6123. [Google Scholar] [CrossRef]
- Talib, R.B.; Sulieman, M.Z. Identifying Building Defects: From Construction Cases in Malaysia. Int. Trans. J. Eng. Manag. Appl. Sci. Technol. 2021, 12, 1–12. [Google Scholar] [CrossRef]
- Islam, R.; Nazifa, T.H.; Mohammed, S.F.; Zishan, M.A.; Yusof, Z.M.; Mong, S.G. Impacts of Design Deficiencies on Maintenance Cost of High-Rise Residential Buildings and Mitigation Measures. J. Build. Eng. 2021, 39, 102215. [Google Scholar] [CrossRef]
- Abdul-Rahman, H.; Wang, C.; Wood, L.C.; Khoo, Y.M. Defects in Affordable Housing Projects in Klang Valley, Malaysia. J. Perform. Constr. Facil. 2012, 28, 272–285. [Google Scholar] [CrossRef]
- Ahzahar, N.; Karim, N.A.; Hassan, S.H.; Eman, J. A Study of Contribution Factors to Building Failures and Defects in Construction Industry. Procedia Eng. 2011, 20, 249–255. [Google Scholar] [CrossRef]
- Jesumoroti, C.; Olanrewaju, A.; Khor, S.C. Defects in Malaysian Hospital Buildings. Int. J. Build. Pathol. Adapt. 2022, 35, 2398–4708. [Google Scholar] [CrossRef]
- Talib, R.; Sulieman, M. Achieving Zero Defects Strategy: A Quantitative Report Adjudicating the Most Common Building Defects to Look Out For. Adv. Civ. Eng. Mater. 2021, 139, 189–200. [Google Scholar] [CrossRef] [PubMed]
- Jonsson, A.Z.; Gunnelin, R.H. Defects in Newly Constructed Residential Buildings: Owners’ Perspective. Int. J. Build. Pathol. Adapt. 2019, 37, 163–185. [Google Scholar] [CrossRef]
- Waziri, B.S. Design and Construction Defects Influencing Residential Building Maintenance in Nigeria. Jordan J. Civ. Eng. 2016, 10, 313–323. [Google Scholar] [CrossRef]
- Awasho, T.T.; Alemu, S.K. Assessment of Public Building Defects and Maintenance Practices: Cases in Mettu Town, Ethiopia. Heliyon 2023, 9, e15052. [Google Scholar] [CrossRef] [PubMed]
- Wali, K.; Ali, N. Diagnosis and Evaluation of Defects Encountered in Newly Constructed Houses in Erbil City, Kurdistan, Iraq. Eng. Technol. J. 2019, 37, 70–77. [Google Scholar] [CrossRef]
- Chew, M.Y.L. Defect Analysis in Wet Areas of Buildings. Constr. Build. Mater. 2005, 19, 165–173. [Google Scholar] [CrossRef]
- Sassu, M.; De Falco, A. Legal Disputes and Building Defects: Data from Tuscany. J. Perform. Constr. Facil. 2014, 28, 04014017. [Google Scholar] [CrossRef]
- Forcada, N.; Macarulla, M.; Fuertes, A.; Casals, M.; Gangolells, M.; Roca, X. Influence of Building Type on Post-Handover Defects in Housing. J. Perform. Constr. Facil. 2012, 26, 433–440. [Google Scholar] [CrossRef]
- Forcada, N.; Macarulla, M.; Gangolells, M.; Casals, M.; Fuertes, A.; Roca, X. Posthandover Housing Defects: Sources and Origins. J. Perform. Constr. Facil. 2013, 27, 756–762. [Google Scholar] [CrossRef]
- Forcada, N.; Macarulla, M.; Love, P.E.D. Assessment of Residential Defects at Post-Handover. J. Constr. Eng. Manag. 2013, 139, 372–378. [Google Scholar] [CrossRef]
- Forcada, N.; Macarulla, M.; Gangolells, M.; Casals, M. Handover Defects: Comparison of Construction and Post-Handover Housing Defects. Build. Res. Inf. 2016, 44, 279–288. [Google Scholar] [CrossRef]
- Shirkavand, I.; Lohne, J.; Lædre, O. Defects at Handover in Norwegian Construction Projects. Procedia—Soc. Behav. Sci. 2016, 226, 3–11. [Google Scholar] [CrossRef]
- Dzulkifli, N.; Sarbini, N.N.; Abidin, N.I.; Ibrahim, I.S. Analysis of Building Defects at Residential Collages: A Case Study at Higher Education Facilities N. ASEAN Eng. J. 2022, 12, 31–39. [Google Scholar] [CrossRef]
- Pan, W.; Thomas, R. Defects of New-Build Dwellings Constucted to Building Regulation and the Code of Sustainable Homes. In Proceedings of the 29th Annual ARCOM Conference, Reading, UK, 2 September 2013. [Google Scholar]
- Chong, W.K.O.; Low, S.-P. Latent Building Defects: Causes and Design Strategies to Prevent Them. J. Perform. Constr. Facil. 2006, 20, 213–221. [Google Scholar] [CrossRef]
- SINTEF Vår Historie. Available online: https://www.sintef.no/om-sintef/var-historie/ (accessed on 9 November 2023).
- Mansor, R.; Othuman Mydin, M.A.; Ismail, M.; Wan Harun, W.M. Categorization of General Problems and Defects in Historical Building. Hist. Build. 2012, XIX, 127–136. [Google Scholar]
- Ojo, A.M.; Ijatuyi, O.O. Defective Construction in Residential Buildings: A Study of Sunshine Gardens, Akure Nigeria. Eur. Cent. Res. Train. Dev. UK 2014, 1, 16–30. [Google Scholar]
- Juran, J.M.; Blanton Godfrey, A. Juran Quality Handbook, 5th ed.; McGraw Hill: New York, NY, USA, 1951. [Google Scholar]
- Atkinson, A.R. The Role of Human Error in Construction Defects. Struct. Surv. 1999, 17, 231–236. [Google Scholar] [CrossRef]
- Pheng, L.S.; Wee, D. Improving Maintenance and Reducing Building Defects through ISO 9000. J. Qual. Maint. Eng. 2001, 7, 6–24. [Google Scholar] [CrossRef]
- Isa, H.M.; Hassan, P.F.; Takim, R.; Mat, M.C.; Ithnin, Z.I. How Adequate Is Adequate? A Case of the Adequacy in Determining Client Requirements in the Construction of Four Public Hospitals in Malaysia. In Proceedings of the W092-Special Track 18th CIB World Building Congress, Salford, UK, 10–13 May 2010. [Google Scholar]
- Lisø, K.R.; Myhre, L.; Kvande, T.; Thue, J.V.; Nordvik, V. A Norwegian Perspective on Buildings and Climate Change. Build. Res. Inf. 2007, 35, 437–449. [Google Scholar] [CrossRef]
- Lisø, K.R.; Kvande, T.; Time, B. Climate Adaptation Framework for Moisture-Resilient Buildings in Norway. Energy Procedia 2017, 132, 628–633. [Google Scholar] [CrossRef]
Figure 1.
Classification of different types of building defects. Figure is drawn from reference [15], based on reference [4].


Figure 3.
Number of articles per year.

Figure 4.
Number of articles per information source.

Figure 5.
Number of articles per main purpose.

Figure 6.
Main purposes per country.


Table 1.
Number of articles per database per search string.
| Number of Articles | |||
|---|---|---|---|
| Search String | Web of Science | Scopus | ScienceDirect |
| “Building defects” AND “moisture” | 23 | 21 | 69 |
| “Building defects” AND “water” | 27 | 23 | 135 |
Table 2.
Description of categories for the types of information sources.
| Category | Description |
|---|---|
| Insurance company databases | The authors have analyzed registers with claims from clients seeking compensation for building defects. The data are normally not publicly available. |
| Private databases | These databases are owned, controlled, and maintained by an organization for internal use and are not publicly available. The collectors can be developers, contractors, science organizations, or damage investigators. The authors of these articles have obtained permission to access and analyze the cases anonymously. |
| Questionnaire surveys | The authors have distributed questionnaires to potential respondents for a specific study. |
| Building surveys | The authors have conducted surveys in the buildings by themselves for a specific study. |
| Lawsuits | The authors have studied the public descriptions of judgements and analyzed the data. |
| Client complaint forms | The authors have analyzed the complaints reported by the users/owners and collected by the building owners, developers, or contractors. |
| Maintenance reports | The authors have analyzed the data reported by the maintenance teams responsible for the buildings. |
Table 3.
Description of categories for the main purposes of the building defects studies.
| Category | Description |
|---|---|
| Design challenges | These articles refer to certain constructions or solutions and investigate the challenges to these designs. |
| Identification | These articles include the identification of specific elements based on different key issues such as origin, contributing factors, type, risks, relations, and frequency in relation to different periods and types of buildings. |
| Overview of typical defects | These articles aim to obtain a general overview of the most common building defects. |
| Classification | These articles organize defects based on certain properties. |
| Building maintenance management | These articles focus on gaining information to reduce maintenance costs and to develop strategies to save maintenance expenses. |
| Quality management | These articles involve implementing principles and methods to ensure and improve the quality of buildings. |
| Systematization in data collection | These articles look at the importance of systematization to gather data so that the identification or classification is more valid. Other articles also have systematically collected data, but these articles aim to emphasize that this is important to achieve good results. |
Table 4.
General overview of the scientific articles.
| Type of Information Source | Ref. | Number of Defects | Country | Main Purpose of Study | Period (Phase) * |
|---|---|---|---|---|---|
| Insurance company databases | [8] | 27,074 | Belgium |
| 1991–2019 (-) |
| [9] | |||||
| [2] | 8128 | Australia |
| 2011–2018 (-) | |
| Private databases | [34] | 175 | Norway |
| 1963–2001 (-) |
| [6] | 2423 |
| 1993–2002 (-) | ||
| [35] | 302 |
| 1983–2002 (-) | ||
| [36] | 465 |
| 1993–2002 (-) | ||
| [37] | 150 |
| 1993–2017 (-) | ||
| [38] | 42,753 | Australia |
| 2002 (-) | |
| [39] | Unknown |
| - | ||
| [40] | 16,701 | South Korea |
| 2008–2017 (Post-handover) | |
| [41] | 7554 |
| 2008–2017 (-) | ||
| [10] | 6087 |
| 2008–2017 (Maintenance phase) | ||
| [42] | 560 | Poland |
| 2018–2020 (Warranty period) | |
| [13] | 1105 | Sweden |
| 2014–2021 (-) | |
| [43] | 1055 | Malaysia |
| 2009–2019 (-) | |
| Questionnaire surveys | [44] | 118 | Malaysia |
| - |
| [45] | 310 |
| - | ||
| [46] | Unknown |
| - | ||
| [47] | 63 |
| - | ||
| [48] | Unknown |
| - | ||
| [49] | Unknown | Sweden |
| - | |
| [50] | Unknown | Nigeria |
| - | |
| [51] | Unknown | Ethiopia |
| - | |
| Building surveys | [52] | 6758 | Iraq |
| 2009–2012 (Post-handover) |
| [53] | Unknown | Singapore |
| - (User phase) | |
| [7] | Unknown |
| - (User phase) | ||
| Lawsuits | [54] | 222 | Italy |
| 2000–2011 (-) |
| Client complaint forms | [55] | 966 | Spain |
| - (Post-handover) |
| [56] | 2351 |
| 2004–2013 (Post-handover) | ||
| [57] | 2351 |
| 2004–2006 (Post-handover) | ||
| [58] | 52,552 |
| 2012–2017 (Construction and post- handover) | ||
| [59] | 2047 | Norway |
| - (Handover) | |
| [60] | 55,439 | Malaysia |
| - (User phase) | |
| Maintenance reports | [61] | 3209 | United Kingdom |
| - (User phase) |
| [62] | 2929 | United States |
| - (User phase) |
* The period of data collection and the phase of the building process, where (-) indicates unclear periods or phases.
Table 5.
Defects per category.
| Type of Information Source | Number of Articles | Min. Number of Defects | Max. Number of Defects | Total Number of Defects |
|---|---|---|---|---|
| Insurance company databases | 3 | 8128 | 13,068 | 31,114 |
| Private databases | 13 | 150 | 42,753 | 81,288 |
| Questionnaire surveys | 8 | 63 | 310 | 491 |
| Building surveys | 3 | 6758 | 6758 | 6758 |
| Lawsuits | 1 | 222 | 222 | 222 |
| Client complaint forms | 6 | 966 | 55,439 | 115,706 |
| Maintenance reports | 2 | 2929 | 3209 | 6138 |
Disclaimer/Publisher’s Note: The statements, opinions and data contained in all publications are solely those of the individual author(s) and contributor(s) and not of MDPI and/or the editor(s). MDPI and/or the editor(s) disclaim responsibility for any injury to people or property resulting from any ideas, methods, instructions or products referred to in the content. |
© 2024 by the authors. Licensee MDPI, Basel, Switzerland. This article is an open access article distributed under the terms and conditions of the Creative Commons Attribution (CC BY) license (https://creativecommons.org/licenses/by/4.0/).
Share and Cite
MDPI and ACS Style
Berg Oppedal, L.; Kvande, T. Lessons Learned from Information Sources on Building Defect Studies. Buildings 2024, 14, 1231. https://doi.org/10.3390/buildings14051231
AMA Style
Berg Oppedal L, Kvande T. Lessons Learned from Information Sources on Building Defect Studies. Buildings. 2024; 14(5):1231. https://doi.org/10.3390/buildings14051231
Chicago/Turabian StyleBerg Oppedal, Line, and Tore Kvande. 2024. "Lessons Learned from Information Sources on Building Defect Studies" Buildings 14, no. 5: 1231. https://doi.org/10.3390/buildings14051231
Note that from the first issue of 2016, this journal uses article numbers instead of page numbers. See further details here.