Article

Cross-Laminated Timber (CLT) in Compression Perpendicular to the Plane: Experimental Analysis on the Column below the Wall Load Configuration

by
Rodrigo Adolfo Benitez Mendes
1,
Matheus Erpen Benincá
1,
Mahbube Subhani
2,
Andrey Pereira Acosta
3,
Rafael de Avila Delucis
4,
Jean Marie Désir
1,
Inácio Benvegnu Morsch
1,
Hüseyin Emre Ilgın
5,* and
Markku Karjalainen
5
1
Department of Civil Engineering, Federal University of Rio Grande do Sul, Porto Alegre 90035-190, Brazil
2
School of Engineering, Deakin University, Geelong, VIC 3216, Australia
3
Department of Materials, Federal University of Rio Grande do Sul, Porto Alegre 91509-900, Brazil
4
Postgraduate Program in Materials Science and Engineering (PPGCEM), Federal University of Pelotas (UFPel), Pelotas 96010-610, Brazil
5
School of Architecture, Faculty of Built Environment, Tampere University, P.O. Box 600, FI-33014 Tampere, Finland
*
Author to whom correspondence should be addressed.
Buildings 2024, 14(3), 607; https://doi.org/10.3390/buildings14030607
Submission received: 17 January 2024 / Revised: 9 February 2024 / Accepted: 23 February 2024 / Published: 26 February 2024
(This article belongs to the Special Issue Contemporary Applications of Wood in Architecture and Construction)

Abstract

:
This study investigates the load-bearing properties of cross-laminated timber (CLT) under compression perpendicular to the grain. Different series of CLT panels with varying layups, layer thicknesses, and overall depths were tested. Also, the compression perpendicular to the grain properties of CLT plate specimens is compared against clear wood and cubic CLT specimens. The results show a 30% reduction in modulus perpendicular to the grain for cubic samples compared to clear specimens. Increasing the number of layers from three to five leads to a 21% higher modulus, while increasing the overall depth from 105 to 175 mm results (with the same number of layers) in a 17% reduction. The overall depth significantly affects the CLT’s modulus and strength under compression perpendicular to the grain. The study also compares two analytical models for determining the transversal compression factor, kc,90. Although the models showed satisfactory results for thinner CLTs, their accuracy decreased with greater panel depth. These findings enhance the understanding of CLT panels for structural applications.

1. Introduction

Multi-story timber construction has grown significantly over the last few decades, regaining space in architectural design once only reserved for mineral-based construction materials [1,2]. Incorporating cross-laminated timber (CLT) panels in construction projects holds the promise of mitigating environmental impacts and substantially reducing carbon emissions. The emergence of CLT panels in the 1990s, which are now expected to reach a market share of nearly US $1.5 billion by the year 2024, contributed considerably towards adopting timber as a construction material [3,4]. Also, a race for the tallest mass timber building has been following this growth, and a great variety of new structural designs comprising CLT have increased as well [5]. Its reliability as a versatile engineering material allows architectural creativity for panelized (i.e., platform-type) construction rather than conventional post-and-beam construction [4].
Since CLT slabs are clamped between walls in panelized construction, compression perpendicular to the plane of floors becomes important to consider since vertical loads land on lower floors at high values, resulting in localized crushing. Therefore, this effect needs to be considered during the design of this element. As such, gravity loads are transferred from the upper walls/columns to the bottom walls/columns using the CLT floor (i.e., load transmission) or received by an entirely supported floor (i.e., load introduction).
The response of timber against compression perpendicular to the grain is especially dependent on the load configuration. For example, the effect of uniformly distributed load on a CLT slab usually develops lower compressive stress perpendicular to the grain compared to concentrated load from a column on a slab; see Brandner [5]. The fibrous constitution of timber enables an unloaded timber volume, which is adjacent to loaded areas, to contribute towards resisting compression perpendicular to the grain stresses in the case of a concentrated loading scenario. Hence, consideration of load configurations and geometry of contact areas is crucial for obtaining an economic design of a timber slab/wall when subjected to compression perpendicular to the grain under a concentrated load. Following the Eurocode 5 (EC 5) [6] design procedure, basic product properties (determined on a standardized uniformly loaded prismatic specimen) are transformed using an adjustment factor (kc,90) for each load configuration. These factors take into account possible stress dispersion effects for loading cases, the possibility of splitting, and the degree of compressive deformation. Although European standards already present kc,90 values for structural timber and glulam, a lack of specific values for CLT is still in discussion for the ongoing revision of EC 5.
Considering the variation in manufacturing characteristics (e.g., layup configuration, lamellae with or without edge-bonding, lamellae variation regarding lumber-sawn types) of CLT and the wide variety of possible load configurations it can be subjected to, extensive research is needed to completely understand its structural behavior under different loading conditions. In this sense, it is important to mention that “lamellae” refers to the individual layers or sheets of lumber that make up the CLT panel, while each lamella is a solid-sawn layer of wood within the CLT structure. Several researchers have made significant contributions to this endeavor through analytical, experimental, and numerical methods.
Halili [7] conducted experiments on prismatic specimens made from CLT and glulam, exploring construction parameters like the number of layers, thickness ratio between layers, and annual ring orientation. CLT exhibited 70% higher stiffness and 30% greater strength than glulam, attributed to its orthogonal layering configuration. Additional tests on centrally loaded plates were performed to analyze load transmission. Serrano and Enquist [8] focused on uniformly compressed cubes using line loading with industrially produced CLT. Their study emphasized the vulnerability of CLT plates line-loaded at the edge and parallel to the grain of the outer layers, with a particular focus on strength values. They developed a linear elastic orthotropic finite element numerical model for further analysis.
Salzmann [9] tested various layups of industrially manufactured edge-glued CLT panels under different point-loading compressive configurations. The study highlighted the importance of stress distribution models in determining strength and stiffness values for cross-layered CLT panels. Bogensperger et al. [10] enhanced Salzmann’s finite element model to determine the kc,90 factors through a parametric study. They introduced plasticity to simulate elastoplastic behavior and discussed linear correlations between member depth, strength, and adjustment factors. The study emphasized the need for future research to reliably determine the kc,90 factor for CLT considering various height and load configurations.
The latest research on this topic was proposed by Brandner [5], who summarized previous studies in this regard, reported on previous experimental outcomes [11], and proposed stress distribution models for the oncoming revision of EC 5. Factor kc,90 of the CLT was satisfactorily estimated using his proposed stress distribution subjected to various load configurations. The validation was conducted for the tests reported by Ciampitti [11]. Recommendations were given for generic load transmission cases (e.g., column below wall), and a simplified stress distribution model was proposed and remained open-ended for additional validation.
A combination of panelized and post-and-beam construction is often preferred where the columns are resting on the CLT slab. This is when solutions like replacing bearing walls with columns become especially attractive. Although mentioned and theoretically treated by Brandner [5], experimental results regarding this load configuration are still missing in the literature.
This work seeks to further contribute to the understanding of the mechanical behavior of CLT panels subjected to compression perpendicular to the plane loading where the column is resting on the slab. For this purpose, at first, non-edge-glued softwood CLT panels were manufactured and tested in the laboratory. Uniformly compressed prismatic cubic specimens were also tested to determine their basic properties, followed by applying a concentrated slab to the CLT slab that resembles the load from the column acting on the CLT slab. The corresponding kc,90 factors are then proposed for CLT using Brandner’s recommendations [5].

2. Experimental Program
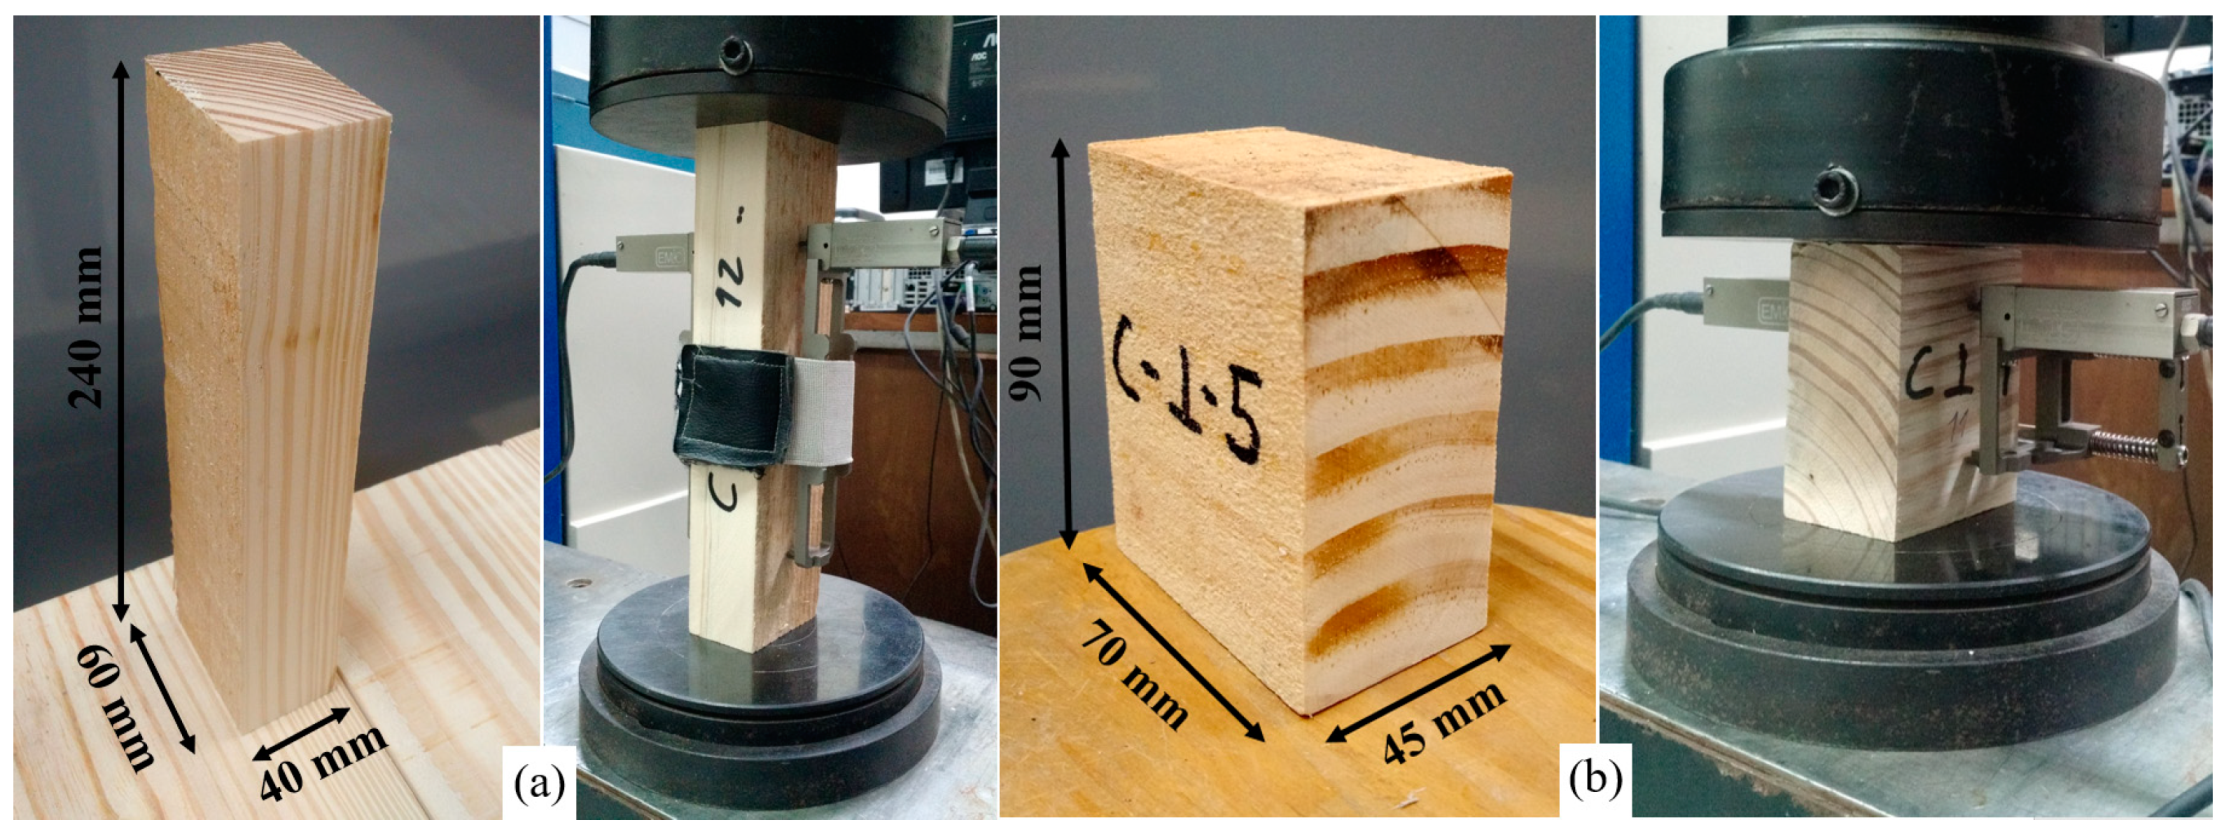
2.1. Raw Material

Pinus elliottii lumber from a homonegous forest located in Piratini/Brazil was used to manufacture the studied CLT panels. To account for variations, two different batches were acquired, called Batch 1 and Batch 2. Batch 1 contained a higher proportion of juvenile wood, while Batch 2 contained more mature wood. The structural adhesive used was a one-component polyurethane, Jowapur® 686.60, which was supplied by Jowat (São José, Brazil). This adhesive is a fiber-reinforced glue that is cured with wood moisture under ambient conditions appropriate for load-bearing structural engineered wood products, such as glulam and CLT [12].

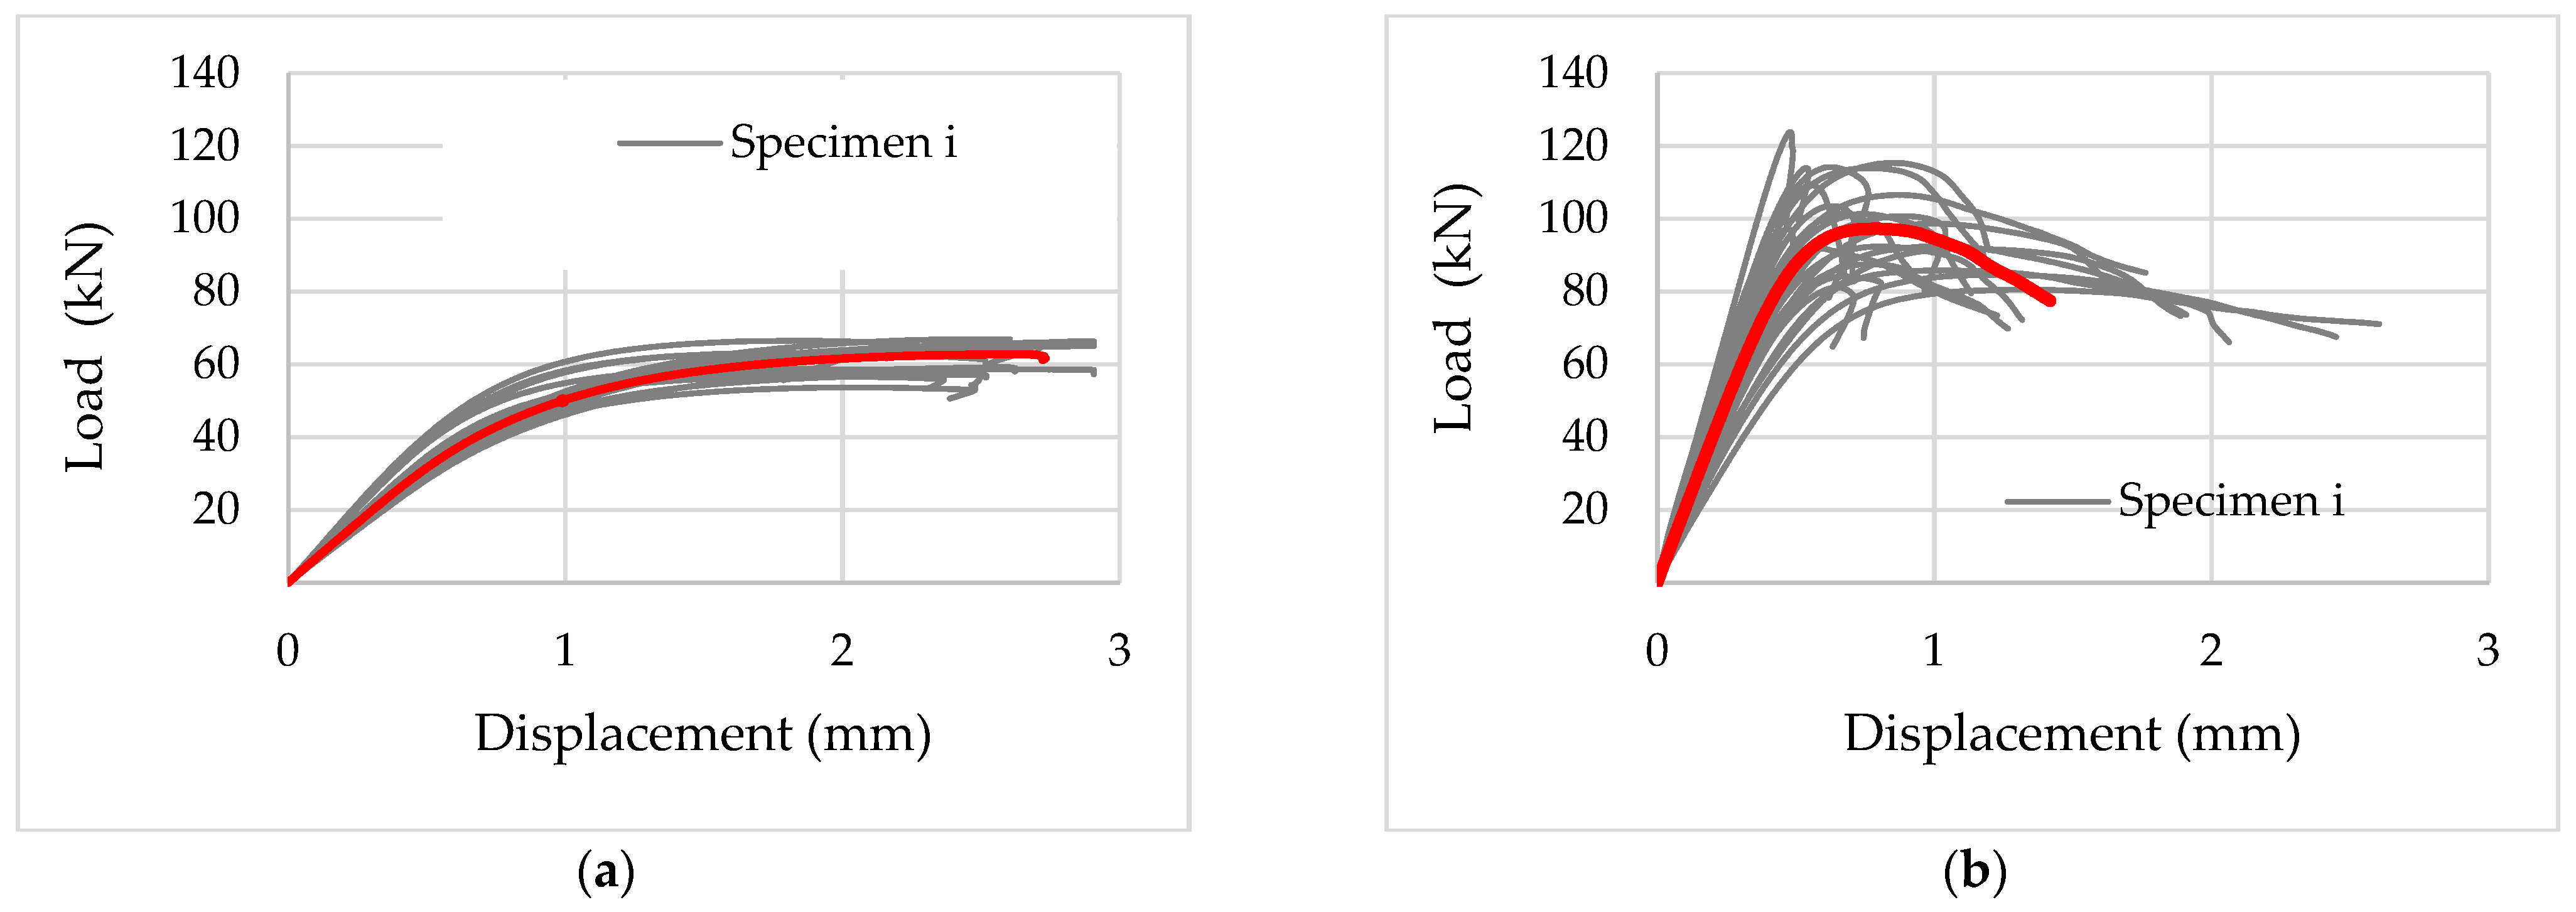
2.2. Clear Wood Properties

The compressive properties of clear wood were determined first. Compressive parallel and perpendicular to the grain tests were performed in 24 samples as per European standard EN 408 (2004) [13], following the required testing procedure, specimens’ conditioning, and dimensions. The geometry of the specimens was adopted as 40 × 60 × 240 mm and 45 × 70 × 90 mm for the parallel and perpendicular to the grain specimens, respectively (see Figure 1). The moisture content was 12 ± 2% at the time of the cutting, and the specimens were then stored for 7 days in a climate chamber at 24 ± 2 °C and a relative humidity of 65 ± 3%.
Mechanical properties were calculated from the acquired load-displacement curves, which were obtained from the universal testing machine (a DL 3000 model, Emic brand). The following properties were obtained: modulus of elasticity (Ec,0) and strength (fc,0) in compression parallel to the grain; modulus of elasticity (Ec,90), strength (fc,90), yield stress (fc,90,y), and tangent modulus (T) in compression perpendicular to the grain. For the yield stress, as EN 408 does not express a criterion in this regard, ISO 13910 (2014) [14] was used. The tangent modulus was obtained based on Franke and Quenneville [15]. Displacements were measured on both sides of the specimens with 0.1 µm resolution extensometers. The gauge length was 150 mm and 50 mm for the parallel and perpendicular to the grain specimens, respectively.
Each batch of lumber was individually tested, and their results are shown in Figure 2 and Table 1. The juvenile woods obtained in Batch 1 notably show a ductile behavior under compression parallel to the grain that contrasts with the brittle nature of mature woods (Batch 2). This is due to the anatomical differences between juvenile and mature woods attributed to them [16]. As per the findings of Bao et al. [17], juvenile wood typically exhibits shorter and smaller fibers with a thinner cell wall. It is further distinguished by a significantly larger microfibril angle, a higher content of extractives, substantially lower wood density, lower transverse shrinkage but increased differential shrinkage, heightened moisture diffusion and absorption capacity, and distinct mechanical properties. Kretschmann [18] reported juvenile to mature ratio ranges between 0.45–0.75 and 0.5–0.9, respectively, in terms of compressive modulus and strength parallel to the grain. The parallel to the grain properties of Batch 2 wood is in agreement with the values provided by the Brazilian standard NBR 7190 (1997) [19] for Pinus elliottii woods.
Concerning perpendicular to the grain properties, despite similar stiffness or moduli in both batches, distinct characteristics were noted. Notably, juvenile wood exhibited a higher coefficient of variation in both moduli and strength compared to its parallel to the grain counterparts. Compression strength perpendicular to the grain surpassed that parallel to the grain. As indicated by Kretschmann [18], the orientation angle of annual rings and the percentage of mature wood significantly impact compression strength perpendicular to the grain, showing no consistent trend. Consequently, the variations between Batch 1 and 2, along with the higher coefficient of variation, can be attributed to differences in the angle of annual rings and the percentage content of juvenile wood. Previous studies have reported coefficients of variation values of approximately 30% for Ec,90, and up to 4 times variation in tangent modulus in different directions related to the wood’s growth rings [15,18]. Notably, the obtained mechanical properties tended to be closer to minimum values than maximum ones, as expressed by Pearson’s skewness coefficient—G1 [20]. For a more in-depth exploration of clear wood properties, additional details can be found in Mendes [16].

2.3. CLT Manufacturing and Specimens

A total of 18 CLT panels (6 panels each per different layup) were manufactured according to the requirements outlined in European standard EN 16351 (2017) [21], and their dimensions are shown in Figure 3. Boards from series A were manufactured using wood from Batch 1, which contained a higher amount of juvenile wood. Lamellae for Series A were 21 mm thick and 120 mm wide, and the ones for both Series B and C were 35 mm thick and 150 mm wide, having a thickness-to-width ratio above 4, as demanded by the standard EN 16351 (2017) [21]. The experimental plan is detailed in Table 2.
The manufacturing process of the CLT panels comprised three well-defined stages: (i) cutting of lumber to the final lamellae dimensions; (ii) adhesive application and conformation of the panel; and (iii) pressing and conditioning. Lumber boards were cut in stage (i) using woodworking industrial saw machines, and the final thicknesses of the lamellae were reached with a bench planner, as shown in Figure 4a. Dimensions were measured with a 0.01 mm resolution digital caliper. Following EN 16351 (2017) [21], in the case of resinous conifers, planning must be performed 6 h before gluing. This is to ensure that the adhesive penetrates correctly into the open pores of the wood surface.
In stage (ii), after cleaning the remaining dust from planning, the adhesive was directly applied to the wood and spread with a spatula, as shown in Figure 4b. The adhesive was poured at an amount of 200 g/m2 as per adhesive specifications [12]. This adhesive was only applied to the lamellae faces and not on their edges, i.e., the CLT was not edge glued. Lamellae were then placed under a hydraulic press to conform to CLT plates. Stage (iii) consisted of pressing the panels to a pressure of 1 MPa for 120 min, as specified by the adhesive manufacturer, which is shown in Figure 4c. Finally, the CLT panels were stored in a climate chamber (20 ± 2 °C and 65 ± 3% relative humidity) for 7 days on a flat surface and free of external loads, as displayed in Figure 4d.
Out of 6 panels, 5 were used for applying a concentrated load simulating a slab clamped between a wall and a column. Additionally, a total of 9 cubic specimens with a dimension of 160 (width) × 160 (length) mm were cut from one panel per series to conduct pure compression perpendicular to the grain properties. The height of the pure compression samples varied depending on the number of layers and thickness of the layers, as outlined in Table 2. Brandner [5] proposed that cubic specimens should be taken arbitrarily from CLT panels, disregarding typical growth characteristics (e.g., knots, cracks, etc.) as well as typical CLT product characteristics, such as gaps. This allows considering the influence of different sawing patterns of lamellae within the same layer, i.e., the influence of annual ring orientation.
As outlined in EN 16351 (2017) [21], the basic properties of the CLT were determined in compression perpendicular to the plane, according to EN 408 (2004) [13]. The latter standard demands a minimum compression area of 25,000 mm2. Therefore, this work adopted the aforementioned square area with 160 mm of the side as the load area (thicknesses shown in Figure 3), which was also proposed by Salzmann [9] and Halili [7].

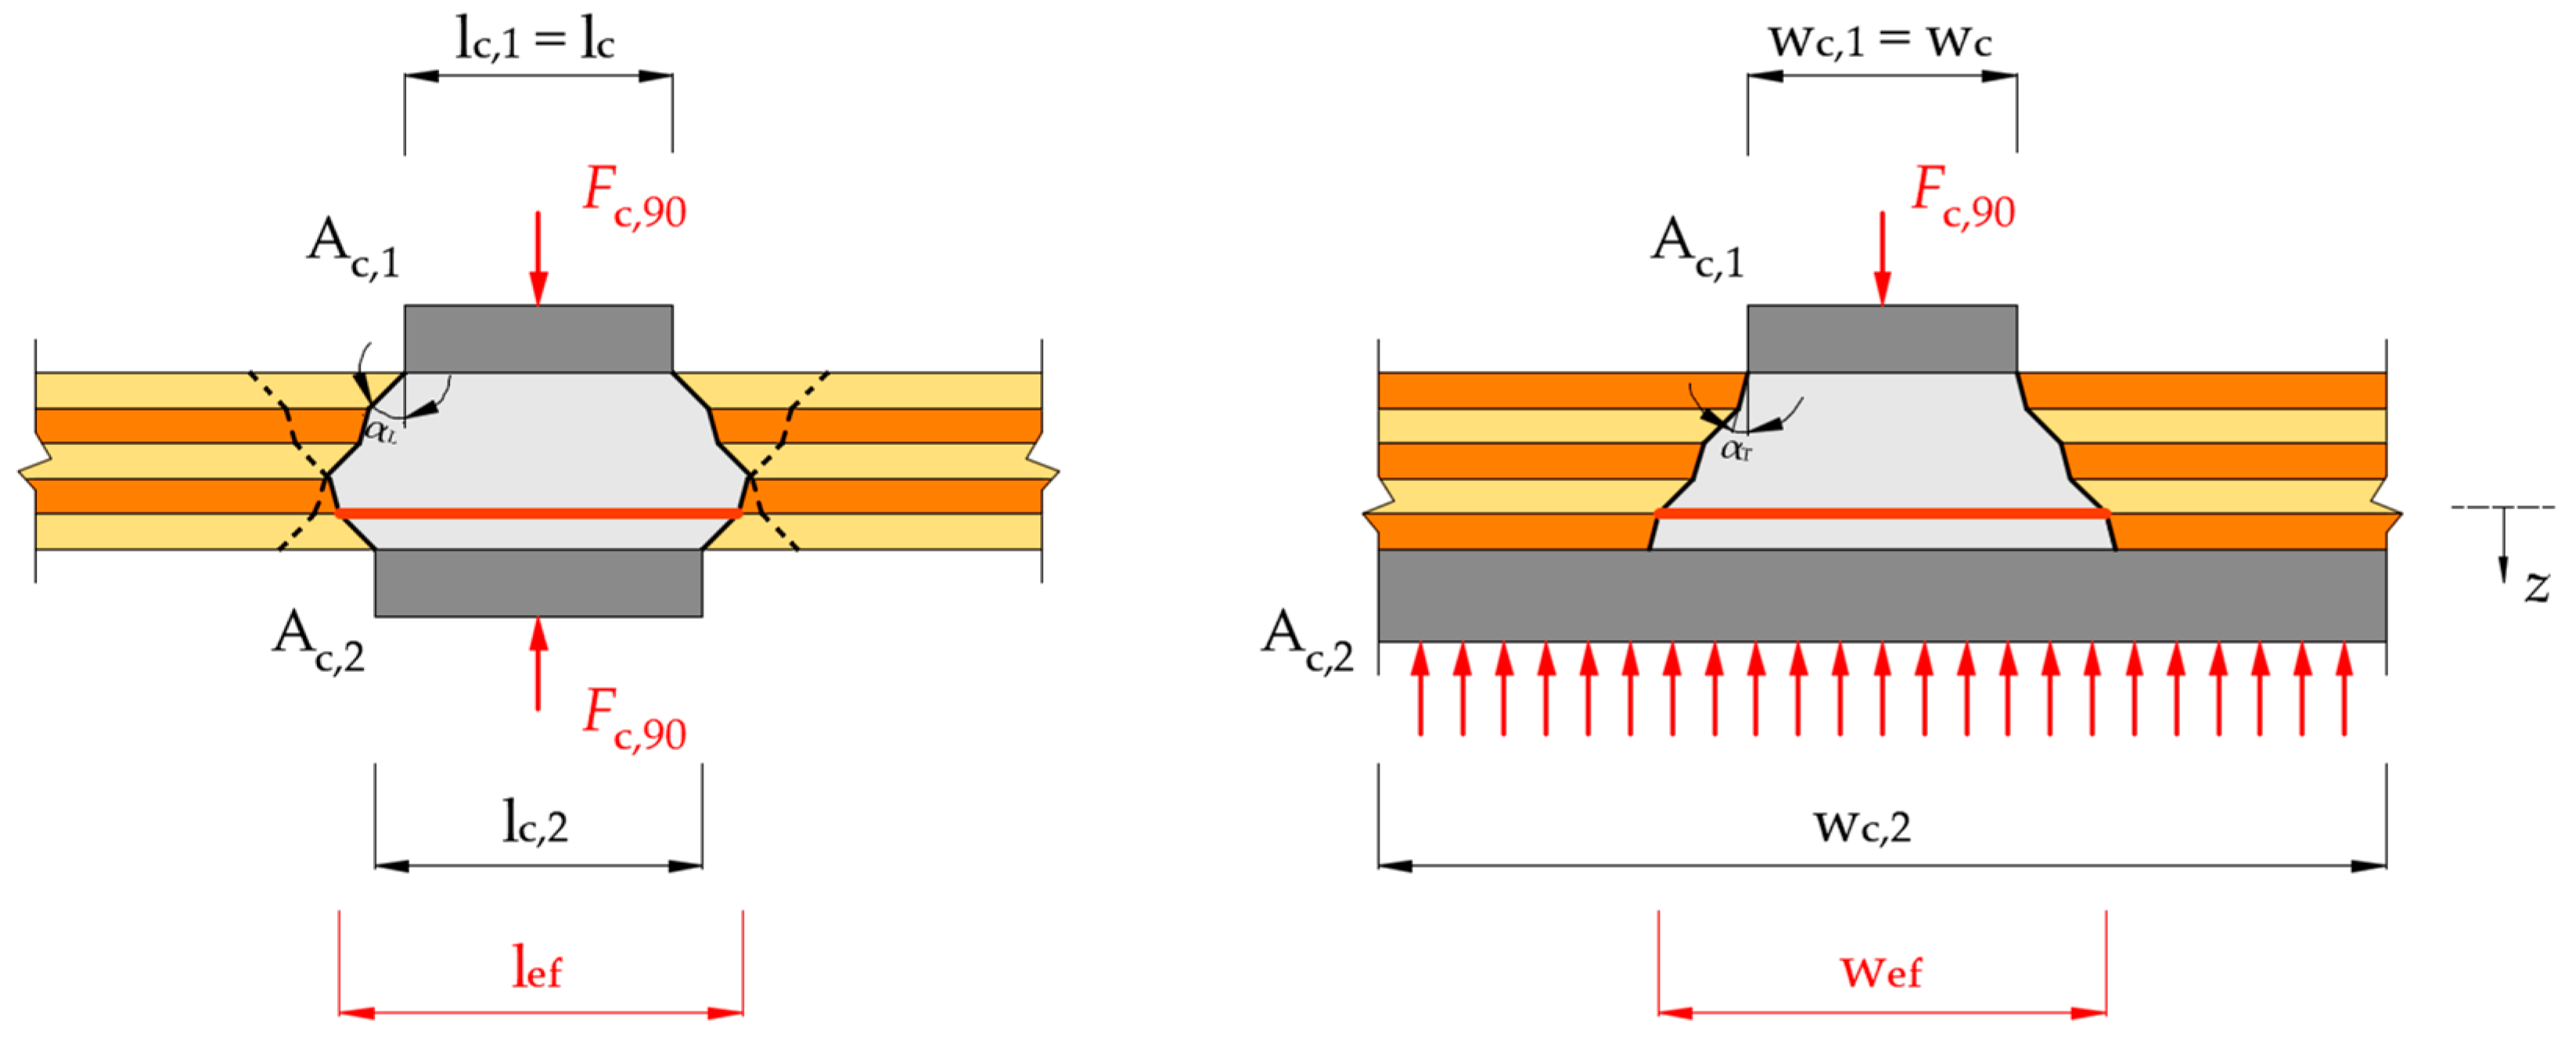
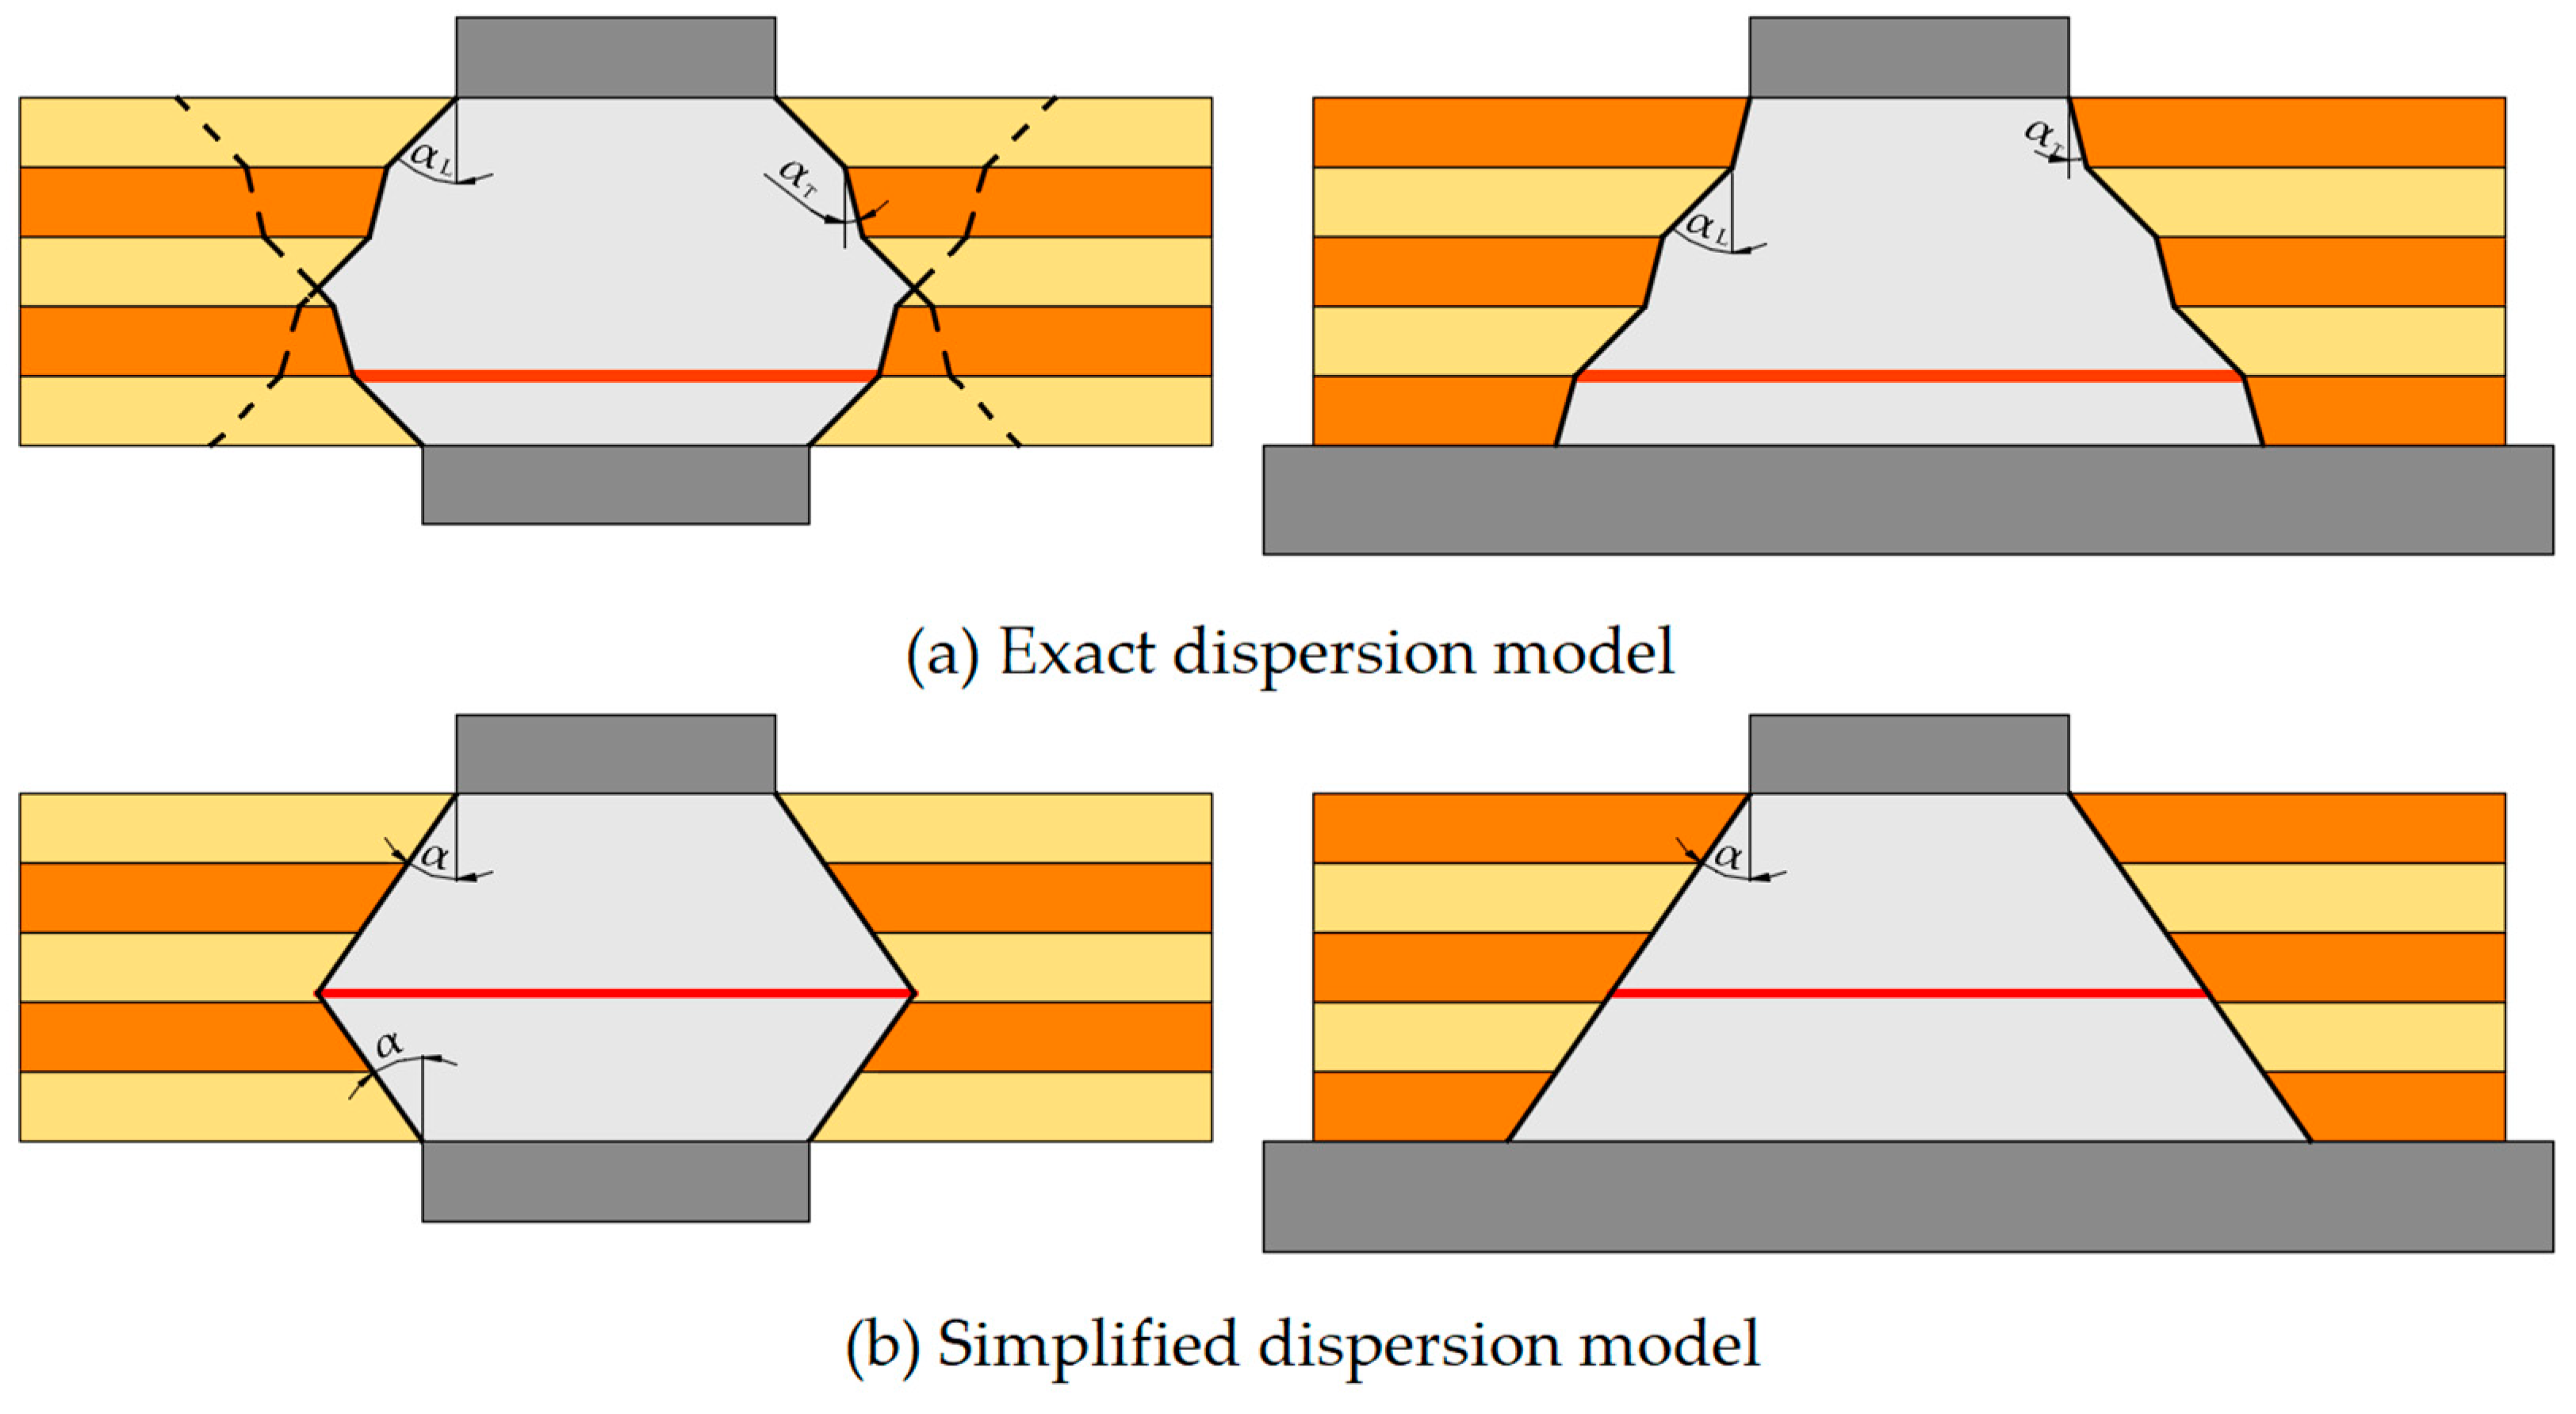
2.4. Compression Stress Dispersion Models

Two stress dispersion models were studied in this work: (i) the exact model proposed by Brandner [5] for generic cases, which is an adaptation of van der Put’s model [8]; (ii) the simplified model proposed by Brandner [5], in which a stress dispersion angle of 35° is considered for both longitudinal and transverse layers of CLT. Stress dispersion models consider different criteria for calculating the effective area for compression perpendicular to the grain (Ac,ef). This area follows Equation (1) for quadrilateral contact areas, with effective width (wc,ef) and length (lc,ef) as the width and length of the contact area (wc and lc).
A c , ef = w c , ef · l c , eff A c = w c · l c
The kc,90 factors that relate to both of these areas were then determined empirically and graphically. The empirical calculus compares the experimental results of a particular compression perpendicular to the plane load configuration against a uniformly loaded prismatic specimen with no stress distribution. This is described by Equation (2), where fc,90,LC and fc,90,P are the compression perpendicular to the grain strengths of a particular load configuration (LC) and for a prismatic specimen (P), respectively.
k c , 90 = f c , 90 , LC f c , 90 , P = A c , ef A c 1.00
Graphically, the effective area (Ac,ef) can be estimated assuming dispersion angles that depend on the material being compressed. In the case of a cross-layered product like CLT, EN 1995-2 (2014) [22] suggests different angles for transverse and longitudinal layers. Brandner [5] adopted these angles as per this standard, assuming a spread angle of 45° (αL) and 15° (αT) for longitudinal and transverse layers, respectively. Thereby, Brandner [5] suggested the ultimate limit state (ULS) design equation considering the kc,90 factor, where σc,90,d and Fc,90,d are the design compressions perpendicular to the grain stress and load, respectively. And, fc,90,P,d is the designed compression perpendicular to the grain strength based on the basic characteristic value, which is determined over the entire surface-loaded prismatic specimens, as shown in Figure 5.
Σ c , 90 , d = F c , 90 , d A c f c , 90 , P , d · k c , 90         with         k c , 90 = A c , ef A c = w c , ef · l c , ef b c · l c   5
For generic cases of load transmission between contact areas with unequal dimensions, e.g., loading from a column on a CLT panel, it is suggested to calculate Ac and Ac,ef, presented in Equations (4) and (5), using Figure 5. It should be noted that in load configurations like wc,ef and lc,ef might not be in the same plane, i.e., having the same z-coordinate.
A c = min l c , 1 ; l c , 2 · min w c , 1 ; w c , 2
A c , ef = max min l c , ef , 1 z ; l c , ef , 2 z · min w c , ef , 1 z ; w c , ef , 2 z
The solution to Equation (5) is not straightforward to estimate by hand calculation. For this reason, Brandner [5] proposed a simplified method [denoted as method (ii) in this article], which indistinctly considers a stress spread angle of 35° for both the longitudinal and transverse layers of CLT.

2.5. Compression Perpendicular to the Plane Test

Tests were executed following EN 408 (2004) [13] provisions regarding gauge length and specimen height. Cubic specimens were uniformly loaded and supported. In contrast, the plate specimens (in the column below the wall load configuration) were centrally loaded and line-supported on a width of 195 mm along their minor strength direction, as illustrated in Figure 6. On both cubes and plates, the load was applied through a 160 mm wide and 40 mm thick A36 steel square plate (as per ASTM standard). This compression plate was monolithically rigid, i.e., it did not have a spherical head, so the downward movement remained flat. Displacements were measured using the displacement transducer of the testing machine, with a 0.1 µm resolution. Thus, displacements were determined over the whole specimen depth. A preload of 500 N was applied before the testing began to avoid a possible horizontal slip of the loading plate.
Regarding the cubic specimens, 3 cubic specimens per series were used to calibrate the descent speed of the actuator in order to reach the maximum load, Fc,90,máx, within 300 ± 120 [13]. Test speeds of 0.5 mm/min, 0.55 mm/min, and 0.8 mm/min were adopted for Series A, B, and C, respectively. The test end criterion was a duration of 600 s. For the bearing specimens, a test speed of 0.7 mm/min was adopted for Series A and B, whereas Series C was loaded at 0.95 mm/min. The tests ended at the end of 900 s, or when a force of 290 kN (cell load capacity) was reached. The obtained results for Ec,90 and fc,90 underwent ANOVA tests. Whenever the null hypothesis was rejected, comparisons of the averages were conducted using Fisher tests at a significance level of 5%. The Fisher tests were employed to elucidate discrepancies among the means, as ANOVA alone may not provide a comprehensive explanation. Significant differences were determined based on the F and p values obtained from the tests.

3. Results and Discussion

3.1. Experimental Results

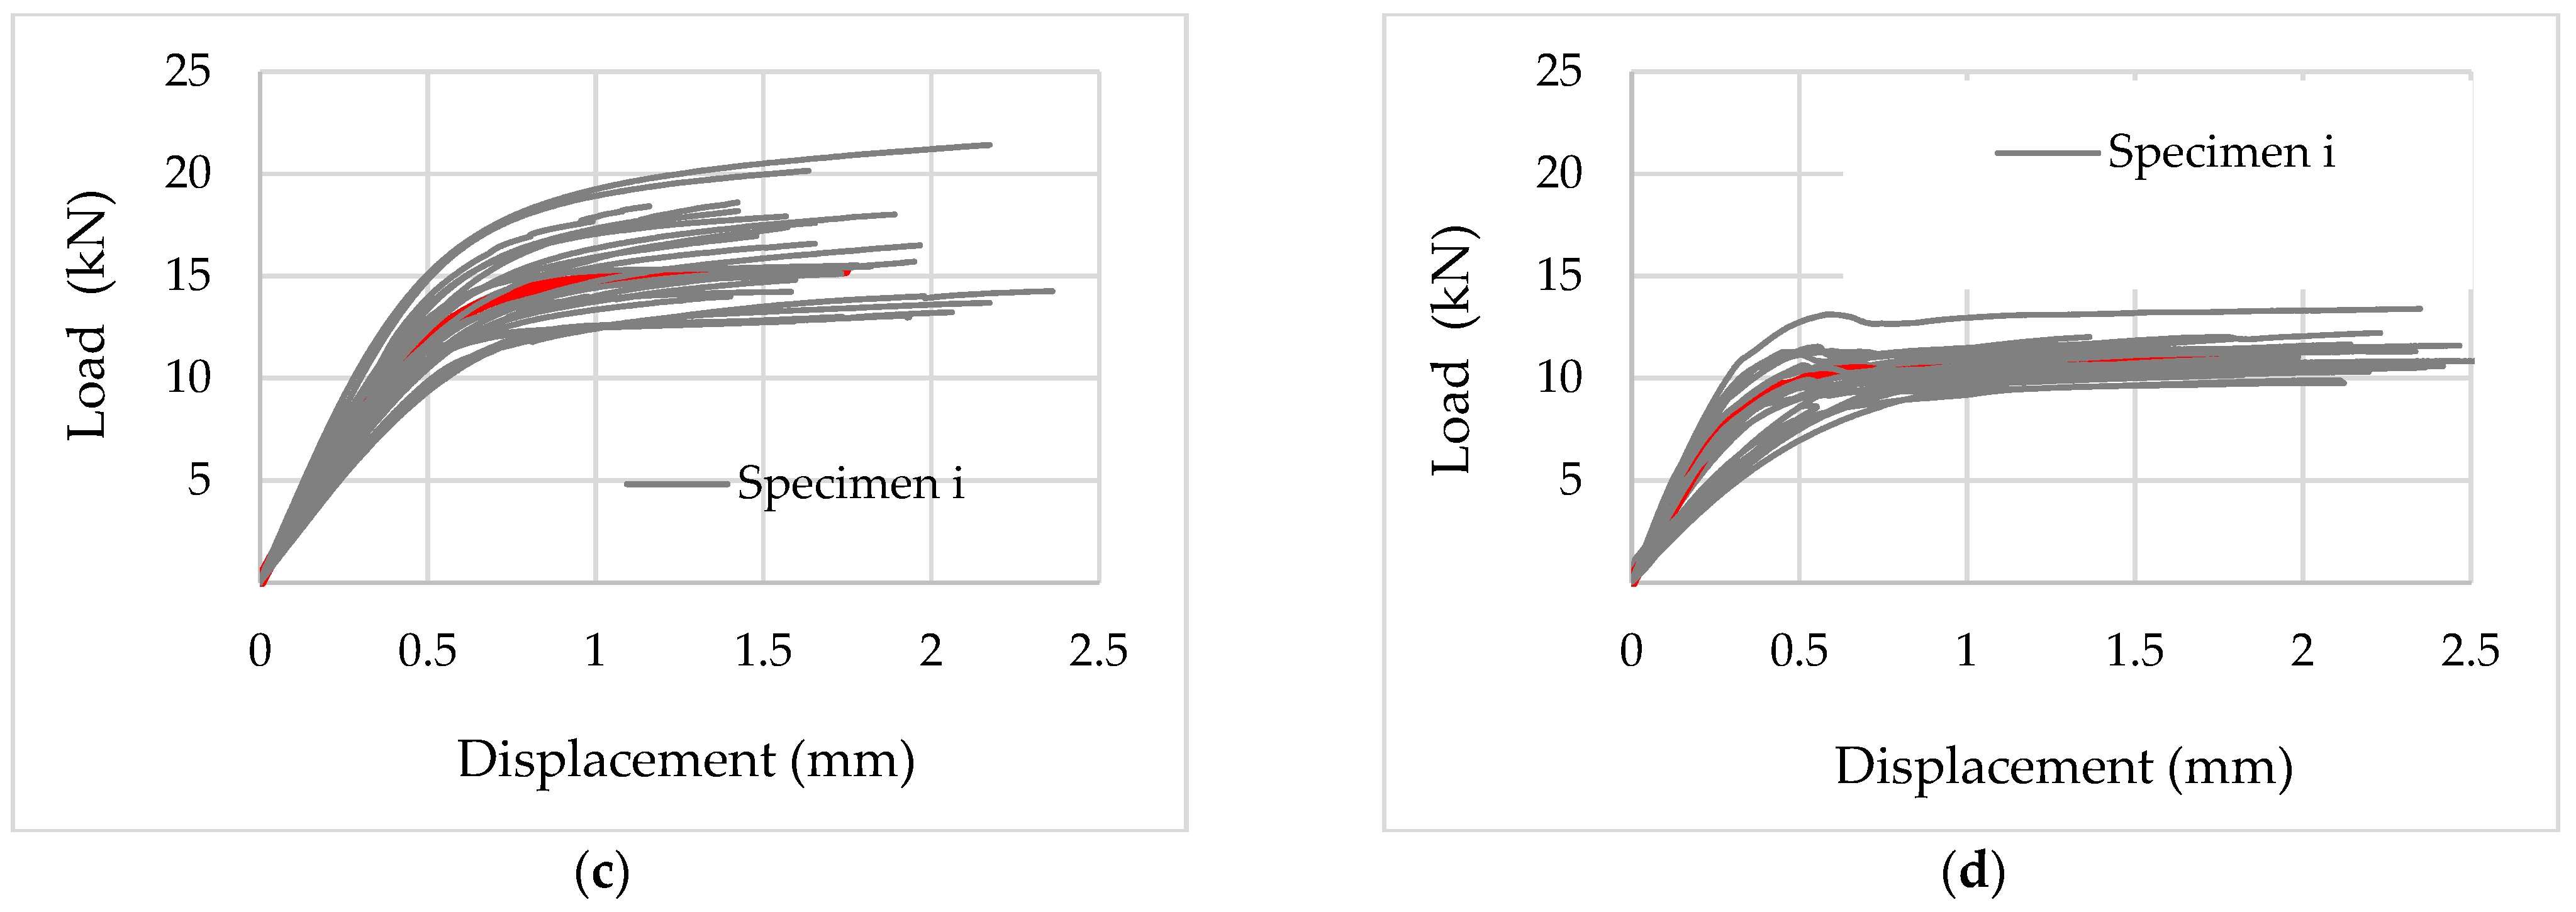
3.1.1. Cubic Specimens

Load-displacement curves and mechanical properties of CLT cubic specimens are shown in Figure 7 and Table 3. As seen in Figure 7, consistent results and behavior can be observed among the samples of the same series, which indicates a satisfactory manufacturing process. Taking into account all series of the manufactured CLT panels, the modulus of elasticity (Ec,90,CLT,P) and strength (fc,90,CLT,P) in compression perpendicular to the grain varied between 240–357 Mpa and 3.95–5.10 Mpa, respectively. Utilizing the average Ec,90,CLT,P and fc,90,CLT,P values from Bogensperger et al. [10] for spruce wood (450 Mpa and 3.33 Mpa) and Ciampitti [11] for pine wood (391 Mpa and 3.48 Mpa) for prisms with quadrangular planes (cubic specimens of 150 × 150 × 150 mm3), Brandner [5] proposed corresponding characteristic values of 400 Mpa and 3.0 Mpa. Brandner also noted that only a minor increase in these properties is observed with an increasing dimension of Ac. Consequently, the obtained strength value aligns well with the results documented in the literature. However, the modulus of elasticity remains relatively lower compared to the reported values in the literature. This discrepancy was also noted by other authors [8,22]. Therefore, it appears that the discrepancies observed in both studies share a commonality in terms of lower property values compared to the broader recent literature. Since Series B and C were made from different wood batches compared to Series A, a few observations can be noted. When comparing the modulus of elasticity of 3 vs. 5-layer CLT with the same depth of 105 mm, the 5-layer CLT (Series A) was found to be 21% higher compared to 3-layer CLT (Series B) of the same depth, and this is due to the interlocking effect provided by the orthogonal layers of CLT. Similar observations were made experimentally by Halili [7] and numerically by Bogensperger et al. [10]. Furthermore, a 17% decrease in terms of modulus of elasticity was observed for thicker CLT specimens (Series C) compared to a thinner one (Series A) when the number of layers remained the same. This conclusion aligns with the observation reported by Salzmann [9]. It is related to increased internal stresses, altered distribution of wood fibers, or other structural aspects specific to thicker configurations. The reference to Salzmann [9] suggests that the observed decrease in modulus of elasticity for thicker CLT specimens in our study is consistent with prior research, reinforcing the validity and reliability of our findings in the context of the existing literature.

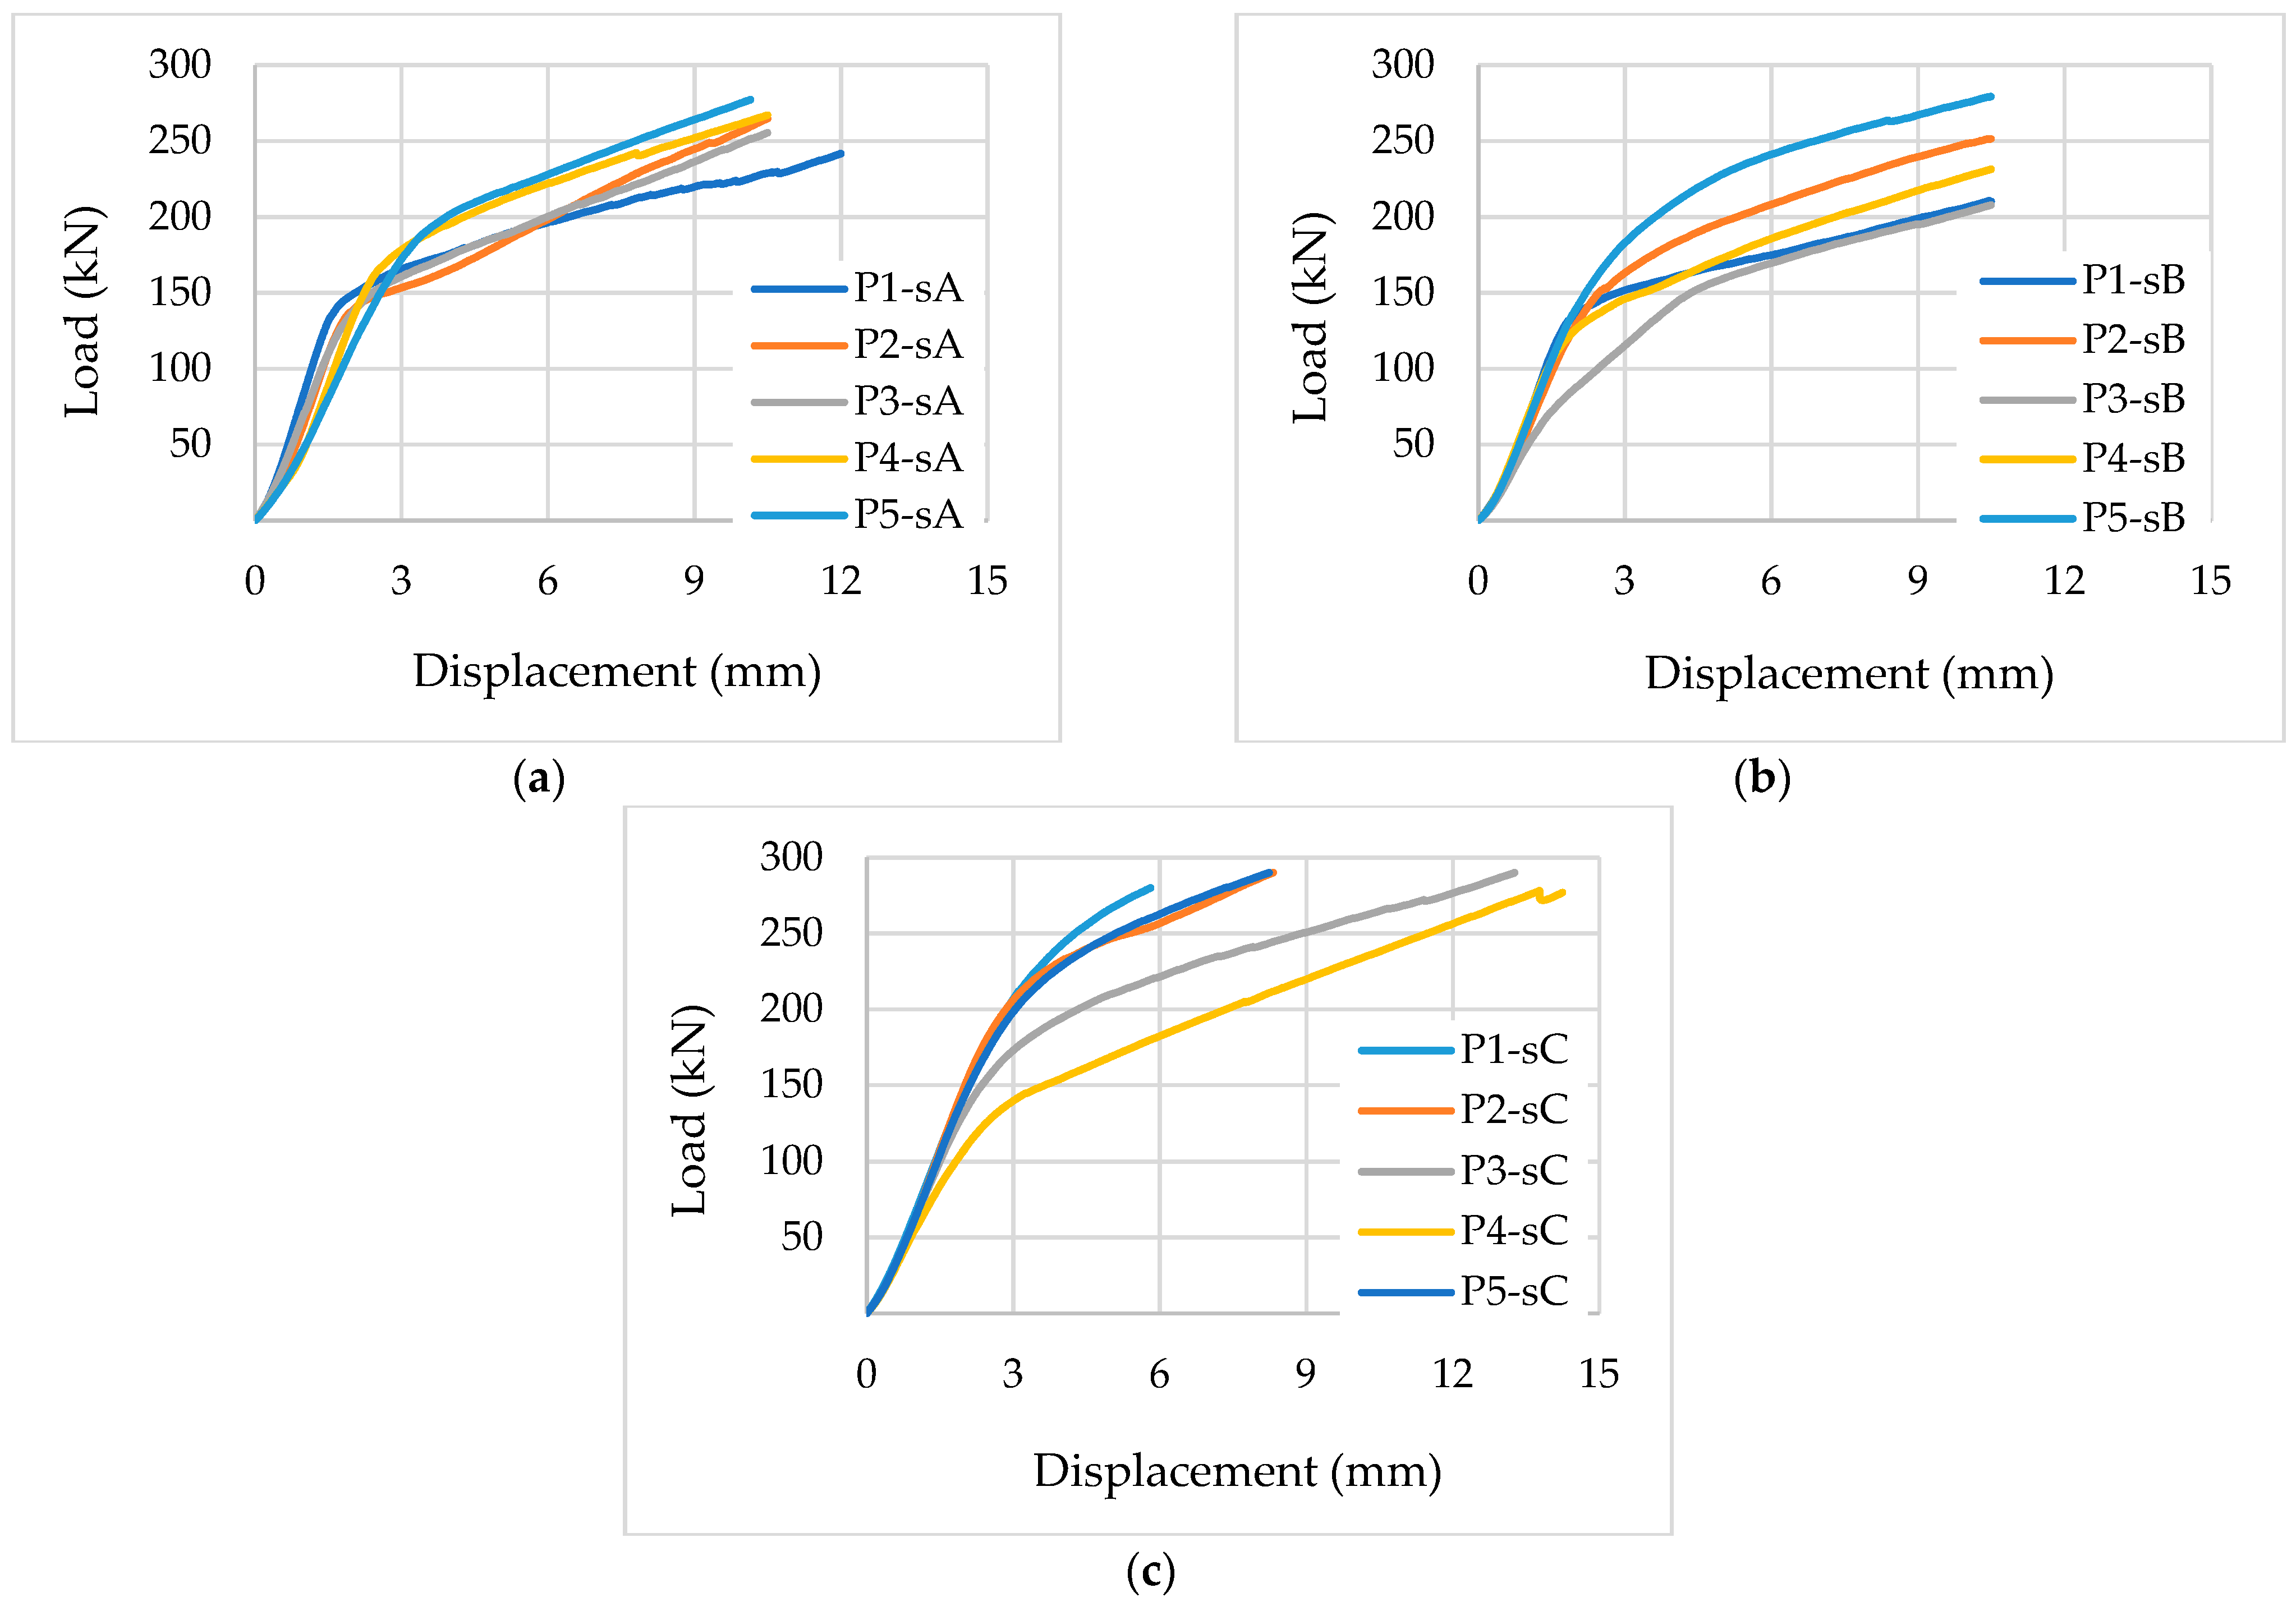
3.1.2. Plate Specimens

Load-displacement curves of CLT specimens tested on the column below the wall load configuration are shown in Figure 8, and their calculated mechanical properties are listed in Table 4. The experimental outcomes of Ciampitti [11] were consistent with the findings of the current study. In contrast to Brandner’s [5] statement that load dispersion cases lead to smaller variation in results, the current study found higher coefficients of variation values in CLT plate specimens compared to cubic specimens. Compared to the cubic specimens, the variability (in terms of load-displacement behavior) between the samples, or the coefficient of variation in each series, is higher for the plate specimens. This variation can be attributed to the size effect. Since the plate samples are larger than the cubic specimen, the natural variations in wood, such as the presence and location of natural defects, can influence the mechanical behavior. In the post-yield region, the variation becomes more pronounced since the location and size of natural defects can result in different crack propagation and, hence, failure paths that lead to variations in ultimate strength.
While examining the effect of a number of layers (with equal depth), minor changes in strength and modulus of elasticity can be observed between Series A and B. In contrast, when the number of layers remains the same but the overall depth is increased (Series A vs. C), a significant increase in modulus and strength is obvious. This demonstrates the fact that more bearing area is available in Series C due to its higher depth, which contributes to its load-bearing capacity. This can be further explained by the stress dispersion model shown in Figure 5, which shows that a higher depth of the element will provide more bearing area to carry the same amount of load, which ultimately results in higher load-bearing capacity before failure.
Concerning failure modes, all specimens presented a very localized crushing around the loaded area (see Figure 9a), with the exception of the P4-sC specimen (see Figure 9b), which was also subjected to a rolling shear failure on the exterior border of the loaded lamellae. The exterior end (in the support region) is subjected to higher shear stress, where delamination occurred first in the P4-sC specimen, which then led to rolling shear failure. The delamination and rolling shear failure are shown in green and red lines, respectively, in Figure 9b.

3.1.3. Compressive Stress Dispersion and kc,90 Factor

Table 5 presents the kc,90 factor for the CLT plate tests, which were determined from the experimental data using the models proposed by Brandner [5]. In accordance with Brandner’s proposed methodology [5], when dealing with load distribution and contact areas of varying dimensions, it is recommended to determine Ac equal to the sectional area of Ac,1 and Ac,2, expressed as Ac = min[ℓc,1; ℓc,2] × min[wc,1; wc,2], as illustrated in Figure 5. In scenarios where the contact areas are of equal dimensions but not squared, lc,ef and wc,ef may not align within the same plane, i.e., have the same z-coordinate. In such cases, it is advisable to compute Ac,ef using the formula Ac,ef = max[min[ℓc,ef,1 (z); ℓc,ef,2 (z)]·min[wc,ef,1 (z); wc,ef,2 (z)]]. This equation is employed to define the positions of the red lines depicted in Figure 10.
Figure 10 graphically compares both these models for a Series C plate, where the red line represents the corresponding length and width of the effective area of compression perpendicular to the grain Ac,ef for each of them. The values of the factor kc,90 are determined using three methods. In the first method, an exact adaptation of Van Der Put’s model is implemented as per Equation (2), which is designated as kc,90,VP. The simplified dispersion model, proposed by Brander [5], is adopted as the second method following Equation (3) to determine kc,90,s. The third approach is the real experimental values determined for cubic and bearing specimens, as reported in Table 3 and Table 4. Here, for both longitudinal and transverse layers, an angle of 35° was considered.
While comparing the efficacy between the VP and simplified model, the variation between the kc,90 factor determined using these two methods is negligible for all three series. However, when these calculated values using analytical approaches are compared against the real experimental values k c , 90 = f c , 90 , LC f c , 90 , P , the analytical approach overestimates the kc,90 factor for Series A and B but underestimates it for Series C. The overestimation, however, is within 2 and 10–15% for Series A and B, respectively, which have an overall depth of 105 mm. As the overall thickness increased to 175 mm (Series A), the analytical approach underestimated the kc,90 factor by approximately 13% (1.88/2.15 = 0.87). This might be inferred as a limitation for the analytical approach towards the increase in thickness of CLT. This is because the difference between the actual and calculated bearing area increases with the increase in the overall thickness of the CLT. Further study is needed to modify the kc,90 factor to account for the varying depth of the CLT panel [5].

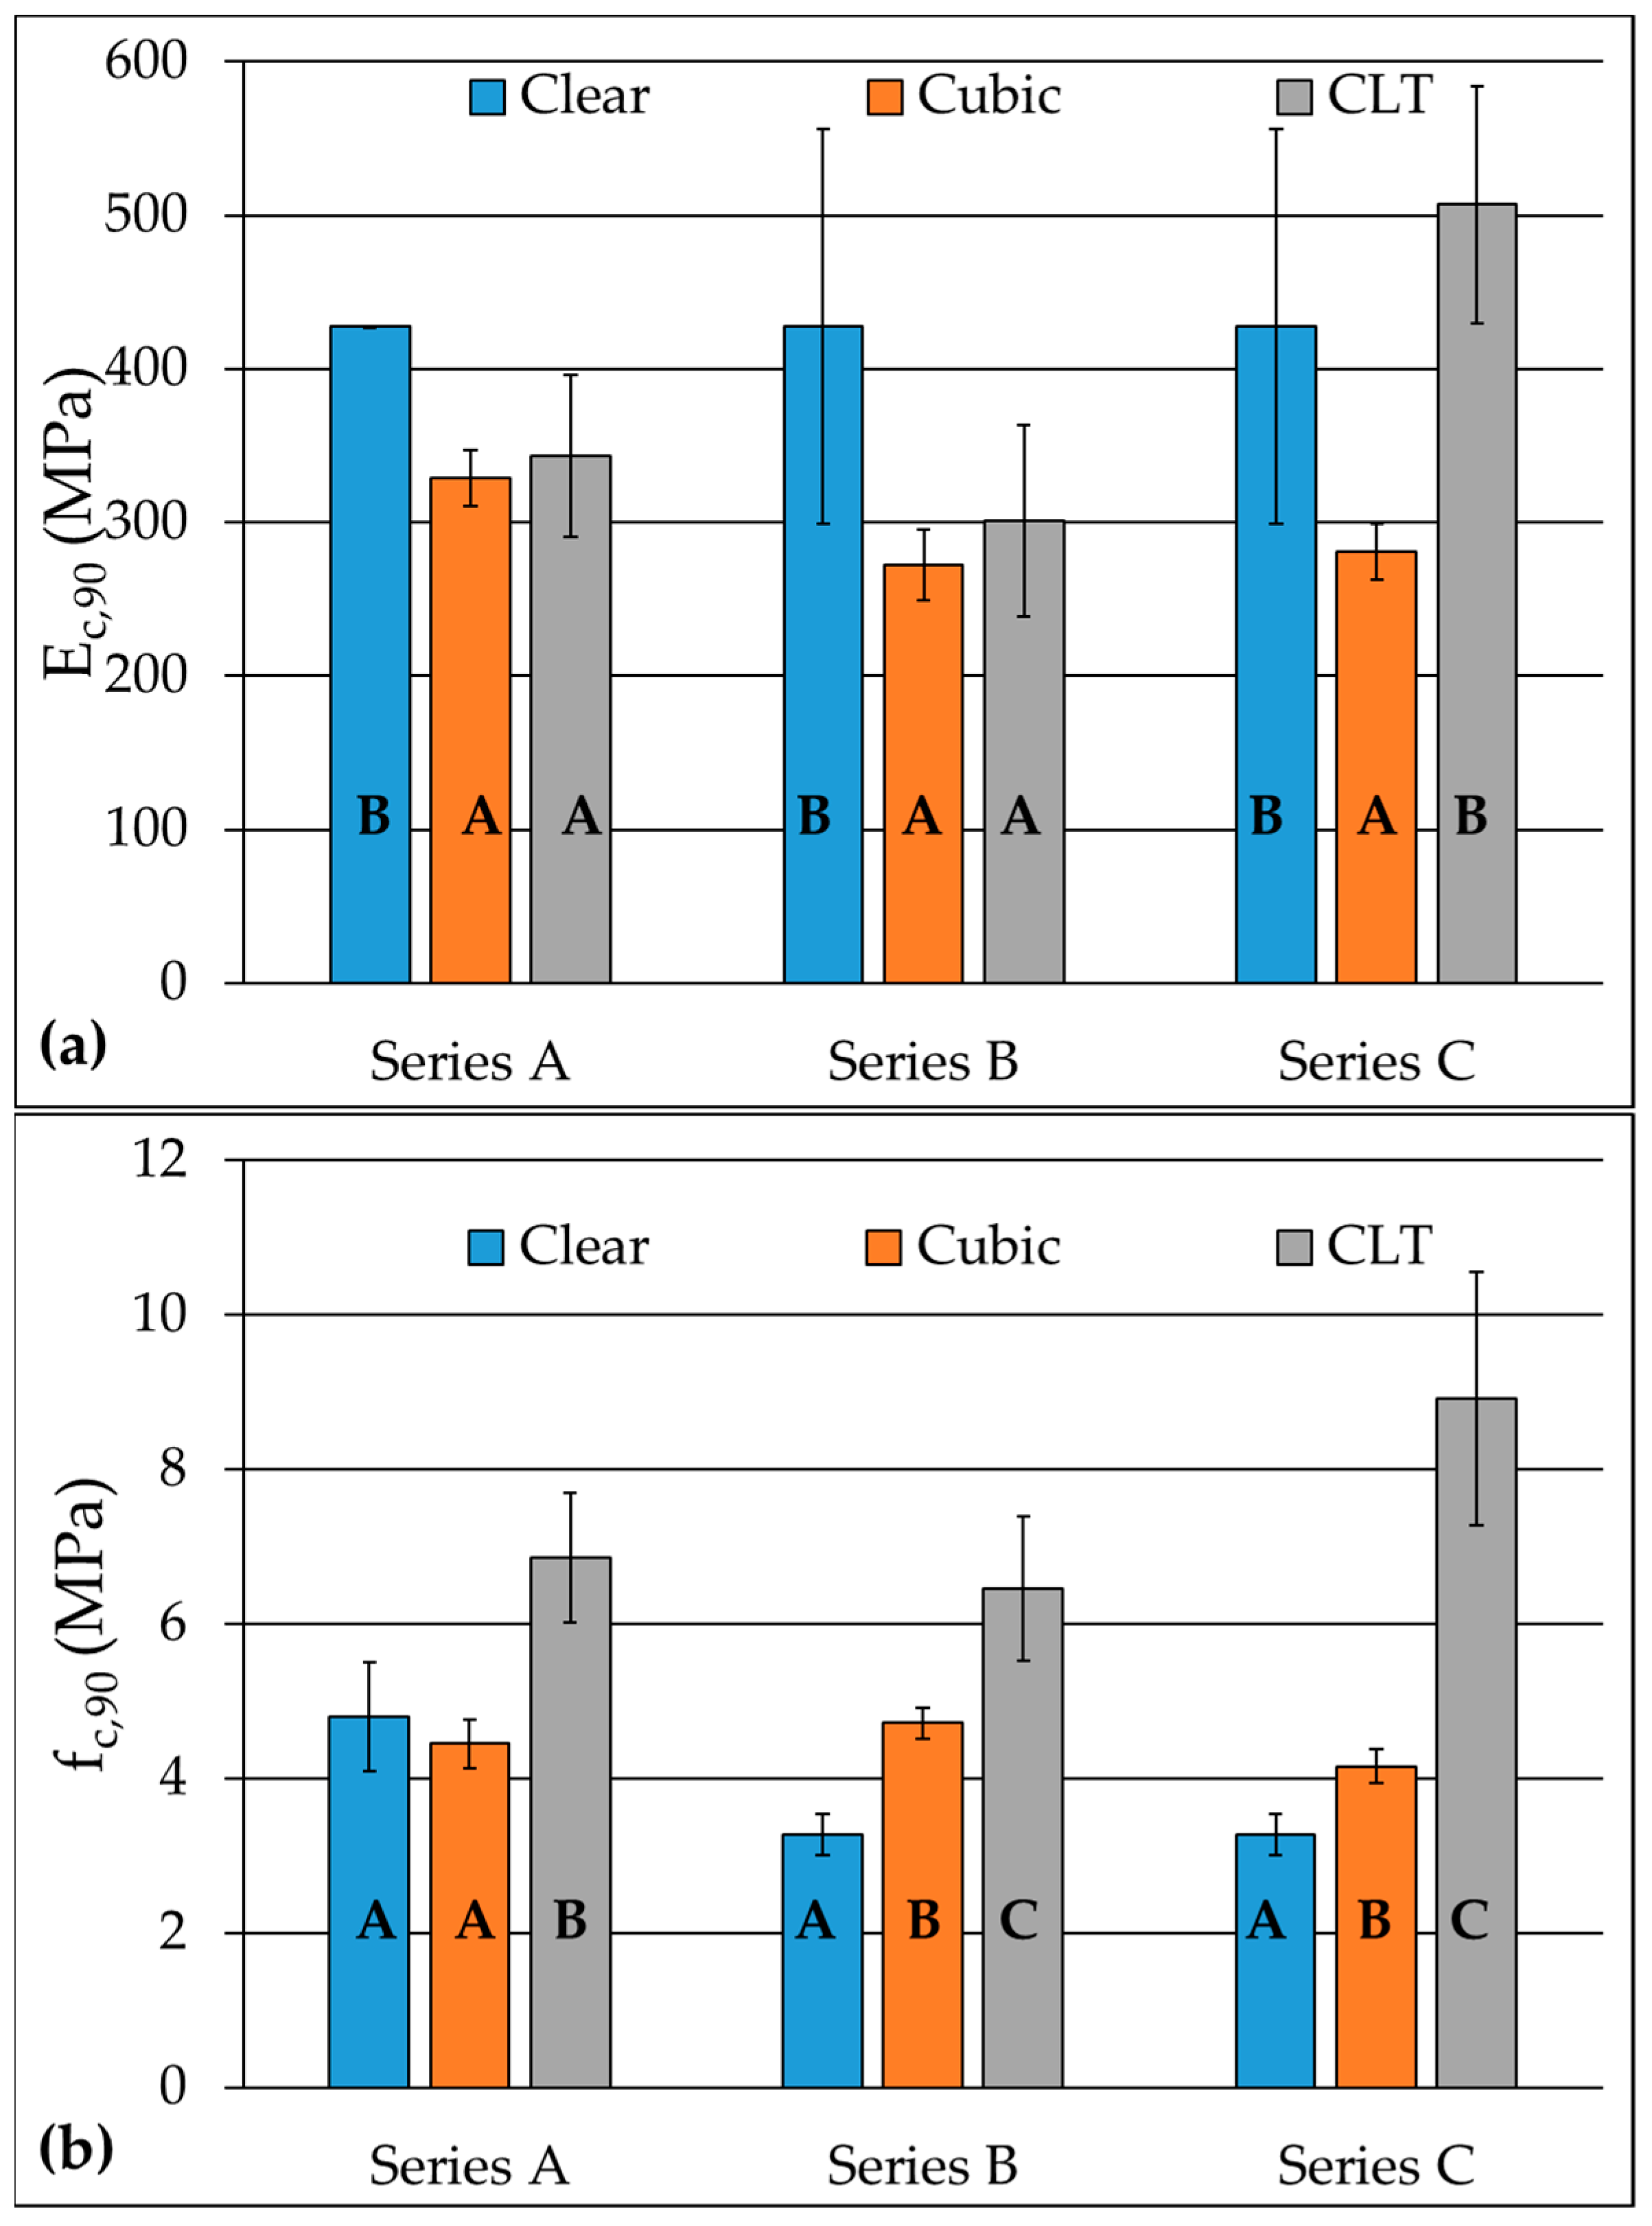
3.1.4. Comparison of Compression Perpendicular to the Grain Properties

Figure 11 illustrates a comparison of moduli and strengths related to compression perpendicular to the grain properties for three types of testing conducted on clear wood, cubic, and plate CLT specimens. When examining the modulus of elasticity (Figure 11a), it is observed that cubic specimens exhibit slightly lower values compared to clear specimens. This outcome is anticipated since clear specimens are devoid of any defects. The modulus tends to increase for CLT plate specimens in comparison to cubic ones across all series, albeit remaining below the values observed for clear specimens in Series A and B. It’s important to note that compression perpendicular to the grain in CLT is not purely compressive due to the potential for localized load resulting in bearing failure. However, the load dispersion discussed in the previous section contributes to an overall increase in capacity for CLT. As the depth of CLT increases, the dispersion area also expands, leading to a higher modulus of elasticity for 5-layer CLT (Series C), ultimately surpassing the capacity of the clear specimen. Therefore, the behavior of the modulus of elasticity perpendicular to the grain can be summarized as follows:
  • The elastic modulus in compression perpendicular to the grain decreases due to the size effect.
  • The elastic modulus in compression perpendicular to the grain increases due to the increase in thickness.
The compression perpendicular to the grain strength exhibits different characteristics compared to the respective modulus, as discussed above (Figure 11b). For a higher percentage of mature wood (Series B and C), the compressive strength perpendicular to the grain increases from clear wood to cubic CLT and from cubic CLT to CLT plate. Series A also behaves similarly, except for the cubic specimen, which has a slightly lower strength (8%) compared to the clear wood specimen. In general, the size effect is found to be less pronounced for strength, which is in contrast with elastic modulus. Within the context of this study, the strength increases with the increase in thickness of the specimen.

4. Conclusions

CLT panels with three different layups were manufactured and tested under compression perpendicular to the plane. The effects of layer thickness and the number of layers were investigated. Series A and C consisted of five layers, whereas Series B consisted of three. The overall depth of Series A and B was kept at 105 mm with a layer thickness of 21 and 35 mm, respectively. Series C had a layer thickness of 35 mm, resulting in an overall depth of 175 mm. These three series of samples were tested under two loading conditions. In the first instance, cubic CLT specimens were tested under uniform compression perpendicular to the grain. In the second scenario, a concentrated point load was applied to a large CLT panel to simulate loading from a column resting on the CLT slab and a slab resting on the wall (bearing capacity). Furthermore, clear wood samples were characterized before making the CLT panels to investigate the mechanical properties of the feedstock. Lastly, the stress dispersion model proposed by Van Der Put and Brander to determine the kc,90 factor was validated against the experimental value.
  • When comparing the compression perpendicular to the grain properties of clear specimens and cubic samples under uniform compression, there was an approximate reduction of 30% in the modulus perpendicular to the grain. This can be attributed to distinct failure modes and their associated mechanisms observed in CLT panels. The reduction in strength perpendicular to the grain was, however, found to be less affected.
  • For a constant overall depth (105 mm) of CLT with varying numbers of layers (three vs. five layers), the modulus of elasticity perpendicular to the grain was found to be 21% higher for CLT with more layers. This effect on the compressive strength perpendicular to the grain was less significant.
  • With an increase in the overall depth of CLT (105 vs. 175 mm), the modulus of elasticity perpendicular to the grain was found to be reduced by 17%. The increased depth can lead to an increased likelihood of internal stresses and deformations within the panel due to variations in moisture content and drying gradients. These internal stresses can affect the overall stiffness and contribute to a reduction in the modulus of elasticity perpendicular to the grain.
  • For the CLT plate tests, the overall depth of the CLT significantly influences both the modulus of elasticity and strength under compression perpendicular to the grain. An increase of 47 to 68% in modulus of elasticity and an increase of 30 to 38% in strength were observed as the overall depth increased from 105 to 175 mm.
  • While determining the kc,90 factor analytically, both Van Der Put’s exact dispersion model and Brander’s simplified model yield similar results, irrespective of the depth of the CLT panel. However, there might be an accuracy limitation for these approaches with increasing CLT thickness due to the larger variation of stress distribution with the larger wood volume being loaded.

Author Contributions

Conceptualization, R.A.B.M., M.E.B., M.S. and I.B.M.; methodology, R.A.B.M., A.P.A., R.d.A.D. and I.B.M.; software, R.A.B.M., M.E.B., M.S. and I.B.M.; validation, R.A.B.M., J.M.D. and I.B.M.; formal analysis, R.A.B.M. and A.P.A.; investigation, R.A.B.M. and R.d.A.D.; resources, J.M.D. and I.B.M.; data curation, R.A.B.M.; writing—original draft preparation, R.A.B.M. and R.d.A.D.; writing—review and editing, I.B.M., J.M.D., A.P.A., M.S., R.d.A.D., H.E.I. and M.K.; visualization, I.B.M.; supervision, I.B.M., A.P.A. and R.d.A.D.; project administration, I.B.M.; funding acquisition, R.d.A.D., I.B.M., M.K. and H.E.I. All authors have read and agreed to the published version of the manuscript.

Funding

This work was also supported by the Coordenação de Aperfeiçoamento de Pessoal de Nível Superior—Brasil (CAPES)—Finance Code 001.

Data Availability Statement

The data presented in this study are available on request from the corresponding author.

Acknowledgments

The authors are grateful to Jowat do Brasil Ltda. for donating the structural adhesive, to the Federal University of Pelotas for providing all the facilities for the experimental work, and to Lucas Hlenka for his contribution with the testing machine scripts. G. Schickhofer is also gratefully acknowledged for sharing TU Graz’s theses for this study.

Conflicts of Interest

The authors declare no conflict of interest.

References

  1. Ascione, F.; Esposito, F.; Iovane, G.; Faiella, D.; Faggiano, B.; Mele, E. Sustainable and Efficient Structural Systems for Tall Buildings: Exploring Timber and Steel–Timber Hybrids through a Case Study. Buildings 2024, 14, 524. [Google Scholar] [CrossRef]
  2. Aleksandr, C.; Tatiana, B.; Viktor, T.; Anton, K. On the possibility of using timber structures in the construction of high-rise buildings in seismic areas. Archit. Eng. 2023, 8, 60–70. [Google Scholar]
  3. Ilgın, H.E. Tallest Timber Buildings: Main Architectural and Structural Design Considerations; IntechOpen: London, UK, 2016; Volume i, p. 13. [Google Scholar]
  4. Salvadori, V. Multi-Storey Timber-Based Buildings: An International Survey of Case-Studies with Five or More Storeys over the Last Twenty Years; Technische Universität Wien: Vienna, Austria, 2021; pp. 1–527. [Google Scholar]
  5. Brandner, R. Cross Laminated Timber (CLT) in Compression Perpendicular to Plane: Testing, Properties, Design and Recommendations for Harmonizing Design Provisions for Structural Timber Products. Eng. Struct. 2018, 171, 944–960. [Google Scholar] [CrossRef]
  6. EN 1995-1:2004; Eurocode 5: General—Common Rules and Rules for Buildings. CEN: Brussels, Belgium, 2004; Volume 1.
  7. Halili, Y. Versuchstechnische Ermittlung von Querdruckkenngrössen für Brettsperrholz (BSP). Master’s Thesis, Technische Universität Graz, Styria, Austria, 2008. [Google Scholar]
  8. Serrano, E.; Enquist, B. Compression Strength Perpendicular to Grain in Cross-Laminated Timber (CLT). In Proceedings of the 11th World Conference on Timber Engineering 2010, WCTE 2010, Trentino, Italy, 20–24 June 2010; Volume 1, pp. 441–448. [Google Scholar]
  9. Salzmann, C. Ermittlung von Querdruckkenngrößen Für Brettsperrholz (BSP). Master’s Thesis, Technische Universität Graz, Styria, Austria, 2010. Available online: https://diglib.tugraz.at/download.php?id=576a73e2a4585&location=browse (accessed on 22 February 2024).
  10. Bogensperger, T.; Augustin, M.; Schickhofer, G. Properties of CLT-Panels Exposed to Compression Perpendicular to Their Plane. In Proceedings of the 44th International Council for Research and Innovation in Building and Construction, Working Commission W18—Timber Structures, Alghero, Italy, 28 August–1 September 2011; pp. 1–15. [Google Scholar]
  11. Ciampitti, A. Untersuchung Ausgewählter Einflussparameter Auf Die Querdruckkenngrößen von Brettsperrholz. Master’s Thesis, Technische Universität Graz, Styria, Austria, 2013. Available online: https://diglib.tugraz.at/download.php?id=576a76a59e99b&location=browse (accessed on 22 February 2024).
  12. Jowat Liquid One-Component Polyurethane Adhesive for Load-Bearing Structural Wood Bonding. Available online: https://www.jowat.com/technical-data-sheets/686.30/TD68630_Englisch.PDF (accessed on 10 February 2020).
  13. EN 408:2004; Structural Timber and Glued Laminated Timber. Determination of Some Physical and Mechanical Properties. CEN: Brussels, Belgium, 2004; Volume 35. [CrossRef]
  14. ISO 13910:2014; Timber Structures—Strength Graded Timber—Test Methods for Structural Properties. ISO: Geneva, Switzerland, 2014.
  15. Franke, S.; Quenneville, P. Compression Behavior and Material Parameters of Radiata Pine at Different Orientations to the Grain. J. Mater. Civ. Eng. 2013, 25, 1514–1523. [Google Scholar] [CrossRef]
  16. Mendes, R.A.B. Structural Behaviour of Cross-Laminated Timber Panels Subjected to Out-of-Plane Loading: An Experimental and Numerical Approach; Universidade Federal do Rio Grande do Sul, Rio Grande, Brazil, 2020. Available online: https://lume.ufrgs.br/bitstream/handle/10183/221467/001125947.pdf?sequence=1&isAllowed=y (accessed on 22 February 2024).
  17. Bao, F.C.; Jiang, Z.H.; Jiang, X.M.; Lu, X.X.; Luo, X.Q.; Zhang, S.Y. Differences in Wood Properties between Juvenile Wood and Mature Wood in 10 Species Grown in China. Wood Sci. Technol. 2001, 35, 363–375. [Google Scholar] [CrossRef]
  18. Kretschmann. Wood as an Engineering Material. 2010. Available online: https://www.fpl.fs.usda.gov/documnts/fplgtr/fpl_gtr190.pdf (accessed on 22 February 2024).
  19. NBR 7190 Projeto de Estruturas de Madeira. 1997. Available online: https://aetec.org.br/nbr-7190-projeto-de-estruturas-de-madeira/ (accessed on 22 February 2024).
  20. Pearson, K. Tables for Statisticians and Biometricians. Nature 1932, 130, 931. [Google Scholar] [CrossRef]
  21. EN 16351; Timber Structures—Cross Laminated Timber. CEN: Brussels, Belgium, 2021.
  22. EN 1995-2; Eurocode 5: Design of Timber Structures—Part 2: Bridges. CEN: Brussels, Belgium, 2004; Volume 1, p. 123.
Figure 1. Clear wood compressive specimens cut parallel (a) and perpendicular to the grain (b) and their test setups.
Buildings 14 00607 g001
Figure 2. Compression load-displacement curves of small-scale clear wood specimens. (a) Batch 1 (juvenile) wood: parallel to the grain; (b) Batch 2 (mature) wood: parallel to the grain; (c) Batch 1 wood: perpendicular to the grain; (d) Batch 2 wood: perpendicular to the grain.
Buildings 14 00607 g002aBuildings 14 00607 g002b
Figure 3. Top view and cross-section illustrations of the CLT panels manufactured.
Buildings 14 00607 g003
Figure 4. Manufacturing process of CLT panels: (a) planning, (b) gluing, (c) pressing, and (d) finished Series A panel.
Buildings 14 00607 g004
Figure 5. Proposed stress dispersion model of Brandner [5] for the compression perpendicular to the plane load configuration (reprinted with permission from Ref. [5]. Copyright 2018 Elsevier.).
Buildings 14 00607 g005
Figure 6. Setups of cubic and plate CLT specimens used for compression perpendicular to the plane tests: (a,c) a total of 9 cubic specimens with a dimension of 160 (width) × 160 (length) mm were cut from one panel per series to conduct pure compression perpendicular to the grain proper-ties; (b,d) out of 6 panels, 5 were used for applying a concentrated load simulating a slab clamped between a wall and a column.
Buildings 14 00607 g006
Figure 7. Load-displacement curves of cubic CLT specimens acquired by compression perpendicular to the plane. (a) Series A cubic specimens; (b) Series B cubic specimens; (c) Series C cubic specimens.
Buildings 14 00607 g007
Figure 8. Compression perpendicular to the plane load-displacement curves of the bearing CLT plate specimens. (a) Series A plate specimens; (b) Series B plate specimens; (c) Series C plate specimens.
Buildings 14 00607 g008
Figure 9. Failure modes of CLT plates: (a) crushing of loaded area; (b) tension perpendicular to the grain of the P4-sC specimen.
Buildings 14 00607 g009
Figure 10. Stress dispersion models applied to a Series C bearing plate specimen (reprinted with permission from Ref. [5]. Copyright 2018 Elsevier).
Buildings 14 00607 g010
Figure 11. Elastic modulus (a) and strength (b) related to compression perpendicular to the grain properties related to three types of testing regimes.
Buildings 14 00607 g011
Table 1. Compressive properties of lumber used for manufacturing the CLT panels.
BatchStatisticsρ
(kg/m3)
Ec,0
(MPa)
fc,0
(MPa)
Ec,90
(MPa)
fc,90
(MPa)
fc,y
(MPa)
T
(MPa)
1max.511535827.365806.245.8038.06
Average495426825.464274.804.5218.94
min.482357722.103283.933.715.39
SD9.94575.81.6366.540.700.629.73
CV (%)2.0113.496.4015.5714.6013.7341.04
G1-0.808−0.5610.3480.510-0.149
2max.50120,02049.526543.924.0522.58
Average46713,07040.444283.273.149.49
min.452800532.112422.832.682.47
SD13.7527715.06128.840.260.326.46
CV (%)2.9521.2112.5230.127.9910.2368.02
G1-0.4700.0270.0250.570-0.859
SD: standard deviation; CV: coefficient of variation; G1: Pearson’s skewness coefficient; ρ: apparent density; Ec,0: Longitudinal modulus of elasticity; fc,0: Longitudinal compressive strength; Ec,90: Transverse modulus of elasticity; fc,90: Transverse compressive strength; fc,y: Yield stress in compression perpendicular to the grain; T: tangent-modulus (slope of the curve after yielding).
Table 2. Experimental program related to compression perpendicular to the grain.
SeriesType of TestNo. of LayersThickness of Each Layer (mm)Total Thickness of CLT (mm)Width (mm) × Length (mm) of CLT SpecimensNo. of Samples
Series ACLT plate compressed under the wall below the column load configuration521105600 × 6005
Series B335105600 × 6005
Series C535175600 × 6005
Series ACLT prism under pure compression perpendicular to the plane521105160 × 1606
Series B335105160 × 1606
Series C535175160 × 1606
Table 3. Experimental modulus of elasticity and strength of cubic CLT specimens evaluated by compression perpendicular to the plane.
SeriesEc,90,CLT,p (MPa)SD
(MPa)
CV
(%)
min.AverageMedianmax.
A308.3328.9329.0357.018.085.50
B239.6272.2274.0302.722.878.41
C259.2281.1277.5308.718.406.55
Seriesfc,90,CLT,p (MPa)SD
(MPa)
CV
(%)
min.AverageMedianmax.
A4.084.454.394.940.316.93
B4.514.724.685.100.204.25
C3.954.164.104.490.225.34
SD: standard deviation; CV: coefficient of variation.
Table 4. Experimental compression perpendicular to the plane modulus of elasticity and strength of plate CLT specimens.
SeriesEc,90,CLT,Lc (MPa)SD
(MPa)
CV
(%)
min.AverageMedianmax.
A265.0343.2352.0411.053.3115.90
B192.0301.0331.0340.062.1320.64
C375.0507.0542.0569.077.1215.21
Seriesfc,90,CLT,Lc (MPa)SD
(MPa)
CV
(%)
min.AverageMedianmax.
A6.026.876.407.910.8312.16
B5.726.465.967.940.9414.59
C6.328.929.2810.631.6518.44
SD: standard deviation; CV: coefficient of variation.
Table 5. Experimental and analytical kc,90 factors for plates tested on bearing load configuration.
SeriesAc
(mm2)
Ac,ef
(mm2)
kc,90,VPkc,90,skc,90
Ac,ef,VPAc,ef,s k c , 90 , V P = A c , e f , V P A c k c , 90 , s = A c , e f , s A c k c , 90 = f c , 90 , L C f c , 90 , P
A25.60063.16263.0011.571.571.54
B25.60058.56963.0011.511.571.37
C25.60089.44190.0001.871.882.15
Disclaimer/Publisher’s Note: The statements, opinions and data contained in all publications are solely those of the individual author(s) and contributor(s) and not of MDPI and/or the editor(s). MDPI and/or the editor(s) disclaim responsibility for any injury to people or property resulting from any ideas, methods, instructions or products referred to in the content.

