
Understanding Urban Residents’ Walking Exercise Preferences: An Empirical Study Using Street View Images and Trajectory Data

1
School of Architecture and Art, Central South University, Changsha 410083, China
2
School of Geosciences and Info-Physics, Central South University, Changsha 410083, China
*
Author to whom correspondence should be addressed.
Buildings 2024, 14(2), 549; https://doi.org/10.3390/buildings14020549
Submission received: 23 January 2024
/
Revised: 12 February 2024
/
Accepted: 17 February 2024
/
Published: 19 February 2024
(This article belongs to the Special Issue Toward Equitable, Low-Carbon, and Liveable Cities: Quantitation, Effects Analysis, and Optimization of the Indoor and Outdoor Built Environment)
Abstract
:Walking exercise is a prevalent physical activity in urban areas, with streetscapes playing a significant role in shaping preferences. Understanding this influence is essential for creating urban environments conducive to walking exercise and improving residents’ quality of life. In this study, we utilize scenic beauty estimation and deep learning methods, leveraging street view images and walking exercise trajectories to analyze this influence from a human-centric perspective. We begin by generating sampling points along streets covered by trajectories and acquiring street view images. Subsequently, we apply a deep learning model to segment the images, yielding six visual indicators. Additionally, we use scenic beauty estimation to derive the seventh visual indicator. Finally, we match these indicators with trajectory data to implement preference analysis. The main findings are: (1) preferences for walking and running exercises differ on multiple indicators; (2) there are gender distinctions, with males preferring openness and females prioritizing enclosed spaces; (3) age plays a role, with those aged 30–40 preferring openness and those aged 40–50 preferring enclosed spaces; (4) preferences for different indicators vary over time and across different locations. These insights can inform policymakers in tailoring urban planning and design to specific population segments and promoting sustainable residential landscapes.
1. Introduction
Walking activity is considered one of the most common physical activities among adults [1,2]. As walking does not require special skills, equipment, or aid facilities, and allows exercisers to make their own choices in regulating the intensity of exercise, it is preferred by individuals of all age groups [3,4]. Therefore, it has become the focus of attention in many fields, such as urban planning, transportation, and public health [5,6,7]. Walking activities typically occur on streets, as they are the most accessible and widely used spaces by the public [8,9]. According to studies, nearly 70% of adults’ recreational activities take place on sidewalks and streets [10], with walking emerging as the most common physical activity performed on streets across various environmental conditions [11,12,13]. Given its prevalence, understanding how streetscapes influence walking exercise preferences is crucial for creating more walking exercise-friendly urban environments, which in turn can promote physical activity, reduce sedentary behavior, and improve overall public health. Furthermore, designing streetscapes that encourage walking exercise contributes to developing sustainable urban landscapes and enhancing the quality of life for residents.
The street environment is a direct factor that influences walking activity preferences [14,15,16,17]. It has an impact on crowd route selection, crowd flow [18,19,20], pedestrian volume, walking experience [21,22], frequency of travel, and social interactions [23,24]; it also has facilitating or hindering effects on other aspects [25,26,27]. However, the influence factors used in traditional studies are derived from questionnaires and remote sensing image data, mostly macroscopic indicators and environmental factors projected from an overhead view. These factors cannot fully capture the impact of the built environment on walking experiences and preferences from a human visual perspective. For example, traditional greenery indicators, such as park area and normalized difference vegetation index (NDVI), calculate the amount of greenery from an overhead view. This perspective is different from the greenery experienced by pedestrians on the street and does not reflect the actual exposure to greenery [28]. Compared to remote sensing image data, such as aerial and satellite images, street view images can examine visual features from a human perspective, quantitatively measure the façade effects of scenes, and better describe the horizontal environmental perception of residents [29,30]. In contrast to traditional means of data acquisition such as questionnaires and field visits, which rely on small-scale, manual analysis and are limited to a single research domain [31], street view images cover areas inhabited by more than half of the world’s population, providing a large-scale source for cross-regional and multi-domain studies [32,33]. Therefore, many scholars have attempted to study the impact of the street environment on residents’ activities by using streetscape indicators characterized by perceptual and visual complexities as environmental factors, e.g., walkability, enclosure, openness, etc. However, existing research studies on streetscapes and pedestrian activity focus more on assessing walkability and less on the variability of walking preferences among different groups of residents. Differences in people’s daily walking activity preferences reflect the spatial characteristics of urban streets. These preferences are influenced by pedestrians’ environmental perceptions, psychological emotions, and lifestyles [34,35]. Studies related to pedestrian walking preferences through street view data are necessary.
To address the above issues, we use a combination of street view image data and motion track data generated by cell phone apps to explore the influence of streetscape elements on the walking exercise preferences of different populations. We hypothesize the following: (1) there is a significant difference in the impact of the streetscape on the walking exercise preferences of different people. (2) There is significant variability in the impact of the streetscape on different types of walking exercises. (3) Streetscape-based indicators can effectively predict population preferences. To test our hypothesis, we first use the ADE20K dataset published by MIT [36], which can be used for scene perception, parsing, segmentation, target detection, and semantic segmentation applications, to pretrain a DeepLabv3 model [37] on the segmentation task; afterward, we apply semantic segmentation on street view images. Then, streetscape indicators are extracted from the street view segmentation results. We conduct analyses of streetscape preferences, regression, and spatial heterogeneity across different walking types, genders, and age groups. Finally, we use streetscape indicators to inversely predict walking preferences, aiming to assess the extent to which these indicators can unveil patterns in walking preferences. By investigating how streetscapes influence walking exercise preferences, this study seeks to provide valuable insights for urban planning and public health initiatives aimed at creating more walking exercise-friendly streets, maintaining urban vitality, and promoting healthy city construction.
2. Related Work
This section primarily comprises literature reviews in two research directions. One focuses on validating the influence of street environments on walking behavior, while the other investigates the impact of microscopic streetscapes on residents’ perceptions and physical activity.
Alton et al. [38] explored the relationship between children’s walking frequency and their perceptions of local environments and personal travel preferences, concluding that a higher frequency of walking is associated with a greater likelihood of perceiving the street environments as safe and familiar. Tilt [39] studied the effects of neighborhood vegetation levels and personal preferences on the walking behavior of adults with children in the household, identifying differences in behavioral choices regarding walking trip frequency and environment preferences across various levels of vegetation cover. Kajosaari et al. [40] investigated walking behaviors in the Helsinki urban agglomeration, Finland, and concluded that built environment factors influence individual attitudes toward walking for transport. Li et al. [41] used structural equation modeling to conduct a cross-sectional survey of residential behavior in cities such as New York and Baltimore, exploring the impact of the residential built environment on the relationship between neighborhood and transportation walking behavior. In addition, as uncertainty about a neighborhood’s natural environment increases, studies are showing that increased visual exploration during walking reflects the degree of environmental preference [42,43,44]. Franěk and Režnỳ [45] combined walkability research with investigations of environmental preferences and psychological responses to the natural environment to explore how people’s walking speed responds to the visual features of the walking environment. They concluded that people’s walking speed decreases on sections of the road with more natural features.
To better capture the influence of the built environment from a human visual perspective, many studies have begun to establish indicator systems from streetscapes. Ameli et al. [46] investigated factors contributing to the inviting and walkable nature of streets, including indicators like transparency, imageability, enclosure, human scale, and complexity. Their study revealed that imageability, alongside transparency, significantly enhances walkability. By assessing twenty streetscape features across 588 blocks in New York City, Ewing et al. [47] identified three significant factors that positively correlate with pedestrian traffic volumes. Park et al. [48] investigated how the built environment influences pedestrian activity across different scales. Their findings revealed significant positive correlations between three urban design qualities and pedestrian volumes at the street level. Additionally, they observed that pedestrian counts were positively linked to seven out of twenty streetscape features. Utilizing street view images of Wuhan, Dai et al. [49] employed the FCN-8s model to segment images; they examined the relationship between urban visual space and residents’ psychological perceptions regarding walkability, enclosure, openness, greenness, etc. Their findings indicate a robust association between urban visual space indicators and residents’ psychological perceptions. Specifically, factors such as greenness and enclosure significantly influence residents’ psychological perceptions.
3. Data
The data used in this study come from exercise data voluntarily recorded by users who use the cell phone app, Dorray Sports. Dorray Sports is an intelligent sports app that supports various smart hardware devices, synchronizes data from smart devices, generates chart reports, monitors body data, and records exercise achievements. Dorray Sports collects users’ exercise trajectories upon logging into the app and initiating sports activities, obtaining instant location data and related information during sports. The time range of the trajectory data used in the study covers 2016 to 2018, and the records cover the main urban area of Changsha City, China. The trajectory coverage is shown in Figure 1. It can be seen that the trajectories generated by users cover primary streets, secondary streets, and other levels of streets, which means that users have a variety of choices in their walking exercises and that the specific streets chosen are indicative of user preferences.
Apart from the trajectory data, each record contains basic information fields, such as exercise type, exercise time, and user information, as shown in Table 1. We selected two types of walking exercises from the datasets, walking and running, based on the sport type field. The users’ trajectory data are initially represented as GPS point data. The initial cleaning of the trajectory data was carried out to remove trajectories with obvious offset locations, abnormal attributes, and short exercise times and distances. Based on this, we obtained a total of 17,574 valid exercise trajectory data after cleaning, with a 73.2% percentage of trajectory data lying along streets. (1) The statistical analysis of user profiles reveals that trajectory data were generated by 2414 users, with the majority being female, accounting for 1807 individuals. On average, each user engaged in walking exercises more than seven times. The detailed breakdown of user age groups is as follows: 7.7% are aged 10–20, 34.8% are aged 20–30, 24.7% are aged 30–40, 20.3% are aged 40–50, 10.8% are aged 50–60, and 1.7% are aged 60 and above. (2) The statistical analysis of trajectory data shows that 11,675 trajectories were attributed to females, representing 66.4% of the total. The average distance covered during walking exercise is 3.6 km, with an average time of 46.2 min. In terms of age composition, 6898 trajectories lack age information, constituting 39.2% of the dataset; the majority of trajectories—6953—are generated by individuals aged 20 to 40, holding the largest proportion. Regarding exercise types, walking comprises a more significant proportion compared to running, accounting for 11,318 records, surpassing running by nearly a 2:1 ratio.
4. Methods
4.1. Workflow
This study includes five stages: street view image acquisition, street view image segmentation, streetscape visual indicator extraction, scenic beauty estimation, and preference analysis. The process is shown in Figure 2 and highlighted using dark-colored blocks: (1) Extracting the road network of the study area, generating sampling points along the streets, and then acquiring street view images based on the sampling points. (2) Using the deep learning model, DeepLabv3 [37], to segment each street view image and obtain the segmentation ratio of different objects in the street scene. (3) Using the ratios as input, the visual indicators of street scenes, such as greenness and openness, are calculated. (4) Using the scenic beauty estimation [50] to obtain the beauty indicator for each street view image. (5) After matching the sampling points with the trajectory data, we analyze the relationships between walking exercise preferences of different ages and genders on the streetscapes and explore differences in the spatiotemporal distribution of preferences.
4.1.1. Retrieving Street View Images
The street view images were taken by the vehicle’s camera, providing different directions and panoramic street features and comprehensively reflecting the human-scale streetscape environment. In this study, we initially set sampling points at 150 m intervals along the streets in Changsha. We then used the Baidu map API (https://lbsyun.baidu.com/, accessed on 1 August 2021) to obtain Baidu street view images based on the coordinates of these sampling points. As shown in Figure 3, each sampling point extracts street view images, with angles from the front, back, left, and right, and a horizontal range of 90° of the line of sight. The four angles can be combined to form a panoramic map of the sampling point.
4.1.2. Street View Image Segmentation
Street view images contain abundant information about built and natural environments. The extraction of this information can enable the calculation of human perception of the streetscape during walking exercises. It then allows us to analyze how the streetscape influences walking exercise preferences. Traditional extractions of streetscape visual indicators usually relied on manually selected features or the color of the image (e.g., extracting blue pixels and green pixels to extract openness and greenness, respectively), which is challenging to adapt to the complex scene of urban streets. To perform efficient, accurate, and automated indicator extraction, this study classifies each pixel in an image using the image semantic segmentation method, which is based on deep learning techniques. The process of semantic segmentation involves categorizing sections of images that pertain to the same object class [51]. The goal is to designate a label for each pixel in an image, corresponding to a specific class. After segmentation, we can obtain the distribution and percentage of elements in the visual perception space. Thanks to deep learning and open datasets, many pre-trained models based on street view images can be transferred to this research scenario. Here, we use the ADE20K dataset, which contains 150 semantic categories, including the sky, trees, buildings, roads, etc., sufficiently meeting the needs for street view semantic segmentation and the extraction of streetscape indicators. Meanwhile, this study uses the DeepLabv3 framework [37] developed from DeepLabv1-2; it is mainly used in areas such as image segmentation. One challenge in segmenting objects in images using deep convolutional neural networks is that input feature maps decrease in size as they pass through the convolutional and pooling layers of the entire network. This can lead to the loss of information about smaller-scale objects, resulting in low-resolution predictions and fuzzy object boundaries. DeepLabv3 tackles this challenge by employing atrous convolutions and atrous spatial pyramid pooling (ASPP) modules, which have improved the mIOU from 34.0 to 44.1 on the ADE20K dataset compared to its predecessor, DeepLabv2. Due to its superior performance and satisfactory results, DeepLabV3 has been widely used for street view image segmentation [52,53,54,55,56]. We implemented this model using the Gluon package [57]. This model achieved an 81.1% pixel classification accuracy after completing pre-training on the ADE20K dataset. As shown in the lower right part of Figure 2, the DeepLabv3 model pre-trained on the ADE20K dataset can segment the crawled street view images and obtain category information of each pixel in the street view images (where different colors represent different category elements).
4.2. Scenic Beauty Estimation
Scenic beauty estimation (SBE) is a method that was developed to assess the visual quality of a landscape [50,58], effectively and reliably measuring public aesthetic preferences [59]. The present study quantitatively characterized people’s visual perceptual preferences for different streetscapes by applying the SBE method. Street view images were standardized and pre-processed to mitigate the effects of changes in environmental factors such as light intensity and air quality before the scenic beauty evaluation.
The scenic beauty evaluation can be divided into expert scoring and public scoring; the former assesses the visual quality of the landscape from a professional perspective, and the latter is suitable for analyzing the visual quality preferences of people with different attributes. This study adopts expert scoring. The evaluation process involves ten graduate students specializing in environmental design and urban planning, all passionate about walking exercise. The proportion of males to females is consistent with the proportion in the collected sample trajectories. The assessment was conducted using a 10-point scale, where participants were assigned scores based on various criteria related to visual landscape quality. The scale ranged from 0, indicating significantly inferior streetscape quality in need of improvement, to 10, denoting excellent streetscape quality. The evaluation process is divided into two main steps.
(1) Initially, 100 street view images were randomly selected for all participants to score. We summarized the scoring results and calculated the average beauty value of each image. This average value was used to establish the scoring criteria for different streetscape visual qualities. Participants whose scores significantly differed from the average value received training to adjust their scoring criteria. Subsequently, another round of scoring was conducted on a new set of 100 randomly selected street view images from the sample library. The same steps were repeated until the score variance was within an acceptable range of the average value, ensuring a high degree of consistency in the participants’ scoring criteria.
(2) Once the scoring criteria were standardized, all sample street view images were equally divided into ten random groups. Each participant would then score one group, and subsequently, all the scores were aggregated. Each aggregated score was taken as the beauty rating value of the street view image.
4.3. Streetscape Visual Indicators
The built environment, as well as the natural environment of the street, can influence people’s perceptions and their walking preferences. In this study, six indicators are used to analyze walking preference based on the street view segmentation results. The indicators are calculated according to [49], and the details are shown in Table 2.
(1) Greenness: Defined as the percentage of the green area observed by the human eye, it is an important measure of urban ecosystems. A green urban environment can positively affect people’s emotional and psychological well-being.
(2) Openness: Openness represents the visibility of the sky, and it determines the brightness of the environment and greatly impacts human vision. Improving openness can help increase the attractiveness of the streetscape [60].
(3) Enclosure: Enclosure is the degree to which buildings and walls enclose a street and is related to people’s perception of spatial limitations. Outdoor buildings and trees are the most visually dominant objects; together, they form the basic structure of the street space, physically separating the external and internal spaces in the street environment [60]. The street enclosure impacts the mood of pedestrians, and an enclosed streetscape gives the impression of a higher level of security, which promotes physical activity and enhances the social connection between pedestrians [61].
(4) Water visibility (blueness): The water visibility of cities is determined by the coverage of water bodies. Therefore, it is defined as the proportion of rivers, lakes, and oceans in the street view image. Blueness is significantly correlated with residents’ mental health, and exposure to a space with high blueness reduces psychological stress and effectively improves depression among people [62].
(5) Walkability: The walkability of a street is designed to describe how friendly the street space is for people to travel on foot. Walkability is defined as the ratio of the sidewalk to the entire roadway. Good walkability can increase community livability and improve public health.
(6) Facility ratio (facility): Reflects the abundance of facilities on the street, defined as the proportion of streetlights and benches on the street.
5. Results
5.1. Statistics of Streetscape Indicators
This section provides a fundamental statistical analysis of streetscape indicators to gain insight into users’ overall preferences for streetscapes during walking exercises.
The histograms depicted in Figure 4 illustrate that the average greenness rate along walking exercise routes stands at 22.56%, and the openness rate is 27.8%. Both indicators exhibit a distribution largely symmetrical around their respective mean values. The mean value for the enclosure is 38.5%, with the average proportion of buildings along the routes being less than 15.94%. According to the definition of the enclosure, these rates suggest that individuals tend to favor views comprising greater greenness and openness rather than an abundance of buildings during their walking exercises.
Regarding blueness, the mean value is only 0.6%. This may be due to the concentrated distribution of water bodies in Changsha, resulting in trajectories generated primarily in non-water body-surrounded areas. Therefore, the blueness distribution may not effectively reflect residents’ overall preference for water visibility during exercise. Similarly, facilities like streetlights, among other features, constitute a relatively small percentage of pixels in street view images. Consequently, their low mean value may not represent users’ overall preference.
The average walkability value is 1.67, indicating that sidewalks in the streetscape images along walking trajectories constitute, on average, 1.67 times the proportion of roads (with the maximum value exceeding 100, denoting scenarios with only sidewalks and no roads). Lastly, the mean scenic beauty score (beauty) along the matched walking trajectories stands at 5.4, suggesting an average level of aesthetic appeal.
5.2. Preference Analysis
This section delves into the temporal evolution of streetscape indicator preferences during walking exercises throughout the day and examines disparities in streetscape indicator preferences across distinct exercise types, genders, and age groups.
5.2.1. Temporal Pattern of Streetscape Indicator Preferences
In order to investigate the variations in streetscape preferences during walking exercises at different times of the day, we initially divided the trajectories into distinct 24 h segments based on their generation timestamps. Subsequently, we computed the average values for each streetscape indicator within these temporal segments and depicted their fluctuations over time, as seen in Figure 5. It can be seen that the preference for openness and enclosure varies significantly throughout the day, with a clear peak in the enclosure and a valley in openness at noon. The decreased preference for openness during this period might align with a desire for sun protection and avoidance of intense sunlight, leading to an increased inclination toward shaded routes characterized by higher enclosures. Notably, there is an observed increment in enclosure during nighttime. Conversely, preferences for beauty, greenness, and openness tend to decline during nocturnal hours. This trend might be that individuals walk around residential areas at night due to safety concerns, reducing the inclination for street beauty, greenness, and openness.
5.2.2. Streetscape Indicator Preferences of Different Exercise Types, Gender Groups, and Age Groups
The trajectory dataset utilized for this study incorporates details regarding the walking exercise type, as well as demographic information such as the gender and age of the trajectory generator. This section aims to discern and analyze the preferences associated with streetscape indicators among varying walking exercise types and different user groups.
Seven dimensions of preference differences are considered in this study, and the resulting radar plots are shown in Figure 6.
In Figure 6a, the trajectories are classified according to the exercise type, and it can be seen that when running, users prefer places with higher openness, greenness, more facilities, and better views. In contrast, during walking, users prefer a sense of enclosure. This difference in preference might be attributed to the spatial extent inherent in different exercise types. Typically, walking covers shorter distances, concentrated within the immediate neighborhood. Moreover, it is noticeable that running exercises exhibit a greater inclination toward walkability compared to walking, likely stemming from the higher demand for wider sidewalks necessary for running activities.
Figure 6b presents the outcomes concerning gender groups. It can be seen that males exhibit a stronger preference for openness and greenness than females. Conversely, females are more inclined toward enclosure, beauty, and facilities, indicating a higher concern for safety and convenience during walk exercises without compromising environmental aesthetics.
Figure 6c shows the results across various age groups. It reveals that individuals aged 30–40 have a greater preference for openness and beauty, with a pronounced emphasis on facilities and a minor focus on greenness. Those aged 20–30 show the least emphasis on beauty and facilities. Individuals aged 40–50 demonstrate high preferences for enclosure and greenness. The variance in streetscape indicators among age groups can be summarized as follows: the 20–30 age group displays no marked preference for streetscape indicators or facilities, likely due to their better physical fitness; the 30–40 age group demonstrates a preference for open, visually pleasing streets; and the 40–50 age group prefers greenness and enclosure, possibly favoring walking exercises within residential neighborhoods with reduced demand for street facilities, owing to their smaller exercise spatial extent.
5.3. Regression Based on Streetscape Indicators
In this section, a logistic regression analysis was performed to investigate the influence of streetscape indicators on walking exercises and their effect across gender groups. The walkability indicator was excluded from the regression analysis due to its centralized distribution. Additionally, the blueness indicator was removed from the analysis due to the scarcity of water bodies in the study area, resulting in limited street-side areas with water frontage.
The logistic regression model was applied using the scikit-learn Python package [63]. Sixty percent of the trajectories were randomly allocated as training data, while the remaining trajectories were used for testing. For each trajectory, its streetscape indicators are averaged based on the street view sampling points covered by the trajectory. Leveraging these averaged indicator values as input, we conducted logistic regression to predict the gender of the individuals who generated these trajectories. Table 3 and Figure 7 illustrate the outcomes of the logistic regression.
The precision and recall of gender prediction are both 0.79, with a higher precision in predicting females than males. Gender groups present different preferences in greenness, enclosure, openness, and beauty in Figure 7. Notably, the model identified beauty as the most significant contributor, implying that gender differences in walking exercise preferences primarily revolve around the overall aesthetic quality of the streetscape. The contributions of different indicators in predicting gender are ranked as beauty > openness > greenness > enclosure > facility. However, the model’s limited predictive power suggests that various factors beyond the selected streetscape indicators influence the exercise preferences of residents regarding gender. Factors like street traffic flow and the distribution of points of interest (POIs) near the street could also play crucial roles.
5.4. Spatial Heterogeneity of Streetscape Indicator Preference
To examine the variations in the spatial correlations between streetscape indicators and walking preferences, this study visualizes correlations between trajectories and different indicators across genders. These visualizations aim to illustrate the distribution of trajectories and indicator correlations for each gender, highlighting potential discrepancies between them.
5.4.1. Facility Preference
As shown in Figure 8, we find that the trajectory preferences generated by male and female users correlate with the availability of facilities. They both prefer to exercise in areas with more facilities, showing a high correlation concentrated in the center of urban areas.
Specifically, female- and male-generated trajectories correlate highly with the number of facilities in the central south. However, the distribution of male-generated trajectories is highly correlated with facilities that are more concentrated in a specific area of that part, while females have a distribution that is highly correlated across the whole district. It has also been observed that both male- and female-generated trajectories have consistent correlations with facilities in the central part.
5.4.2. Enclosure Preference
When comparing the male and female correlation heat maps in Figure 9, according to the trajectory distribution and the enclosure of the distribution area, we can see that females and males show a large spatial difference regarding enclosure preference; the high correlation area for females is concentrated in the southeast, while males are biased toward the central area. Observing the number of dark areas (i.e., comparing the size of the correlation coefficient), it can be concluded that females have a stronger preference than males.
5.4.3. Greenness Preference
As shown in Figure 10, when it comes to the greenness indicator, the correlation between the area of distribution for both female- and male-generated trajectories and the greenness of the central area is generally high, and male-generated trajectories have more coverage, with a high correlation to the greenness rate indicator.
5.4.4. Openness Preference
Figure 11 shows that trajectories generated by all genders are positively correlated with openness in the central region. However, there is a distinction: female-generated trajectories are notably more correlated with openness in the central southern sector. Conversely, in the eastern and western zones, male-generated trajectories are influenced by openness to a greater extent compared to female-generated ones.
5.4.5. Beauty Preference
Similar to previous observations, in Figure 12, both females and males exhibit a pronounced preference for scenic beauty in the central area, maintaining a consistently high correlation in this region. However, a notable disparity emerges: female-generated trajectories extend this high correlation toward the southern part, while male-generated trajectories extend the correlation toward the northeast.
The comparisons underscore a notable correlation between streetscape indicators and the selection of routes for walking exercises among females and males. However, negative correlations distributed across certain areas within the study region might be attributed to the absence of exercise trajectory data in those particular regions. Consequently, despite potentially favorable streetscape indicator scores in these areas, the lack of exercise trajectory data from residents could result in these areas displaying negative correlations.
6. Discussion
The results indicate that (1) individuals prefer locations with more facilities, higher openness, greenness, and better views during running activities. Conversely, there is a preference for a sense of enclosure during walking exercises. (2) Male residents are more inclined toward openness than their female counterparts. In contrast, female residents prefer a higher degree of enclosure, suggesting that males prioritize open views during exercise while females prioritize security. The accuracy of gender regression utilizing existing indicators stands at approximately 80%, implying that the indicators proposed in this study do not comprehensively define both genders’ preferences for the streetscape, suggesting the presence of additional influencing factors. (3) Individuals aged 30–40 tend to seek more openness and demonstrate the highest demand for facilities. Those aged 20–30 exhibit no conspicuous preference and display the lowest demand for aesthetics and facilities. Meanwhile, individuals aged 40–50 prefer streets with higher enclosures and greenness. Older individuals typically have a greater need for facilities due to factors like their physical capabilities. However, this study shows disparate results, possibly because those individuals tend to engage in walking exercises closer to their residences, and the limited exercise area encompasses limited facilities. (4) Temporally, preferences for various indicators shift at different times, notably the enclosure and openness indicators. Spatially, preferences for indicators exhibit significant spatial heterogeneity, with gender-based disparities evident within the same area.
Promoting walking exercise is crucial for public health, as it contributes to physical activity and reduces the risk of chronic diseases. Based on the findings of this study, it is possible to comprehend how streetscape indicators influence walking exercises. Policymakers can use the insights from our study to create more walking exercise-friendly streetscapes by incorporating features such as green spaces, facilities, and open views. Moreover, our study highlights the preferences of different demographic groups regarding walking exercise, allowing policymakers to tailor public health interventions to specific population segments. By doing so, policymakers can create healthier, more livable, and sustainable urban environments that promote physical activity and well-being for all residents.
Although our study yields valuable insights, we must acknowledge its limitations. Our analysis assumes that individuals’ walking exercise preferences are influenced by streetscape characteristics, neglecting other factors such as weather or POI distributions. Owing to the reliance on a single data source in this study, the following limitations also emerge: (1) The data source, a cell phone APP, necessitates that users provide personal information and log in before Dorray can record their trajectories. As the APP predominantly attracts young and middle-aged individuals, it does not represent all age groups equally. Consequently, the research outcomes may be disproportionately influenced by the exercise preferences of the younger and middle-aged demographics. (2) The skewed gender distribution of our data, with a higher proportion of trajectories generated by female users, makes the research results susceptible to the influence of female users. (3) The data we collected predated the COVID-19 pandemic. The pandemic may have significantly altered people’s exercise habits and routines, leading to shifts in preferences for outdoor activities and urban environments. For example, individuals may now prefer more open environments and wider walkways to avoid excessive contact with crowds.
7. Conclusions
Walking exercise is the most common physical activity performed on streets across a range of environmental conditions. The differences in pedestrians’ walking exercise preferences reflect not only the spatial characteristics of urban streets but also the environmental perceptions, psychological emotions, and lifestyles of pedestrians. Street view images have captured views from more than half of the world’s populated regions, offering substantial urban data sources for research. Additionally, street view images can be used to analyze the visual characteristics of streets from a human-centered perspective. They help describe pedestrians’ horizontal environmental perceptions during walking exercises. Therefore, we first obtained street view images of the study area based on the walking exercise trajectories recorded by the cell phone app Dorray. Then, we applied a pre-trained image semantic segmentation model to extract the elemental composition of each street view image. These elements, combined with scenic beauty scoring, helped calculate streetscape indicators across seven dimensions: openness, greenness, enclosure, facilities, blueness, walkability, and beauty. Our analysis demonstrates discernible preferences regarding several streetscape characteristics, such as facilities, beauty, openness, greenness, and enclosure, when engaging in different exercise activities. Gender disparities are notable, particularly concerning preferences for beauty and openness. Moreover, individuals across different age groups also exhibit variations in preferences, with individuals aged 20–30 displaying minimal preference and exhibiting the lowest demand for aesthetic features and facilities. Additionally, our study finds fluctuating preferences across different time frames and pronounced spatial heterogeneity in preference distributions.
Our study serves as an initial exploration, establishing a framework for analyzing walking exercise preferences through deep learning techniques using street view and trajectory data. The framework can be applied to aid in designing urban streets tailored to promote walking exercises, adjusting street layouts in line with the residential demographics of a community, sustaining urban vibrancy, and fostering the development of healthier cities. However, our findings have limitations under current data, and more comprehensive and balanced data are needed. Given the diversity of streetscapes, it is essential to note that the findings from our case study may not universally apply to all regions. Preferences may vary based on local nuances, so region-specific indicators may need to be extracted from streetscapes in different areas. Future research could establish a more comprehensive indicator system, encompassing more streetscape indicators and other factors, such as weather conditions, the distribution of points of interest (POIs), and more. This would enable a more comprehensive cross-city comparative study to deepen our understanding of walking exercise preferences. Additionally, given that our data predate the COVID-19 pandemic, preferences may have shifted in light of the outbreak, e.g., concerning preferences for openness and walkability. Therefore, incorporating data collected post-COVID-19 is crucial for adapting urban planning and design to meet the evolving needs of residents.
Author Contributions
Conceptualization, B.L. and J.Z.; methodology, J.Z. and H.O.; writing—original draft preparation, J.Z. and B.L.; visualization, H.O., Y.W. and Z.B.; supervision, B.L. All authors have read and agreed to the published version of the manuscript.
Funding
This research was funded by the National Natural Science Foundation of China; grant number 42301537.
Data Availability Statement
The data that support the findings of this study are available from the Dorray Sports app. Restrictions apply to the availability of these data, which were used under license for this study.
Acknowledgments
We thank the graduate students who participated in the scenic beauty estimation; they greatly assisted the research.
Conflicts of Interest
The authors declare no conflicts of interest.
References
- Vich, G.; Marquet, O.; Miralles-Guasch, C. Green streetscape and walking: Exploring active mobility patterns in dense and compact cities. J. Transp. Health 2019, 12, 50–59. [Google Scholar] [CrossRef]
- Cerin, E.; Sallis, J.F.; Salvo, D.; Hinckson, E.; Conway, T.L.; Owen, N.; Van Dyck, D.; Lowe, M.; Higgs, C.; Moudon, A.V.; et al. Determining thresholds for spatial urban design and transport features that support walking to create healthy and sustainable cities: Findings from the IPEN Adult study. Lancet Glob. Health 2022, 10, e895–e906. [Google Scholar] [CrossRef]
- Wang, Y.; Chau, C.K.; Ng, W.; Leung, T. A review on the effects of physical built environment attributes on enhancing walking and cycling activity levels within residential neighborhoods. Cities 2016, 50, 1–15. [Google Scholar] [CrossRef]
- Bull, F.C.; Hardman, A.E. Walking: A best buy for public and planetary health. Br. J. Sports Med. 2018, 52, 755–756. [Google Scholar] [CrossRef]
- Cain, K.L.; Millstein, R.A.; Sallis, J.F.; Conway, T.L.; Gavand, K.A.; Frank, L.D.; Saelens, B.E.; Geremia, C.M.; Chapman, J.; Adams, M.A.; et al. Contribution of streetscape audits to explanation of physical activity in four age groups based on the Microscale Audit of Pedestrian Streetscapes (MAPS). Soc. Sci. Med. 2014, 116, 82–92. [Google Scholar] [CrossRef] [PubMed]
- Lin, L.; Moudon, A.V. Objective versus subjective measures of the built environment, which are most effective in capturing associations with walking? Health Place 2010, 16, 339–348. [Google Scholar] [CrossRef]
- Lu, Y.; Sarkar, C.; Xiao, Y. The effect of street-level greenery on walking behavior: Evidence from Hong Kong. Soc. Sci. Med. 2018, 208, 41–49. [Google Scholar] [CrossRef] [PubMed]
- Armstrong, T.; Bauman, A.; Davies, J. Physical Activity Patterns of Australian Adults: Results of the 1999 National Physical Activity Survey; Australian Institute of Health and Welfare: Canberra, Australia, 2000. [Google Scholar]
- Rosenberg, M.; Mills, C.; McCormack, G.; Martin, K.; Grove, B.; Pratt, S.; Braham, R. Physical Activity Levels of Western Australian Adults 2009: Findings from the Physical Activity Taskforce Adult Physical Activity Survey; Health Promotion Evaluation Unit, The University of Western Australia: Perth, Australia, 2010. [Google Scholar]
- Suminski, R.R.; Wasserman, J.A.; Mayfield, C.A.; Kheyfets, A.; Norman, J. Walking during leisure-time in relation to perceived neighborhoods. Environ. Behav. 2015, 47, 816–830. [Google Scholar] [CrossRef]
- Suminski, R.R.; Dominick, G.M. A comprehensive evaluation of physical activity on sidewalks and streets in three US Cities. Prev. Med. Rep. 2022, 26, 101696. [Google Scholar] [CrossRef]
- Nickelson, J.; Wang, A.R.; Mitchell, Q.P.; Hendricks, K.; Paschal, A. Inventory of the physical environment domains and subdomains measured by neighborhood audit tools: A systematic literature review. J. Environ. Psychol. 2013, 36, 179–189. [Google Scholar] [CrossRef]
- Brownson, R.C.; Hoehner, C.M.; Day, K.; Forsyth, A.; Sallis, J.F. Measuring the built environment for physical activity: State of the science. Am. J. Prev. Med. 2009, 36, S99–S123. [Google Scholar] [CrossRef]
- Coogan, M.A.; Adler, T.; Karash, K.H. The paths from walk preference to walk behavior: Applying latent factors in structural equation modeling. J. Transp. Land Use 2012, 5, 68–82. [Google Scholar] [CrossRef]
- Handy, S.; Cao, X.; Mokhtarian, P.L. Self-selection in the relationship between the built environment and walking: Empirical evidence from Northern California. J. Am. Plan. Assoc. 2006, 72, 55–74. [Google Scholar] [CrossRef]
- Sung, H.; Go, D.; Choi, C.G.; Cheon, S.; Park, S. Effects of street-level physical environment and zoning on walking activity in Seoul, Korea. Land Use Policy 2015, 49, 152–160. [Google Scholar] [CrossRef]
- Kent, J.L.; Thompson, S. The three domains of urban planning for health and well-being. J. Plan. Lit. 2014, 29, 239–256. [Google Scholar] [CrossRef]
- López-Lambas, M.E.; Sánchez, J.M.; Alonso, A. The walking health: A route choice model to analyze the street factors enhancing active mobility. J. Transp. Health 2021, 22, 101133. [Google Scholar] [CrossRef]
- Sung, H.G.; Go, D.H.; Choi, C.G. Evidence of Jacobs’s street life in the great Seoul city: Identifying the association of physical environment with walking activity on streets. Cities 2013, 35, 164–173. [Google Scholar] [CrossRef]
- Koohsari, M.J.; Sugiyama, T.; Mavoa, S.; Villanueva, K.; Badland, H.; Giles-Corti, B.; Owen, N. Street network measures and adults’ walking for transport: Application of space syntax. Health Place 2016, 38, 89–95. [Google Scholar] [CrossRef]
- Cambra, P.; Moura, F. How does walkability change relate to walking behavior change? Effects of a street improvement in pedestrian volumes and walking experience. J. Transp. Health 2020, 16, 100797. [Google Scholar] [CrossRef]
- Borst, H.C.; Miedema, H.M.; de Vries, S.I.; Graham, J.M.; van Dongen, J.E. Relationships between street characteristics and perceived attractiveness for walking reported by elderly people. J. Environ. Psychol. 2008, 28, 353–361. [Google Scholar] [CrossRef]
- Wang, Z.; Zhang, H.; Yang, X.; Li, G. Neighborhood streets as places of older adults’ active travel and social interaction–A study in Daokou ancient town. J. Transp. Health 2022, 24, 101309. [Google Scholar] [CrossRef]
- Frank, L.D.; Sallis, J.F.; Saelens, B.E.; Leary, L.; Cain, K.; Conway, T.L.; Hess, P.M. The development of a walkability index: Application to the Neighborhood Quality of Life Study. Br. J. Sports Med. 2010, 44, 924–933. [Google Scholar] [CrossRef]
- Forsyth, A.; Krizek, K.J. Promoting walking and bicycling: Assessing the evidence to assist planners. Built Environ. 2010, 36, 429–446. [Google Scholar] [CrossRef]
- Bozovic, T.; Hinckson, E.; Stewart, T.; Smith, M. How street quality influences the walking experience: An inquiry into the perceptions of adults with diverse ages and disabilities. J. Urban. Int. Res. Placemak. Urban Sustain. 2021, 17, 111–136. [Google Scholar] [CrossRef]
- Hou, N.; Popkin, B.M.; Jacobs, D.R., Jr.; Song, Y.; Guilkey, D.; Lewis, C.E.; Gordon-Larsen, P. Longitudinal associations between neighborhood-level street network with walking, bicycling, and jogging: The CARDIA study. Health Place 2010, 16, 1206–1215. [Google Scholar] [CrossRef] [PubMed]
- Cho, Y.H.; Jo, H.K.; Han, B.H. Practice in application of the index of streetscape greenness on environmental impact assessment-Case study of street in Seoul. J. Environ. Impact Assess. 2010, 19, 205–213. [Google Scholar]
- Campbell, A.; Both, A.; Sun, Q.C. Detecting and mapping traffic signs from Google Street View images using deep learning and GIS. Comput. Environ. Urban Syst. 2019, 77, 101350. [Google Scholar] [CrossRef]
- Shach-Pinsly, D. Measuring security in the built environment: Evaluating urban vulnerability in a human-scale urban form. Landsc. Urban Plan. 2019, 191, 103412. [Google Scholar] [CrossRef]
- Wu, C.; Peng, N.; Ma, X.; Li, S.; Rao, J. Assessing multiscale visual appearance characteristics of neighbourhoods using geographically weighted principal component analysis in Shenzhen, China. Comput. Environ. Urban Syst. 2020, 84, 101547. [Google Scholar] [CrossRef]
- Goel, R.; Garcia, L.M.; Goodman, A.; Johnson, R.; Aldred, R.; Murugesan, M.; Brage, S.; Bhalla, K.; Woodcock, J. Estimating city-level travel patterns using street imagery: A case study of using Google Street View in Britain. PLoS ONE 2018, 13, e0196521. [Google Scholar] [CrossRef] [PubMed]
- Cavalcante, A.; Mansouri, A.; Kacha, L.; Barros, A.K.; Takeuchi, Y.; Matsumoto, N.; Ohnishi, N. Measuring streetscape complexity based on the statistics of local contrast and spatial frequency. PLoS ONE 2014, 9, e87097. [Google Scholar] [CrossRef]
- Hyler, S. Invisible lines crossing the city: Ethnographic strategies for place-making. Cult. Unbound 2013, 5, 361–384. [Google Scholar] [CrossRef]
- Kočková, J. Walking in the city: A case study of the streets in Brno. Hum. Aff. 2016, 26, 422–439. [Google Scholar] [CrossRef]
- Zhou, B.; Zhao, H.; Puig, X.; Xiao, T.; Fidler, S.; Barriuso, A.; Torralba, A. Semantic understanding of scenes through the ade20k dataset. Int. J. Comput. Vis. 2019, 127, 302–321. [Google Scholar] [CrossRef]
- Chen, L.C.; Papandreou, G.; Schroff, F.; Adam, H. Rethinking atrous convolution for semantic image segmentation. arXiv 2017, arXiv:1706.05587. [Google Scholar]
- Alton, D.; Adab, P.; Roberts, L.; Barrett, T. Relationship between walking levels and perceptions of the local neighbourhood environment. Arch. Dis. Childhood 2007, 92, 29–33. [Google Scholar] [CrossRef]
- Tilt, J.H. Walking trips to parks: Exploring demographic, environmental factors, and preferences for adults with children in the household. Prev. Med. 2010, 50, S69–S73. [Google Scholar] [CrossRef] [PubMed]
- Kajosaari, A.; Hasanzadeh, K.; Kyttä, M. Residential dissonance and walking for transport. J. Transp. Geogr. 2019, 74, 134–144. [Google Scholar] [CrossRef]
- Li, J.; Auchincloss, A.H.; Yang, Y.; Rodriguez, D.A.; Sánchez, B.N. Neighborhood characteristics and transport walking: Exploring multiple pathways of influence using a structural equation modeling approach. J. Transp. Geogr. 2020, 85, 102703. [Google Scholar] [CrossRef]
- Sukumar, S.; Ahmed, A.A. Walking: How visual exploration informs step choice. Curr. Biol. 2021, 31, R376–R378. [Google Scholar] [CrossRef]
- Verma, D.; Jana, A.; Ramamritham, K. Predicting human perception of the urban environment in a spatiotemporal urban setting using locally acquired street view images and audio clips. Build. Environ. 2020, 186, 107340. [Google Scholar] [CrossRef]
- Tang, J.; Long, Y. Measuring visual quality of street space and its temporal variation: Methodology and its application in the Hutong area in Beijing. Landsc. Urban Plan. 2019, 191, 103436. [Google Scholar] [CrossRef]
- Franěk, M.; Režnỳ, L. Environmental features influence walking speed: The effect of urban greenery. Land 2021, 10, 459. [Google Scholar] [CrossRef]
- Ameli, S.H.; Hamidi, S.; Garfinkel-Castro, A.; Ewing, R. Do better urban design qualities lead to more walking in Salt Lake City, Utah? J. Urban Des. 2015, 20, 393–410. [Google Scholar] [CrossRef]
- Ewing, R.; Hajrasouliha, A.; Neckerman, K.M.; Purciel-Hill, M.; Greene, W. Streetscape features related to pedestrian activity. J. Plan. Educ. Res. 2016, 36, 5–15. [Google Scholar] [CrossRef]
- Park, K.; Ewing, R.; Sabouri, S.; Larsen, J. Street life and the built environment in an auto-oriented US region. Cities 2019, 88, 243–251. [Google Scholar] [CrossRef]
- Dai, L.; Zheng, C.; Dong, Z.; Yao, Y.; Wang, R.; Zhang, X.; Ren, S.; Zhang, J.; Song, X.; Guan, Q. Analyzing the correlation between visual space and residents’ psychology in Wuhan, China using street-view images and deep-learning technique. City Environ. Interact. 2021, 11, 100069. [Google Scholar] [CrossRef]
- Daniel, T.C. Measuring Landscape Esthetics: The Scenic Beauty Estimation Method; Department of Agriculture, Forest Service, Rocky Mountain Forest and Range Experiment Station: Fort Collins, CO, USA, 1976. [Google Scholar]
- Thoma, M. A survey of semantic segmentation. arXiv 2016, arXiv:1602.06541. [Google Scholar]
- Pang, H.E.; Biljecki, F. 3D building reconstruction from single street view images using deep learning. Int. J. Appl. Earth Observ. Geoinf. 2022, 112, 102859. [Google Scholar] [CrossRef]
- Arevalo-Ramirez, T.; Alfaro, A.; Saavedra, J.M.; Recabarren, M.; Ponce-Donoso, M.; Delpiano, J. Exploring the Potential of Vegetation Indices for Urban Tree Segmentation in Street View Images. Authorea Prepr. 2023. [Google Scholar] [CrossRef]
- Ali, D.; Verstockt, S.; Van de Weghe, N. Single image Façade segmentation and computational rephotography of House images using deep learning. J. Comput. Cult. Herit. (JOCCH) 2021, 14, 1–17. [Google Scholar] [CrossRef]
- Wang, M.; He, Y.; Meng, H.; Zhang, Y.; Zhu, B.; Mango, J.; Li, X. Assessing street space quality using street view imagery and function-driven method: The case of Xiamen, China. ISPRS Int. J. Geo-Inf. 2022, 11, 282. [Google Scholar] [CrossRef]
- Zhang, Y.; Chen, N.; Du, W.; Li, Y.; Zheng, X. Multi-source sensor based urban habitat and resident health sensing: A case study of Wuhan, China. Build. Environ. 2021, 198, 107883. [Google Scholar] [CrossRef]
- Guo, J.; He, H.; He, T.; Lausen, L.; Li, M.; Lin, H.; Shi, X.; Wang, C.; Xie, J.; Zha, S.; et al. GluonCV and GluonNLP: Deep Learning in Computer Vision and Natural Language Processing. J. Mach. Learn. Res. 2020, 21, 1–7. [Google Scholar]
- Bergen, S.D.; Ulbricht, C.A.; Fridley, J.L.; Ganter, M.A. The validity of computer-generated graphic images of forest landscape. J. Environ. Psychol. 1995, 15, 135–146. [Google Scholar] [CrossRef]
- Daniel, T.C. Whither scenic beauty? Visual landscape quality assessment in the 21st century. Landsc. Urban Plan. 2001, 54, 267–281. [Google Scholar] [CrossRef]
- Ma, X.; Ma, C.; Wu, C.; Xi, Y.; Yang, R.; Peng, N.; Zhang, C.; Ren, F. Measuring human perceptions of streetscapes to better inform urban renewal: A perspective of scene semantic parsing. Cities 2021, 110, 103086. [Google Scholar] [CrossRef]
- Naik, N.; Philipoom, J.; Raskar, R.; Hidalgo, C. Streetscore-predicting the perceived safety of one million streetscapes. In Proceedings of the IEEE Conference on Computer Vision and Pattern Recognition Workshops, Columbus, OH, USA, 23–28 June 2014; pp. 779–785. [Google Scholar]
- Van den Berg, M.; Wendel-Vos, W.; van Poppel, M.; Kemper, H.; van Mechelen, W.; Maas, J. Health benefits of green spaces in the living environment: A systematic review of epidemiological studies. Urban For. Urban Green. 2015, 14, 806–816. [Google Scholar] [CrossRef]
- Pedregosa, F.; Varoquaux, G.; Gramfort, A.; Michel, V.; Thirion, B.; Grisel, O.; Blondel, M.; Prettenhofer, P.; Weiss, R.; Dubourg, V.; et al. Scikit-learn: Machine Learning in Python. J. Mach. Learn. Res. 2011, 12, 2825–2830. [Google Scholar]
Figure 1.
User-generated trajectories (displayed in translucent red; the darker the color, the more trajectories cover the area). Trajectory-covered streets are well-connected, which means that when users start their walking exercise from a specific starting point, they are faced with multiple options.

Figure 2.
Workflow of the study.

Figure 3.
An illustration of four different street view angles from a sample point.
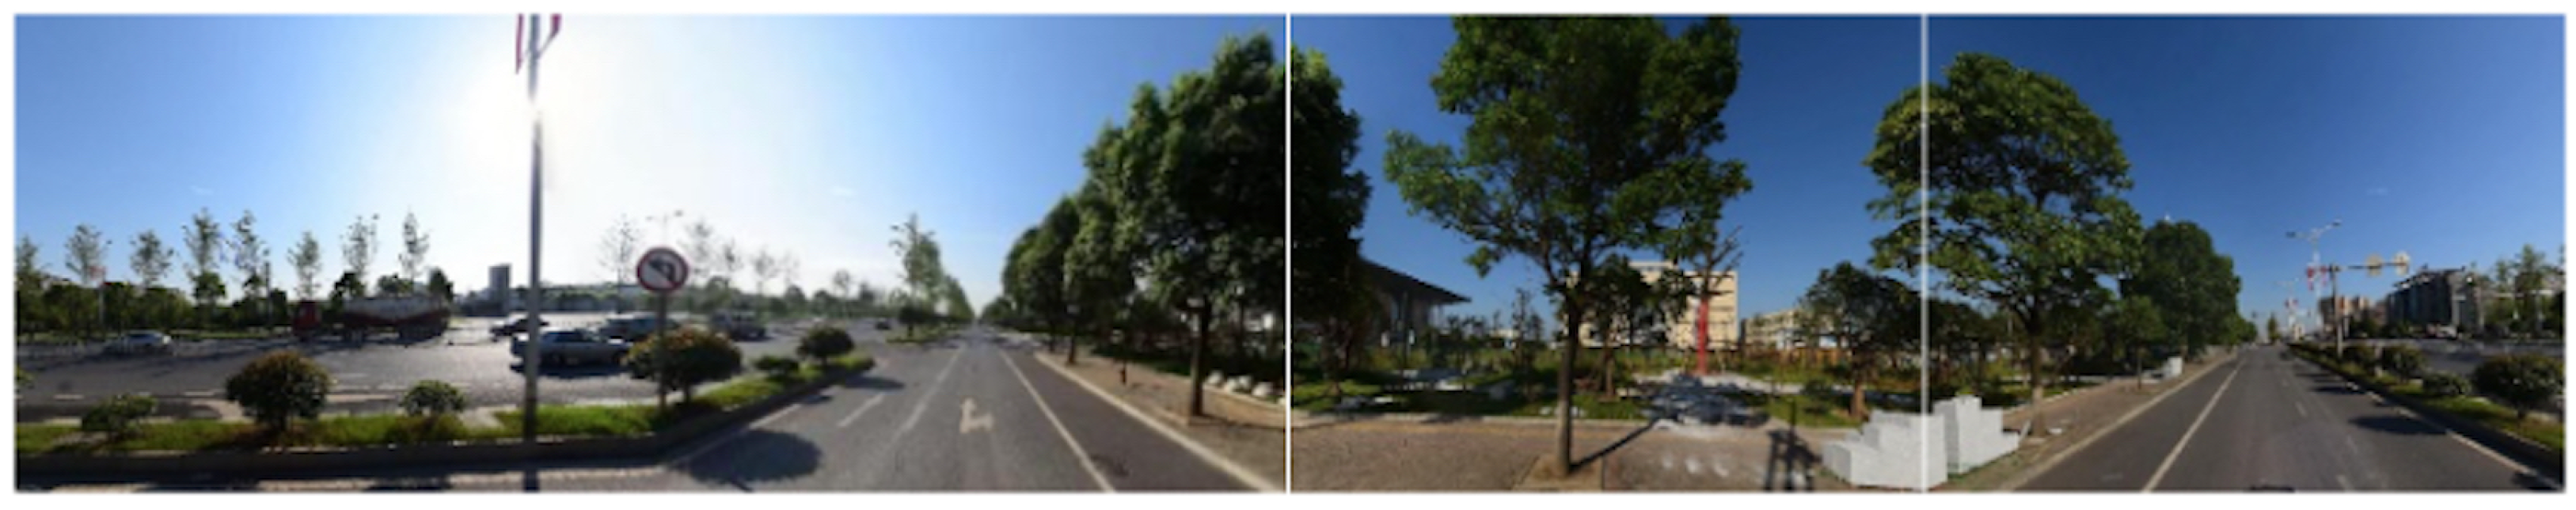
Figure 4.
Histograms of streetscape visual indicators.

Figure 5.
Temporal variations of the proportions of streetscape indicators on the routes.

Figure 6.
Streetscape indicator radar plot. (a) Preference for different exercise types; (b) preferences of different gender groups; (c) preferences of different age groups.
Figure 6.
Streetscape indicator radar plot. (a) Preference for different exercise types; (b) preferences of different gender groups; (c) preferences of different age groups.

Figure 7.
Influence of indicators on gender regression. The heights of the bars indicate the importance of different indicators in predicting the gender that generates the trajectory.
Figure 7.
Influence of indicators on gender regression. The heights of the bars indicate the importance of different indicators in predicting the gender that generates the trajectory.

Figure 8.
Heat map of (a) female- and (b) male-generated trajectories, and the facility ratio (the darker the pixel, the higher the correlation); (c) comparison of the correlation between female- and male-generated trajectories (the warm tones of the right panel are areas where males are more correlated with the facility ratio than females, and the cool tones are areas where females are more correlated with the facility ratio than males).

Figure 9.
Heat map of (a) female- and (b) male-generated trajectories and the enclosure ratio (the darker the pixel, the higher the correlation); (c) comparison of the correlation between female- and male-generated trajectories (the warm tones of the right panel are areas where males are more correlated with the enclosure ratio than females, and the cool tones are areas where females are more correlated with the enclosure ratio than males).

Figure 10.
Heat map of (a) female- and (b) male-generated trajectories and the greenness ratio (the darker the pixel, the higher the correlation); (c) comparison of the correlation between female- and male-generated trajectories (the warm tones of the right panel are areas where males are more correlated with the enclosure ratio than females, and the cool tones are areas where females are more correlated with the enclosure ratio than males).

Figure 11.
Heat map of (a) female- and (b) male-generated trajectories and the openness ratio (the darker the pixel, the higher the correlation); (c) comparison of the correlation between female- and male-generated trajectories (the warm tones of the right panel are areas where males are more correlated with the enclosure ratio than females, and the cool tones are areas where females are more correlated with the enclosure ratio than males).

Figure 12.
Heat map of (a) female- and (b) male-generated trajectories and beauty (the darker the pixel, the higher the correlation); (c) comparison of the correlation between female- and male-generated trajectories (the warm tones of the right panel are areas where males are more correlated with the enclosure ratio than females, and the cool tones are areas where females are more correlated with the enclosure ratio than males).


Table 1.
Description of exercise trajectory field information.
| Field Name | Field Description |
|---|---|
| sport.id | Trajectory ID |
| user.id | User ID |
| Sport type | 0 (running), 4 (walking) |
| Exercise distance | The total length of the trajectory in meters |
| Recording time | Recording time |
| Birthday | Date of birth |
| Gender | 0 (female), 1 (male) |
Table 2.
Details of streetscape visual indicators.
| Indicators | Equation | Description |
|---|---|---|
| Greenness | is the proportion of tree pixels; is the proportion of plant pixels; is the proportion of grass pixels. | |
| Openness | is the proportion of tree pixels. | |
| Enclosure | is the proportion of building pixels; is the proportion of tree pixels. | |
| Walkability | is the proportion of sidewalk pixels; is the proportion of fence pixels; is the proportion of road pixels. | |
| Blueness | , , and , respectively, is the proportion of river, ocean, and lake pixels. | |
| Facility | is the proportion of streetlight pixels; is the bench pixels. |
Table 3.
Regression results.
| Precision | Recall | F1 Score | |
|---|---|---|---|
| Gender | 0.79 | 0.79 | 0.79 |
| Female | 0.83 | 0.77 | 0.80 |
| Male | 0.75 | 0.82 | 0.78 |
Disclaimer/Publisher’s Note: The statements, opinions and data contained in all publications are solely those of the individual author(s) and contributor(s) and not of MDPI and/or the editor(s). MDPI and/or the editor(s) disclaim responsibility for any injury to people or property resulting from any ideas, methods, instructions or products referred to in the content. |
© 2024 by the authors. Licensee MDPI, Basel, Switzerland. This article is an open access article distributed under the terms and conditions of the Creative Commons Attribution (CC BY) license (https://creativecommons.org/licenses/by/4.0/).
Share and Cite
MDPI and ACS Style
Zhu, J.; Li, B.; Ouyang, H.; Wang, Y.; Bai, Z. Understanding Urban Residents’ Walking Exercise Preferences: An Empirical Study Using Street View Images and Trajectory Data. Buildings 2024, 14, 549. https://doi.org/10.3390/buildings14020549
AMA Style
Zhu J, Li B, Ouyang H, Wang Y, Bai Z. Understanding Urban Residents’ Walking Exercise Preferences: An Empirical Study Using Street View Images and Trajectory Data. Buildings. 2024; 14(2):549. https://doi.org/10.3390/buildings14020549
Chicago/Turabian StyleZhu, Jiawei, Bo Li, Hao Ouyang, Yuhan Wang, and Ziyue Bai. 2024. "Understanding Urban Residents’ Walking Exercise Preferences: An Empirical Study Using Street View Images and Trajectory Data" Buildings 14, no. 2: 549. https://doi.org/10.3390/buildings14020549
Note that from the first issue of 2016, this journal uses article numbers instead of page numbers. See further details here.