
Correlations between Energy Dissipation Characteristics and the Rheological Property Degradation of Asphalt Binders
School of Civil Engineering and Transportation, South China University of Technology, Guangzhou 510641, China
*
Author to whom correspondence should be addressed.
Buildings 2024, 14(1), 292; https://doi.org/10.3390/buildings14010292
Submission received: 27 December 2023
/
Revised: 17 January 2024
/
Accepted: 18 January 2024
/
Published: 21 January 2024
(This article belongs to the Section Building Materials, and Repair & Renovation)
Abstract
:Fatigue failure in asphalt pavements, caused by continuous loading, primarily occurs at the interface between the asphalt binder and the aggregate (adhesive failure) or within the asphalt binder itself (cohesive failure). This study conducted variable stress fatigue tests on asphalt binders to investigate the fatigue damage evolution mechanism that aligns most closely with actual road conditions. By altering test conditions such as stress amplitude and loading frequency, the study summarized the patterns of change in the fatigue performance parameters of binder samples and analyzed their fatigue life. The research methods employed are of significant value for refining the existing asphalt fatigue evaluation systems. Indicators such as dissipated energy ratio, cumulative dissipated energy ratio, rate of change in dissipated energy, and the G-R constant n × Gn* were used as criteria for fatigue failure. The fatigue life of samples under different stress levels was calculated, and the applicability of each dissipated energy fatigue indicator was evaluated. The evaluation indicators, like dissipated energy ratio and cumulative dissipated energy ratio, failed under large stress outside the non-linear viscoelastic range, whereas the rate of change in dissipated energy and the G-R constant n × Gn* accurately determined the fatigue life of samples in fatigue tests at all stress levels, covering a broader range of applicable stresses. In variable stress fatigue tests, the rate of change in dissipated energy and the G-R constant were used as indicators for determining fatigue failure. Under a small-to-large loading mode, the second stage of the sample’s fatigue life was too short, causing the G-R constant curve to not reach its peak, and hence it could not accurately determine the sample’s fatigue life. Under a large-to-small loading mode, there are sufficient loading cycles before fatigue failure occurs, allowing the G-R constant curve to reach its peak, demonstrating that the G-R constant remains applicable in this loading mode. Under both small-to-large and large-to-small loading modes, the fatigue failure point of the samples could be determined based on the rate of change in dissipated energy curve. It is recommended to use the rate of change in dissipated energy as the failure criterion for samples in variable stress fatigue tests on asphalt binders.
1. Introduction
The current challenge facing road design revolves around ensuring and extending the service life of road surfaces. Fatigue damage in asphalt pavements, caused by continuous loading, primarily occurs at the asphalt binder–aggregate interface (adhesive failure) or within the asphalt binder itself (cohesive failure) [1,2]. Hence, the fatigue resistance of asphalt binders significantly impacts the ability of asphalt mixtures to withstand repetitive loading, garnering widespread attention from researchers [3,4,5,6,7,8,9]. There is still room for debate regarding whether traditional fatigue test methods and the resulting fatigue assessment models can accurately reflect the fatigue performance of asphalt binders under the influence of random loading [10]. Consequently, it is essential to enhance asphalt binder fatigue test methods by incorporating variable amplitude stress into the specimen loading process and refining the damage evolution mechanism of asphalt binders based on fatigue damage accumulation theory to better align with real traffic conditions [11,12].
Under heavy loading conditions that exceed the linear viscoelastic range, the fatigue crack propagation within asphalt binders is often accompanied by permanent deformation, such as plastic flow. While prior research has made considerable progress in studying the fatigue cracking process in asphalt binders, there is still a lack of understanding regarding the mechanisms of plastic flow damage in asphalt binders [13]. Additionally, conducting fatigue tests on asphalt binders with lower-level loading leads to the specimens spending most of their time being undamaged, which is not conducive to studying the damage evolution mechanisms of binders and accurately assessing their fatigue resistance [14]. The introduction of non-linear viscoelastic high-stress loading can effectively reduce the time required for fatigue testing. Therefore, this paper introduces the concept of a non-linear viscoelastic high-stress design with variable stress amplitudes for conducting fatigue tests on asphalt binders [15]. The alternating application of non-linear viscoelastic high and low stress levels to the specimens aims to comprehensively understand the damage evolution process in asphalt binders under actual road conditions, and the results obtained can help bridge existing research gaps [15].
Typically, linear amplitude sweep tests are employed to characterize the fatigue performance of asphalt binders [16]. However, in real-world road conditions, the loads experienced are a combination of various axle loads, and the load amplitudes do not increase linearly but involve alternating levels of loading [17]. While linear amplitude sweep tests effectively reduce the time required for evaluating asphalt fatigue performance, they are constrained by their limited ability to provide fixed damage accumulation results [18,19]. Consequently, they cannot depict the continuous variations in the fatigue characteristics of asphalt binders as they undergo successive load cycles, which makes it challenging to compare the evolution of different types of damage under various loading patterns [20].
Therefore, this study utilizes time sweep tests to enable continuous observation of this process. The application of variable amplitude stress combinations to asphalt binders facilitates the examination of fatigue responses as stress levels transition. Building upon rheological performance parameters, Van Dijk and colleagues investigated the energy dissipation occurring during the fatigue testing of asphalt mixtures, affirming that asphalt mixtures dissipate energy when subjected to fatigue damage. They propose using energy dissipation-based metrics to characterize the fatigue properties of asphalt mixtures [21]. Kim and others conducted cyclic loading tests and calculated energy dissipation metrics based on the changes in the area and slope of the stress–strain hysteresis loops obtained from asphalt binders subjected to cyclic loading [22].
Within the framework of energy dissipation theory, Hopman and his team introduced metrics such as dissipated energy ratio and cumulative dissipated energy ratio [23], while Ghuzlan and others proposed the dissipated energy rate of change [24]. Glover and Rowe introduced the n × Gn* (Glover–Rowe parameter, also known as G-R constant) and various other fatigue assessment indices [25,26,27]. However, most of these indices assume fatigue cracking to be the sole type of damage and analyze the fatigue damage behavior of asphalt binders on that premise.
Planche and colleagues plotted energy dissipation ratio curves with the number of repeated load cycles N as the horizontal axis, defining the transition point from a linear to a non-linear curve as the fatigue failure point of the specimen. Their fatigue criteria based on energy dissipation rate presuppose that not all energy dissipation leads to the accumulation of fatigue damage, as some energy dissipation results from viscoelastic behaviors such as hysteresis damping, and does not further damage the asphalt [28]. Nonetheless, energy-based evaluation metrics also have certain limitations. Zhang and Oeser argue that, when asphalt specimens are subjected to high stresses beyond the linear viscoelastic range, fatigue failure criteria based on energy dissipation ratio and cumulative energy dissipation ratio are no longer applicable [29].
This study conducted time sweep tests on asphalt binders under different loading patterns by subjecting binder specimens to cyclic stress using a Dynamic Shear Rheometer (DSR). The research aimed to investigate changes in the rheological properties and energy dissipation characteristics of the binder specimens as a basis for assessing their fatigue resistance. By adjusting parameters such as the number of loading cycles, loading sequence, and load amplitudes, the study designed and compared constant stress fatigue tests and two-stage variable amplitude stress fatigue tests on the binders. Four energy dissipation indices, namely Dissipated Energy Ratio (DER), Cumulative Dissipated Energy Ratio (CDER), Rate of Dissipated Energy Change (RDEC), and the G-R constant (n × Gn*), were used to represent the energy dissipation characteristics of the asphalt specimens. These indices were employed to establish fatigue failure criteria for determining the fatigue life of binder specimens under various loading patterns, and their feasibility and effectiveness were subject to theoretical analysis and statistical evaluation. Furthermore, the study explored the energy dissipation characteristics of binder specimens under different stages of fatigue damage, revealing their relationship with the degradation of binder rheological properties. We established a connection between these indirect fatigue indicators and the actual specimen damage evolution process.
2. Materials and Testing
2.1. Asphalt Binders
The study selected three types of asphalt binders, including two base bitumens labeled as Pen70–80 and Pen60–70, and one SBS-modified bitumen with an SBS content of 4% labeled as SBS. The primary technical specifications of the asphalt binders are provided in Table 1, sourced from Guangzhou Xinyue Transportation Technology Co. Ltd. in Guangzhou, China. All asphalt binders underwent short-term aging before specimen preparation. Prior to sample preparation, the hot asphalt was stirred with a glass rod for approximately 30 s to ensure uniform properties of the asphalt specimens and to remove any air bubbles. The stirred asphalt binders were then poured into silicone molds to create asphalt specimens.
2.2. Stress Control Time Scanning Test Plan
Both stress sweep tests and time sweep tests were conducted in this study using the Kinexus Dynamic Shear Rheometer from Malvern Instruments, UK. The parallel plate system in the rheometer has a diameter of 8 mm and a gap size of 2 mm. For all specimens, the test temperature and frequency were set to 25 °C and 10 Hz, respectively, with raw data collected every second, corresponding to every 10 loading cycles. The purpose of the stress sweep test was to determine the linear viscoelastic range of the asphalt binders. During the stress sweep test, a logarithmically increasing shear stress was continuously applied to the asphalt samples, spanning a stress range from 10 kPa to 1000 kPa. In this study, the yield stress was defined as the shear stress corresponding to a 90% reduction in the residual complex shear modulus during the stress sweep process compared to the initial complex’s shear modulus. To obtain more precise test results, each type of asphalt binder was subjected to repeated tests of three or more repetitions.
According to ASTM standard D7175-15, the limit of the Linear Viscoelastic (LVE) region of asphalt is defined as the shear stress or strain at which the complex modulus of the asphalt binder reduces to 90% of its initial value, which is known as the yield stress or yield strain [30]. This value can be determined from the results of stress sweep tests and serves as a reference for the linear viscoelastic region of asphalt binders. In this study, a balanced consideration of the linear viscoelastic region and the time required for testing was made by selecting suitable LVE and NLVE (Non-Linear Viscoelastic) loads for the subsequent time sweep tests. The variable stress sweep loading pattern is divided into two stages. In the first stage, the specimen is subjected to n1 cycles of load τ1, followed by the application of load τ2 in the second stage, which is different in magnitude from τ1, until specimen fatigue failure occurs. The number of cycles in the second stage load, determined from the test results, is denoted as n2. Different asphalt binder specimens are tested with appropriate stress levels and numbers of loading cycles in the two-stage load sequence based on their respective yield stress values. Once the loading pattern is established, three different time sweep test protocols for asphalt binders were formulated based on their respective damage fractions in the first stage, as outlined in Table 2. After subjecting the asphalt specimens to n1 cycles of load τ1, the second-stage load τ2 is continuously applied until the phase angle output from the instrument reaches its peak value, marking the end of the test. This process provides the measured values for the second-stage fatigue life of the specimens. In this study, time sweep tests under each loading pattern were conducted with three or more repetitions, ensuring that the error in the measured fatigue life of the specimens was controlled to within 10% or less.
2.3. Fatigue Test Life Evaluation Indicators
2.3.1. Evaluation Indicators for Dissipated Energy in Fatigue Testing
Utilizing energy dissipation-based parameters as indirect and empirical indicators to characterize asphalt fatigue failure can effectively pretest processes such as crack initiation and propagation within the specimens [31].
The calculation formula for the energy dissipation (DE) is as follows:
where DEn is the dissipated energy under the nth load cycle; is the stress value under the nth load cycle; is the strain value under the nth load cycle; and is the phase angle under the nth load cycle.
The formula for calculating cumulative dissipated energy (CDE) is as follows:
where CDE represents the cumulative dissipated energy, and DEn stands for the dissipated energy for the nth loading cycle.
It is worth noting that the definition of fatigue failure differs between stress-controlled and strain-controlled loading patterns. Under these two distinct loading modes, plots of the dissipated energy ratio against the number of loading cycles yield significantly different basic shapes for the two dissipated energy ratio curves. Therefore, it becomes challenging to establish a unified criterion for defining the failure of binder specimens based on these relationship curves.
2.3.2. Evaluation Indicators for Dissipation Energy Ratio and Cumulative Dissipation Energy Ratio
Pronk and his colleagues recognized that dissipated energy provides a more accurate reflection of the fatigue damage evolution process within specimens. Building upon dissipated energy parameters, they introduced the use of the Dissipated Energy Ratio (DER) and Cumulative Dissipated Energy Ratio (CDER) as definitions for asphalt specimen fatigue failure [32]. The Dissipated Energy Ratio is calculated as the product of the initial dissipated energy and the number of loading cycles n, divided by the dissipated energy for the nth loading cycle. The Cumulative Dissipated Energy Ratio, on the other hand, is the ratio of the total dissipated energy for the first n loading cycles to the dissipated energy for the nth loading cycle.
The calculation formula for the Dissipated Energy Ratio is as follows:
Calculation formula for cumulative Dissipation Energy Ratio:
where is the initial dissipated energy. The dissipated energy of the nth load cycle is calculated by Equation (1).
As the experiments progress, the DER and CDER curves begin to deviate from their initial linear trajectories. These deviation points signify a noticeable change in the dissipated energy values within the specimens, which Planche and others define as the fatigue failure point [33]. By determining the deviation points on the DER and CDER curves, the number of loading cycles at which the specimen experiences fatigue failure, known as the specimen’s fatigue life, can be obtained. In this study, the fatigue life values obtained from the DER and CDER curves are denoted as Nf-D and Nf-C, respectively. Zhang and Oeser observed that, when asphalt binders are subjected to loads exceeding their linear viscoelastic range during fatigue testing, macroscopic plastic deformation may occur in the asphalt specimen from the initial stages of load application, leading to asphalt specimen failure. In such cases, the DER and CDER curves may deviate earlier based on the test results. However, the asphalt specimen has not fully failed, and the obtained fatigue life results tend to be smaller compared to the actual fatigue life of the asphalt specimen [34]. The variations in the slopes of the DER and CDER curves drawn under different loading modes differ significantly, and a unified determination criterion remains elusive.
2.3.3. Dissipated Energy Change Rate Evaluation Index
Ghuzlan et al. introduced the use of the Dissipated Energy Change Rate (RDEC) to evaluate the damage evolution process in asphalt binders and proposed corresponding methods for determining specimen fatigue failure [24].
The calculation formula for the Dissipated Energy Change Rate is as follows:
where: a and b represent the number of loading cycles corresponding to adjacent sampling points, with a > b; is the dissipated energy change rate for cycle a; is the dissipated energy for cycle a, and is the dissipated energy for cycle b.
To facilitate the determination of the fatigue life of binder specimens, this evaluation method introduces a new energy parameter known as the Dissipated Energy Change Rate Plateau Value (PV). Its magnitude is equal to the average value of the Dissipated Energy Change Rate during the steady state phase of the specimen [35]. A smaller PV value is calculated from the test data for binder specimens with better fatigue resistance or subjected to smaller load amplitudes in fatigue tests. The PV value has been shown to establish links between asphalt material properties, various loading conditions in fatigue tests, and the specimen’s fatigue life, fatigue load limit, and material self-healing capabilities. Therefore, it can be easily integrated into pavement design algorithms.
Using the dissipated energy change rate evaluation index to determine the macroscopic failure point, the initial dissipated energy is linearly connected with the dissipated energy for the nth loading cycle. The area enclosed by this line and the x-axis is denoted as AT (area of the trapezoidal). The area AT of the trapezoid can be calculated using Formula (6):
where represents the initial dissipated energy, is the dissipated energy for the nth loading cycle, which is calculated as per Equation (1), and n denotes the number of loading cycles.
In light of the differences observed in the dissipated energy curves between binders and mixtures, Shen and others have set a deviation threshold of 10% as the macroscopic failure criterion for asphalt mixture specimens [35]. For asphalt binders, the threshold is set at 50%. In this study, these standards are adopted to determine the fatigue life of binder specimens. The analysis of binder fatigue life is conducted based on the Dissipated Energy Change Rate index, while the traditional criterion of reducing the complex modulus to 50% of its initial value is applied to assess the fatigue life of mixtures. An analysis of the correlation between the evaluation results from both methods is performed, suggesting a strong correlation between the asphalt binder fatigue performance assessed by the dissipated energy change rate index and the traditional fatigue failure criteria for mixtures.
2.3.4. n × Gn* Evaluation Indicators
Rowe recommended the use of the parameter n × Gn* (Glover–Rowe constant, also known as G-R constant) to determine the fatigue failure point of asphalt binders [36]. It is generally considered that n × Gn* is also a parameter based on dissipated energy since it is derived from the Dissipated Energy Ratio formula. By substituting Equation (1) into Equation (3), another formula for calculating the Dissipated Energy Ratio is obtained as follows:
In stress-controlled fatigue tests, the value of stress is equal to , and the complex shear modulus formula is substituted into Equation (7) to obtain Equation (8).
Simplify the above equation to obtain:
In the initial stages of loading, it is generally assumed that the fatigue specimen remains intact. At this point, the initial values of the complex shear modulus Gn* and phase angle δ1 for the nth loading cycle are equal to Gn* and δ1 of the first loading cycle. The constant n × Gn* can represent the slope of the dissipated energy ratio curve. Since the variation in phase angle for binder specimens is significantly smaller than that of the complex shear modulus, it is possible to consider sinδ1/sinδn as a single entity within the dissipated energy ratio formula, allowing a separate examination of the slope variation of n × Gn*. The asphalt binder’s fatigue failure point, as defined by the G-R constant, corresponds to the maximum point on the n × Gn* curve. At this point, the specimen’s fatigue life is denoted as Nf-P.
3. Results and Discussion
3.1. Relationship between Energy Dissipation and Rheological Property Degradation of Cementitious Materials
According to Equations (1) and (2), the dissipated energy (DE) and cumulative dissipated energy (CDE) of the binder specimens were calculated. The DE and CDE curves for Pen70–80 asphalt specimens were plotted under stress levels of 150 kPa and 300 kPa, and compared with their corresponding rheological performance curves, as shown in Figure 1.
It is evident that both the DE and CDE curves exhibit three main damage stages, separated by two transition points, which are similar to the rheological performance curves. However, the positions of the damage transition points are noticeably different. Under 150 kPa stress, the first stage of the energy dissipation curve corresponds to the undamaged phase, where no fatigue damage occurs in the specimens. During this stage, energy dissipation primarily occurs in the form of viscoelastic damping in the asphalt specimens, resulting in minimal changes in dissipated energy (the DE curve remains as a horizontal line, and CDE curve exhibits a constant slope) until after the first damage transition point when the slope changes significantly. It is noteworthy that there is a transient initial rise in the DE curves for both 150 kPa and 300 kPa stress levels. This initial rise is attributed to the disturbance caused by the normal stress on the specimen immediately after the application of a load. It is known that a higher applied stress results in a more significant effect of normal stress generated by the instrument on the specimen, leading to a more pronounced initial rise in the DE curve for the 300 kPa stress level. This initial rise in the DE curve corresponds to the rapid damage phase observed in the rheological performance curve, characterized by a sharp decrease in complex shear modulus and a significant increase in phase angle. However, this phase is not observed in the cumulative dissipated energy curves for both stress levels.
The second stage in both the DE and CDE curves represents the slow damage phase, during which macroscopic fatigue cracks gradually start to propagate in the asphalt binder specimens. This phase is characterized by a gradual change in the complex shear modulus and phase angle of the asphalt binder under stress. The DE and CDE curves become lines with gradually increasing slopes, with the energy dissipated in each loading cycle steadily increasing until the second transition point. However, when the complex shear modulus and phase angle curves undergo the second stage of change, the DE and CDE curves remain in the first stage. This is a significant distinction between the two, indicating that the energy dissipation curves can describe the actual damage evolution in the asphalt specimens, even when there is a clear modulus degradation in the asphalt specimen. This suggests that the energy dissipation resulting from actual fatigue damage has not yet occurred during this stage.
In the third stage, the cumulative dissipated energy of the asphalt specimen increases rapidly. This phenomenon indicates a shift in the damage mode of the asphalt specimen from fatigue cracking to plastic flow. Starting from the second stage, macroscopic cracks in the asphalt specimen begin to form and develop and accumulate with increasing fatigue loading cycles. When the effective stress exceeds the residual strength of the asphalt structure, the damage mode of the asphalt transitions to plastic flow, resulting in significant changes in energy dissipation and rheological performance.
As shown in Figure 2, when the asphalt specimen is subjected to NLVE (non-linear variable amplitude) stress, the dissipated energy and cumulative dissipated energy curves can also be divided into three distinct stages. Unlike the LVE (linear variable amplitude) stress condition, the dissipated energy curve under NLVE stress experiences significant changes right from the initial stage. The slope of the curve increases initially and gradually decreases, which is notably different from the dissipated energy curve under LVE stress. This discrepancy can be attributed to the coupled effects of plastic flow and thermal equilibrium within the asphalt binder specimen.
During the initial stage of the experiment, the energy input by the rheometer results in irreversible viscoplastic deformation and damage within the asphalt binder specimen. The energy dissipation occurs through a combination of plastic flow damage and heat softening. Heat softening continues until thermal equilibrium is reached within the specimen. Once the asphalt binder specimen reaches its thermal equilibrium temperature, fatigue damage becomes the predominant form of energy dissipation. At this point, the specimen enters the second stage of damage, where changes in its viscoelastic properties are primarily influenced by fatigue damage. The accumulation of fatigue damage gradually generates heat within the specimen until the thermal equilibrium is disrupted, leading the asphalt binder to enter the third stage of damage. In this situation, the slope of the dissipated energy curve undergoes a sudden change after an initial short loading cycle. The linear phase lasts for fewer loading cycles, and the slope values are less stable compared to the cumulative dissipated energy curve. This instability indicates that the dissipated energy parameters are not suitable for evaluating the damage process of asphalt under NLVE stress conditions. They fail to effectively identify the fatigue failure point. On the other hand, the calculation of cumulative dissipated energy introduces the total dissipated energy, which mitigates the influence of significant energy fluctuations within a single cycle on the test results.
Comparing the dissipated energy curves under different stress amplitudes, it is evident that under NLVE (non-linear variable amplitude) stress conditions, the initial value of dissipated energy is larger, and the duration of the damage-free stage is shorter than under LVE (linear variable amplitude) stress. This means that the specimens subjected to NLVE stress enter the rapid damage stage earlier. This acceleration in the damage evolution of asphalt specimens is attributed to the increased stress amplitudes, which expedite the damage process.
A similar observation can be made in the fracture surfaces of the specimens. Under NLVE stress control, the area of plastic flow in the middle of the fatigue fracture surface is significantly larger compared to that under LVE stress. Additionally, the crack width is narrower, indicating that plastic flow deformation occurs earlier in the specimens. To facilitate the comparison of the dissipated energy variation process in asphalt binder specimens under LVE and NLVE stress conditions, dissipated energy curves for Pen70–80 asphalt under 100 kPa and 400 kPa stress (Figure 3), Pen60–70 asphalt under 100 kPa and 500 kPa stress (Figure 4), and SBS modified asphalt under 200 kPa and 300 kPa stress (Figure 5) have been plotted. Comparing the dissipated energy curves in Figure 4a and Figure 5a under the same level of LVE stress, it is apparent that the dissipated energy curve of SBS modified asphalt binder exhibits a more pronounced initial upward trend than Pen60–70 asphalt binder, with a greater magnitude of change. Moreover, the slope of the dissipated energy curve in the second stage is steeper for the modified asphalt binder compared to the unmodified asphalt binder. This indicates that within each loading cycle, the modified asphalt binder experiences a larger change in dissipated energy.
However, upon comparing the cumulative dissipated energy curves, it is observed that Pen60–70 asphalt binder has significantly higher total dissipated energy after the first 4500 stress cycles than SBS-modified asphalt. When comparing the dissipated energy curves and rheological performance curves of the three asphalt binders, a substantial difference in their trends becomes evident. In the first stage, the complex shear modulus of the specimens rapidly decreases, and the phase angle rapidly increases, while no significant changes are observed in the dissipated energy curves and cumulative dissipated energy curves.
3.2. Applicability Analysis of Dissipative Energy Fatigue Criterion under Constant Stress
3.2.1. Analysis Results of Evaluation Indicators for Dissipation Energy Ratio and Cumulative Dissipation Energy Ratio
We plotted the DER and CDER curves for Pen70–80 asphalt binder under 150 kPa and 300 kPa stress conditions, with the number of load cycles on the x-axis and dissipated energy ratio (DER) and cumulative dissipated energy ratio (CDER) on the y-axis, as shown in Figure 6 and Figure 7.
The DER and CDER curves shown in Figure 6 remain as straight lines without significant deviation. This indicates that the complex rheological behavior occurring in the early stages of the time sweep may not be related to the macroscopic fatigue damage in the asphalt binder samples. The fatigue evaluation method based on dissipated energy, compared to the rheological performance curves, better represents the actual damage conditions in assessing asphalt binder fatigue damage. In traditional dissipated energy evaluation methods, the straight segments of the DER and CDER curves are defined as the undamaged state of the samples. It assumes that, as long as the energy dissipation in the sample remains constant, there is no fatigue damage occurring within the sample. Points where the dissipated energy ratio curve starts to gradually deviate from the undamaged-state line indicate the initiation of cracks within the sample, and they are about to propagate from microcracks to macrocracks.
The evaluation criteria based on dissipated energy ratio and cumulative dissipated energy ratio suggest that fatigue failure of the sample can be determined when the slopes of both curves start to change and the deviation ratio exceeds 20%. The formula for calculating the deviation ratio is as follows:
Among the variables, DER is the dissipation energy ratio, calculated from Equation (3), and N is the number of load cycles.
In Figure 6 and Figure 7, the deviation points corresponding to the DER and CDER curves of Pen70–80 samples under 150 kPa and 300 kPa loading conditions are marked, with these points usually occurring in the middle to late stages of the fatigue test. They correspond to the first transition point in the dissipated energy and cumulative dissipated energy curves, indicating that the sample’s dissipated energy starts to exhibit significant fluctuations. It can be observed that there are noticeable differences in the trends in the DER and CDER curves at the two stress levels. At 150 kPa, the undamaged line of the DER curve is approximately a straight line with a slope close to 1, while the undamaged line of the CDER curve is approximately a straight line with a slope close to 0.1. Although the slopes are different, the deviation points for both curves are relatively close, with the CDER curve determining a slightly shorter fatigue life Nf-C compared to Nf-D obtained from the DER curve. However, at 300 kPa, the DER and CDER curves already start to deviate from the undamaged line in the initial stages, leading to very small values of Nf-D and Nf-C. This suggests that the samples immediately fail after being subjected to NLVE loading, which does not align with the actual load-bearing capacity of the samples. This discrepancy arises because the evaluation criteria based on DER and CDER assume that an asphalt binder undergoes an undamaged phase at the beginning of fatigue loading, during which its dissipated energy remains stable, and the dissipated energy ratio curve exhibits a constant slope. However, when an asphalt binder experiences NLVE stress, it already undergoes permanent damage from the first loading cycle, resulting in significant changes in dissipated energy values, and both the dissipated energy ratio and cumulative dissipated energy ratio curves become nonlinear.
According to the failure criteria corresponding to Nf-D and Nf-C, an asphalt binder under NLVE stress experiences immediate fatigue failure after a few loading cycles, even though in the actual test process, the asphalt sample still has the capacity to bear the load, and the cumulative deformation of the specimen does not exceed its load-bearing capacity. This indicates that the fatigue life estimated by this criterion significantly underestimates the sample’s fatigue resistance. Under NLVE loading, the assumed failure conditions make the DER and CDER evaluation criteria unable to accurately assess the fatigue performance of asphalt binders. Nevertheless, these evaluation criteria based on DER and CDER can still effectively assess the resistance of asphalt binders to fatigue cracking under LVE loading conditions, with only a small margin of error in the determined sample fatigue life.
3.2.2. Analysis Results of n × Gn* Evaluation Indicators
In Figure 8, the curves of n × Gn* as a function of the number of loading cycles are plotted for Pen70–80 asphalt, along with the dissipated energy ratio (RDEC) curves. In the context of stress-controlled fatigue testing, it is straightforward to determine the specimen’s fatigue life using the peak value of the G-R constant (n × Gn*). Zhang and colleagues proposed that the maximum value of n × Gn* represents the transition point at which microcracks in the asphalt binder extend to the formation of macroscopic cracks under repeated loading. Existing research has confirmed the feasibility of using this evaluation method to assess fatigue failure in asphalt binders [37,38]. By comparing the data in Figure 8a,b for Pen70–80 samples under LVE stresses (100 kPa and 150 kPa), it can be observed that the RDEC values during the stable phase of the dissipated energy ratio curve do not show significant changes. However, during this phase, the corresponding complex shear modulus curve exhibits a rapid decline. The dissipated energy ratio effectively reflects the actual fatigue damage of the sample. This indicates that, during the stable phase, the real damage accumulation rate in the sample is relatively slow because, during the initial loading under low-amplitude stress, individual stress cycles cause limited effective damage to the sample. Additionally, there is a certain degree of damage recovery, leading to significant differences in the damage conditions reflected by the two types of curves. In comparison with the complex shear modulus curve, the dissipated energy ratio curve better reflects the real damage accumulation status of the sample.
Based on Figure 8a,b, it can be observed that, under the influence of low-amplitude LVE stresses, the dissipated energy ratio curve for Pen70–80 samples during the stable phase, although it generally follows a horizontal trend, is not entirely smooth, with substantial fluctuations in the dissipated energy ratio for some loading cycles. As the stress level increases, the dissipated energy ratio curve during the stable phase gradually becomes smoother. In Figure 8c,d, there is almost no data fluctuation during the stable phase. Since fluctuations in the early stage data can interfere with the determination of the sample’s failure point, the dissipated energy ratio curve is more suitable for identifying the fatigue failure point of asphalt samples under NLVE stress control.
Figure 9 and Figure 10 represent the dissipated energy ratio (DER) curves and G-R constant curves for Pen60–70 asphalt and SBS-modified asphalt under both LVE and NLVE loading conditions. These figures are used to compare the applicability of these two indicators in the fatigue testing of other types of binders. The trends of the two types of curves in the figures are generally consistent with those of Pen70–80 asphalt. They both allow for the accurate determination of the fatigue life of asphalt samples, denoted as Nf-R and Nf-P, based on the deviation point of the dissipated energy ratio curve and the peak value of the G-R constant curve.
3.2.3. Applicability Analysis of Various Dissipative Energy Parameters
Based on the dissipated energy ratio (DER) curve and the G-R constant curve, Table 3 presents the fatigue life values (Nf-R and Nf-P) determined for Pen70–80 asphalt under various stress levels.
According to Table 3, under NLVE stresses (300 kPa and 400 kPa), the dissipated energy ratio (DER) curve reaches the deviation point before the G-R constant curve reaches the peak point. Consequently, the asphalt sample’s fatigue life determined by DER (Nf-R) is smaller than that determined by the G-R constant (Nf-P). In contrast, under LVE stress conditions, Nf-R is greater than Nf-P. Nf-P can be considered as an indicator of the macroscopic crack initiation point, while Nf-R represents the point at which the sample begins to exhibit plastic flow [34].
Under LVE stress control, the primary mode of damage for the binder sample is fatigue cracking, and plastic flow deformation occurs only in the later stages of loading. Therefore, macroscopic cracking precedes plastic flow, resulting in Nf-R being greater than Nf-P. Conversely, under NLVE stress control, the main mode of fatigue damage for the asphalt sample is dominated by plastic flow deformation, occurring in the middle stages of the test. In this case, Nf-R is smaller than Nf-P. By comparing the DER curve and the G-R constant curve, it becomes evident that different failure criteria significantly affect the determination of asphalt fatigue life. This impact is particularly pronounced in nonlinear viscoelastic stress-controlled fatigue tests. However, in such cases, the evaluation criteria based on dissipated energy ratio and G-R constants do not fail and can still effectively determine the fatigue failure point. This demonstrates that dissipated energy ratio and G-R constants can be used to determine the fatigue failure of asphalt binders under a wider range of stress conditions, exhibiting greater versatility. Meanwhile, criteria based on dissipated energy ratio can be used to evaluate the crack resistance of binder samples subjected to low-stress conditions.
3.3. Applicability Analysis of Dissipated Energy Fatigue Criterion under Variable Stress
3.3.1. Curve of Dissipated Energy Change Rate and G-R Constant Change
Compared to other dissipated energy indicators, both the Dissipated Energy Ratio and G-R constant indicators exhibit a broader range of applicability, allowing them to evaluate the fatigue performance of asphalt binders under stress conditions that extend beyond the linear viscoelastic region. Given that, in the variable stress–time scanning adopted, certain stress amplitudes extend beyond the linear viscoelastic range of asphalt binders, these indicators will be applied to determine the two-stage fatigue life of binder samples in variable stress–time scanning tests, in accordance with the definitions of the dissipated energy ratio and G-R constants.
As depicted in Figure 11, the dissipated energy ratio and G-R constant curves for the Pen70–80 asphalt binder are compared and analyzed under the 150-300 (LVE-NLVE) loading mode. Initially, with the transition from loading mode 150-300-1 to 150-300-4, the number of cycles subjected to the NLVE stress in the second stage progressively decreases. It can be observed that, there is a distinct boundary point between the two stages in the dissipated energy ratio curves. The curves in the first stage do not eventually reach the deviation point, indicating that fatigue failure occurs in the second stage. As the number of cycles of stress application in the second stage decreases, the length of the smooth period in the corresponding dissipated energy ratio curves shortens gradually. The curves become steeper, and the increased data point dispersion leads to greater determination errors of the fatigue failure point. Although there may be some degree of error, using the dissipated energy ratio curve to determine the failure point remains relatively intuitive and applicable in the variable stress–time scanning utilized in this study.
The G-R constant curves in the first stage exhibit a monotonically increasing trend, with only the G-R constant curve of loading mode 150-300-1 showing a peak in the second stage. The G-R constant curves of loading modes 150-300-2 to 150-300-4 in the second stage monotonically decrease, making it impossible to determine the fatigue failure point based on their peak values. It is worth noting that, in loading mode 150-300-1, the second-stage fatigue life of the specimens determined using both the dissipated energy ratio and G-R constant indicators is approximately 540 cycles of loading. This indicates that, in the second stage, characterized by NLVE stress in the variable stress–time scanning, both indicators can still provide reasonably accurate estimates of the specimens’ fatigue life. However, in cases where the second-stage fatigue life of the specimen is relatively short, the G-R constant curve often rapidly declines without reaching a peak, rendering it ineffective as a fatigue criterion. Therefore, for future research encountering situations where the number of stress cycles leading to fatigue failure is limited, it is recommended to use the dissipated energy ratio as the fatigue failure criterion.
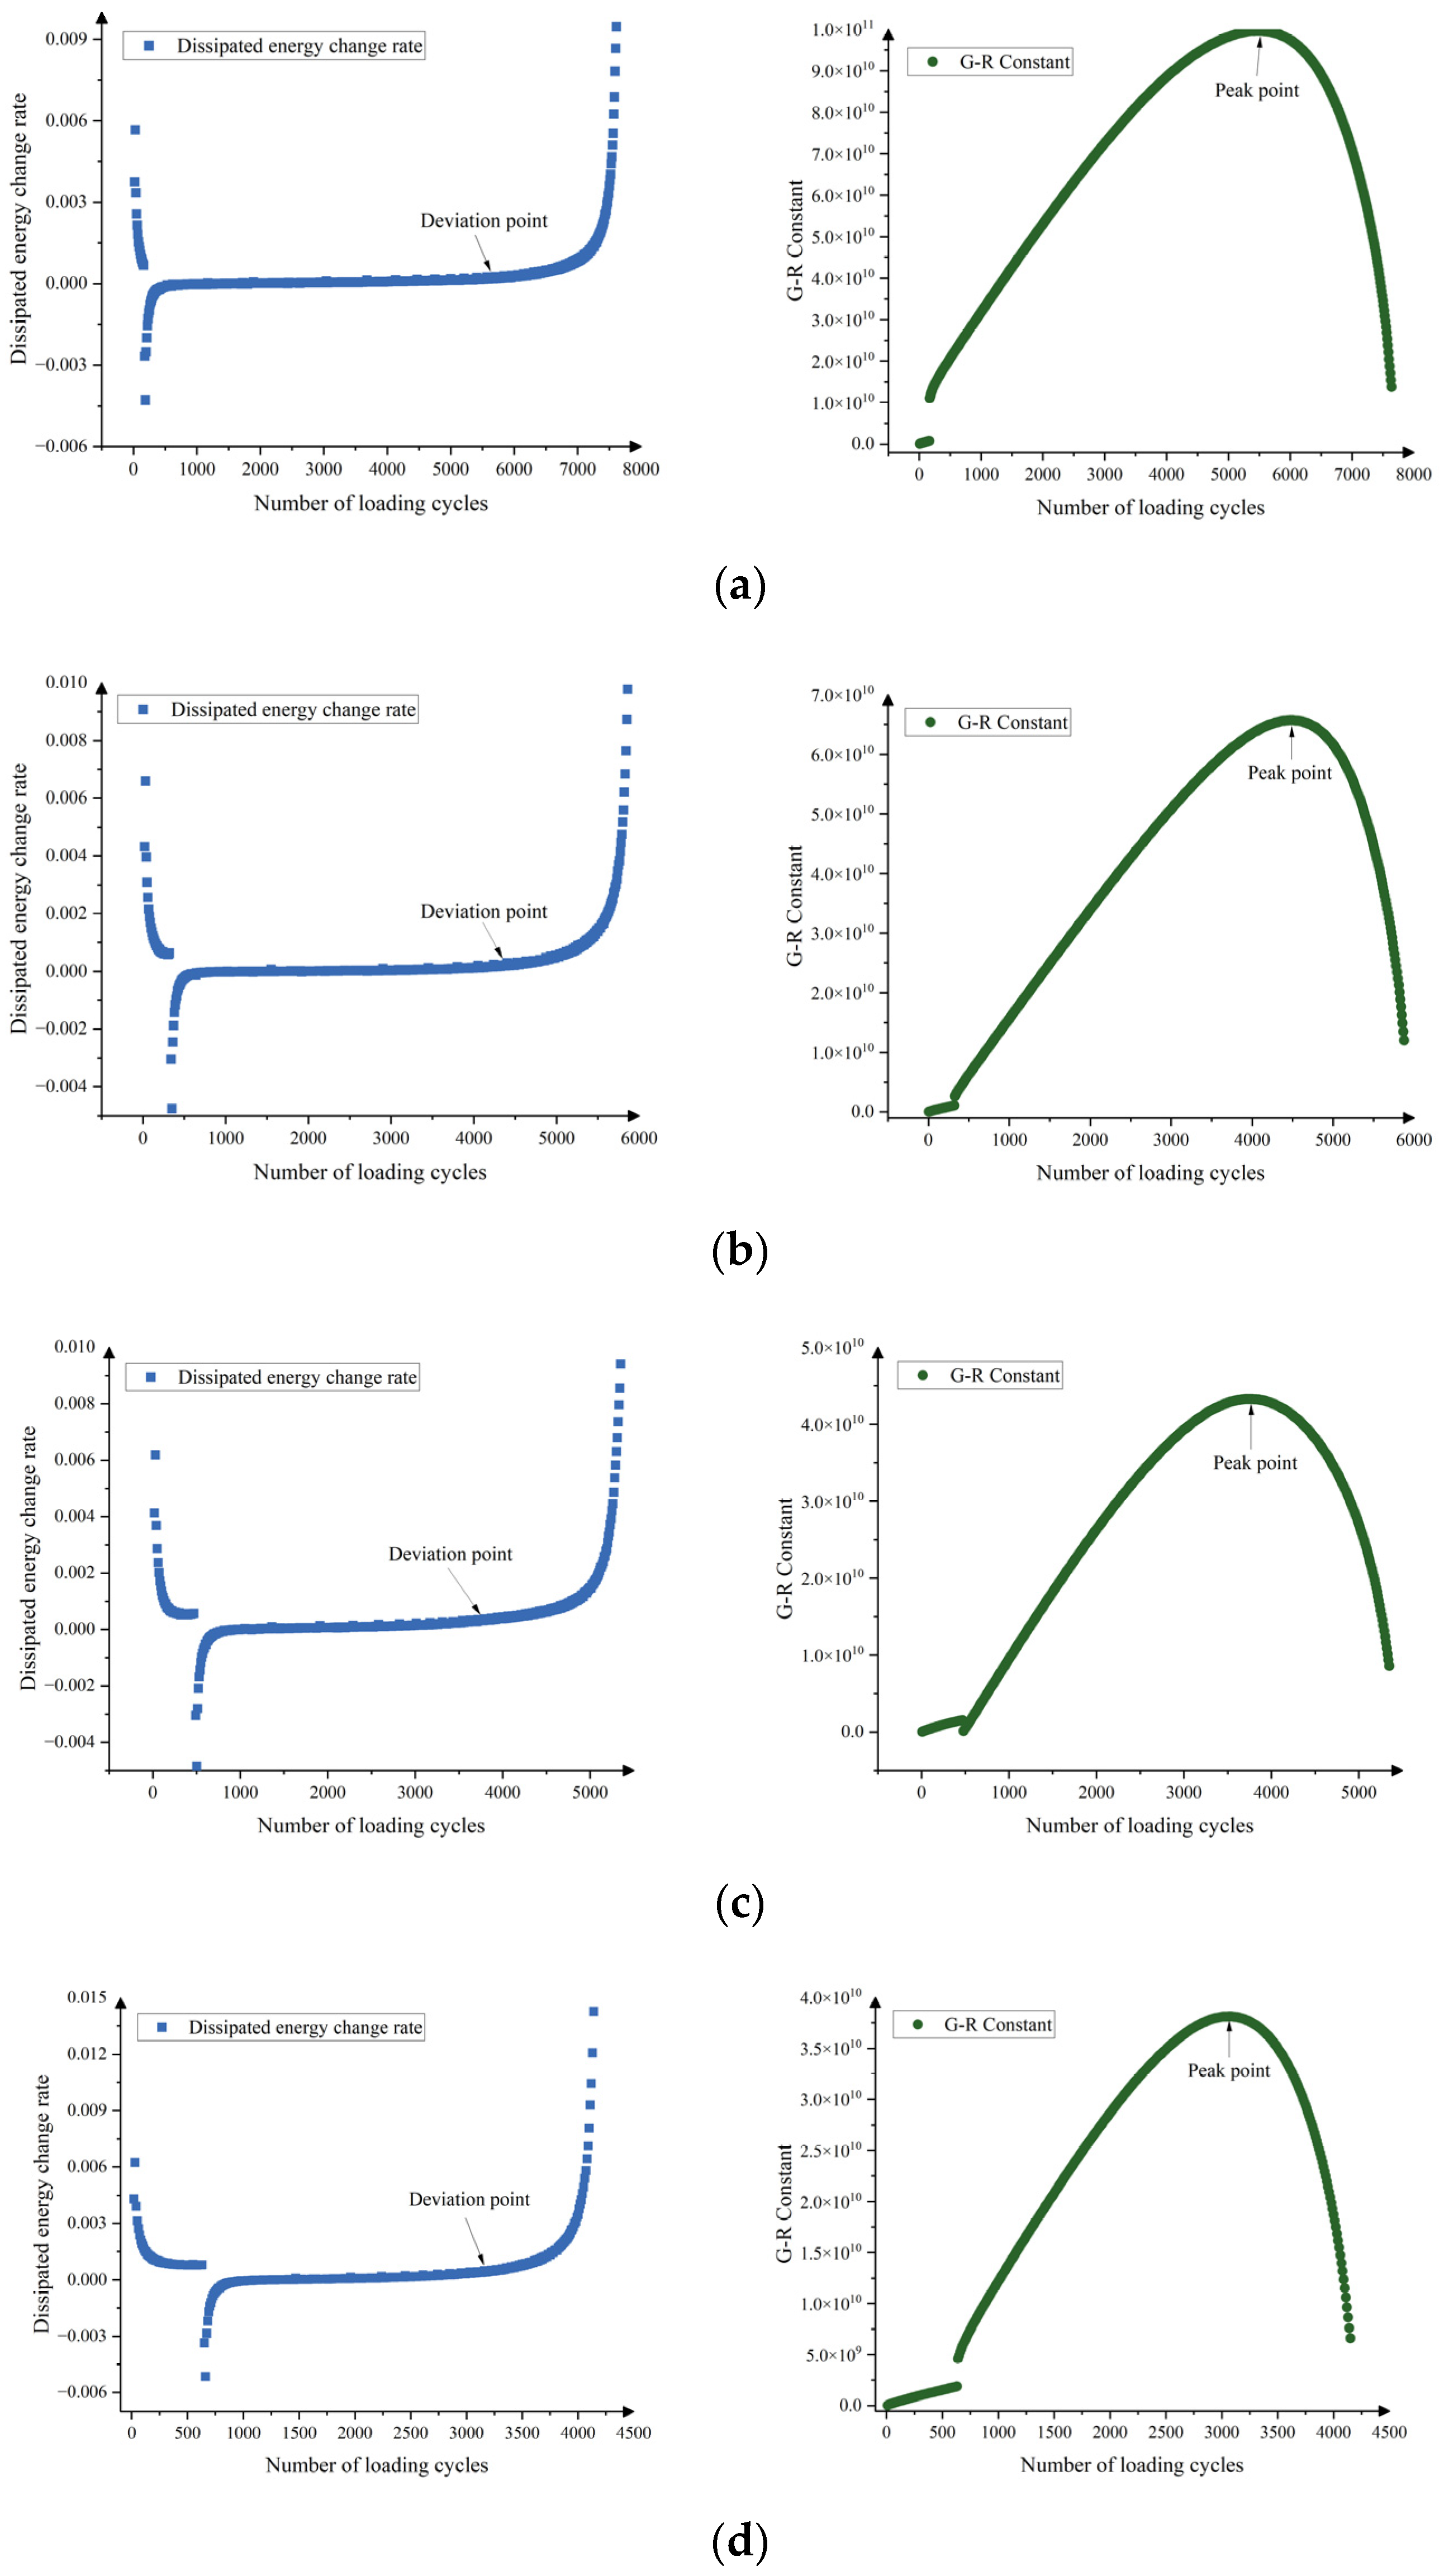
The dissipated energy ratio and G-R constant curves for Pen70–80 asphalt under the 300-150 (NLVE-LVE) loading mode are shown in Figure 12. After the first stage of NLVE stress loading, neither the dissipated energy ratio curve deviates nor does the G-R constant curve reach its peak. The fatigue failure of the specimen also occurs in the second loading stage. As the stress in the second stage is relatively low and falls within the linear viscoelastic region, the curve trends are similar to the fatigue curves obtained under LVE stress alone. Notably, from loading mode 300-150-1 to 300-150-4, observable Dissipated Energy Ratio curve deviation points and G-R constant curve peak points can be identified. Unlike the LVE-NLVE loading mode, the second stage under NLVE-LVE loading mode involves lower stress levels. There are sufficient loading cycles before fatigue failure occurs, allowing the G-R constant curve to reach its peak. Therefore, the same criteria can be used to determine the fatigue life of the specimens.
3.3.2. Applicability Analysis of Various Dissipative Energy Parameters
Based on the dissipated energy ratio and G-R constant curves in Figure 11, the second-stage fatigue life of the specimens in the variable stress fatigue test is determined, and a comparison of the fatigue lives Nf-R and Nf-P obtained by the two criteria for Pen70–80 specimens is presented in Table 4.
In the 150-300 loading mode in Figure 11, the G-R constant curve obtained in the second loading stage does not exhibit a clear peak, and thus, an effective value for Nf-P cannot be determined. Nf-P can only be retrieved when the damage fraction in the first stage is 0.2. In contrast, the Dissipated Energy Ratio curve yields Nf-R values for four loading modes with damage fractions of 0.2, 0.4, 0.6, and 0.8. In the 150-300-1 loading mode, the second-stage fatigue life Nf-R is smaller than Nf-P, which aligns with the pattern observed when 300 kPa stress is applied independently. Due to the limited number of load cycles that the specimen can endure under NLVE stress in the second stage, the difference in fatigue life assessed by the two criteria is minimal.
For the NLVE-LVE fatigue tests with the chosen damage fractions, the fatigue life of the specimens can be determined using both the Dissipated Energy Ratio and G-R constant curves in Figure 12. The calculated two-stage fatigue life data for Pen70–80 specimens in the 300-150 mode are listed in Table 5. A comparison of the two fatigue life results in the table reveals that Nf-R is greater than Nf-P. This is because the second stage involves the application of LVE stress until the specimen’s fatigue failure, and the relationship between the two fatigue life results mirrors that observed when LVE stress is applied independently.
4. Conclusions
In this study, the dissipated energy analysis method was applied to investigate the damage behavior of an asphalt binder in variable amplitude fatigue tests. The energy dissipation characteristics of the binder specimens at different stress levels were analyzed, and the applicability of multiple dissipated energy-based evaluation criteria was assessed. Two criteria, dissipated energy ratio and G-R constant, were used to define fatigue failure of asphalt binder specimens under variable amplitude loading, providing a unified criterion for assessing material damage behavior and fatigue failure regardless of the loading pattern. The following conclusions can be drawn:
Under LVE stress, the first stage of the DE curve represents an undamaged state, where no fatigue damage occurs in the specimen, and energy dissipation remains relatively constant. Consequently, when the complex shear modulus and phase angle curves exhibit noticeable changes, the DE curve appears as a horizontal line, while the CDE curve is a line with a constant slope. This discrepancy reflects that changes in the rheological properties of asphalt specimens are not synchronized with energy dissipation changes, ultimately leading to differences in fatigue failure criteria based on these two indicators.
The specimens experienced fatigue failure in the initial stage of testing. Under LVE stress control, fatigue cracking is the primary mode of damage for the binder sample, with plastic flow deformation occurring only in the later stages of loading. Conversely, under NLVE stress control, the main mode of fatigue damage for the asphalt sample is primarily characterized by plastic flow deformation. However, in reality, the asphalt binder specimens did not completely lose their load-bearing capacity. The test results underestimated the actual fatigue life compared to DER and CDER criteria.
The application of dissipated energy rate and G-R constant indicators to analyze constant and variable amplitude fatigue test results revealed that, under constant stress beyond the linear viscoelastic range, the dissipated energy rate and G-R constants can effectively determine the fatigue failure points of specimens. This indicates that both indicators can be used to determine the fatigue failure of asphalt binder over a wider range of stress levels, demonstrating their greater applicability.
Due to the limited number of NLVE stress cycles the specimens can endure in the second stage, the G-R constant curve fails to reach its peak before failure, which suggests that dissipated energy rate should be preferred as the failure criterion.
In the NLVE-LVE loading mode, the fatigue failure of the specimens similarly occurred in the second loading stage. In this case, the stress in the second stage is relatively low, and the curve trends resemble those of the fatigue curves obtained when LVE stress was applied independently. In each loading mode, clear fatigue failure points were observed in both the dissipated energy rate curve and the G-R constant curve. Therefore, it is recommended to use both indicators simultaneously to determine the fatigue life of the specimens.
Author Contributions
Conceptualization, H.Y.; Methodology, H.Y., Y.D. and N.D.; Validation, Y.D. and G.D.; Formal analysis, G.D.; Investigation, N.D.; Resources, H.Y.; Data curation, N.D.; Writing—original draft, H.Y.; Writing—review & editing, G.D. and N.D.; Supervision, Y.D. and N.D.; Funding acquisition, H.Y. All authors have read and agreed to the published version of the manuscript.
Funding
This research was funded by Natural Science Foundation of China (grant number 52208437), Guangdong Basic and Applied Basic Research Foundation (grant numbers 2022A1515011537, 2022A1515011607, and 2020A1515110900) and the Fundamental Research Funds for the Central Universities (grant number 2022ZYGXZR056).
Data Availability Statement
The data presented in this study are available on request from the corresponding author. The data are not publicly available due to privacy.
Acknowledgments
The authors would like to thank the technicians in the Road laboratories of South China University of Technology for technical support and assistance in experimental activities.
Conflicts of Interest
The authors declare that they have no known competing financial interests or personal relationships that could have appeared to influence the work reported in this paper.
References
- Zhuang, W.; Li, S.; Yu, Q. The effect of supplementary cementitious material systems on dynamic compressive properties of ultra-high performance concrete paste. Constr. Build. Mater. 2022, 321, 126361. [Google Scholar] [CrossRef]
- Yu, H.; Deng, G.; Zhang, Z.; Zhu, M.; Gong, M.; Oeser, M. Workability of rubberized asphalt from a perspective of particle effect. Transp. Res. Part D Transp. Environ. 2021, 91, 102712. [Google Scholar] [CrossRef]
- Shen, S.; Airey, G.D.; Carpenter, S.H.; Huang, H. A dissipated energy approach to fatigue evaluation. Road Mater. Pavement Des. 2006, 7, 47–69. [Google Scholar] [CrossRef]
- Izadifar, M.; Königer, F.; Gerdes, A.; Wöll, C.; Thissen, P. Correlation between Composition and Mechanical Properties of Calcium Silicate Hydrates Identified by Infrared Spectroscopy and Density Functional Theory. J. Phys. Chem. C 2019, 123, 10868–10873. [Google Scholar] [CrossRef]
- Izadifar, M.; Dolado, J.S.; Thissen, P.; Ukrainczyk, N.; Koenders, E.; Ayuela, A. Theoretical Elastic Constants of Tobermorite Enhanced with Reduced Graphene Oxide through Hydroxyl vs. Epoxy Functionalization: A First-Principles Study. J. Phys. Chem. C 2023, 127, 18117–18126. [Google Scholar] [CrossRef]
- Yu, H.; Zhu, Z.; Leng, Z.; Wu, C.; Zhang, Z.; Wang, D.; Oeser, M. Effect of mixing sequence on asphalt mixtures containing waste tire rubber and warm mix surfactants. J. Clean. Prod. 2020, 246, 119008. [Google Scholar] [CrossRef]
- Yu, H.; Leng, Z.; Zhou, Z.; Shih, K.; Xiao, F.; Gao, Z. Optimization of preparation procedure of liquid warm mix additive modified asphalt rubber. J. Clean. Prod. 2017, 141, 336–345. [Google Scholar] [CrossRef]
- Liu, S.; Jin, J.; Yu, H.; Qian, G.; Zhang, B.; Shi, J.; Gao, Y. Promotional effect of shaped coal gangue composite phase change agents doping in asphalt on pavement properties. Constr. Build. Mater. 2024, 411, 134447. [Google Scholar] [CrossRef]
- Jin, J.; Gao, Y.; Wu, Y.; Liu, S.; Liu, R.; Wei, H.; Qian, G.; Zheng, J. Rheological and adhesion properties of nano-organic palygorskite and linear SBS on the composite modified asphalt. Powder Technol. 2021, 377, 212–221. [Google Scholar] [CrossRef]
- Jamshidi, A.; Hamzah, M.O.; Shahadan, Z.; Yahaya, A.S. Evaluation of the rheological properties and activation energy of virgin and recovered asphalt binder blends. J. Mater. Civ. Eng. 2015, 27, 04014135. [Google Scholar] [CrossRef]
- Shen, S.; Sutharsan, T. Quantification of cohesive healing of asphalt binder and its impact factors based on dissipated energy analysis. Road Mater. Pavement Des. 2011, 12, 525–546. [Google Scholar] [CrossRef]
- Wang, T.; Li, M.; Cai, X.; Cheng, Z.; Zhang, D.; Sun, G. Multi-objective design optimization of composite polymerized asphalt emulsions for cold patching of pavement potholes. Mater. Today Commun. 2023, 35, 105751. [Google Scholar] [CrossRef]
- Santagata, E.; Baglieri, O.; Dalmazzo, D.; Tsantilis, L. Investigating cohesive healing of asphalt binders by means of a dissipated energy approach. Int. J. Pavement Res. Technol. 2017, 10, 403–409. [Google Scholar] [CrossRef]
- Ameri, M.; Seif, M.; Abbasi, M.; Molayem, M.; KhavandiKhiavi, A. Fatigue performance evaluation of modified asphalt binder using of dissipated energy approach. Constr. Build. Mater. 2017, 136, 184–191. [Google Scholar] [CrossRef]
- Ashish, P.K.; Singh, D.; Jain, R. Evaluating the effect of carbon nanotube on low temperature property of asphalt binder through dissipated energy–based approach. J. Mater. Civ. Eng. 2020, 32, 04019376. [Google Scholar] [CrossRef]
- Mohamed, A.S.; Cao, Z.; Xu, X.; Xiao, F.; Abdel-Wahed, T. Bonding, rheological, and physiochemical characteristics of reclaimed asphalt rejuvenated by crumb rubber modified binder. J. Clean. Prod. 2022, 373, 133896. [Google Scholar] [CrossRef]
- Al-Haddad, A.H. Fatigue evaluation of Iraqi asphalt binders based on the dissipated energy and viscoelastic continuum damage (VECD) approaches. J. Civ. Eng. Constr. Technol. 2015, 6, 27–50. [Google Scholar]
- Ameri, M.; Mansourkhaki, A.; Daryaee, D. Evaluation of fatigue behavior of asphalt binders containing reclaimed asphalt binder using simplified viscoelastic continuum damage approach. Constr. Build. Mater. 2019, 202, 374–386. [Google Scholar] [CrossRef]
- Wang, T.; Weng, Y.; Cai, X.; Li, J.; Xiao, F.; Sun, G.; Zhang, F. Statistical modeling of low-temperature properties and FTIR spectra of crumb rubber modified asphalts considering SARA fractions. J. Clean. Prod. 2022, 374, 134016. [Google Scholar] [CrossRef]
- Farrar, M.J.; Kim, S.-S.; Pauli, T.; Planche, J.P. An advanced low temperature rheological and fracture test method for bitumen purchase specifications and pavement performance prediction: 4-mm DSR/ABCD. In Proceedings of the 8th RILEM International Symposium on Testing and Characterization of Sustainable and Innovative Bituminous Materials; Springer: Dordrecht, The Netherlands, 2015; pp. 25–36. [Google Scholar]
- Van Dijk, W. Practical Fatigue Characterization of Bituminous Mixes; Shell International Petroleum Company Limited: London, UK, 1975. [Google Scholar]
- Kim, Y.-R.; Little, D.; Lytton, R. Fatigue and healing characterization of asphalt mixtures. J. Mater. Civ. Eng. 2003, 15, 75–83. [Google Scholar] [CrossRef]
- Hopman, P.; Kunst, P.; Pronk, A. A renewed interpretation method for fatigue measurements-verification of Miner’s rule. In Proceedings of the 4th Eurobitume Symposium, Madrid, Spain, 4–6 October 1989; pp. 557–561. [Google Scholar]
- Ghuzlan, K.A.; Carpenter, S.H. Energy-derived, damage-based failure criterion for fatigue testing. Transp. Res. Rec. 2000, 1723, 141–149. [Google Scholar] [CrossRef]
- Rowe, G.; King, G.; Anderson, M. The influence of binder rheology on the cracking of asphalt mixes in airport and highway projects. J. Test. Eval. 2014, 42, 1063–1072. [Google Scholar] [CrossRef]
- Glover, C.J.; Davison, R.R.; Domke, C.H.; Ruan, Y.; Juristyarini, P.; Knorr, D.B. Development of a New Method for Assessing Asphalt Binder Performance Durability; Federal Highway Administration Report TX-02/1872-1; Federal Highway Administration: Washington, DC, USA, 2001. [Google Scholar]
- Wang, T.; Dra, Y.A.S.S.; Cai, X.; Cheng, Z.; Zhang, D.; Lin, Y.; Yu, H. Advanced cold patching materials (CPMs) for asphalt pavement pothole rehabilitation: State of the art. J. Clean. Prod. 2022, 366, 133001. [Google Scholar] [CrossRef]
- Chen, H.; Zhang, Y.; Bahia, H.U. The role of binders in mixture cracking resistance measured by ideal-CT test. Int. J. Fatigue 2021, 142, 105947. [Google Scholar] [CrossRef]
- Liu, Z.; Wu, W.; Gu, X.; Li, S.; Wang, L.; Zhang, T. Application of combining YOLO models and 3D GPR images in road detection and maintenance. Remote Sens. 2021, 13, 1081. [Google Scholar] [CrossRef]
- ASTM D7175-15; Standard Test Method for Determining the Rheological Properties of Asphalt Binder Using a Dynamic Shear Rheometer. ASTM International: West Conshohocken, PA, USA, 2015.
- Zhang, Y.; Gao, Y. Predicting crack growth in viscoelastic bitumen under a rotational shear fatigue load. Road Mater. Pavement Des. 2021, 22, 603–622. [Google Scholar] [CrossRef]
- Pronk, A. Comparison of 2 and 4 point fatigue tests and healing in 4 point dynamic bending test based on the dissipated energy concept. In Proceedings of the Eighth International Conference on Asphalt PavementsFederal Highway Administration, Seattle, WA, USA, 10–14 August 1997. [Google Scholar]
- Planche, J.-P.; Anderson, D.; Gauthier, G.; Le Hir, Y.; Martin, D. Evaluation of fatigue properties of bituminous binders. Mater. Struct. 2004, 37, 356–359. [Google Scholar] [CrossRef]
- Zhang, Z.; Oeser, M. Energy dissipation and rheological property degradation of asphalt binder under repeated shearing with different oscillation amplitudes. Int. J. Fatigue 2021, 152, 106417. [Google Scholar] [CrossRef]
- Shen, S.; Lu, X. Energy Based Laboratory Fatigue Failure Criteria for Asphalt Materials; ASTM International: West Conshohocken, PA, USA, 2011. [Google Scholar]
- Rowe, G.M.; Bouldin, M.G. Improved techniques to evaluate the fatigue resistance of asphaltic mixtures. In Proceedings of the 2nd Eurasphalt & Eurobitume Congress, Barcelona, Spain, 20–22 September 2000. [Google Scholar]
- Liu, H.; Luo, R. Development of failure criterion and fatigue model to characterize the fatigue resistance of asphalt binders under controlled-stress time sweep tests. Mater. Struct. 2019, 53, 5. [Google Scholar] [CrossRef]
- Kommidi, S.R.; Kim, Y.-R.; de Rezende, L.R. Fatigue characterization of binder with aging in two length scales: Sand asphalt mortar and parallel plate binder film. Constr. Build. Mater. 2020, 237, 117588. [Google Scholar] [CrossRef]
Figure 1.
Rheological property curve and dissipated energy curve of Pen70–80 asphalt under 150 kPa stress.
Figure 1.
Rheological property curve and dissipated energy curve of Pen70–80 asphalt under 150 kPa stress.
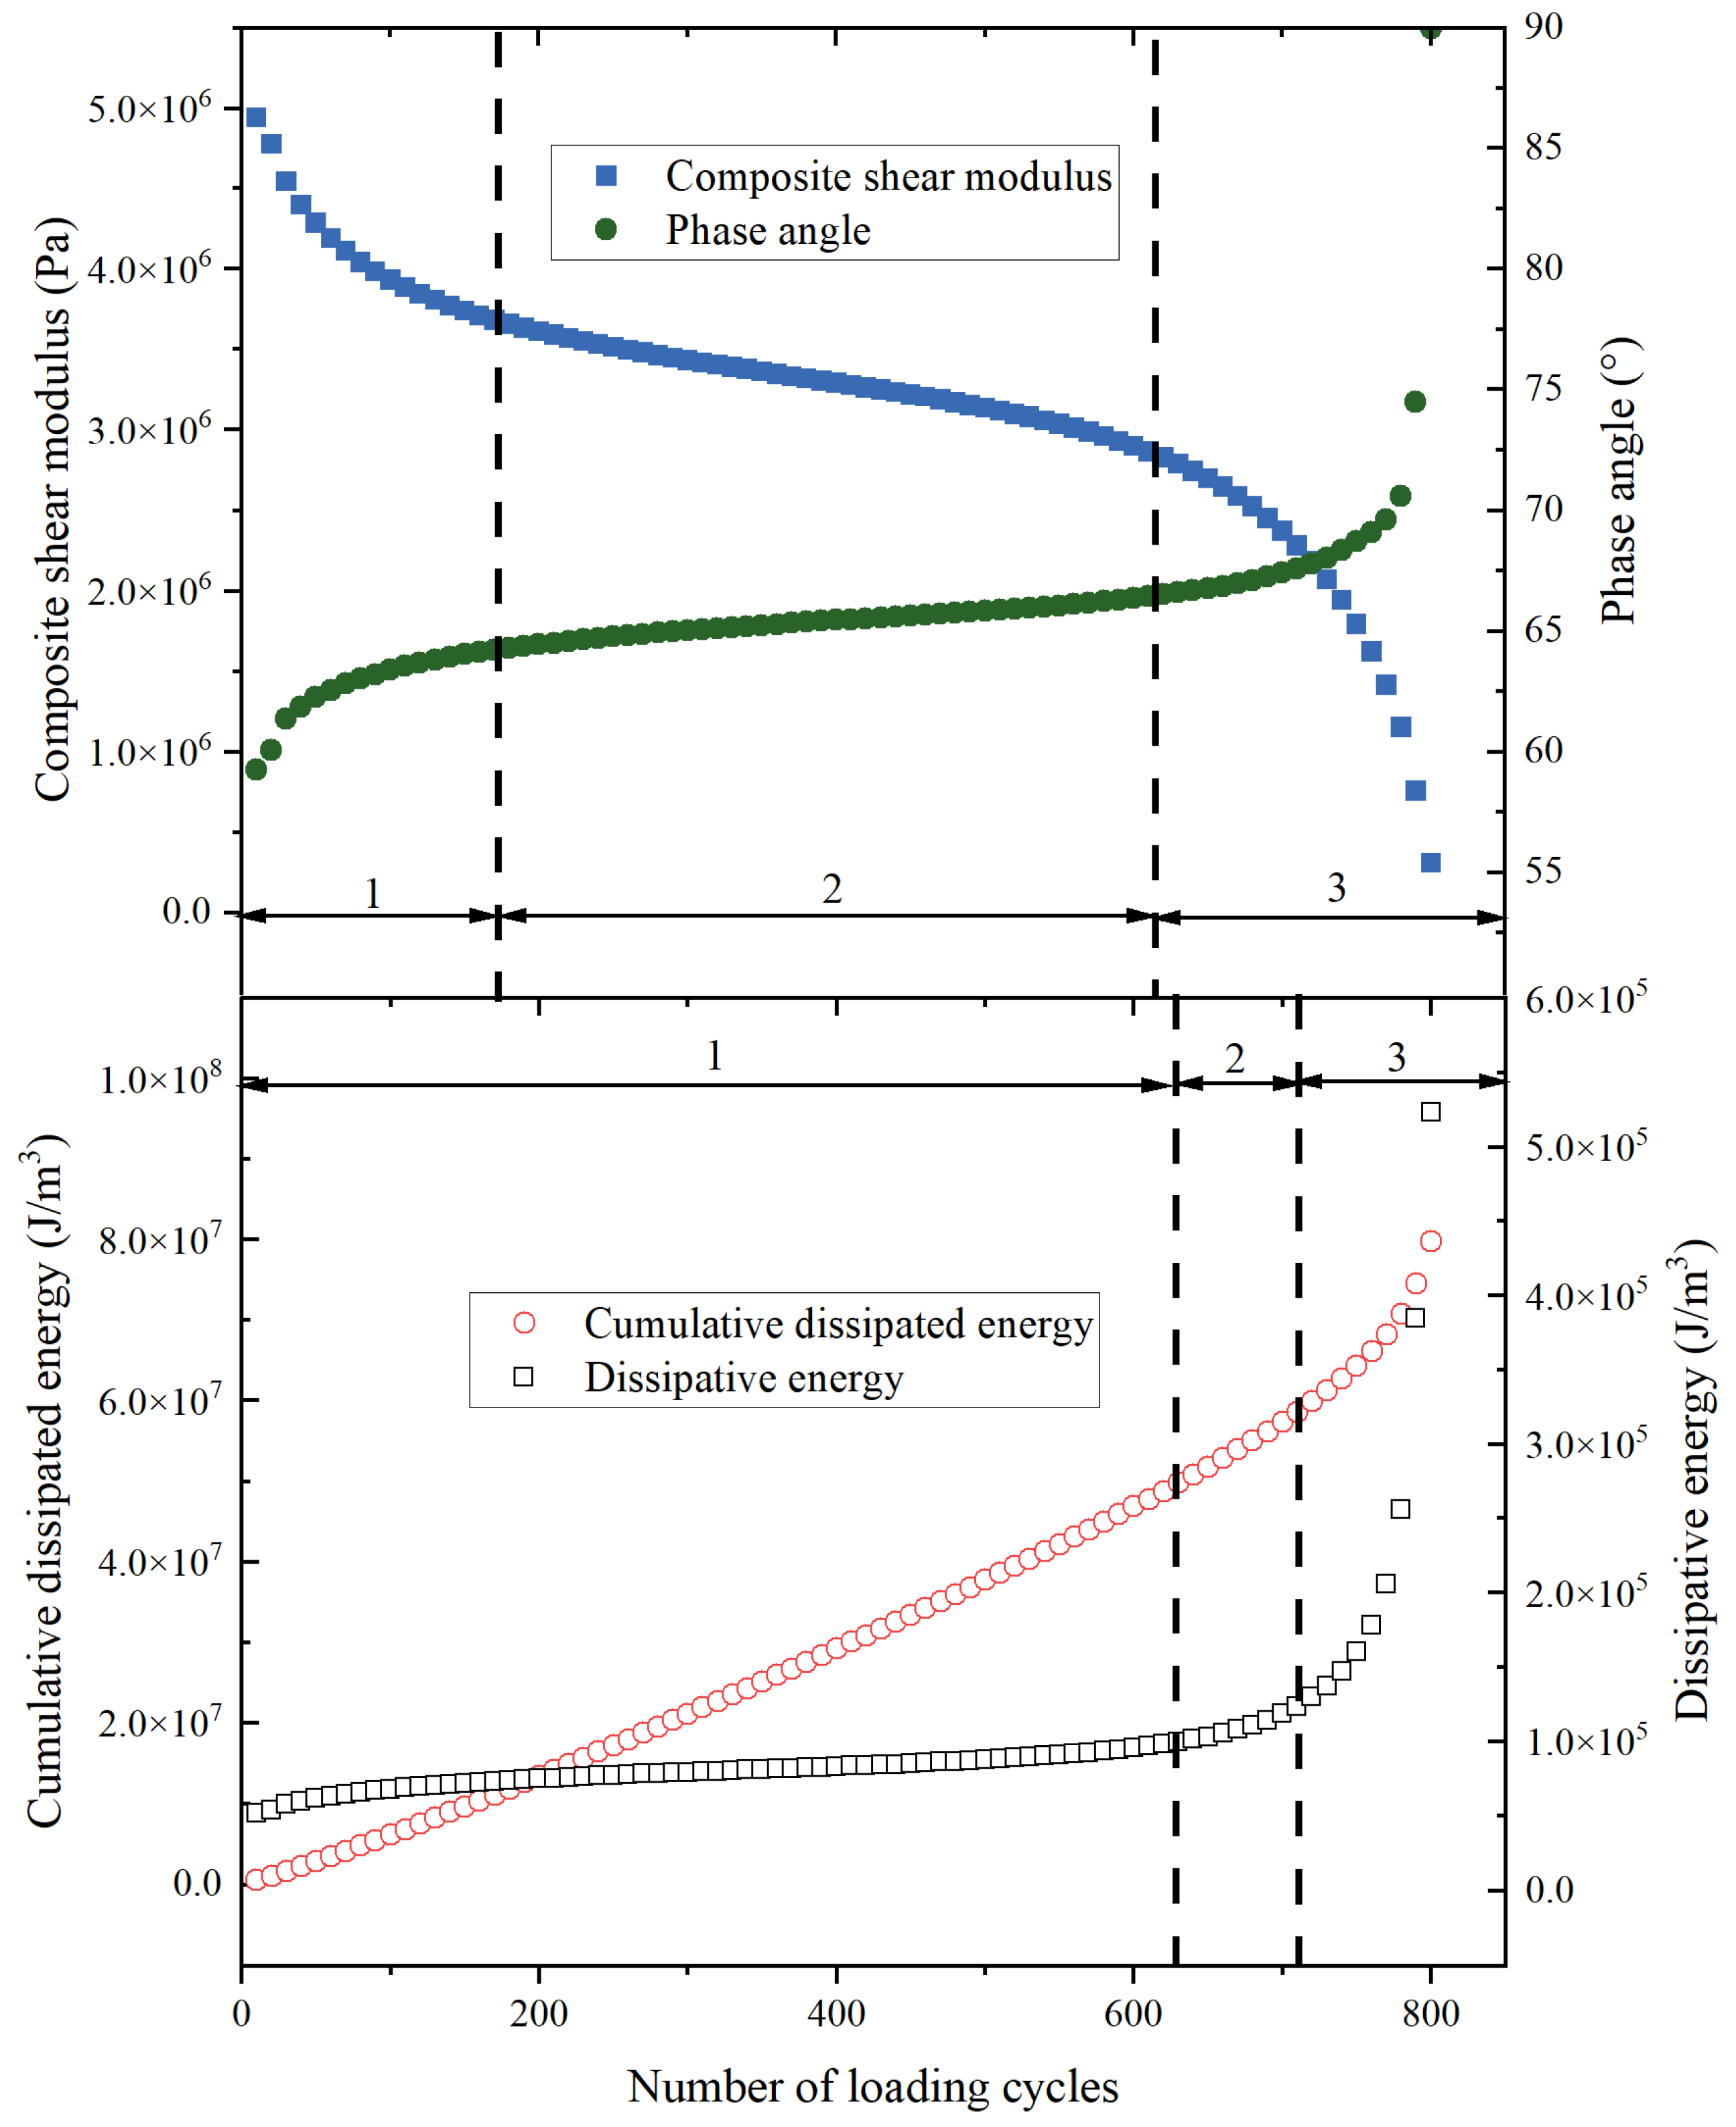
Figure 2.
Rheological property curve and dissipated energy curve of Pen70–80 asphalt under 300 kPa stress.
Figure 2.
Rheological property curve and dissipated energy curve of Pen70–80 asphalt under 300 kPa stress.
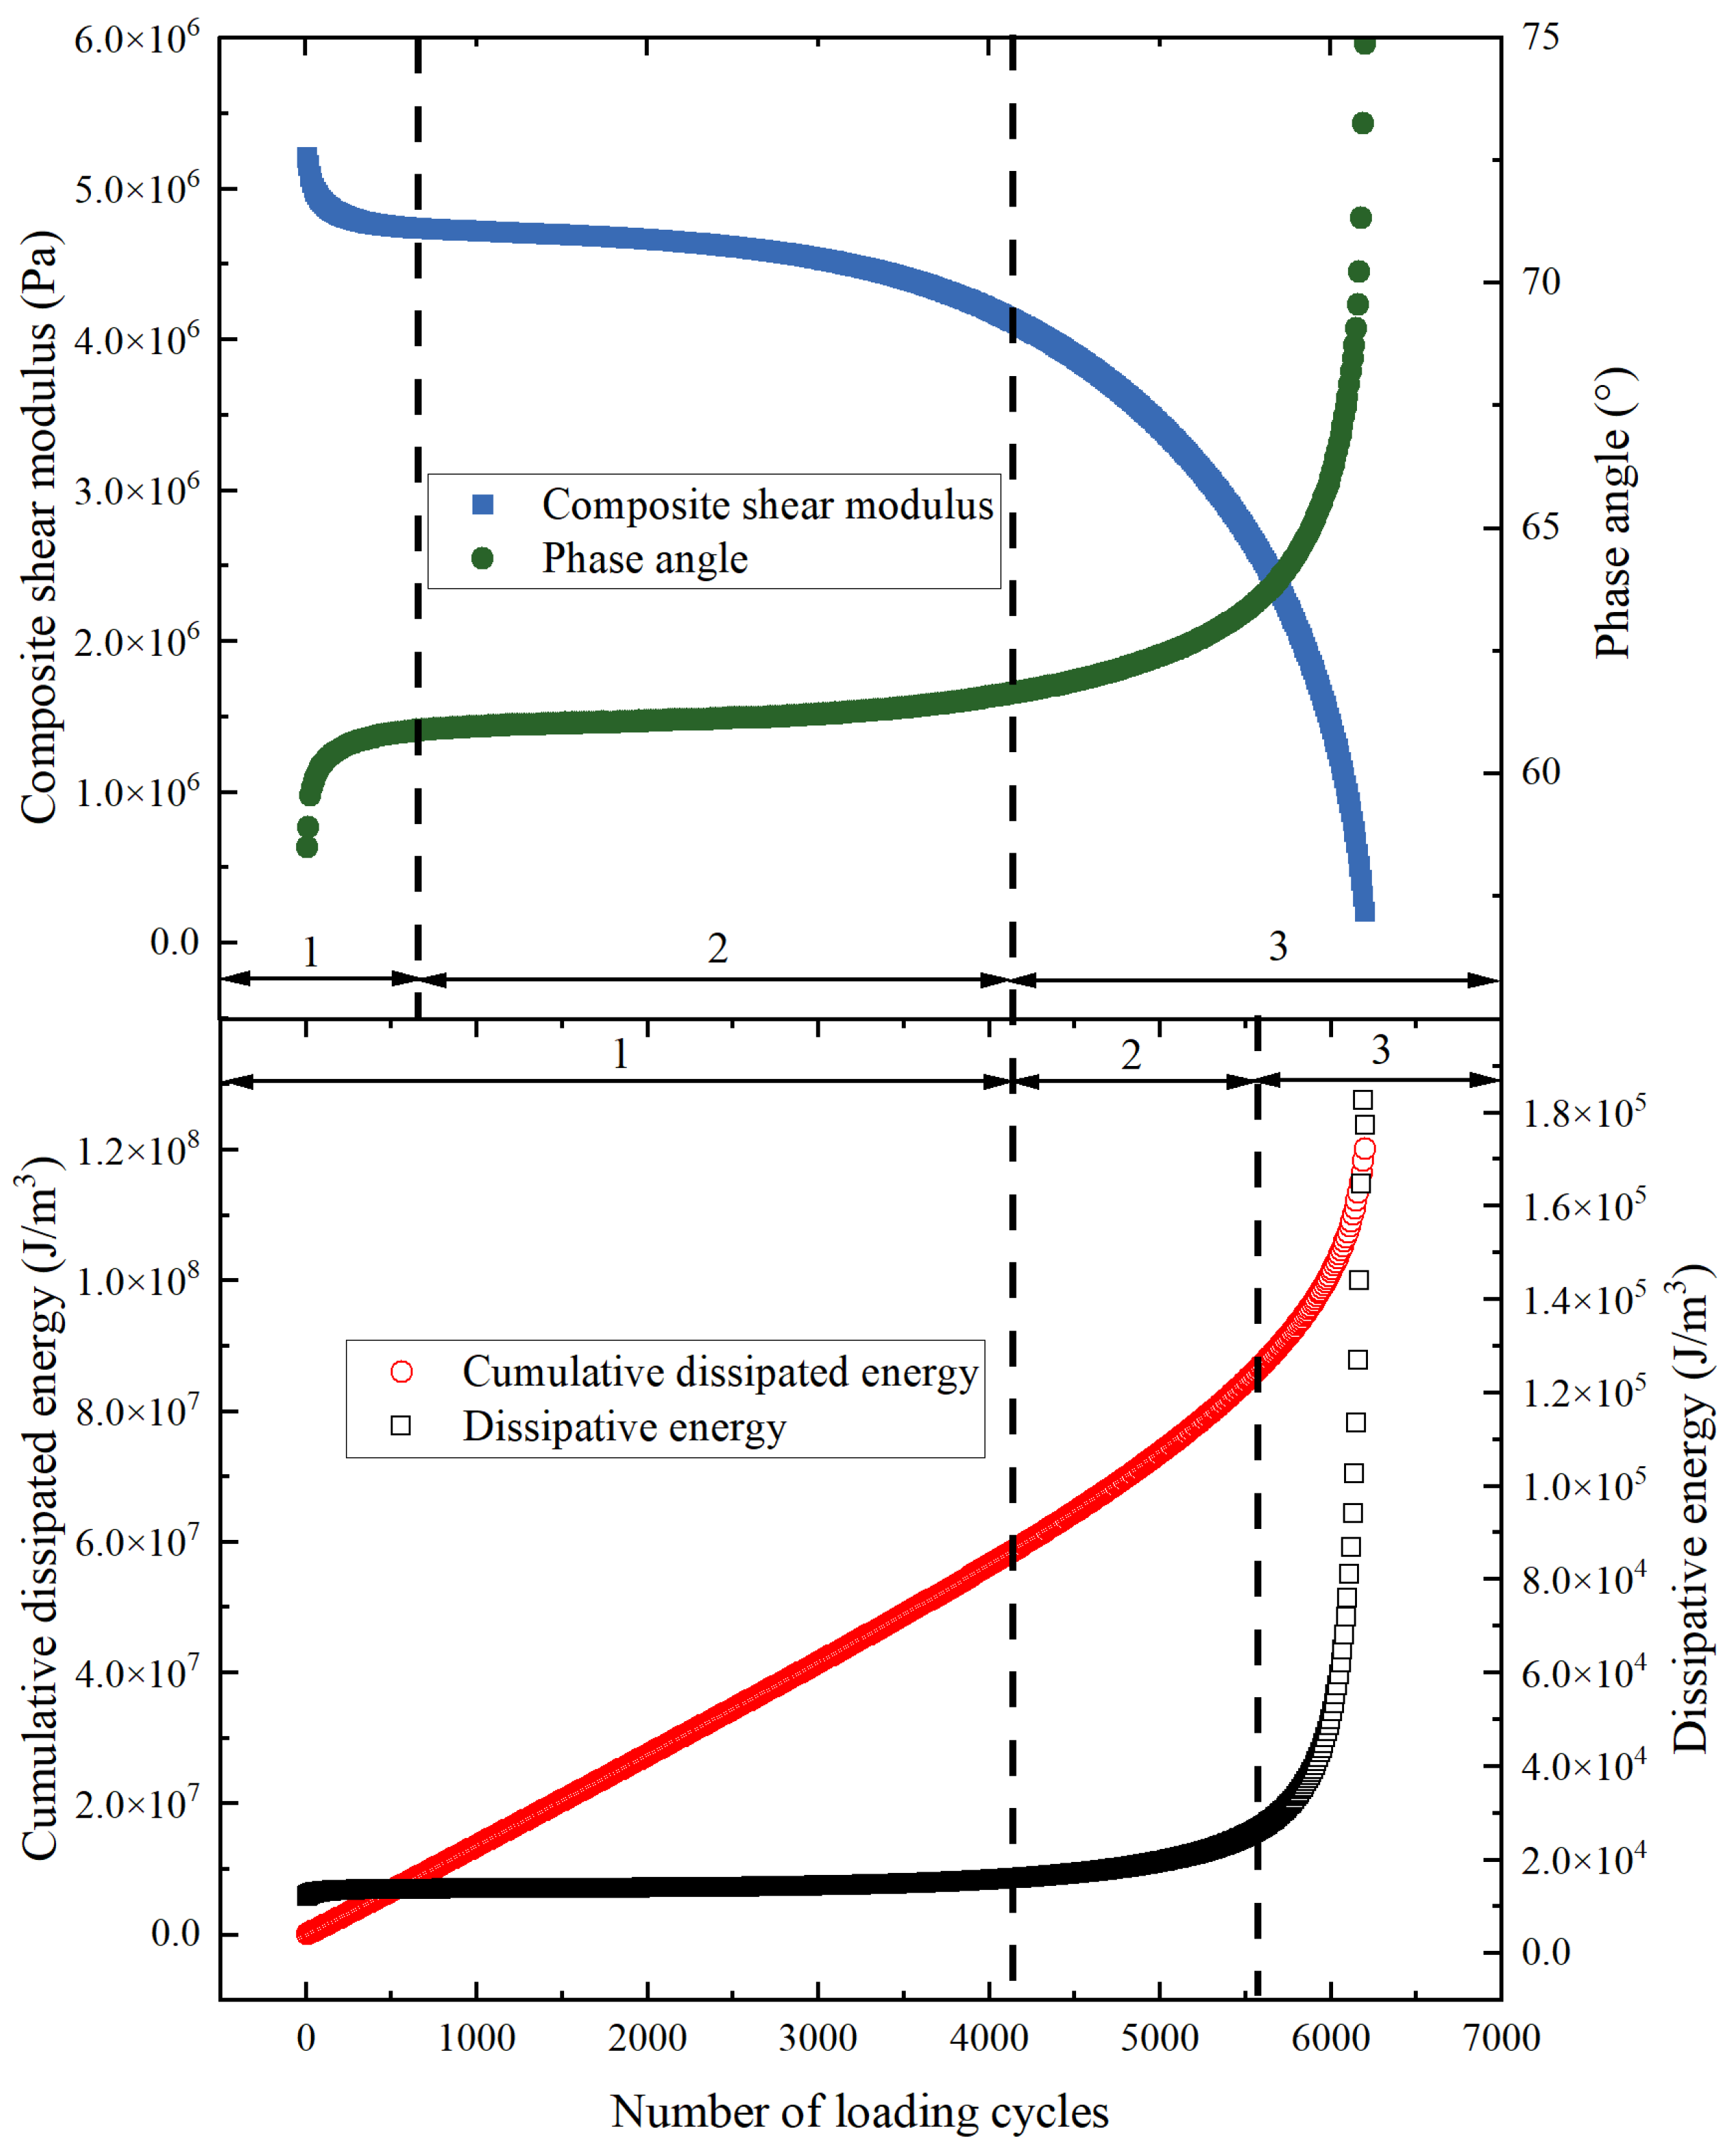
Figure 3.
Energy dissipation curve and rheological performance curve of Pen70–80 asphalt. (a) 100 kPa; (b) 400 kPa.
Figure 3.
Energy dissipation curve and rheological performance curve of Pen70–80 asphalt. (a) 100 kPa; (b) 400 kPa.
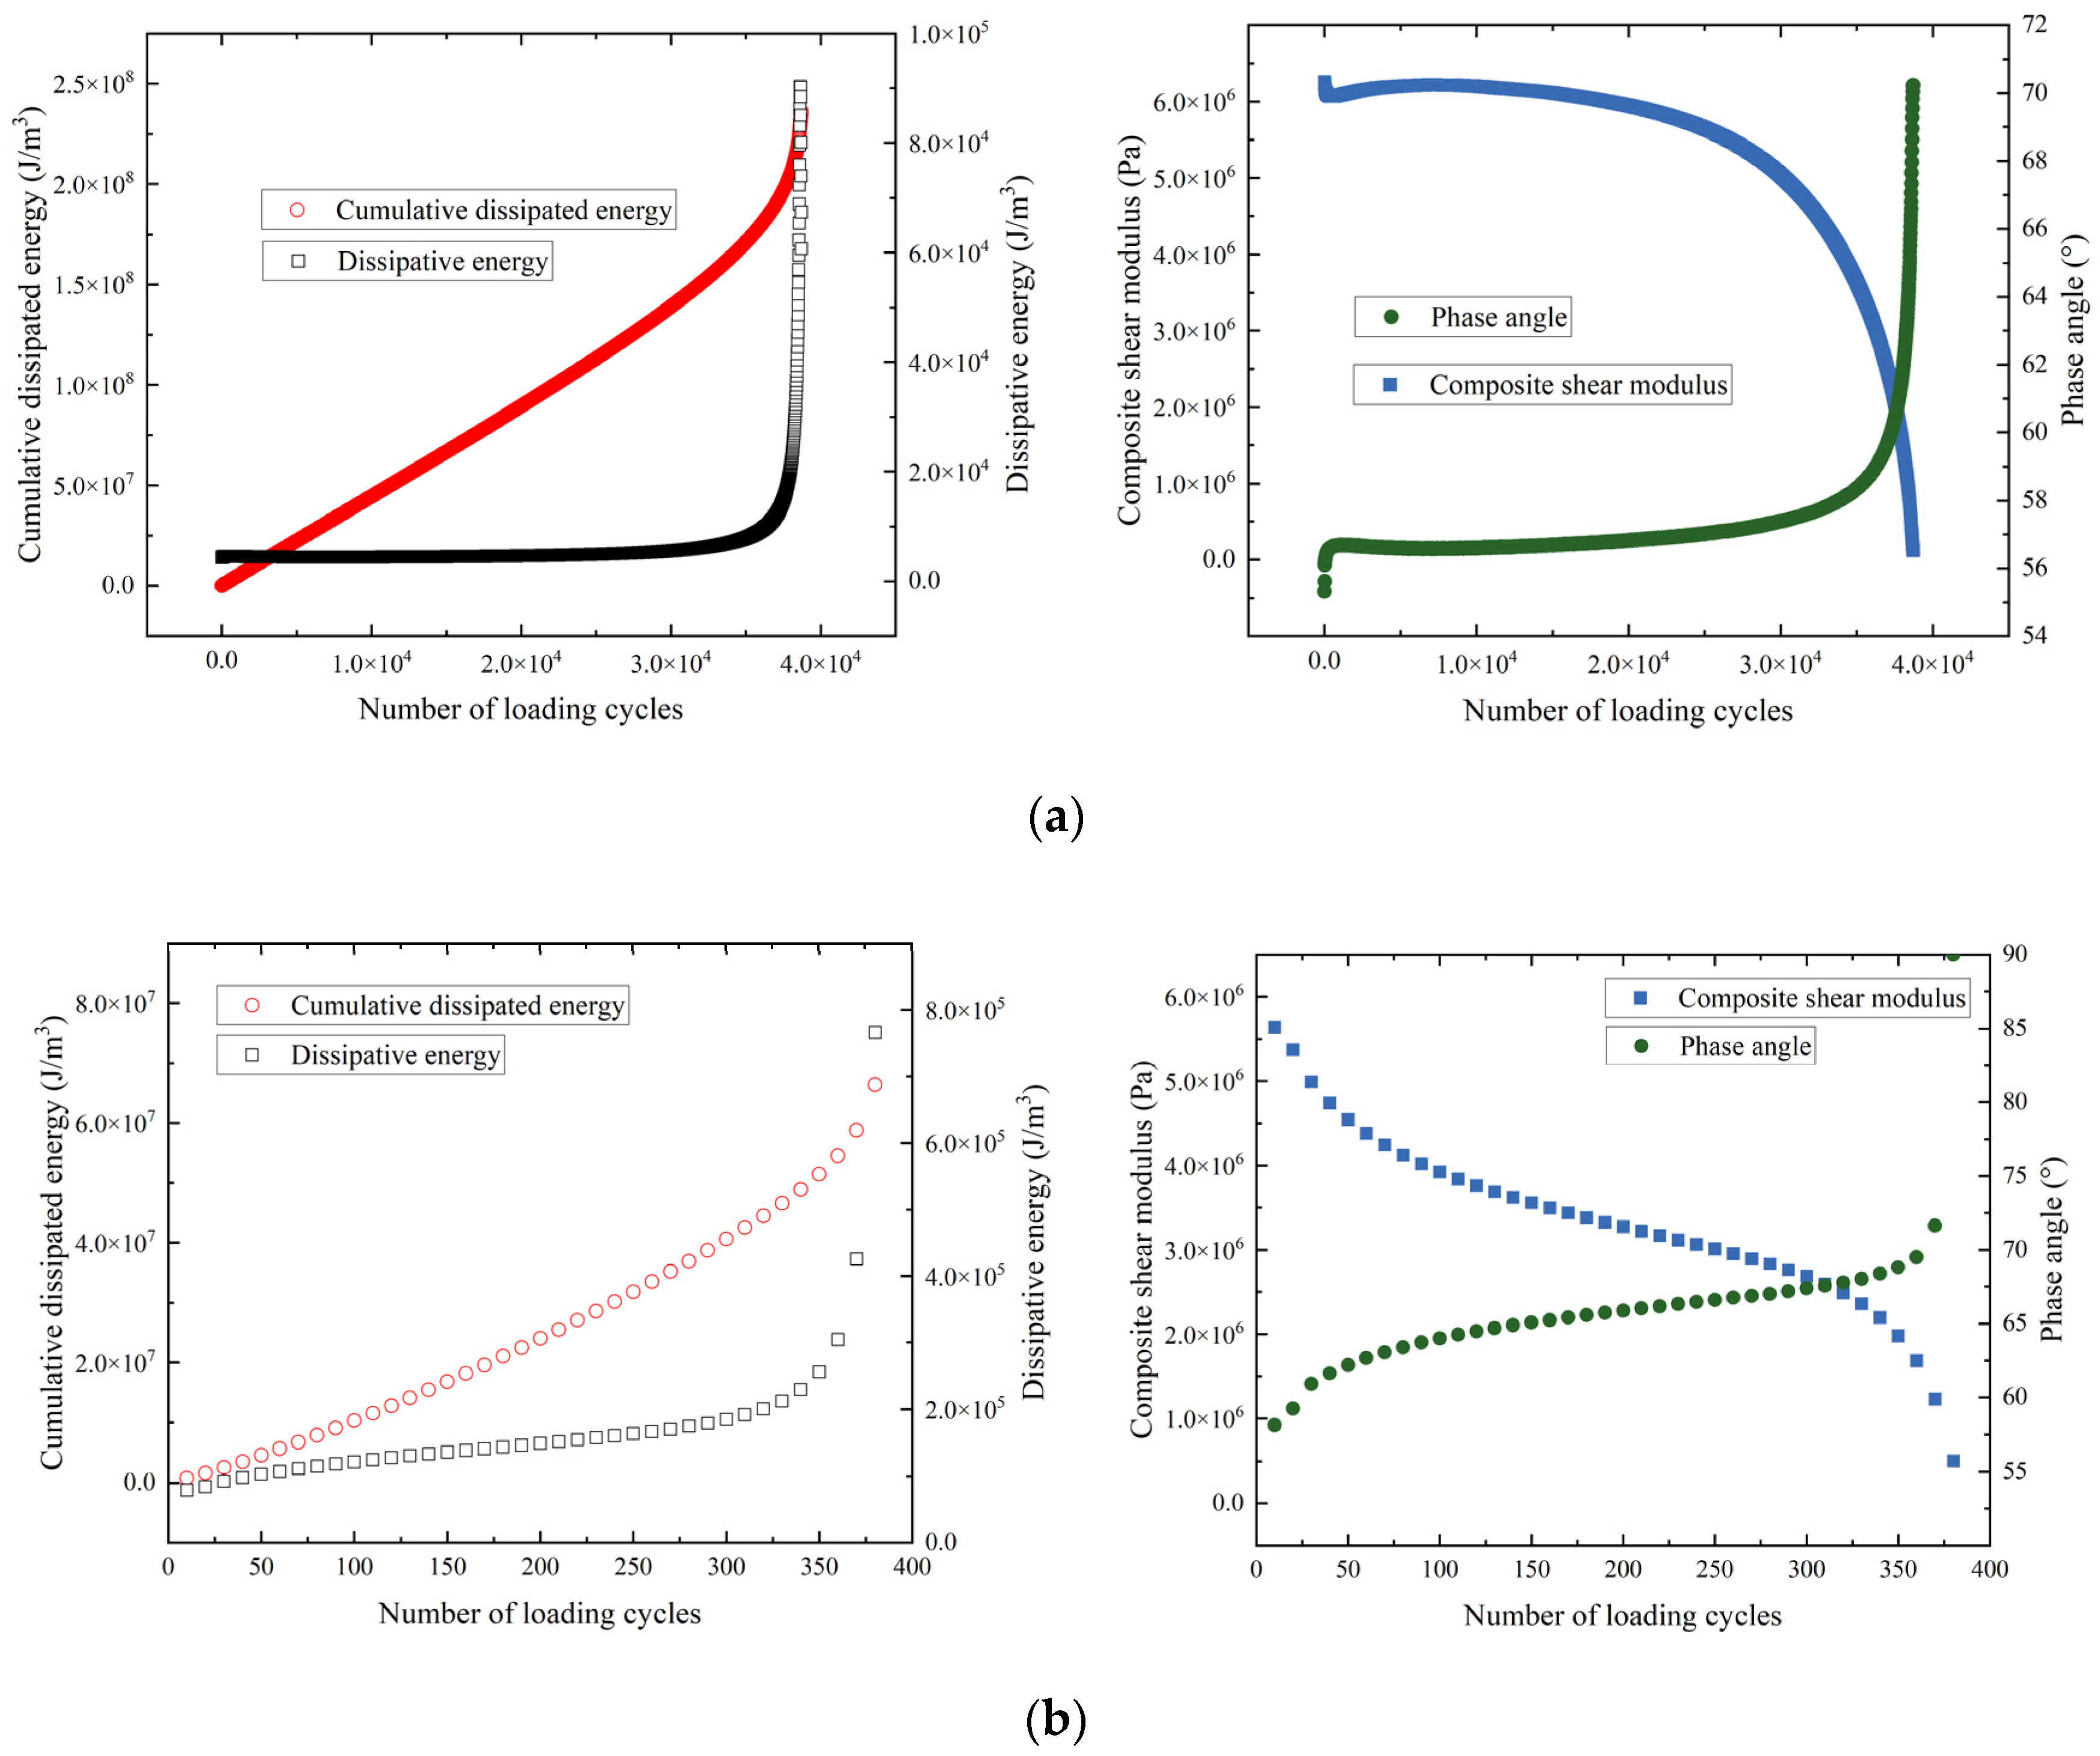
Figure 4.
Energy dissipation curve and rheological performance curve of Pen60–70 asphalt. (a) 100 kPa; (b) 500 kPa.
Figure 4.
Energy dissipation curve and rheological performance curve of Pen60–70 asphalt. (a) 100 kPa; (b) 500 kPa.

Figure 5.
Energy dissipation curve and rheological performance curve of SBS modified asphalt. (a) 200 kPa; (b) 300 kPa.
Figure 5.
Energy dissipation curve and rheological performance curve of SBS modified asphalt. (a) 200 kPa; (b) 300 kPa.
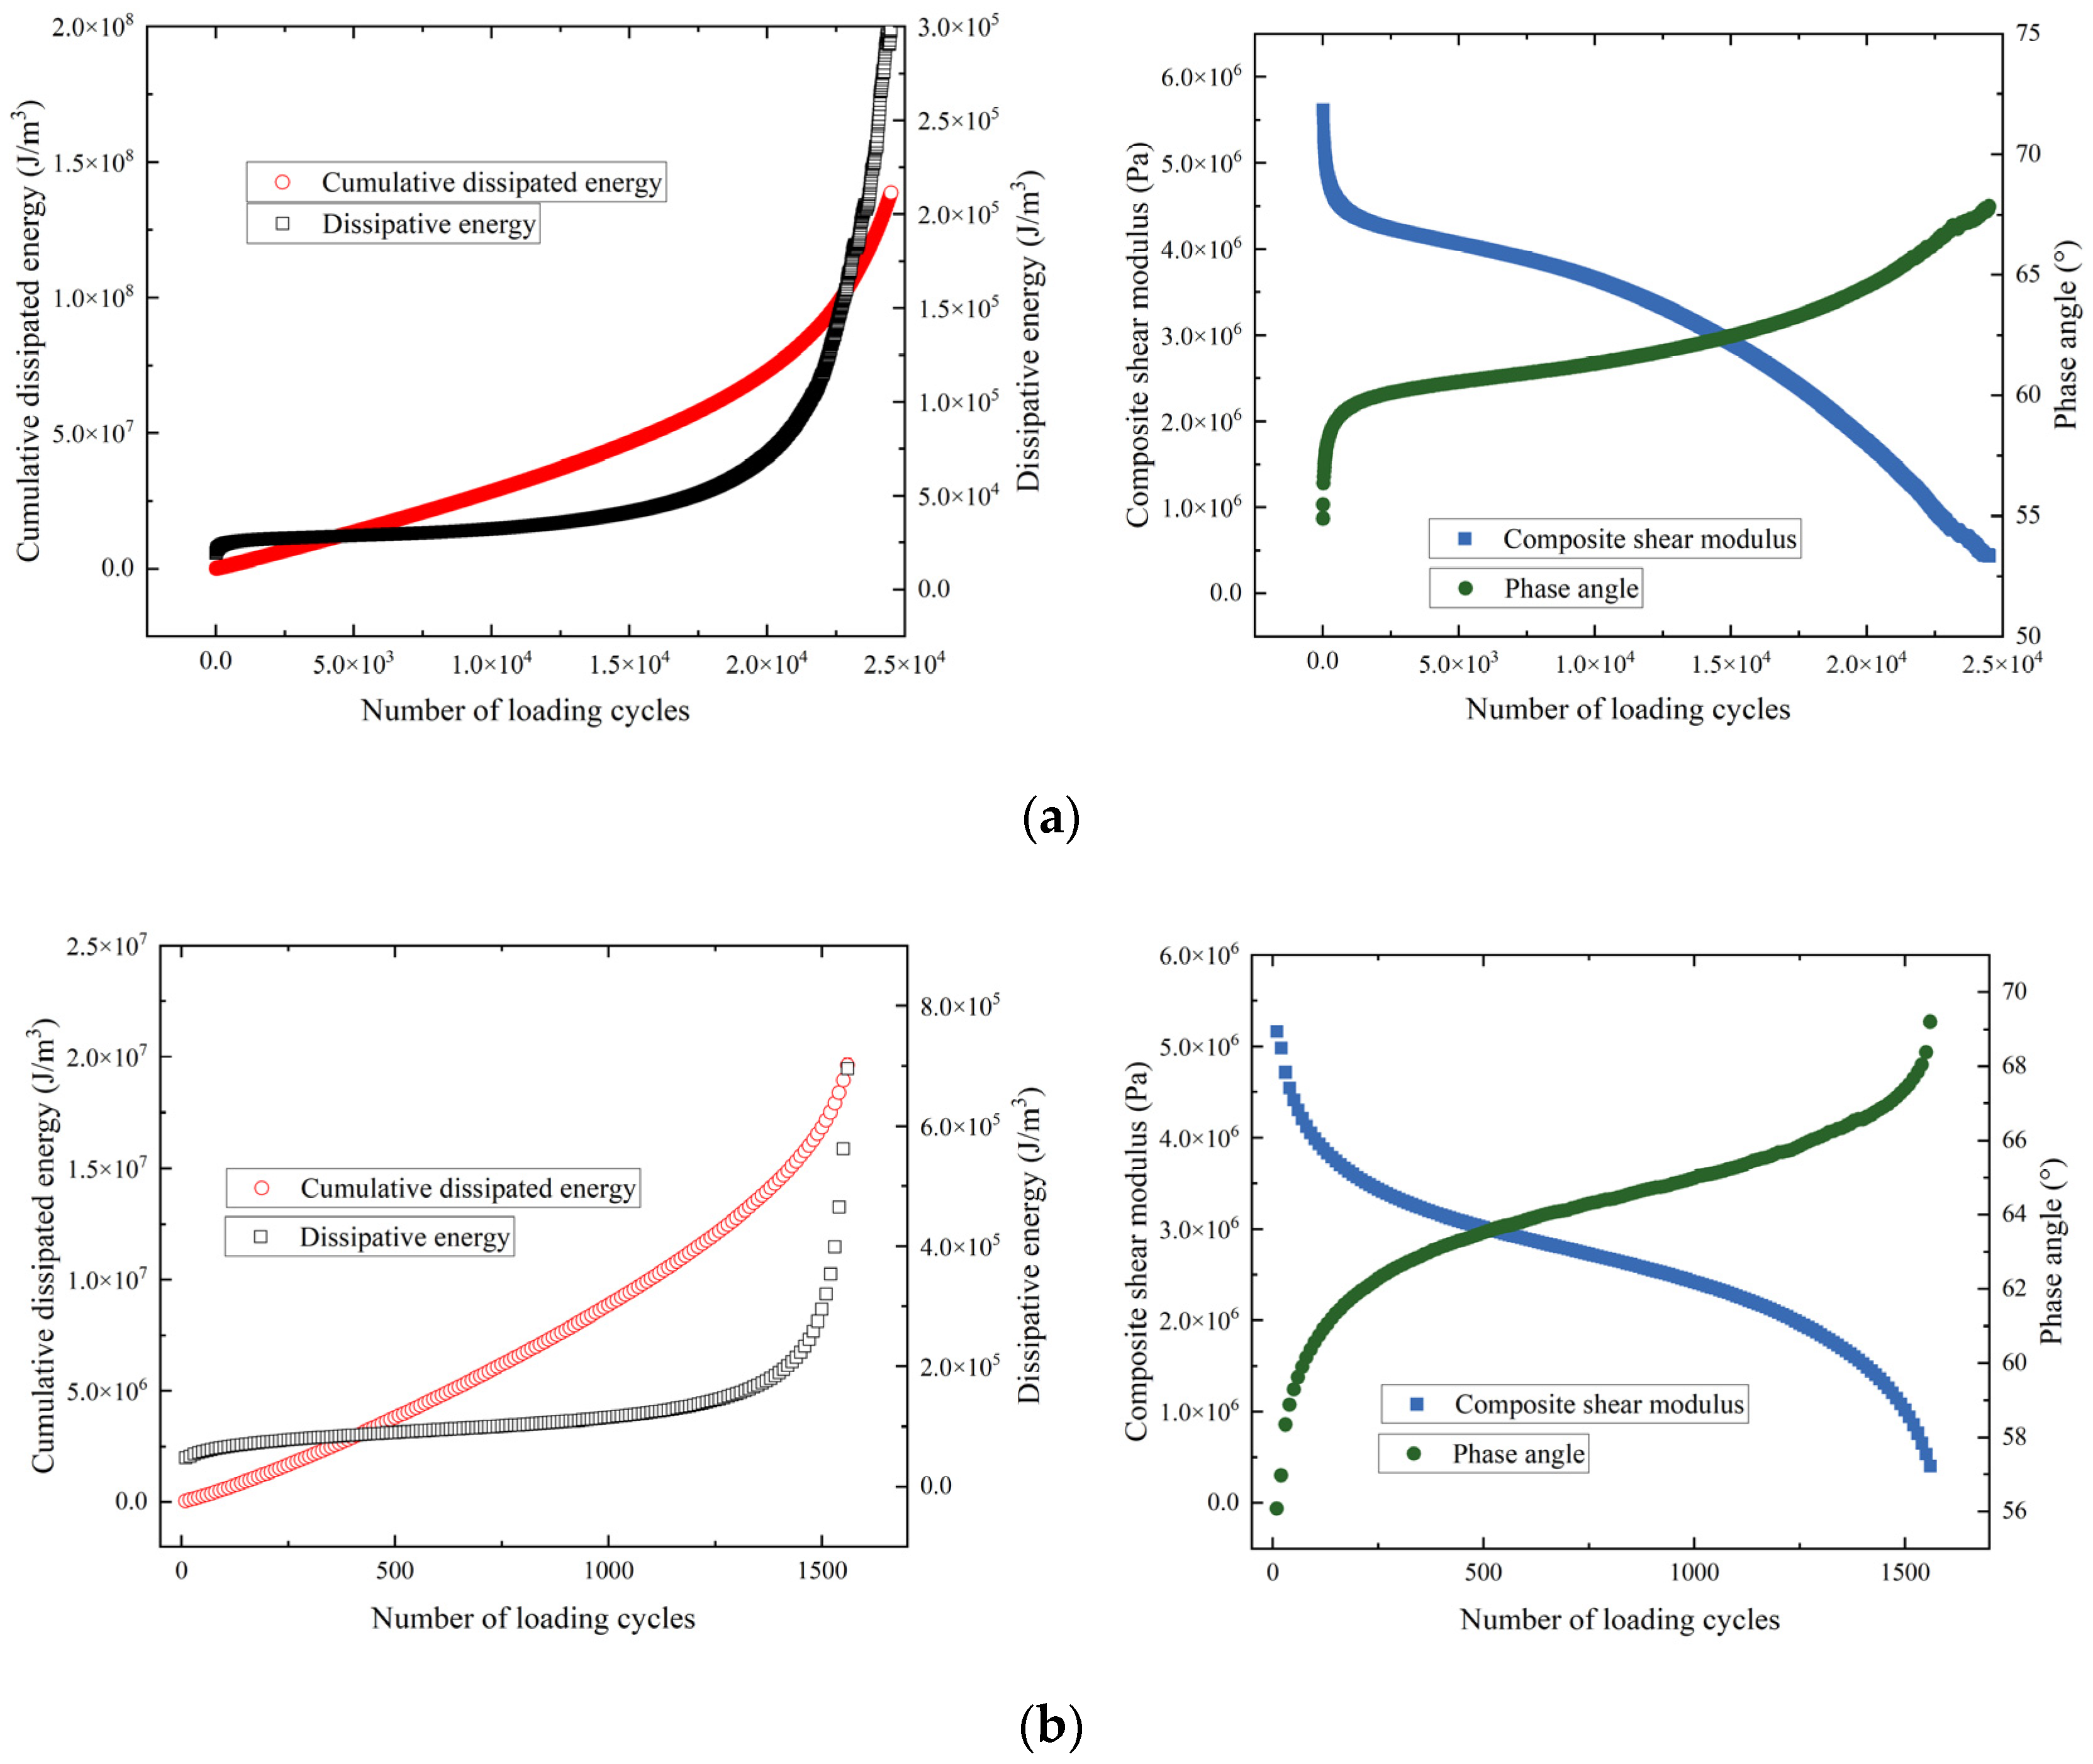
Figure 6.
DER and CDER curves under 150 kPa stress.
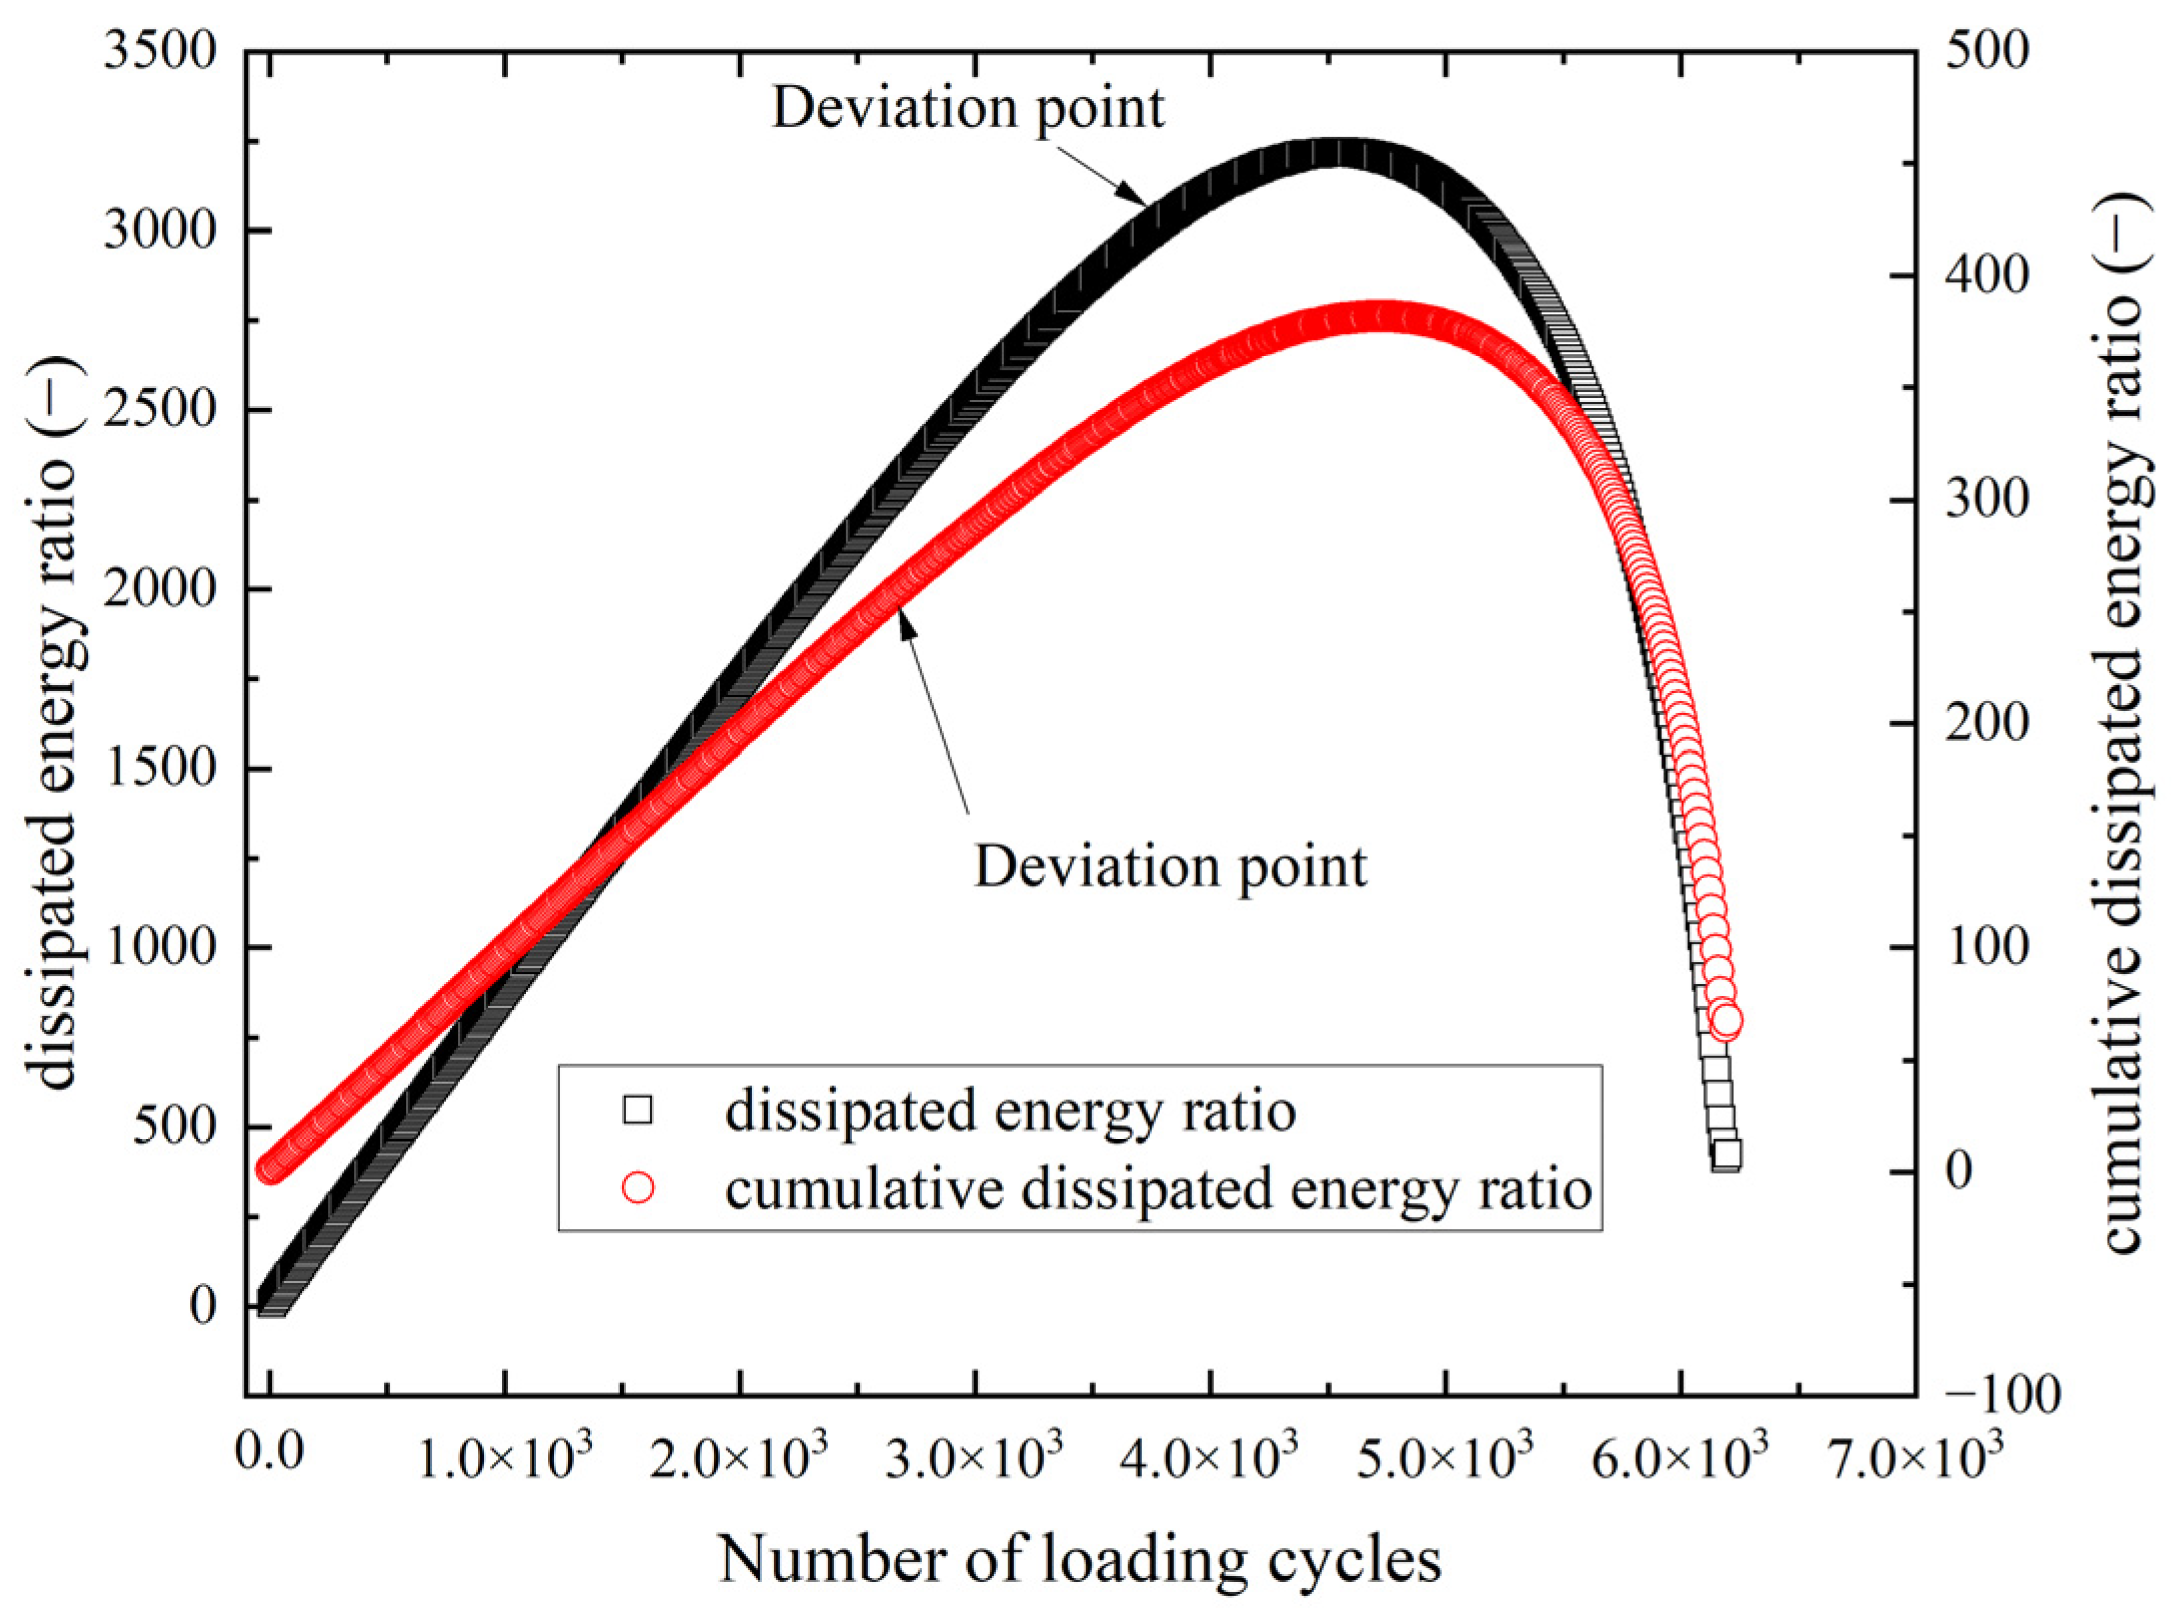
Figure 7.
DER and CDER curves under 300 kPa stress.
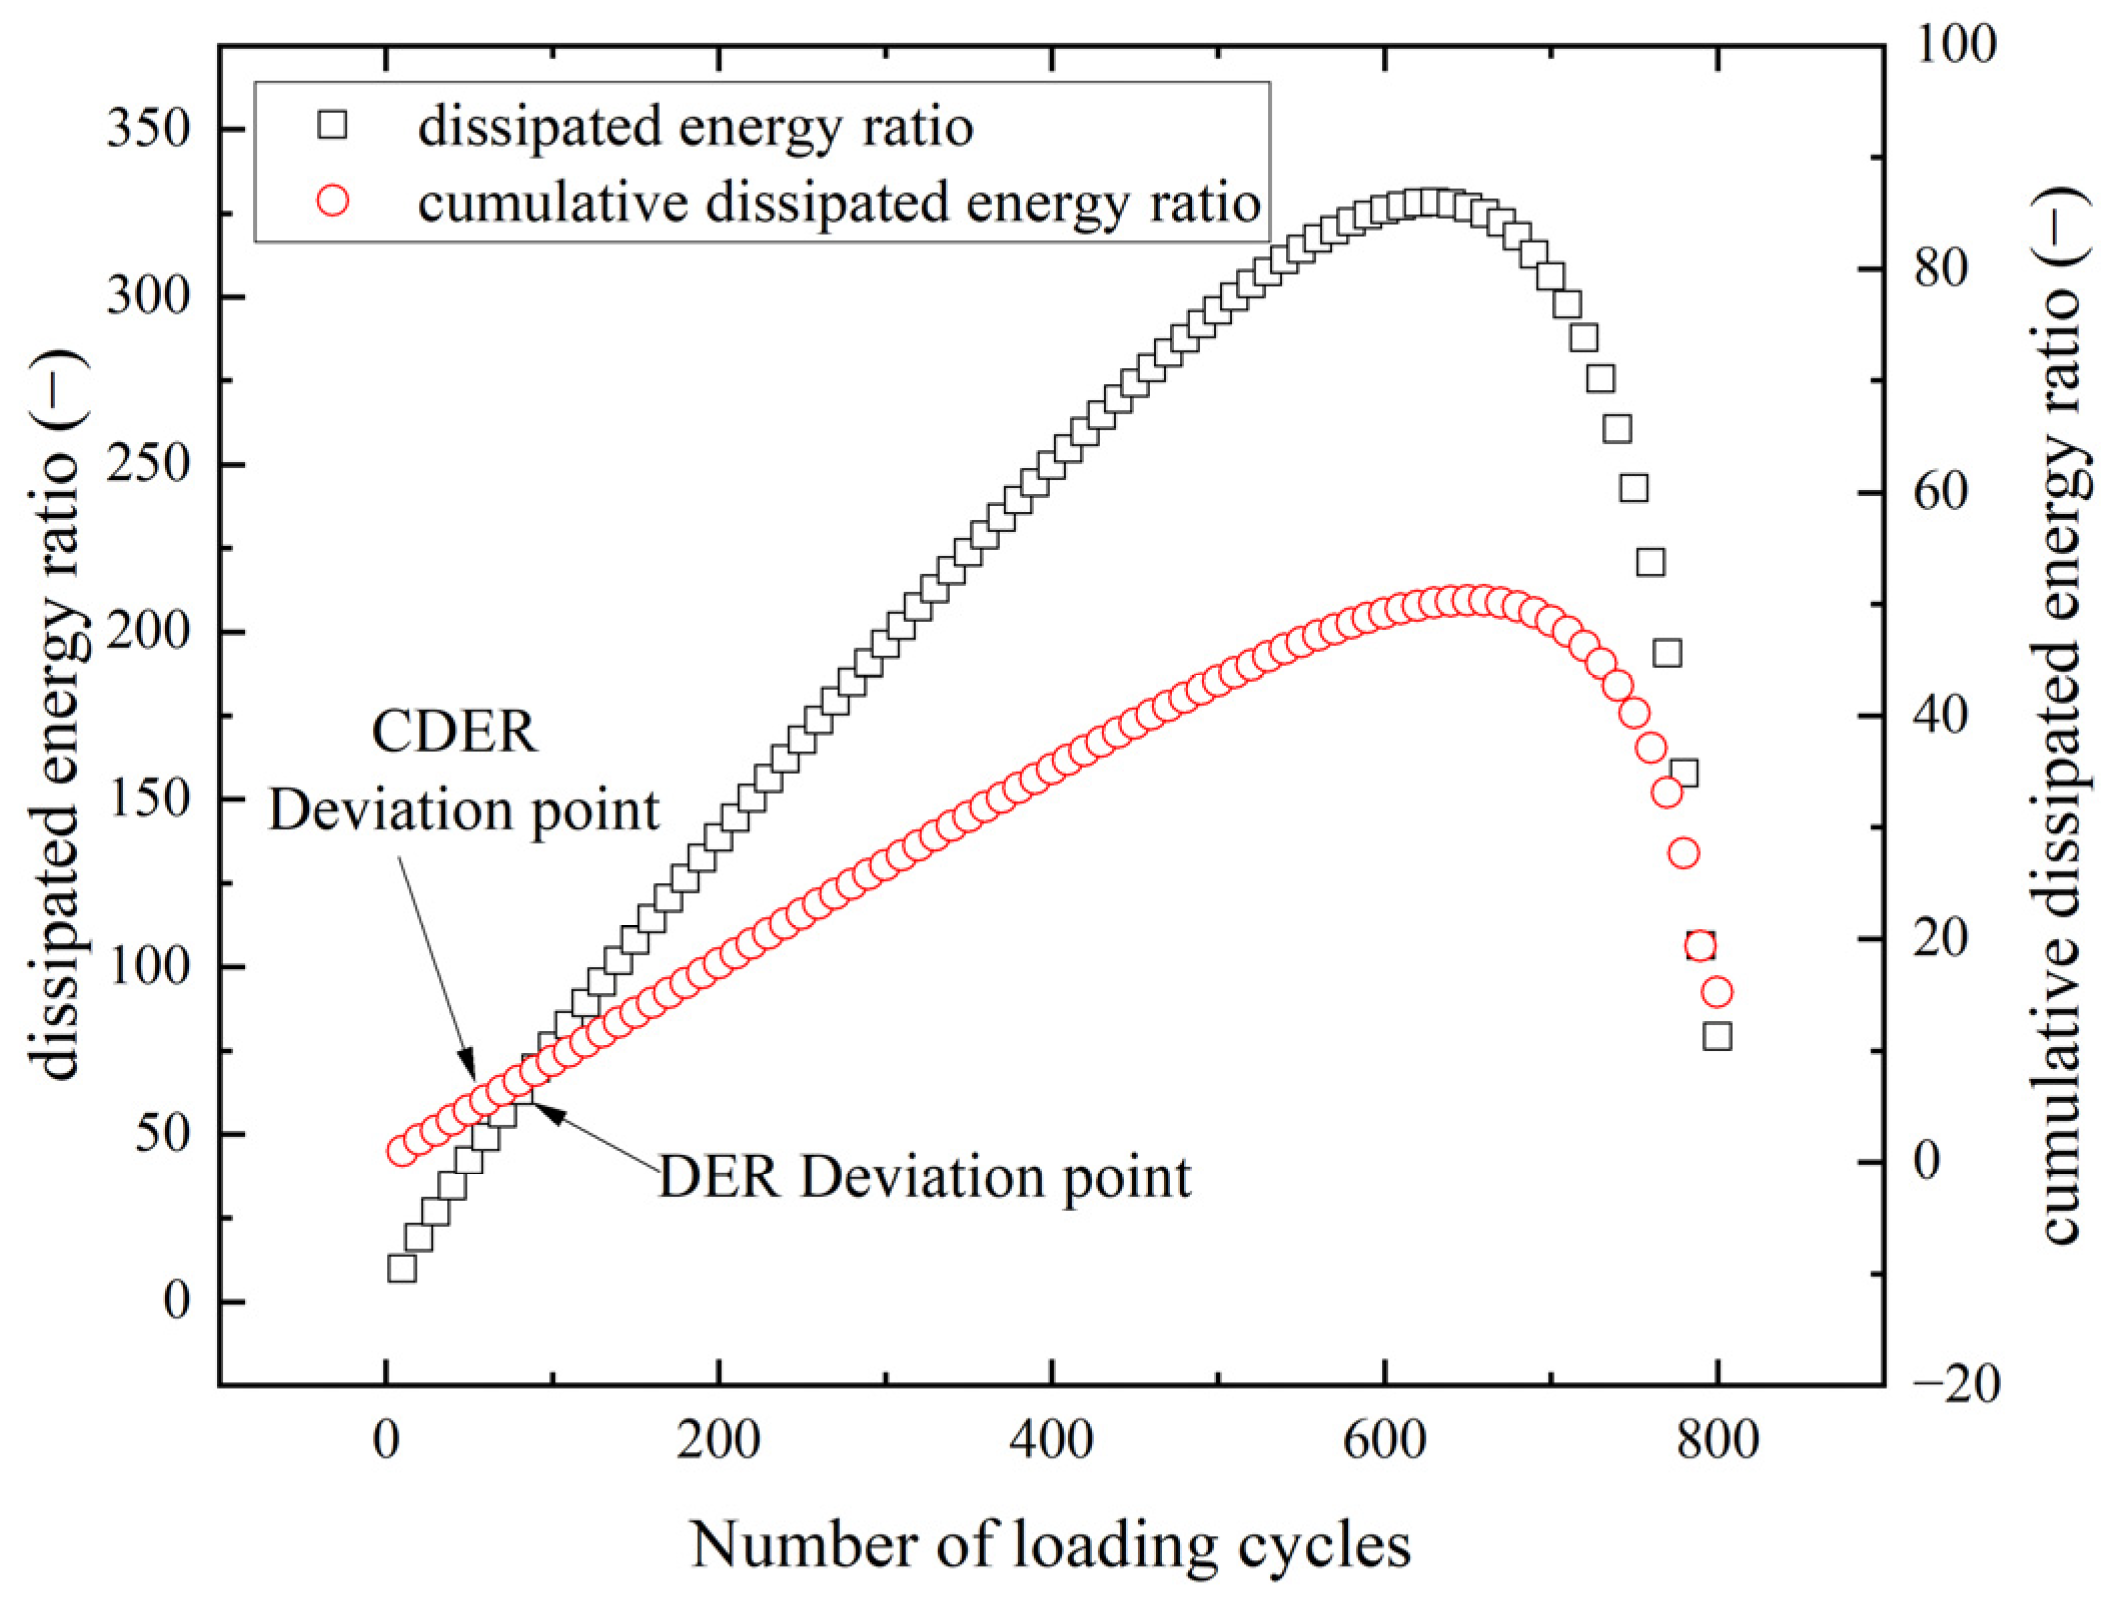
Figure 8.
G-R constant curve and dissipation energy change rate curve of asphalt Pen70–80. (a) 100 kPa; (b) 150 kPa; (c) 300 kPa; (d) 400 kPa.
Figure 8.
G-R constant curve and dissipation energy change rate curve of asphalt Pen70–80. (a) 100 kPa; (b) 150 kPa; (c) 300 kPa; (d) 400 kPa.
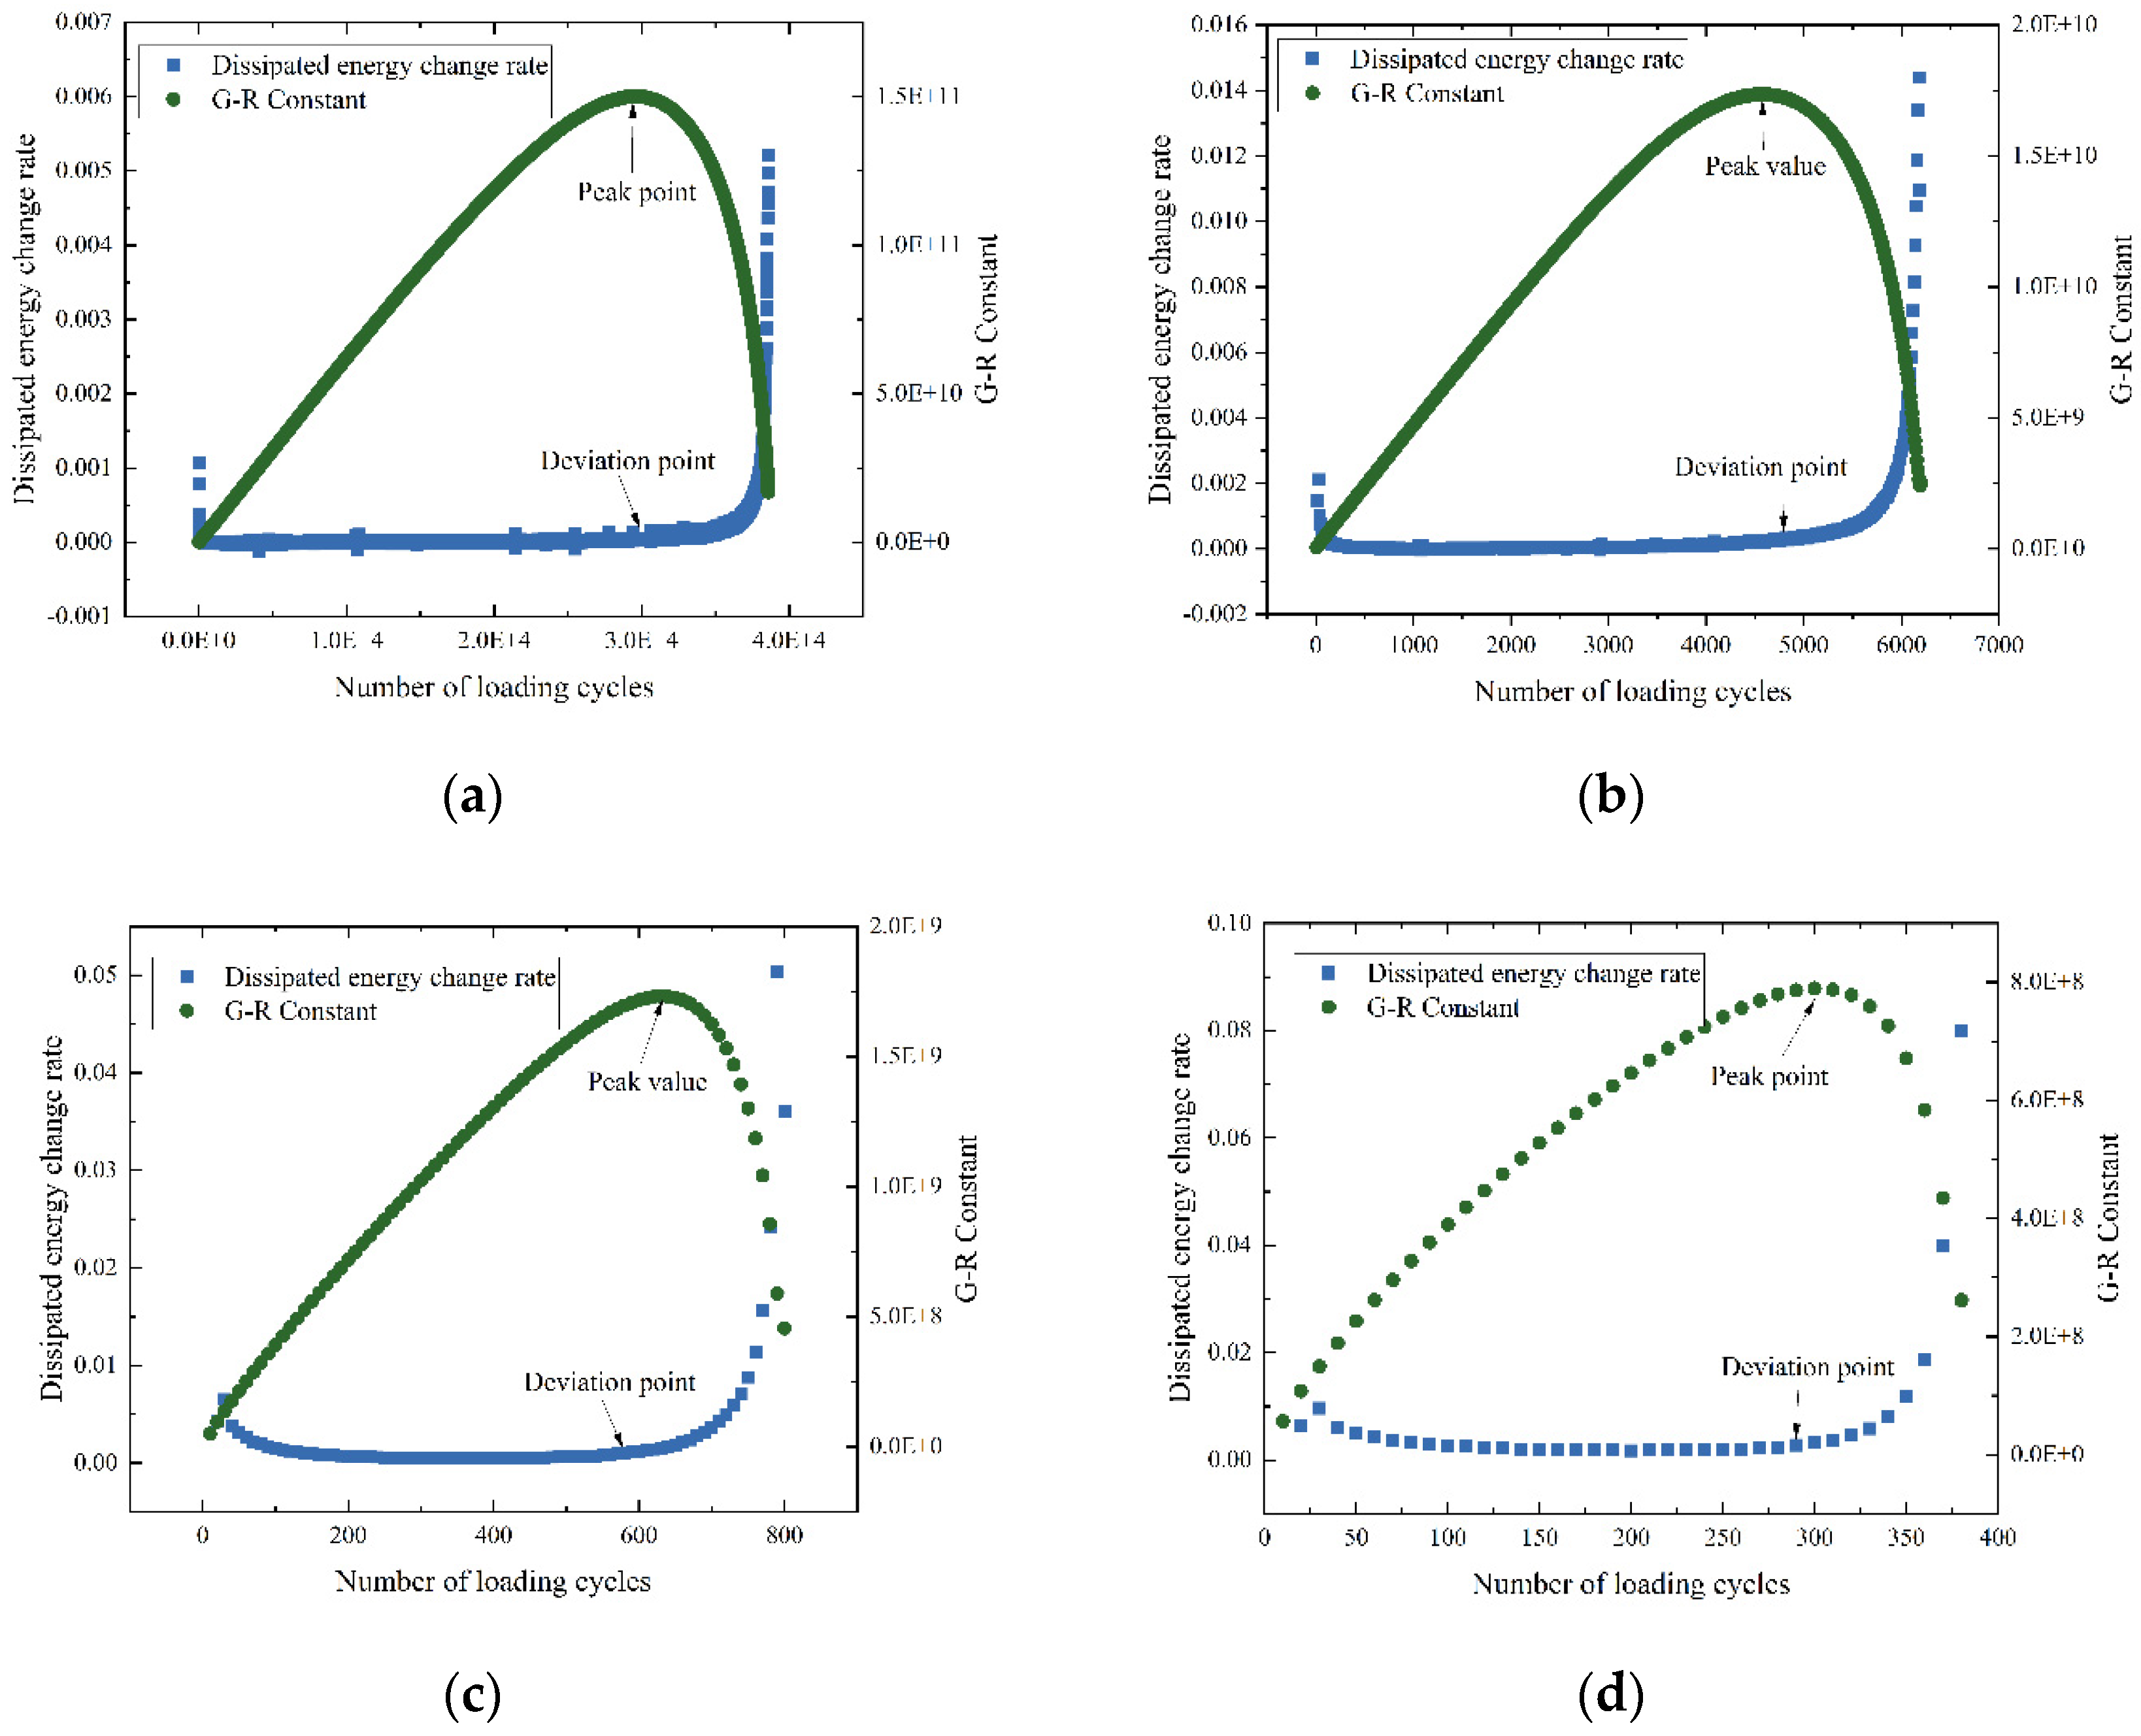
Figure 9.
G-R curve and dissipation energy change rate curve of asphalt Pen60–70. (a) 100 kPa; (b) 500 kPa.
Figure 9.
G-R curve and dissipation energy change rate curve of asphalt Pen60–70. (a) 100 kPa; (b) 500 kPa.
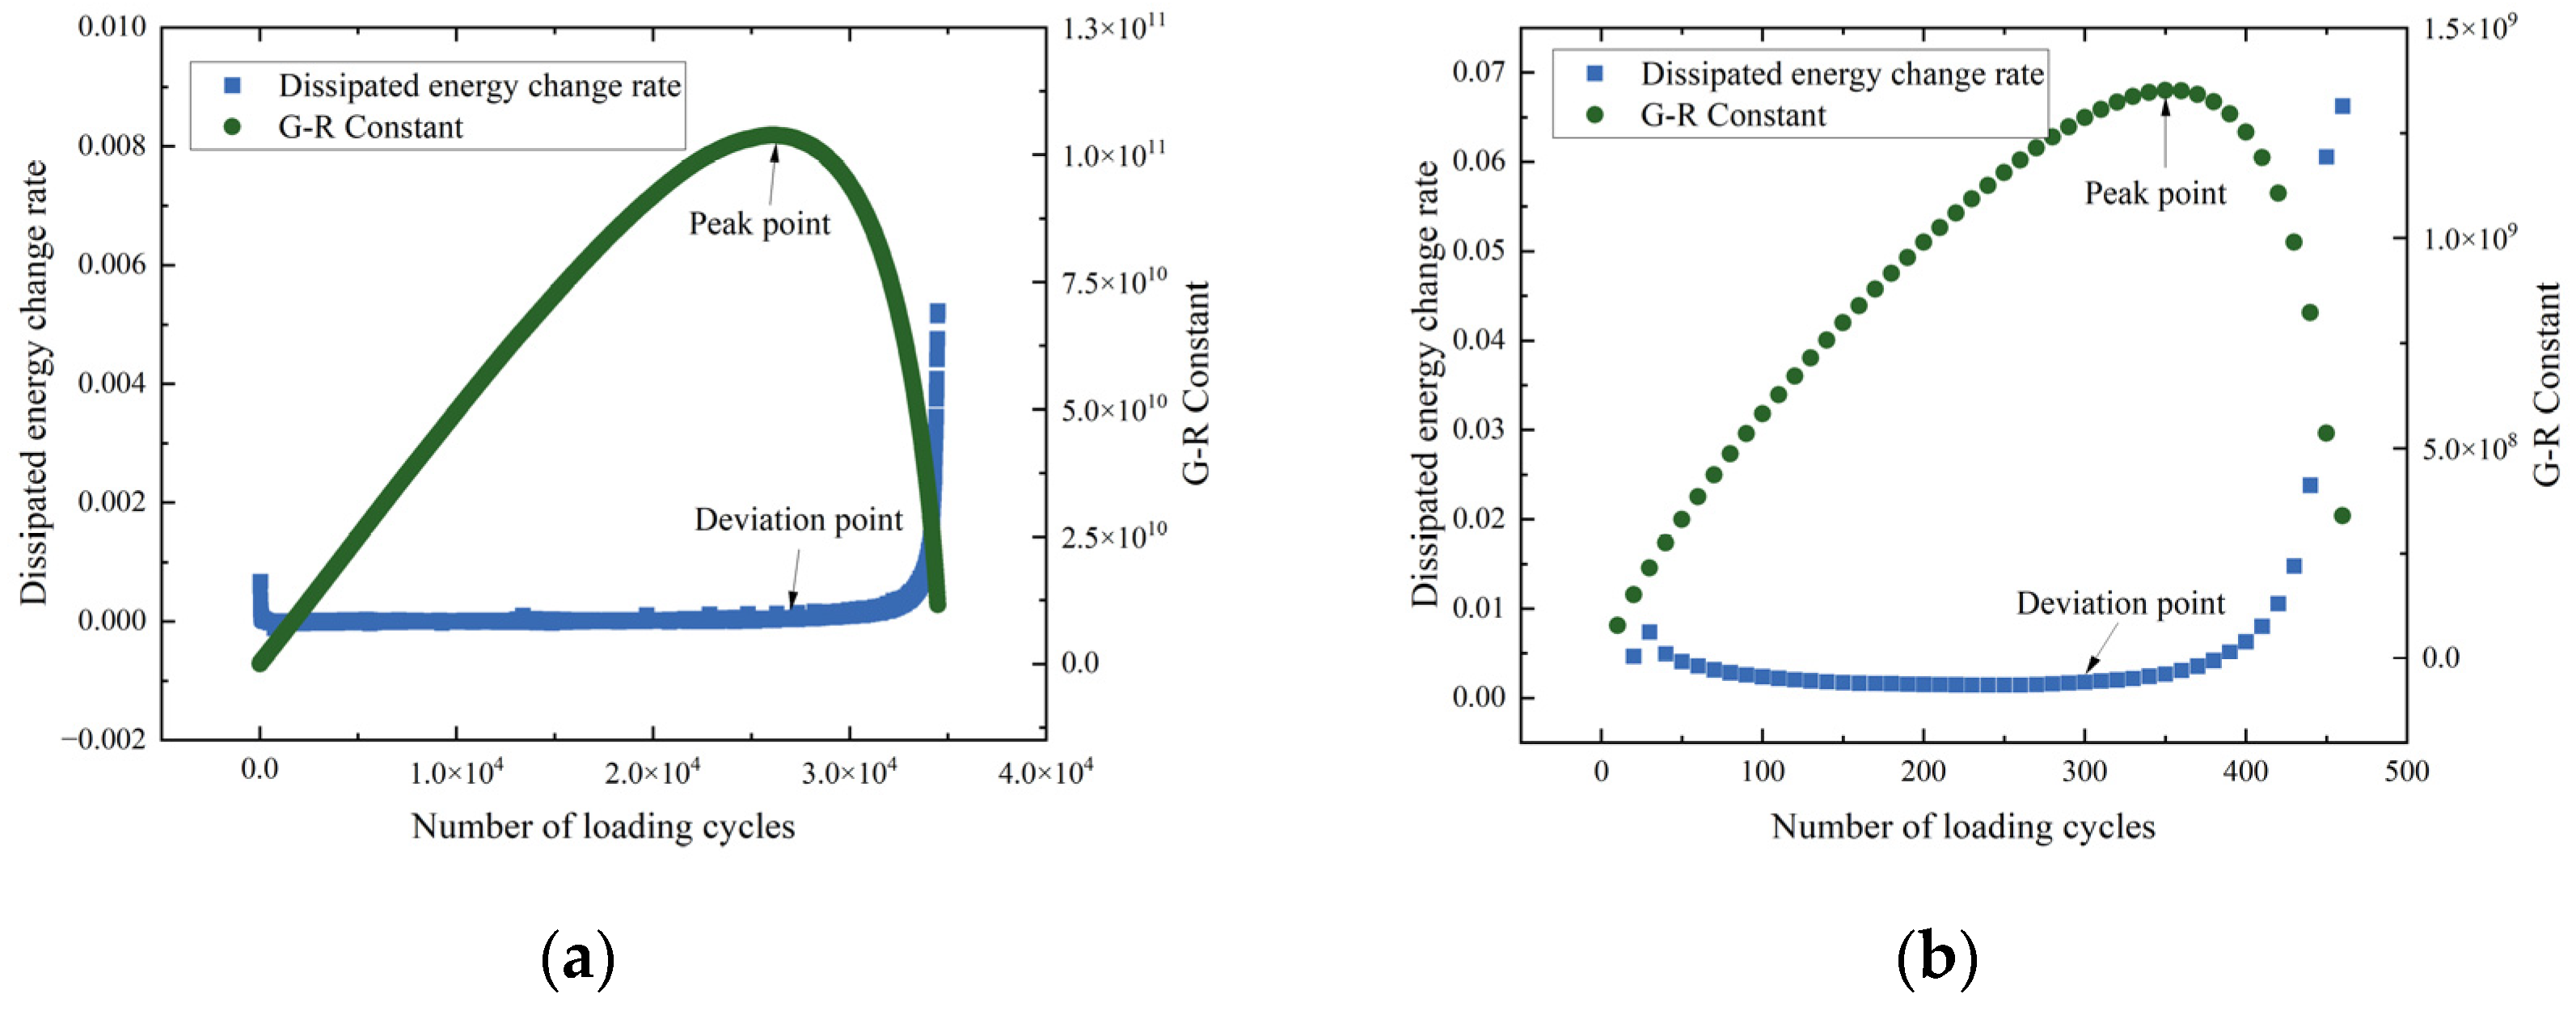
Figure 10.
G-R curve and dissipation energy change rate curve of SBS modified asphalt: (a) 100 kPa; (b) 300 kPa.
Figure 10.
G-R curve and dissipation energy change rate curve of SBS modified asphalt: (a) 100 kPa; (b) 300 kPa.

Figure 11.
Dissipated energy change rate curve and G-R constant curve of asphalt Pen70–80 under loading mode of 150-300 (LVE-NLVE): (a) 150-300-1; (b) 150-300-2; (c) 150-300-3; (d) 150-300-4.
Figure 11.
Dissipated energy change rate curve and G-R constant curve of asphalt Pen70–80 under loading mode of 150-300 (LVE-NLVE): (a) 150-300-1; (b) 150-300-2; (c) 150-300-3; (d) 150-300-4.
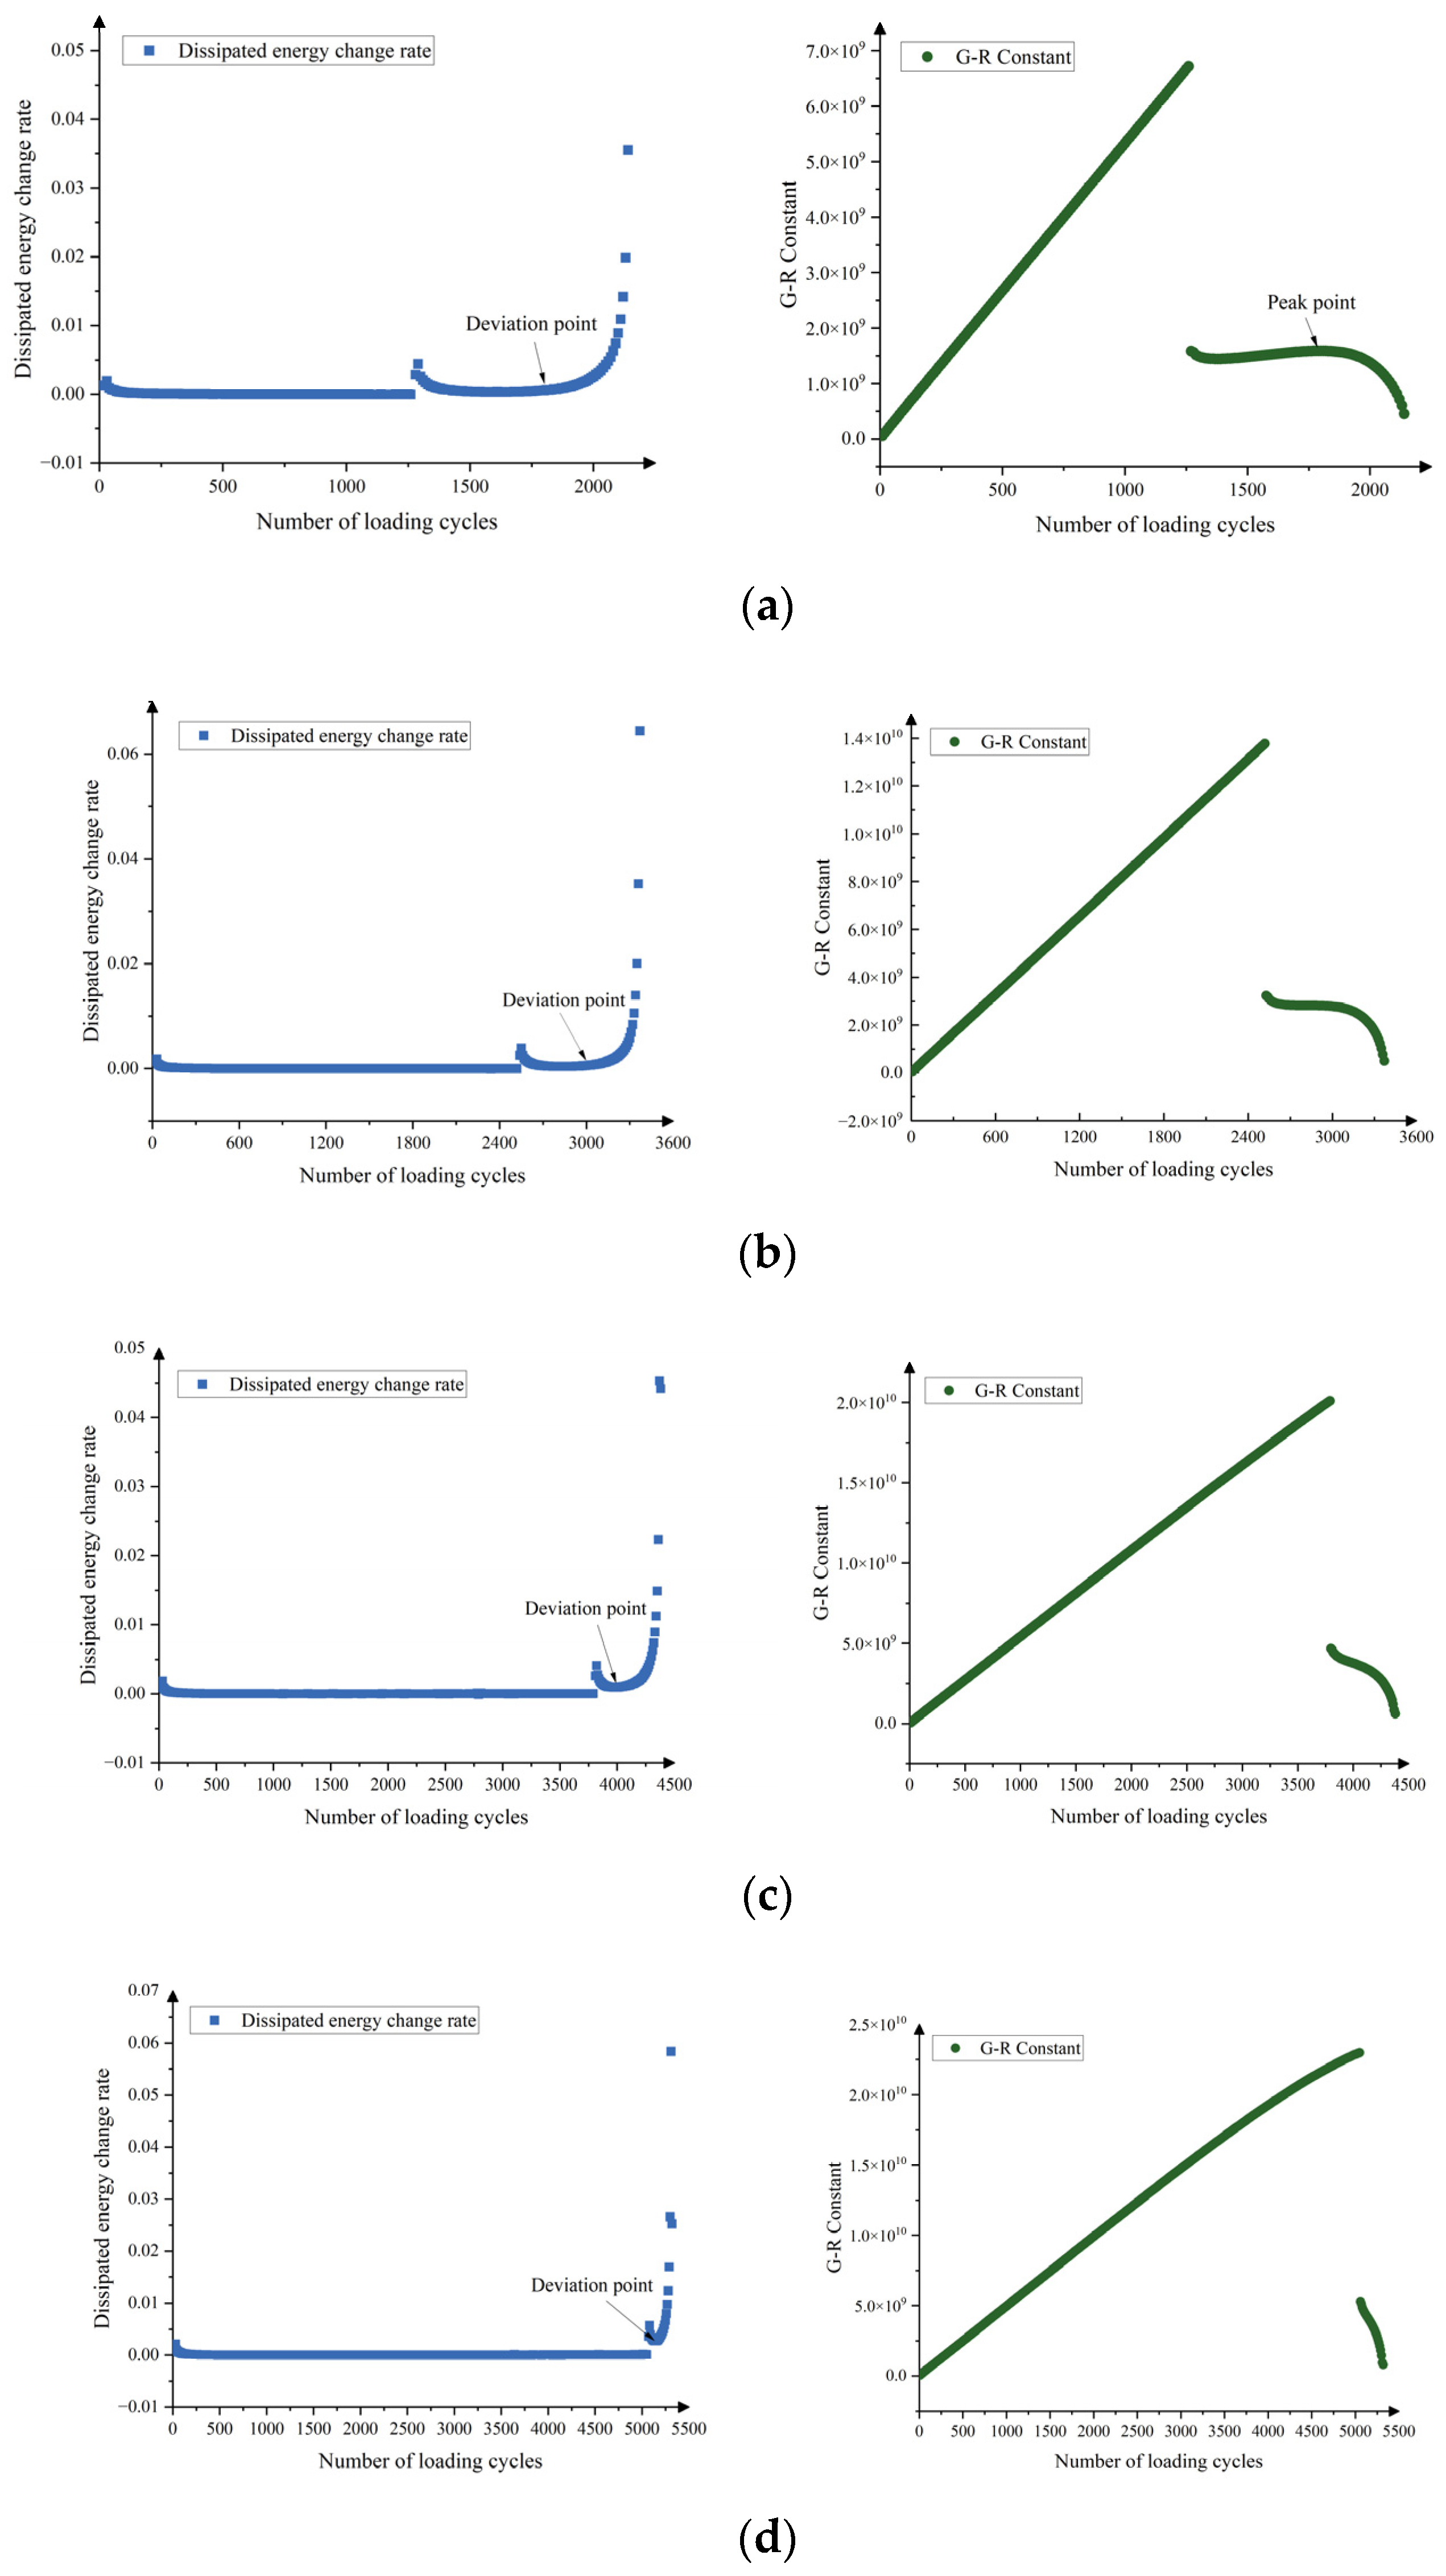
Figure 12.
Dissipated energy change rate curve and G-R constant curve of asphalt Pen70–80 under 300-150 (NLVE LVE) loading mode: (a) 300-150-1; (b) 300-150-2; (c) 300-150-3; (d) 300-150-4.
Figure 12.
Dissipated energy change rate curve and G-R constant curve of asphalt Pen70–80 under 300-150 (NLVE LVE) loading mode: (a) 300-150-1; (b) 300-150-2; (c) 300-150-3; (d) 300-150-4.

Table 1.
Main technical indicators of asphalt binder.
| Testing Items | Unit | Pen60–70 | Pen70–80 | SBS | Test Specifications |
|---|---|---|---|---|---|
| Penetration (25 °C, 100 g, 5 s) | 0.1 mm | 64 | 72 | 56 | T0604 |
| Softening point (TR&B) | °C | 48 | 49 | 64 | T0606 |
| Ductility (10 °C, 5 cm/min) | cm | 67 | >100 | 43 | T0605 |
| Kinematic viscosity (135 °C) | Pa·s | 0.21 | 0.34 | 1.95 | T0620 |
| Change in residue quality after RTFOT | % | 0.102 | 0.079 | 0.045 | T0609 |
Table 2.
Asphalt LVE–NLVE Test Plan.
| Binder Types | Test Number | First Stage Stress (kPa) | Second Stage Stress (kPa) | First Stage Damage Score | Number of Stress Cycles in the Second Stage Nf2 |
|---|---|---|---|---|---|
| Pen70–80 | 150-300-1 | 150 | 300 | 0.2 | Measured value |
| 150-300-2 | 150 | 300 | 0.4 | Measured value | |
| 150-300-3 | 150 | 300 | 0.6 | Measured value | |
| 150-300-4 | 150 | 300 | 0.8 | Measured value | |
| Pen70–80 | 300-150-1 | 300 | 150 | 0.2 | Measured value |
| 300-150-2 | 300 | 150 | 0.4 | Measured value | |
| 300-150-3 | 300 | 150 | 0.6 | Measured value | |
| 300-150-4 | 300 | 150 | 0.8 | Measured value | |
| Pen60–70 | 250-400-1 | 250 | 400 | 0.2 | Measured value |
| 250-400-2 | 250 | 400 | 0.4 | Measured value | |
| 250-400-3 | 250 | 400 | 0.6 | Measured value | |
| 250-400-4 | 250 | 400 | 0.8 | Measured value | |
| SBS modified binder | 200-300-1 | 200 | 300 | 0.2 | Measured value |
| 200-300-2 | 200 | 300 | 0.4 | Measured value | |
| 200-300-3 | 200 | 300 | 0.6 | Measured value | |
| 200-300-4 | 200 | 300 | 0.8 | Measured value |
Table 3.
Fatigue life of asphalt Pen70–80 under constant stress scanning test.
| Stress Amplitude (kPa) | 100 | 150 | 300 | 400 |
|---|---|---|---|---|
| Nf-R | 30,060 | 4860 | 580 | 290 |
| Nf-P | 29,370 | 4570 | 630 | 300 |
Table 4.
Two stage fatigue life of Pen70–80 specimens under 150-300 loading modes.
| Load Mode | First Stage Lifespan | Second Stage Lifespan Nf-R | Second Stage Lifespan Nf-P |
|---|---|---|---|
| 150-300-1 | 1262 | 518 | 548 |
| 150-300-2 | 2524 | 486 | - |
| 150-300-3 | 3786 | 204 | - |
| 150-300-4 | 5048 | 102 | - |
Table 5.
Two stage fatigue life of Pen70–80 specimens under 300-150 loading modes.
| Load Mode | First Stage Lifespan | Second Stage Lifespan Nf-R | Second Stage Lifespan Nf-P |
|---|---|---|---|
| 300-150-1 | 158 | 5412 | 5372 |
| 300-150-2 | 316 | 4286 | 4164 |
| 300-150-3 | 474 | 3460 | 3296 |
| 300-150-4 | 632 | 2588 | 2438 |
Disclaimer/Publisher’s Note: The statements, opinions and data contained in all publications are solely those of the individual author(s) and contributor(s) and not of MDPI and/or the editor(s). MDPI and/or the editor(s) disclaim responsibility for any injury to people or property resulting from any ideas, methods, instructions or products referred to in the content. |
© 2024 by the authors. Licensee MDPI, Basel, Switzerland. This article is an open access article distributed under the terms and conditions of the Creative Commons Attribution (CC BY) license (https://creativecommons.org/licenses/by/4.0/).
Share and Cite
MDPI and ACS Style
Yu, H.; Deng, Y.; Deng, G.; Dong, N. Correlations between Energy Dissipation Characteristics and the Rheological Property Degradation of Asphalt Binders. Buildings 2024, 14, 292. https://doi.org/10.3390/buildings14010292
AMA Style
Yu H, Deng Y, Deng G, Dong N. Correlations between Energy Dissipation Characteristics and the Rheological Property Degradation of Asphalt Binders. Buildings. 2024; 14(1):292. https://doi.org/10.3390/buildings14010292
Chicago/Turabian StyleYu, Huayang, Yihao Deng, Guansen Deng, and Niya Dong. 2024. "Correlations between Energy Dissipation Characteristics and the Rheological Property Degradation of Asphalt Binders" Buildings 14, no. 1: 292. https://doi.org/10.3390/buildings14010292
Note that from the first issue of 2016, this journal uses article numbers instead of page numbers. See further details here.