

Inertial Measurement Unit- and Time Series Approach-Based Motion Trajectory Reconstruction of the Safety Rope Fastening Behaviour

School of Civil Engineering, Harbin Institute of Technology, Harbin 150090, China
*
Author to whom correspondence should be addressed.
Buildings 2024, 14(1), 219; https://doi.org/10.3390/buildings14010219
Submission received: 1 October 2023
/
Revised: 13 December 2023
/
Accepted: 11 January 2024
/
Published: 14 January 2024
(This article belongs to the Special Issue Occupational Health in the Construction Industry)
Abstract
:Monitoring workers’ safety compliance is critical to construction accident prevention. However, most of the previous research focuses on checking the entry of workers wearing safety belts and the monitoring of the fastening action of safety rope screw buckles has not yet been considered. In this paper, a reconstruction method for the safety rope fastening behaviour of workers is proposed based on inertial measurement units (IMU) and a time series approach to monitor safety belt use. The proposed method was applied and evaluated through on-site construction experiments. The experimental results show that the acceleration, angular velocity, and magnetic induction intensity data obtained by the inertial measurement unit exhibit clear behavioural characteristics during safety rope fastening. The trajectory of the safety rope can be reconstructed and monitored through inertial measurement units and a time series approach. The results of this study will contribute to the reconstruction and monitoring of safety rope attachment trajectories for scaffolding workers working at heights in order to prevent falls at construction sites.
1. Introduction
The construction industry is particularly hazardous due to its dynamic work environment [1,2]. According to the Bureau of Labour Statistics (BLS) in the United States, falls, slips, and trips accounted for a substantial portion of the fatalities in construction. There were 370 fatalities in 2021 in construction and extraction occupations due to falls, slips, and trips, accounting for a 7.2% increase from 2020 [3]. From 2017 to 2021, there were 1919 incidents of falling from heights in China, accounting for 53% of the total housing and municipal engineering safety accidents [4]. These casualties not only cause irreparable economic losses but also restrict the sustainable development of the construction industry to a certain extent. The safety belt is a personal protective device for workers to be used at various heights; it can prevent casualties and is praised as lifesaving by construction workers. The safety belt is composed of a lanyard (composed of a strap and metal accessories, which are worn by workers), a safety rope, a buffer bag, and metal accessories, and is generally known as a fall suspension belt. The safety belt must be hung high and used low, and the opposite should be avoided [5,6]. The safety rope should be fastened to a strong body part. However, sometimes, the workers’ safety awareness is poor or workers are negligent and fail to attach the belt’s safety cord to a fixed structure, which can increase the risk of falling.
In order to reduce risk when scaffolding workers are working at heights and ensure their safety, it is crucial to accurately predict the trajectory of scaffolding workers wearing safety belts. Motion trajectory monitoring plays a key role in achieving this, as it allows collaborative robots to proactively respond and anticipate human movements, reducing safety risks for workers [7,8]. Motion trajectory monitoring refers to the process of forecasting the positions of a human body determined by a previous series of its movements with the highest possible accuracy [9]. Early work on human motion prediction employed methods such as clustering, Kalman filters, linear regression, autoregression, and nonlinear Gaussian processes. However, these methods were typically only effective in laboratory settings and simple scenarios [10]. In contrast, the time series approach is traditionally performed using data-based models that simulate potential human motion using a manually created trajectory. These models construct motion trajectories from data [11], in contrast to the first approach. The primary reason for using data-driven learning methodologies in motion prediction is that it is more practical to forecast an object’s movement based on observable data than to use a standard algorithm [11,12]. This is because the movement of an object is varied and unpredictable.
With the advancement of deep learning algorithms and graphic processing units, vision-based behaviour recognition has been applied to recognise unsafe behaviour in construction [13]. Han et al. [14] detected unsafe actions of construction workers using vision-based depth sensors. Detecting personal protection equipment (PPE), such as safety harnesses, using a vision-based approach was also studied by Fang et al. [15]. In addition, motion sensors such as inertial measurement units (IMU) have a high suitability due to their high durability, availability in low-visibility conditions, and low power usage [16,17,18]. With these advantages, IMU is one of the most widely used sensors in the construction industry [19,20,21]. Joshua and Varghese [22] showed that IMU data can classify the characteristics of activities. Yoon et al. [23,24] attempted to examine the gait stability of ironworkers based on IMU data. These studies validated the feasibility of using IMU sensors to extract the subtle characteristics of workers’ activities. Although these studies focused on classifying each activity using IMU data and extracting unsafe behaviours from their task sequence, it is also essential to identify whether a worker’s behaviour follows the safety regulations.
The above literature shows that the unsafe behaviours of scaffold workers working at altitude can be guided and managed. With the help of IMU, we can monitor the safety harness fastening behaviour of scaffold workers, which can effectively reduce the number of safety accidents caused by unsafe human behaviour and greatly promote the automation and intelligence of construction management. Therefore, to ensure the safety of scaffolding workers working at altitude, a method based on IMUs and quaternions [25] is proposed to reconstruct the motion trajectories and buckling behaviours of scaffolding workers working at altitude. In this paper, based on IMUs used to collect safety rope fastening action data for scaffold workers working at altitude and quaternions used to establish a trajectory model of safety rope fastening movement, the safety belt fastening actions of scaffold workers working at altitude are reconstructed to ultimately realize the intelligent monitoring and management of construction safety information.
The remainder of this paper is organized as follows. The specific reconstruction method of the safety harness screw fastening movement of scaffold workers working at altitude based on IMU and quaternions is explained in Section 2. In Section 3, the feasibility of the proposed method is verified. In Section 4, the innovations and limitations of this paper and suggestions for future work are discussed. Section 5 presents the conclusions of this research.
2. Methods
To ensure the safety of scaffolding workers working at height and prevent falling, scaffolding workers must wear safety belts (and straps; Figure 1), attaching one end of the safety rope to the horizontal scaffold pole. According to the operating procedures and on-site observations, the steps of safety rope use can be divided into several stages. First, the safety rope is placed around the waist. Second, the safety harness screw is tightened around the horizontal bar of the scaffold, and the connecting ring is then attached to create a hanging support, which is very important. The safety belt is not functional unless this step is completed. To facilitate workers performing tasks at height and not affect these operations, in this paper, an IMU is fixed at the position where the turnbuckle and the safety rope are connected. The IMU is used to collect action data, and the data are transmitted to a receiver. Quaternions are used to express the attitude changes of the turnbuckle, and a spatial motion trajectory model of tie behaviour is established to monitor tie movement behaviour in combination with the safety belt (Figure 1c).
2.1. Quaternions Represent the Action Position of the Safety Harness Screw
The safety harness screw is wrapped around the horizontal bar and attached to the connecting ring. The completion of this action confirms the belt fastening behaviour of the scaffolding workers working at altitude. To monitor this behaviour, the first step is to determine how to describe the gesture of the behaviour [26]. Mathematically, attitude refers to the parameters of the angular position of the coordinate system of a rigid body and a reference coordinate system. The action attitude angle represents the change in the spatial angle of rotation in the carrier coordinate system relative to the reference coordinate system. The yaw angle, pitch angle, and roll angle are commonly used to describe the rotation angle of a carrier. A quaternion is an expression of the attitude angle, which can describe the change in the motion angle of a rigid body and can effectively avoid the generation of Euler angle singularity. A quaternion consists of a solid unit and three imaginary numbers , , and , as shown in Equation (1).
In this paper, a quaternion expression is used to describe the position of the safety harness screw. The rotation angle is adjusted by changing the quaternion correlation matrix, and attitude variations are based on changes in the rotation angle. In this work, the safety harness screw is regarded as a rigid body, and an IMU is fixed at the turnbuckle position for data acquisition. The IMU and the safety harness screw share a spatial rotation system: the yaw angle is around the z axis, pitch is in the y direction, and roll is in the x direction. The coordinate system is defined as follows. The IMU is fixed in the carrier coordinate system, and the carrier coordinate system is a front–left–up () right-handed coordinate system. The geographic coordinate system is a west–north–sky coordinate system. If the rotation axis is defined by the directional cosine of the reference coordinate system and the quaternion norm is unitized, the rotation motion of the safety rope hook can be conveniently represented. The cosine angle in each direction is based on the yaw angle , pitch angle , and roll angle , and the rotation angle is . is the unit vector along the rotation axis. Mathematically, any vector changes the angle around the rotation axis of the unit vector, and the vector after rotating an angle is determined from Equation (2).
where is the inverse matrix of the quaternion .
Based on the IMU of the wearable device, we can acquire the three-axis acceleration sensing data, three-axis gyroscope sensing data and three-axis magnetic sensing data for the same time interval. The above data are used as the inputs of the algorithm, and the attitude angle of the safety harness can be calculated with the attitude angle algorithm and expressed in quadratic form. The attitude angle algorithm is shown below.
In the geographical coordinate system, gravitational acceleration and the geomagnetic field are and , respectively, as expressed in Equations (3) and (4).
where is gravitational acceleration and and are the components of the geomagnetic field corresponding to different coordinate axes. In the carrier coordinate system composed of the safety harness screw and an IMU, gravitational acceleration and the geomagnetic field can be expressed as shown in Equations (5) and (6), respectively.
where and are the vectors of gravitational acceleration and the geomagnetic field in the carrier coordinate system, respectively. is the coordinate transformation matrix from the geographic coordinate system to the carrier coordinate system, as shown in Equation (7).
After obtaining the initial geomagnetic field and gravitational acceleration data at a construction site, Equations (3), (5) and (7) are applied. By combining the results with and obtained by the IMU in the carrier coordinate system, Equation (8) can be established, as shown below.
where , , and are the acceleration readings in different axis directions in the carrier coordinate system of the IMU fixed on the safety harness screw. Equation (8) can be used to determine the pitching angle and roll angle , as shown in Equations (9) and (10), respectively.
By applying Equations (4), (6) and (7) with , which is the reading from the magnetic induction sensor (on the IMU fixed on the safety harness screw) along the x-axis of the carrier coordinate system, as the input, Equation (11) is obtained. Additionally, the yaw angle is determined as shown in Equation (12).
Through the above derivation, Equations (9), (10) and (12) are used to determine the attitude angles (pitch, roll, and heading) of the safety harness screw, and the attitude angles are expressed in the form of a quaternion, as shown in Equation (13). The quaternion norm above is unitized and expressed with a trigonometric function, as shown in Equation (14). The quaternion represents the rotation change in the direction of each axis of the carrier coordinate system based on the IMU; that is, it represents the active attitude of the safety rope buckle when it is attached.
where represents the rotation axis of the unit vector and represents the rotation angle of an action.
2.2. Spatial Motion Trajectory Model of Safety Rope Buckle Fastening Behaviour
In the above subsection, the action attitude of the safety rope buckle when it is attached is described based on a quaternion approach. With the aim of increasing the representativeness of quaternion action data, the next step is to establish a spatial motion trajectory model of the safety rope fastening behaviour of workers working at height.
The specific steps used for safety rope tethering behaviour monitoring are as follows.
(1) A virtual space coordinate system is created, and one part of the human body is set as the coordinate origin. Considering the action characteristics of the safety rope hanging behaviour and that the relative position of the waist of a worker performing actions barely changes, we set the waist as the origin of the spatial coordinate system.
(2) The initial coordinates of the IMU fixed to the safety harness screw are , and the corresponding coordinate system is established (in a right-hand Cartesian coordinate system, the front of the person is the x direction, and from the foot to the head is the z direction).
(3) Then, through the quaternion rotation algorithm in three-dimensional spatial coordinates, the relative coordinates of the IMU during the safety rope fastening movement are obtained, and the motion trajectory with the worker’s waist position as the origin is recorded.
Starting from the initial state, we monitor and track the fastening of the safety harness screw and represent the process in a time series [27,28]. By collecting data at each discrete time point, a series of safety rope fastening actions for scaffold workers working at heights is established.
The algorithmic flow of the time series approach is as follows.
(1) The natural state point when the IMU is first fixed on the safety harness screw is regarded as the initial state of action, and the waist position of the scaffold worker working at altitude is selected as the origin of the reference coordinate system, i.e., . Then, the initial position of the wearable IMU is (assuming that the distance from the waist to the shoulder is 1 and that the length of a worker’s arm is 1).
(2) is converted to a quaternion, expressed as .
(3) The quaternion at each discrete time point of the time series is expressed as . represents the rotation angle of the IMU in this state at time t, that is, the change in the attitude angle (the change is represented by a quaternion).
(4) At time t, the coordinate of the IMU relative to the initial point is the imaginary part of the quaternion .
Based on the complex method of quaternions for matrix operations, the spatial coordinates of the IMU of the safety rope screw fastener fixed at a given moment in the time series are obtained. Based on the constructed spatial coordinate system and the quaternion data, the spatial motion trajectory of the fastening action of the safety rope buckle is determined.
2.3. Evaluation of Model Performance
For the evaluation of motion trajectory reconstruction, the final displacement error (FDE) is often used as an evaluation metric [9,29]. The FDE takes into account the difference between the predicted point and the true final point. The FDE metric is computed as Equation (15).
where k is the number of target points, and are the true and predicted locations of target point i.
Since in this study the prediction is in 3D space, the location is calculated by distance formula as Equation (16) using corresponding x, y, and z.
3. Experiment
3.1. Experimental Design
To verify the feasibility of the reconstruction method of safety rope attachment for scaffold workers based on an IMU and quaternions, the research team conducted field tests involving field workers and fastening operations. The IMU was fixed at the lower end of the safety harness screws, and turnbuckle movement data were transmitted to a computer application that used a practical timestamp to store the data. The test was conducted at the Harbin Daowai Hospital construction site operated by the China Construction Eighth Engineering Bureau. There are many scaffolds used in this construction project. Scaffold workers usually need to climb high to work, so they are exposed to more danger than others working at ground level. In order to ensure that the individual behaviours of the different workers were taken into account, 20 workers participated in this field trial, each of them following the safety rope procedure to attach the safety rope. In this experiment, the scaffold workers fastened their safety belts according to the actual standard operation process. When the workers wearing the safety belt were working at height on the scaffold, they uncoiled the safety rope at their waist, lifted the end of the safety rope with the buckle slightly higher than the horizontal bar of the scaffold, wound the rope around the horizontal bar, and then returned the rope down to hook the connecting ring on the safety harness. Then, the buckle was pushed up near the lower part of the horizontal scaffold bar of the scaffold. Finally, the safety rope fastening action was completed (Figure 2). It was observed in the field test that the workers tied the safety rope to the scaffolding, and one of the most important actions is to wrap the safety rope with a screw buckle on the horizontal pole, and this action indicates that the safety rope is in a safe state. An IMU was used to collect and transmit acceleration, angular velocity, and magnetic induction strength data, and the action data for the safety rope fastening action were stored in an application on a computer with a USB receiver.
3.2. Data Generation
The collection of original data is the most important step in this research, and all data in this study were collected with the IMU. The frequency of data collection was 50 Hz. Workers maintained a normal attitude and acted naturally during the process of data collection. Additionally, they did not deliberately change their behaviour due to the test, which would affect the authenticity of the measured data. Based on the IMU data, scaffold workers’ safety belt use when working at heights was monitored, and some collected test data are shown in Table 1.
3.3. Data Analysis
The safety rope fastening behaviours of scaffold workers working at heights varied. Data collected by the IMU were visualized. Figure 3 shows the three-axis acceleration change curve for the safety rope buckle fastening action, and Figure 4 shows the change in the angular velocity monitored by the three-axis gyroscope during the hooking action of the safety rope. Figure 5 shows the three-axis magnetic induction intensity curve of the safety rope hook during the fastening action.
The abscissas in Figure 3, Figure 4 and Figure 5 are time, and the ordinates are physical components corresponding to the three axes of the carrier coordinate system, where blue represents the x-axis component, red represents the y-axis component, and black represents the z-axis component. Figure 3 shows that the change in the three-axis acceleration data collected by the IMU is relatively stable in the initial stage, and a variation occurs at approximately 1.5 s. The curve fluctuates significantly between 1.5 s and 3 s, producing two prominent peaks, and then enters a relatively stable state at approximately 3.5 s. The curve of the three-axis angular velocity change measured by the gyroscope (Figure 4) and the curve of the three-axis magnetic induction change (Figure 5) display similar characteristics as the three-axis acceleration curve. First, the curves are relatively stable; then, they fluctuate sharply between 1.5 s and 3.5 s before returning to a stable state.
In order to reduce the influence of external factors, e.g., the deployment location of the IMU and the data transmission process on the raw collected data, the Euclidean distance of 3D data, which enables the provision of the most intuitive characterisation of the safety rope tightening action data, is utlized. Figure 6 shows the three-axis curve of the acceleration change during the safety rope buckle fastening action, Figure 7 shows the three-axis curve of the angular acceleration change during the safety rope fastening action, and Figure 8 shows the curve of the three-axis composite magnetic induction intensity during the safety rope hook fastening action. Figure 6, Figure 7 and Figure 8 illustrate curves with similar trends; the curves are initially stable, fluctuate sharply from between 1.5 s to and 3.5 s, and finally return to a stable state.
4. Results and Discussions
This section provides an overview of the trajectory results of scaffolding worker safety rope screw buckle fastening based on a time series approach and experimental data, and explores the advantages and limitations of this study.
In Section 2.1, the use of quadratic expressions was proposed to describe the tethering action and position of the safety rope screw buckle. This approach can express the change in the rotation angle based on the change in the quaternion correlation matrix and express attitude based on rotation angle change. The acceleration data and magnetic induction intensity data can be used to obtain the attitude angle for the safety harness screw by using the attitude angle calculation formulas (Equations (9), (10) and (12)); the result can be expressed in the form of quadratic numbers (Equation (13)). Figure 9 shows the curve of the attitude angle corresponding to the safety rope fastening action data from construction workers; specifically, the attitude angle changes over time, as demonstrated based on the data collected by the IMU on the buckle of the safety belt. Figure 10 shows the curve of the safety harness screw rotation vector, that is, the curve of the rotation vector based on quaternions. Figure 10 shows the change in the rotation angle in the established coordinate system during the movement of the safety harness screw. Figure 11 shows the projection changes along the three axes during unit vector rotation in the quaternion approach. As shown in Figure 9 and Figure 11, the data fluctuations in the range of approximately 1.5 to 3.5 s are prominent, with obvious characteristics of fastening action. Figure 10 shows the curve changes associated with the screw buckle fastening process.
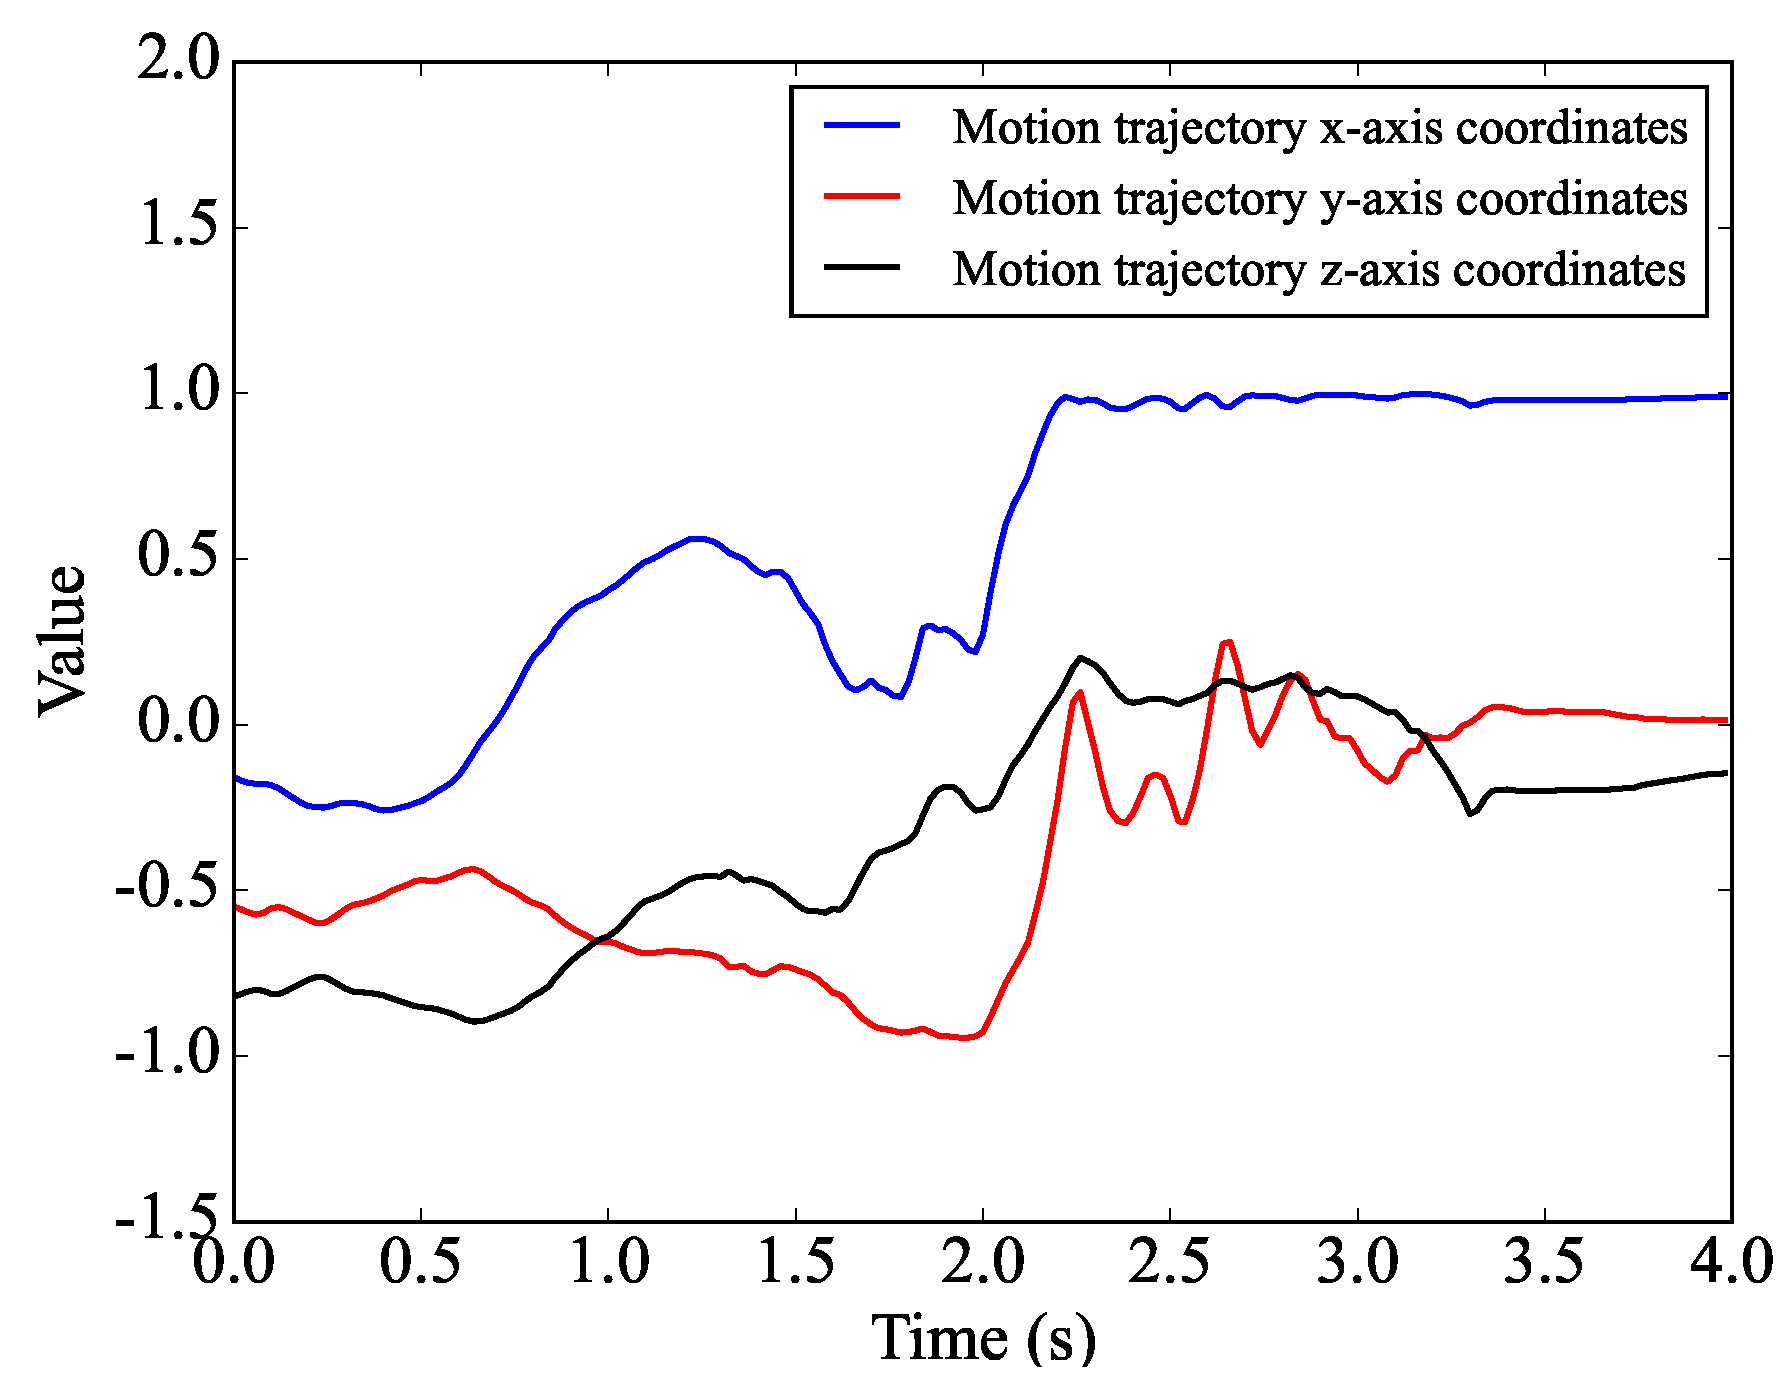
Through the collection of the above data, although it is found that the safety rope screw buckle fastening action and position display obvious fluctuations and characteristics, the quaternion-based characterization of the initial screw buckle angle changes is clear, but other detailed actions are difficult to differentiate. To monitor specific actions and not just assess fluctuations in the data, it is necessary to correlate the data features with detailed actions. The acquired IMU data were processed and transformed based on a quadratic correlation approach from raw data containing a single fluctuation feature to three-dimensional spatial coordinate data with multiple feature attributes. Then, they were plotted with the spatial motion trajectories in the safety rope screw buckle attachment process, as shown in Figure 12. Figure 12 shows the trajectory of the entire safety rope screw buckle fastening action. The safety rope screw buckle moves upwards, and a loop-like trajectory appears at the uppermost end of the upwards trajectory, which characterizes the action of the safety rope screw buckle being wound around the horizontal bar of the scaffold. Such an action trajectory indicates that the scaffold worker has attached the safety rope and that the worker is in a safe state. The safety rope attachment trajectory provides real-time monitoring information for construction site safety management. The final displacement error (FDE) was used to evaluate the model for performing kinematic trajectory reconstruction, and the FDE value was 3.8%, and the accuracy of kinematic trajectory reconstruction reached 96.2%, which proved the reliability of the model. Figure 13 shows the schematic diagram of the safety rope attachment motion trajectory in each dimension. Similar data fluctuation characteristics as described previously were again observed in the range of 1.5 to 3.5 s.
Existing research mostly focuses on identifying the behaviour of workers wearing safety belts on construction sites, with little attention paid to monitoring this behaviour during high-altitude operations. Through the analysis of experimental data, it can be determined that the acceleration, angular velocity, and magnetic induction intensity data obtained by the inertial measurement unit exhibit identifiable characteristics during the safety rope hanging action. In order to reduce the influence of external conditions, such as the fixed position of the inertial measurement unit and data transmission, on the collected raw data, three-dimensional acceleration, angular velocity, and magnetic induction intensity data can be summed by square root processing and then synthesized into one-dimensional data. These data can intuitively describe the characteristics of the safety rope hanging action. On the other hand, the attitude angle changes corresponding to the data of the safety rope tying action can also be used to indicate the completion of the tying action. A spatial motion trajectory model of the safety rope screw buckle fastening behaviour was established based on a time series approach, and the reconstruction of the safety rope attachment actions of scaffold workers was achieved.
The above results show that it is possible to monitor the safety harness fastening action of scaffold workers with the help of IMU and a time series approach. The current research, which involves a state-of-the-art approach for monitoring the movements of workers at height, has some limitations, mainly regarding the insufficient amount of data in the studied sample. Additionally, the physical conditions of construction workers are not the same, and workers’ operation behaviours, although based on set standards, can vary in practice [30]. In future studies, additional physical and operational data associated with the actions of high-altitude scaffold workers will be obtained to reveal the characteristics of safety rope fastening and support construction management and worker safety and security. In the future, the combination of artificial intelligence and machine learning will be explored, and unsafe action recognition and real-time behaviour assessments will be performed, thus facilitating improved construction safety management through data safety management measures involving wearable devices.
5. Conclusions
To improve the efficiency of the safety inspection process and effectively avoid working-at-height accidents, a method based on a combination of IMU and a time series approach was proposed to establish a spatial movement trajectory model of safety rope screw buckle fastening. The research results show that (1) the IMU approach is simple to apply, and an IMU can be fixed directly to the safety rope hook. Additionally, the safety rope screw buckle fastening action displayed obvious data fluctuation characteristics in the construction site test. (2) A quaternion approach can be used to describe the attitude of the safety harness screw fastening action and to develop an algorithm for modelling and reconstructing the spatial movements of safety harness screw fastening. (3) The reconstruction method for scaffold worker fastening actions based on IMU and a time series approach is feasible. By analysing the relationship between the data collected by the IMU and the worker fastening actions, a spatial movement trajectory of the fastening behaviour is established. Ultimately, scaffold workers’ fastening behaviour is reconstructed and a coupled movement technique is provided for monitoring safety belt fastening, thus contributing to construction safety management in practice and theory.
Author Contributions
Conception, Z.H. and Y.W.; Methodology, Z.H.; Investigation: Z.H.; Validation, Z.H. and Y.W.; Writing—original draft preparation, Z.H.; Writing—review and editing, Z.H. and Y.W. Project administration, Z.H. All authors have read and agreed to the published version of the manuscript.
Funding
This research was supported by grants from the National Natural Science Foundation of China (No. 52108279) and Heilongjiang Provincial Key Laboratory of Polar Environment and Ecosystem (No. 2021007). This support is gratefully acknowledged.
Data Availability Statement
The data presented in this study are available on request from the corresponding author.
Conflicts of Interest
The authors declare no conflicts of interest.
References
- Uddin, S.M.J.; Albert, A.; Alsharef, A.; Pandit, B.; Patil, Y.; Nnaji, C. Hazard Recognition Patterns Demonstrated by Construction Workers. Int. J. Environ. Res. Public Health 2020, 17, 7788. [Google Scholar] [CrossRef] [PubMed]
- Karamoozian, A.; Luo, C.; Wu, D. Risk assessment of occupational safety in construction projects using uncertain information. Hum. Ecol. Risk Assess. Int. J. 2023, 29, 1134–1151. [Google Scholar] [CrossRef]
- Paul, M.L.; Blasko, M. Bureau of Labor Statistics Releases 2021 Construction Industry Fatality Injury Data. Available online: https://www.jacksonlewis.com/insights/bureau-labor-statistics-releases-2021-construction-industry-fatality-injury-data (accessed on 30 March 2023).
- Li, Z. Analysis of the Situation of Construction Safety in China. Available online: http://www.hywit.com/portal/Article/index/id/9986/cid/207.html (accessed on 8 September 2022).
- Goh, Y.M. An Empirical Investigation of the Average Deployment Force of Personal Fall Arrest Energy Absorbers. J. Constr. Eng. Manag. 2014, 141, 04014059. [Google Scholar] [CrossRef]
- Evan, N.; Carol, H.; Bo, X.; Ian, S.; Dongping, F. Falls from Height in the Construction Industry: A Critical Review of the Scientific Literature. Int. J. Environ. Res. Public Health 2016, 13, 638. [Google Scholar] [CrossRef]
- Zhou, T.; Zhu, Q.; Shi, Y.; Du, J. Construction Robot Teleoperation Safeguard Based on Real-Time Human Hand Motion Prediction. J. Constr. Eng. Manag. 2022, 7, 148. [Google Scholar] [CrossRef]
- Terzioglu, T.; Polat, G. Formwork System Selection in Building Construction Projects Using an Integrated Rough AHP-EDAS Approach: A Case Study. Buildings 2022, 12, 1084. [Google Scholar] [CrossRef]
- Heravi, M.Y.; Jang, Y.; Jeong, I.; Sarkar, S. Deep learning-based activity-aware 3D human motion trajectory prediction in construction. Expert Syst. Appl. 2024, 239, 122423. [Google Scholar] [CrossRef]
- Hirakawa, T.; Yamashita, T.; Tamaki, T.; Fujiyoshi, H. Survey on Vision-Based Path Prediction; Springer International Publishing: Cham, Switzerland, 2018; pp. 48–64. [Google Scholar] [CrossRef]
- Du, H.; Manns, M.; Herrmann, E.; Fischer, K. Joint Angle Data Representation for Data Driven Human Motion Synthesis. Procedia CIRP 2016, 41, 746–751. [Google Scholar] [CrossRef]
- Kim, K.; Cho, Y.K. Effective inertial sensor quantity and locations on a body for deep learning-based worker’s motion recognition. Autom. Constr. 2020, 113, 103126. [Google Scholar] [CrossRef]
- Fang, W.; Zhong, B.; Zhao, N.; Love, P.E.; Luo, H.; Xue, J.; Xu, S. A deep learning-based approach for mitigating falls from height with computer vision: Convolutional neural network. Adv. Eng. Inform. 2019, 39, 170–177. [Google Scholar] [CrossRef]
- Han, S.; Lee, S.; Peña-Mora, F. Vision-Based Detection of Unsafe Actions of a Construction Worker: Case Study of Ladder Climbing. J. Comput. Civ. Eng. 2013, 27, 635–644. [Google Scholar] [CrossRef]
- Fang, W.; Ding, L.; Luo, H.; Love, P.E. Falls from heights: A computer vision-based approach for safety harness detection. Autom. Constr. 2018, 91, 53–61. [Google Scholar] [CrossRef]
- Sanhudo, L.; Calvetti, D.; Martins, J.P.; Ramos, N.M.; Mêda, P.; Gonçalves, M.C.; Sousa, H. Activity classification using accelerometers and machine learning for complex construction worker activities. J. Build. Eng. 2021, 35, 102001. [Google Scholar] [CrossRef]
- Akhavian, R.; Behzadan, A.H. Smartphone-based construction workers’ activity recognition and classification. Autom. Constr. 2016, 71, 198–209. [Google Scholar] [CrossRef]
- Tian, Y.; Zhang, J.; Chen, L.; Geng, Y.; Wang, X. Single Wearable Accelerometer-Based Human Activity Recognition via Kernel Discriminant Analysis and QPSO-KELM Classifier. IEEE Access 2019, 7, 109216–109227. [Google Scholar] [CrossRef]
- Ahn, C.R.; Lee, S.; Sun, C.; Jebelli, H.; Yang, K.; Choi, B. Wearable Sensing Technology Applications in Construction Safety and Health. J. Constr. Eng. Manag. 2019, 145, 03119007. [Google Scholar] [CrossRef]
- Bangaru, S.S.; Wang, C.; Busam, S.A.; Aghazadeh, F. ANN-based automated scaffold builder activity recognition through wearable EMG and IMU sensors. Autom. Constr. 2021, 126, 103653. [Google Scholar] [CrossRef]
- Barraza Madrigal, J.A.; Contreras Rodríguez, L.A.; Cardiel Pérez, E.; Hernández Rodríguez, P.R.; Sossa, H. Hip and lower limbs 3D motion tracking using a double-stage data fusion algorithm for IMU/MARG-based wearables sensors. Biomed. Signal Process. Control 2023, 86, 104938. [Google Scholar] [CrossRef]
- Joshua, L.; Varghese, K. Accelerometer-Based Activity Recognition in Construction. J. Comput. Civ. Eng. 2011, 25, 370–379. [Google Scholar] [CrossRef]
- Yoon, J.; Lee, B.; Chun, J.; Son, B.; Kim, H. Investigation of the relationship between Ironworker’s gait stability and different types of load carrying using wearable sensors. Adv. Eng. Inform. 2022, 51, 101521. [Google Scholar] [CrossRef]
- Hong, S.; Yoon, J.; Ham, Y.; Lee, B.; Kim, H. Monitoring safety behaviors of scaffolding workers using Gramian angular field convolution neural network based on IMU sensing data. Autom. Constr. 2023, 148, 104748. [Google Scholar] [CrossRef]
- Terze, Z.; Zlatar, D.; Pandža, V. Aircraft attitude reconstruction via novel quaternion-integration procedure. Aerosp. Sci. Technol. 2020, 97, 105617. [Google Scholar] [CrossRef]
- Pellois, R.; Brüls, O. An inertial human upper limb motion tracking method for robot programming by demonstration. Robot. Auton. Syst. 2022, 156, 104201. [Google Scholar] [CrossRef]
- Roy, A.; Nelson, T.; Turaga, P. Functional data analysis approach for mapping change in time series: A case study using bicycle ridership patterns. Transp. Res. Interdiscip. Perspect. 2023, 17, 100752. [Google Scholar] [CrossRef]
- Ligęza, P. Reconstructing the trajectory of the object’s motion on the basis of measuring the components of its velocity. Measurement 2023, 221, 113546. [Google Scholar] [CrossRef]
- Alahi, A.; Goel, K.; Ramanathan, V.; Robicquet, A.; Li, F.; Savarese, S. Social LSTM: Human Trajectory Prediction in Crowded Spaces. In Proceedings of the 2016 IEEE Conference on Computer Vision and Pattern Recognition (CVPR), Las Vegas, NV, USA, 27–30 June 2016; pp. 961–971. [Google Scholar] [CrossRef]
- Karamoozian, A.; Wu, D.; Luo, C. Green Supplier Selection in the Construction Industry Using a Novel Fuzzy Decision-Making Approach. J. Constr. Eng. Manag. 2023, 149, 04023033. [Google Scholar] [CrossRef]
Figure 1.
Schematic diagram of IMU-based scaffolding worker safety tethering action data acquisition.
Figure 1.
Schematic diagram of IMU-based scaffolding worker safety tethering action data acquisition.
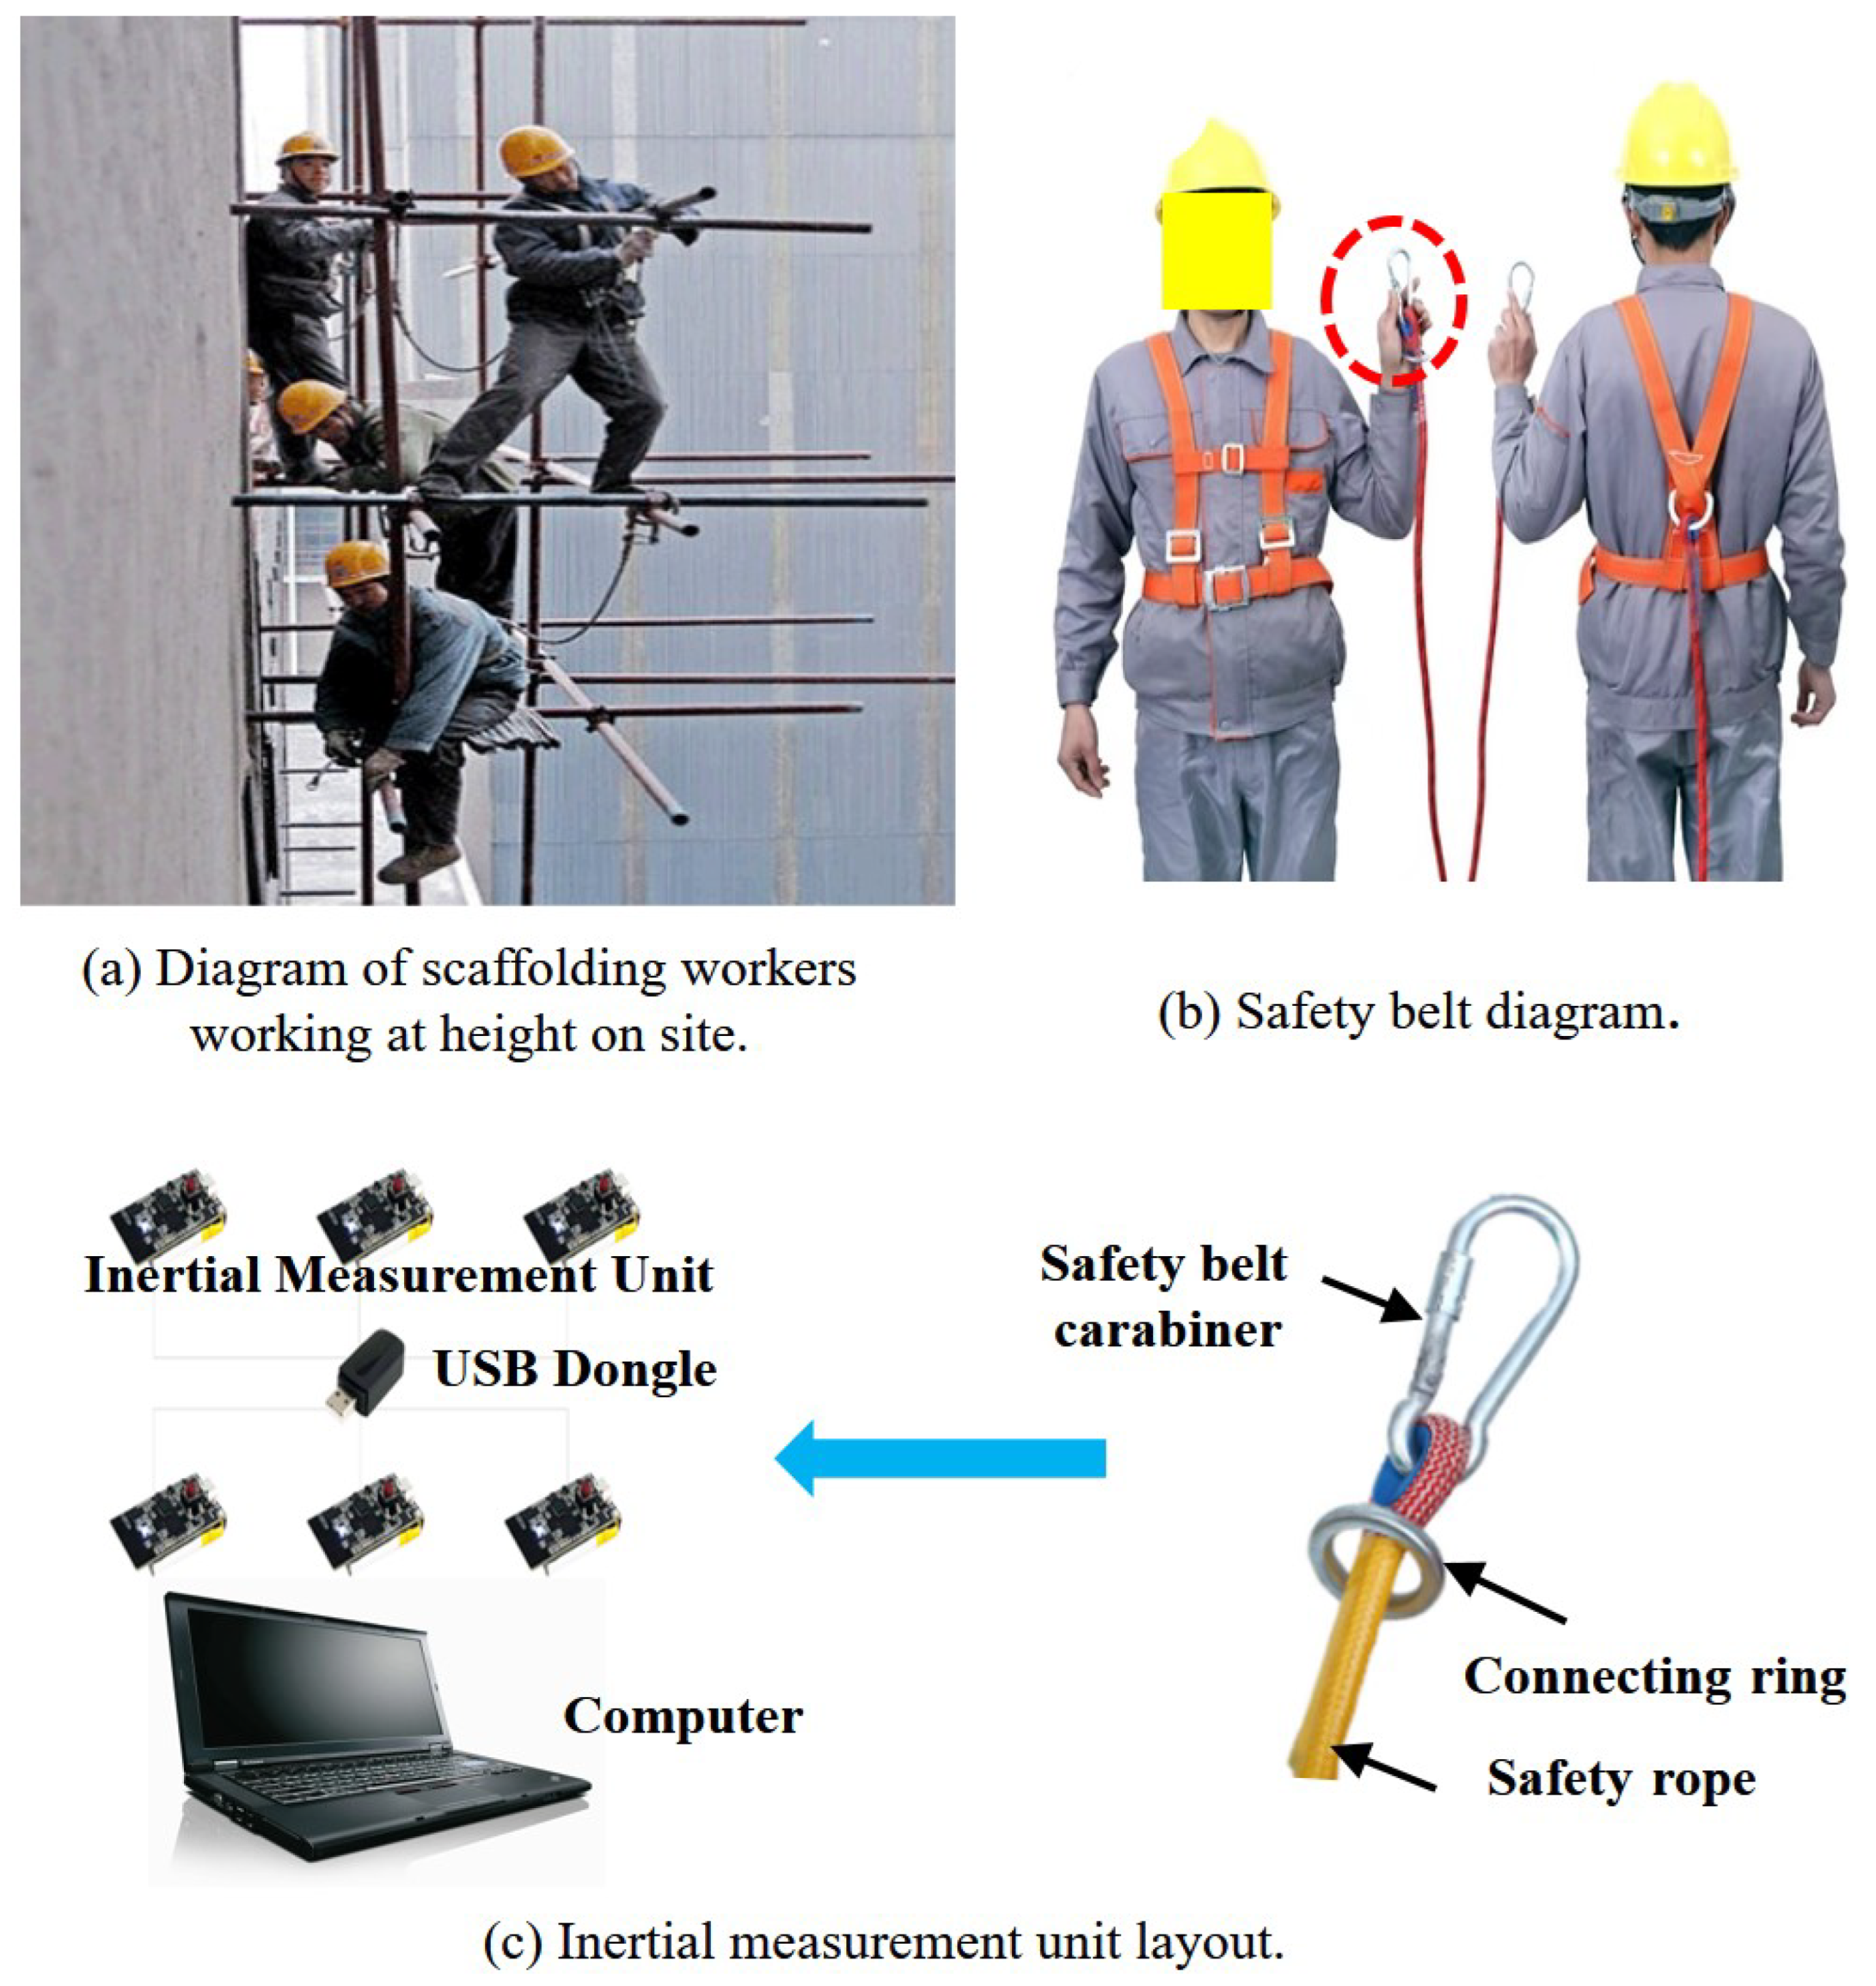
Figure 2.
Field test of safety rope fastening.

Figure 3.
Three−axis acceleration curve.
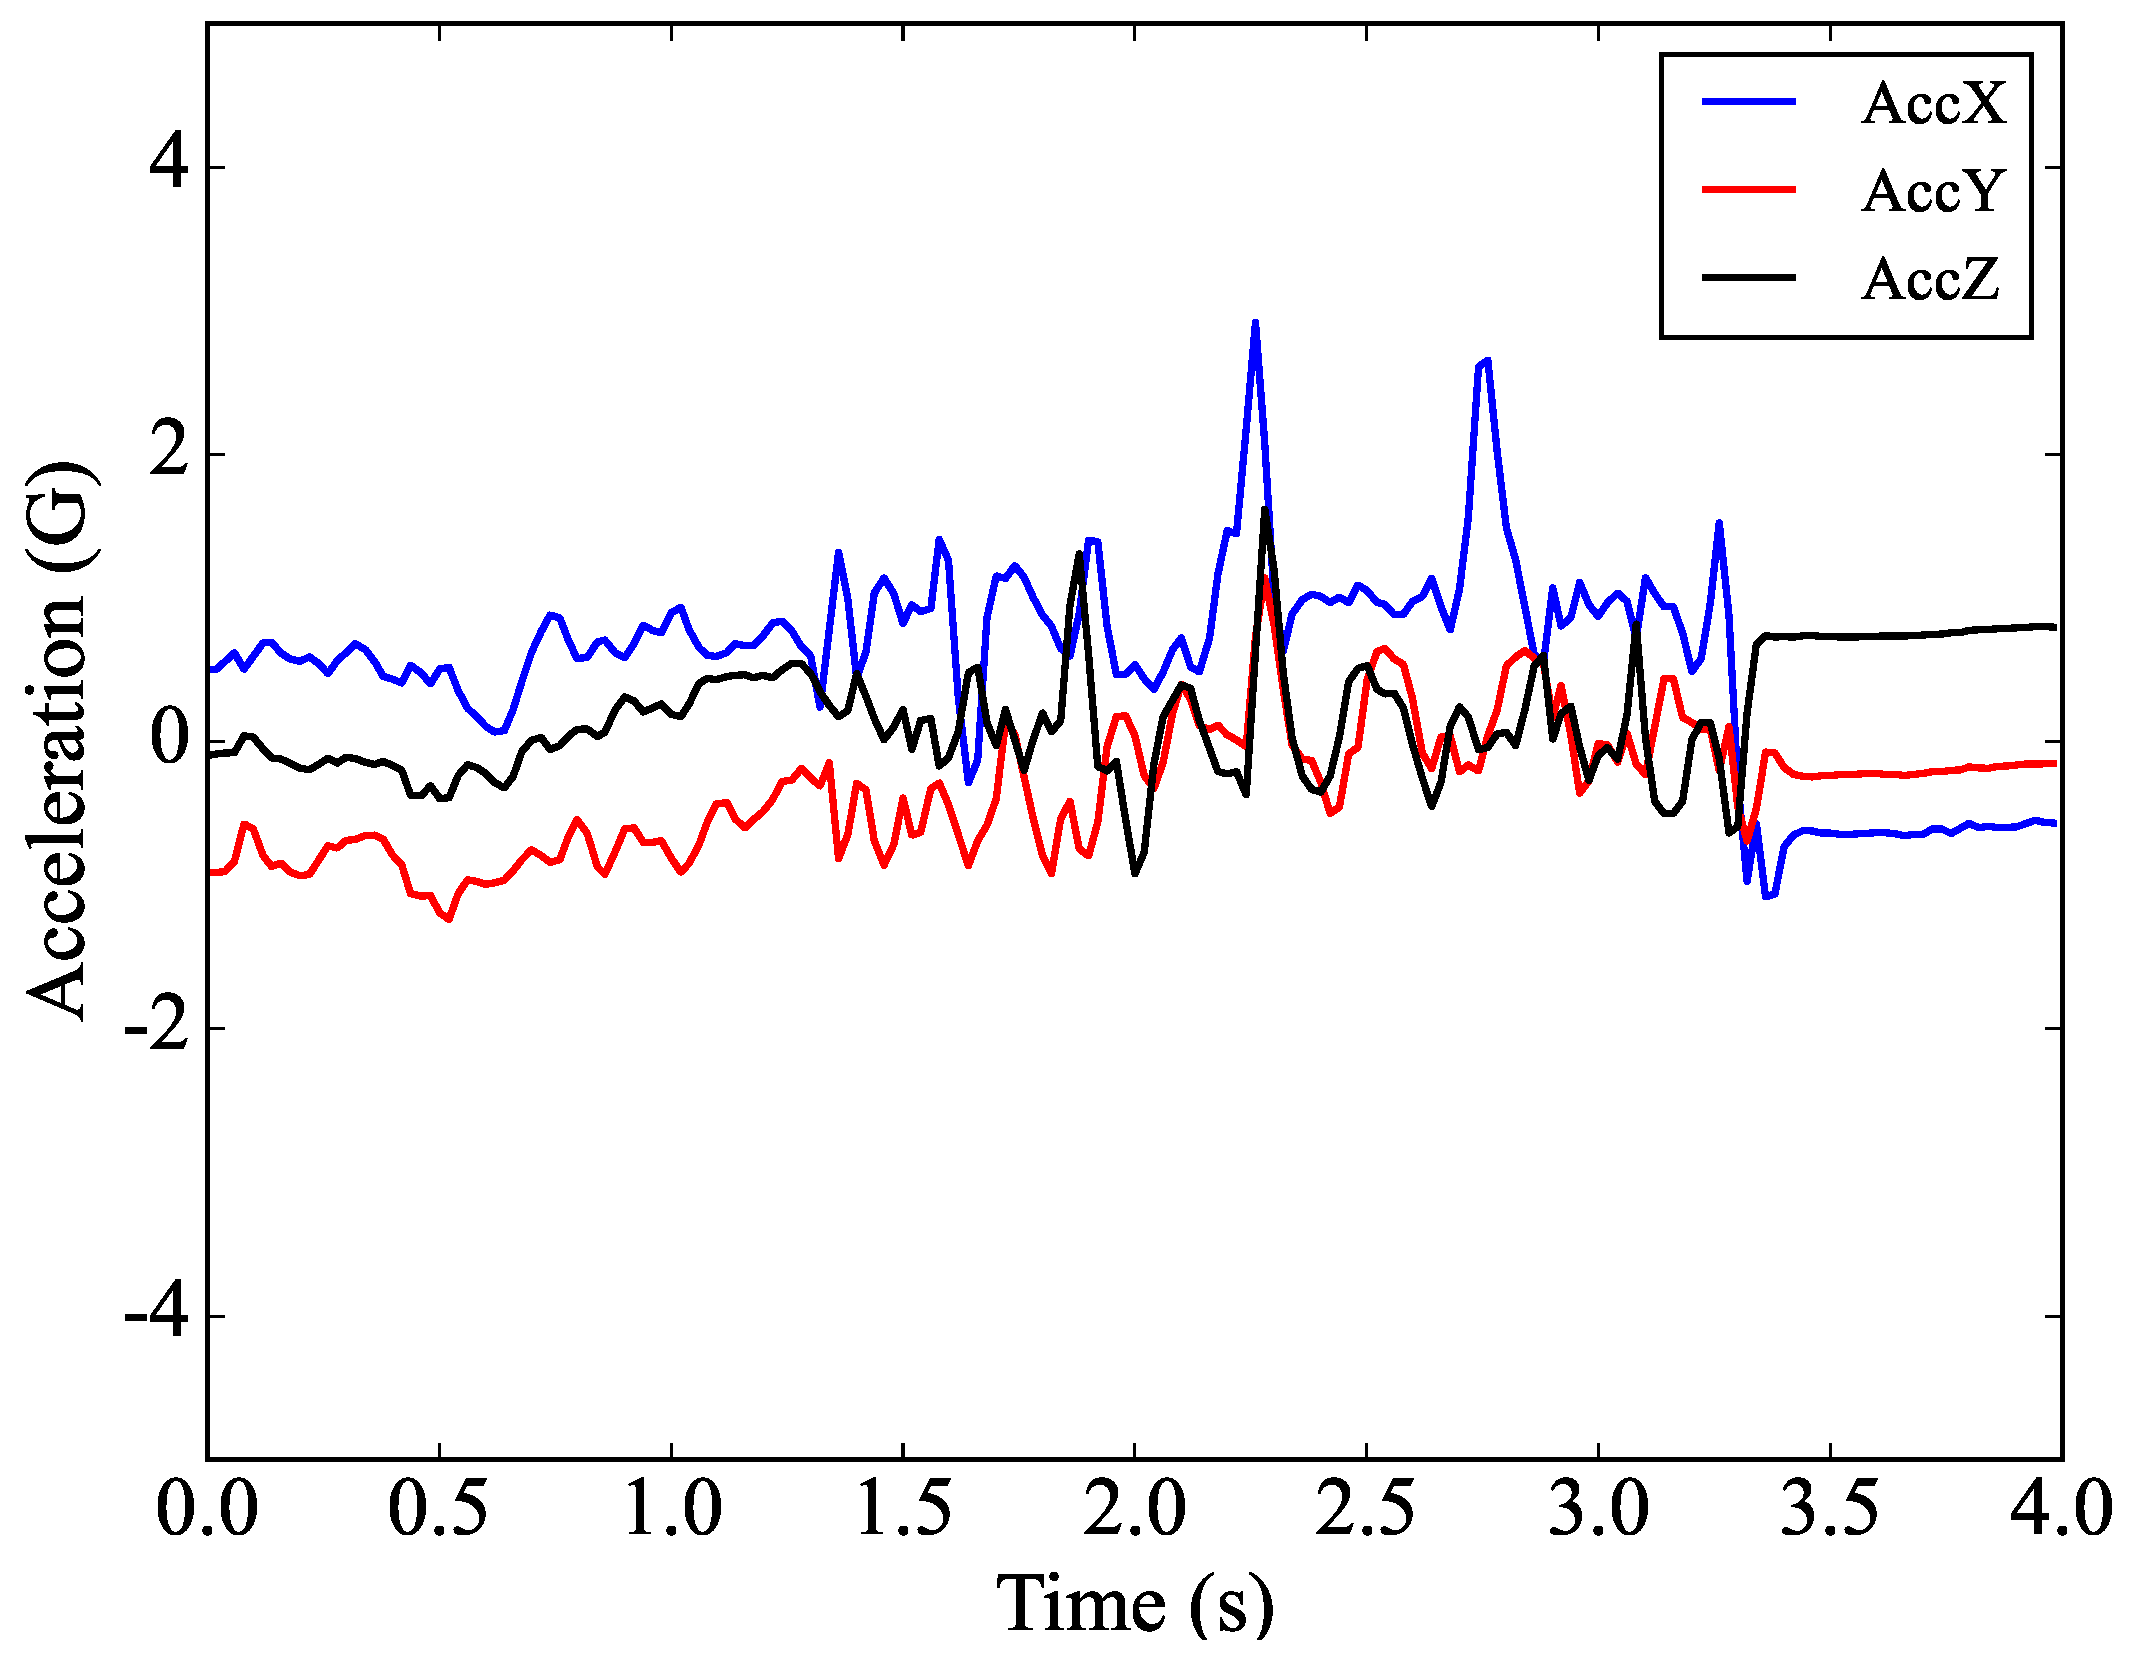
Figure 4.
Angular velocity curve based on three−axis gyroscope data.

Figure 5.
Three−axis magnetic induction curve.
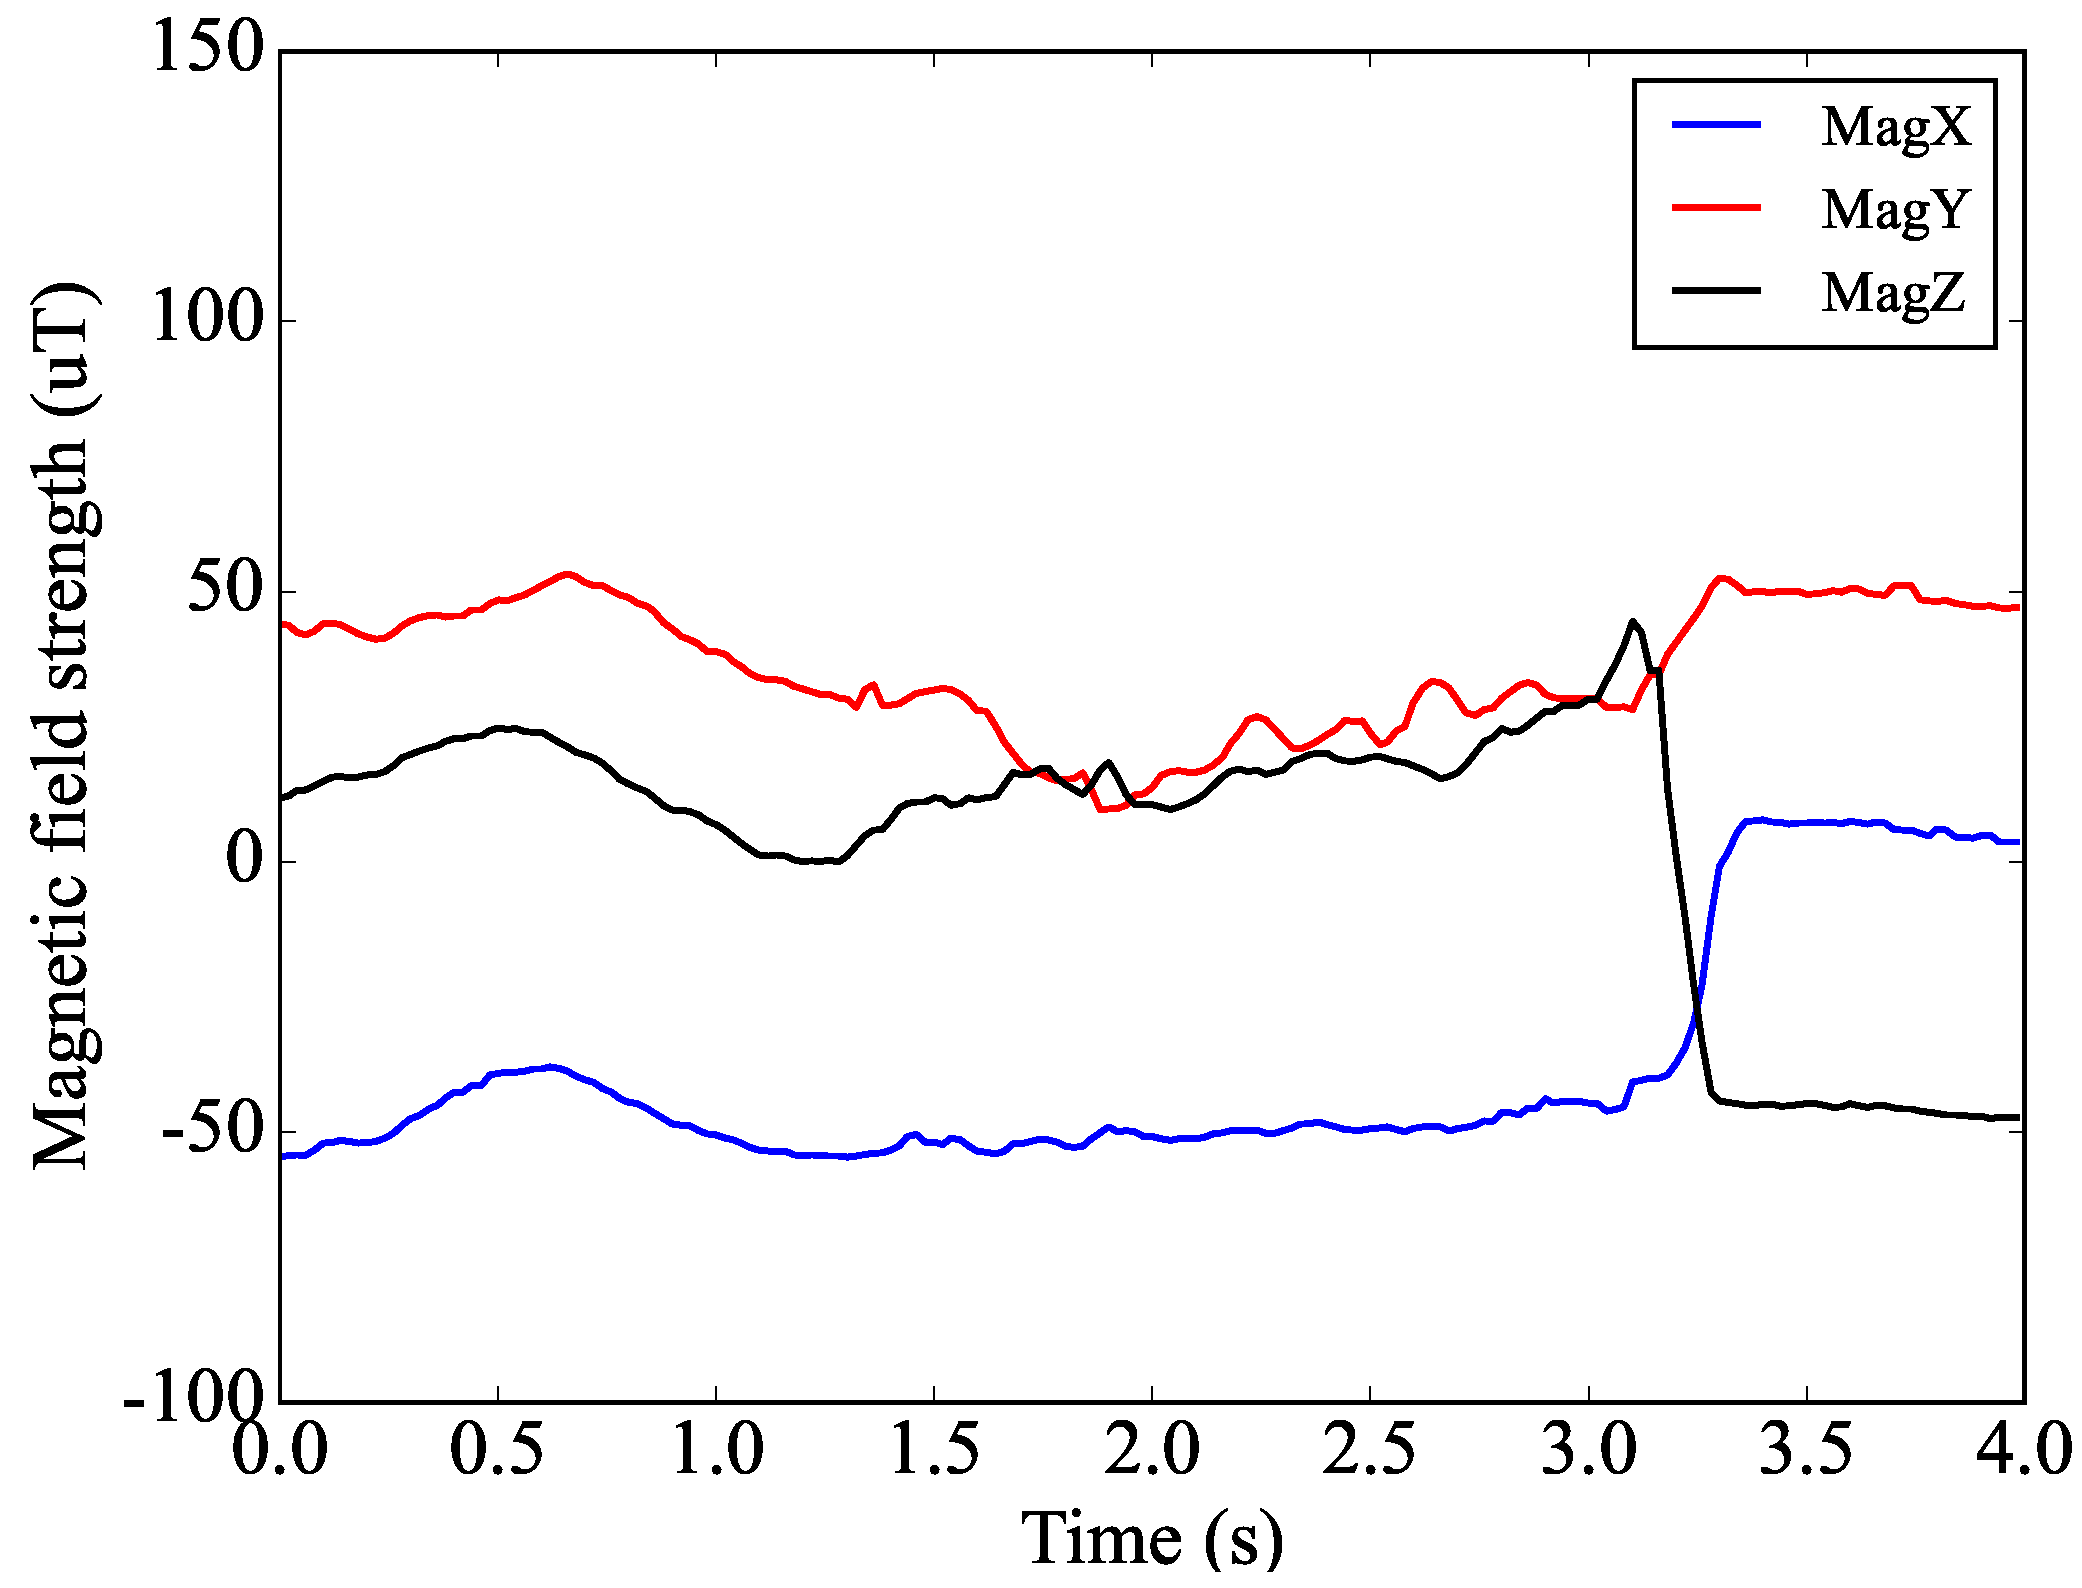
Figure 6.
Three−axis resultant acceleration.
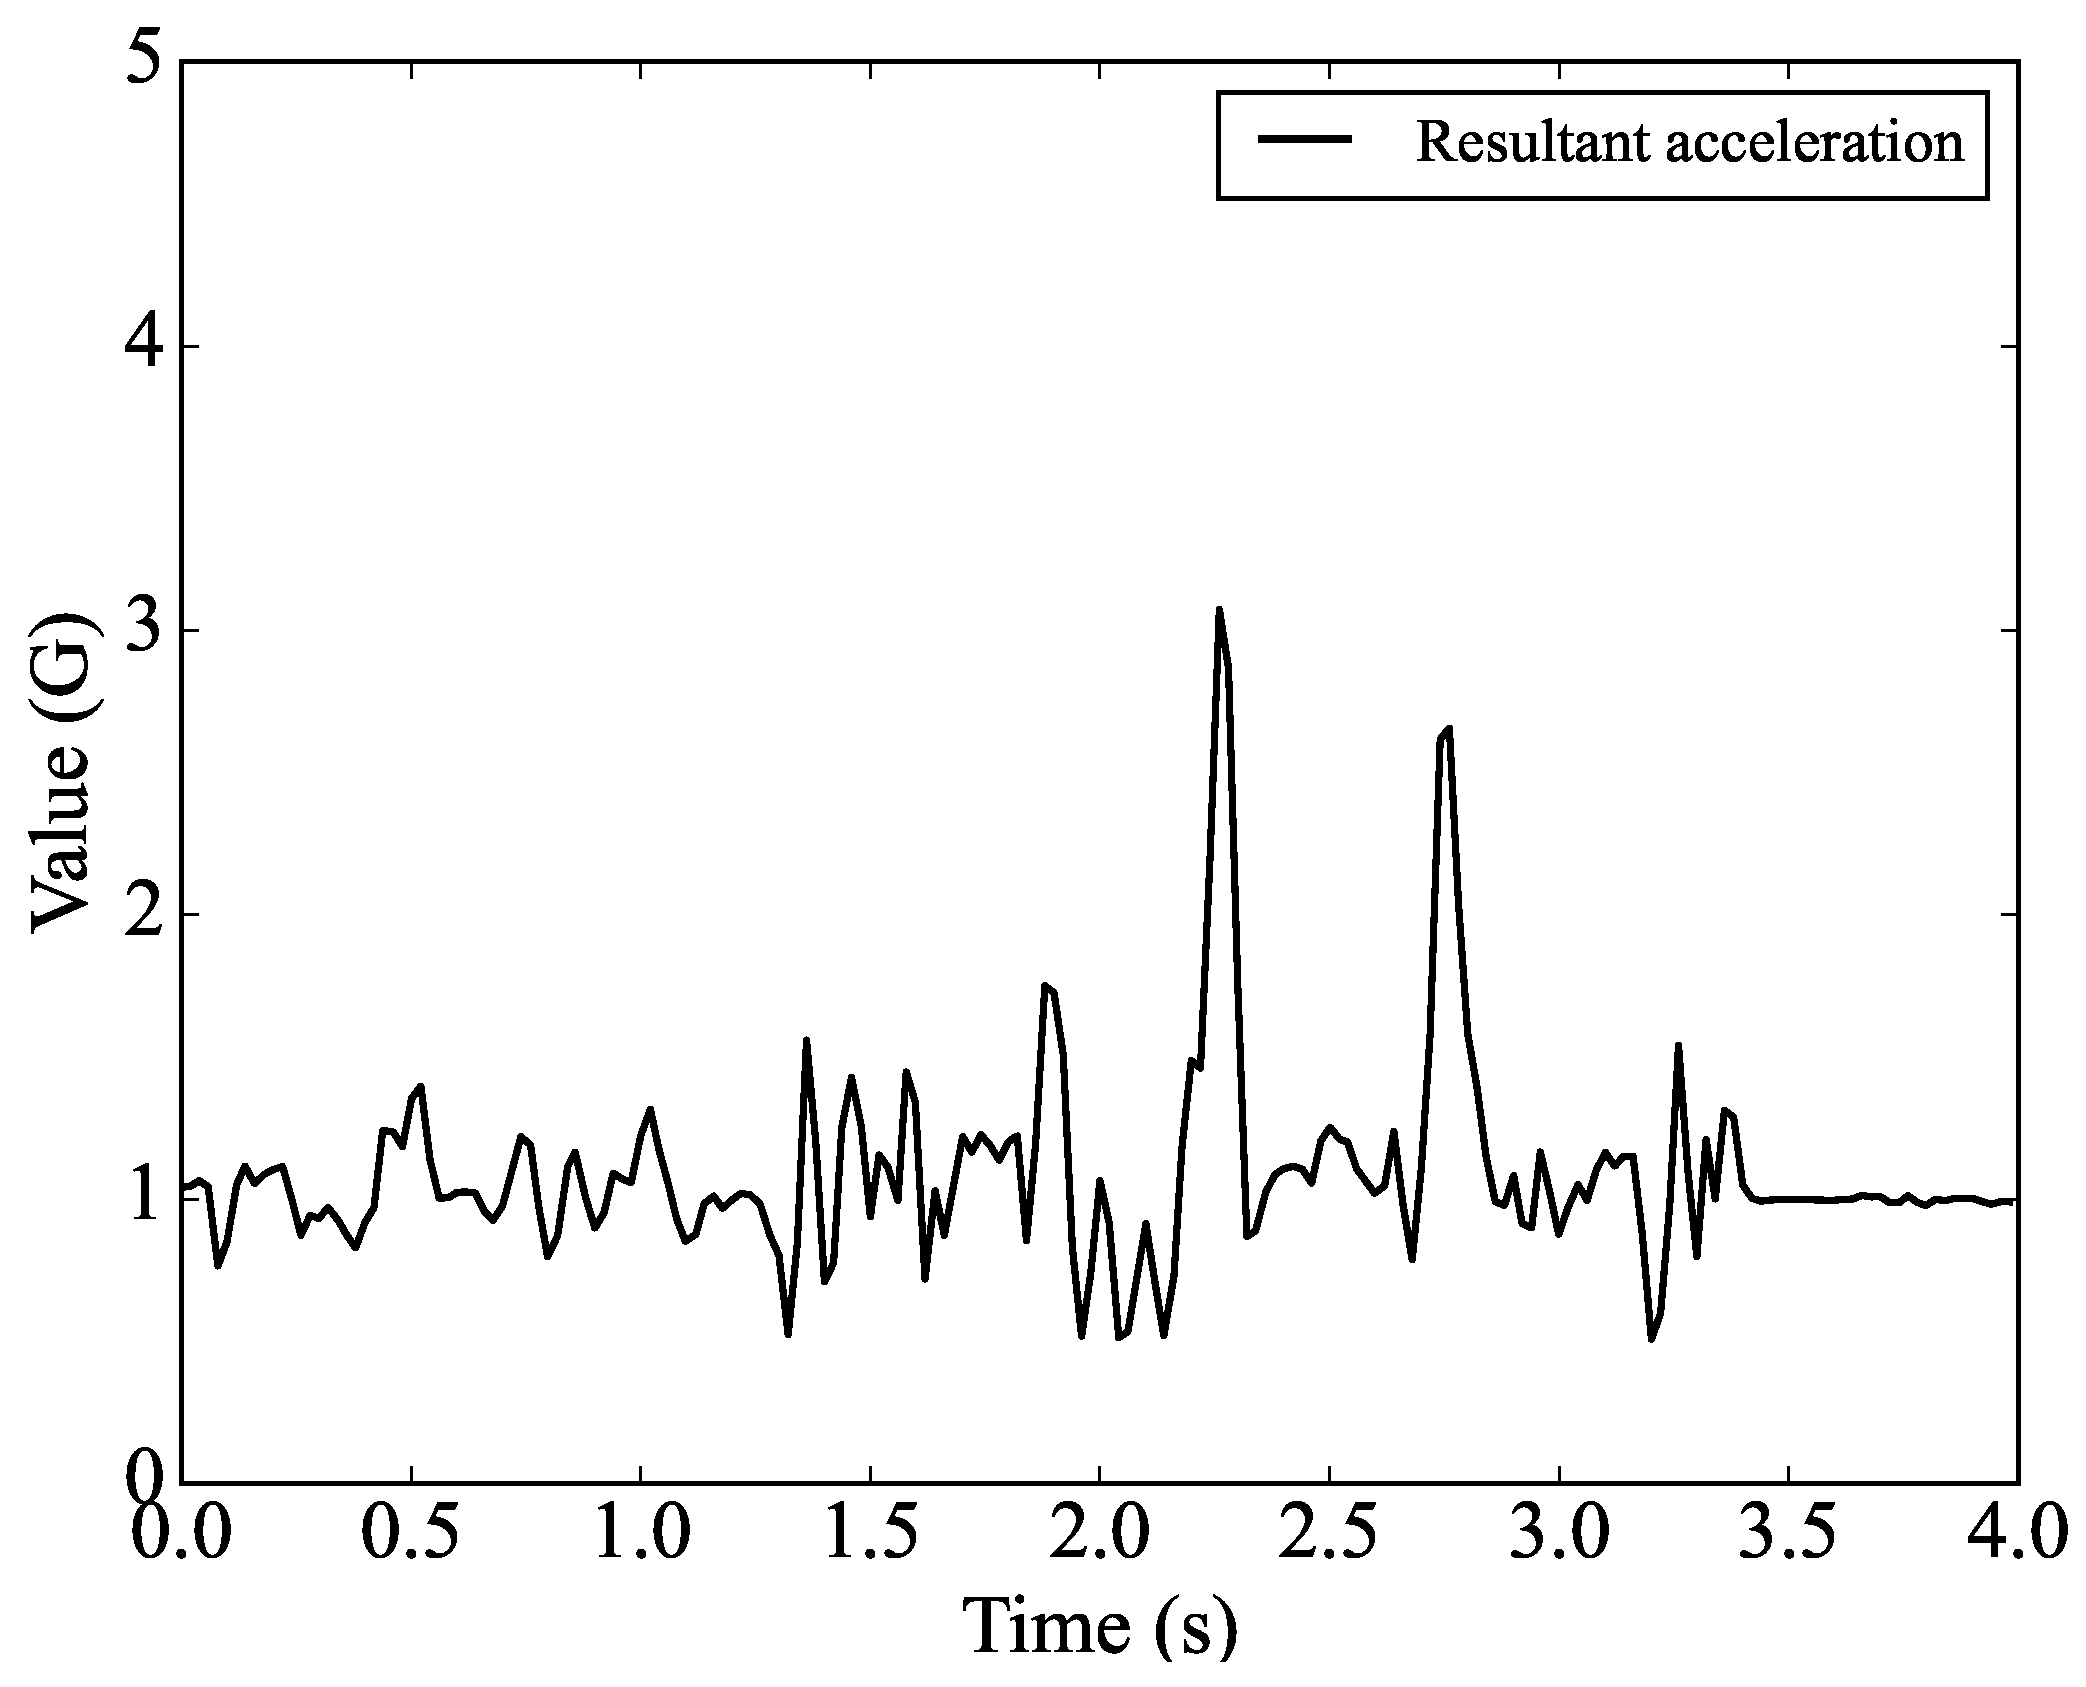
Figure 7.
Three−axis resultant angular velocity.
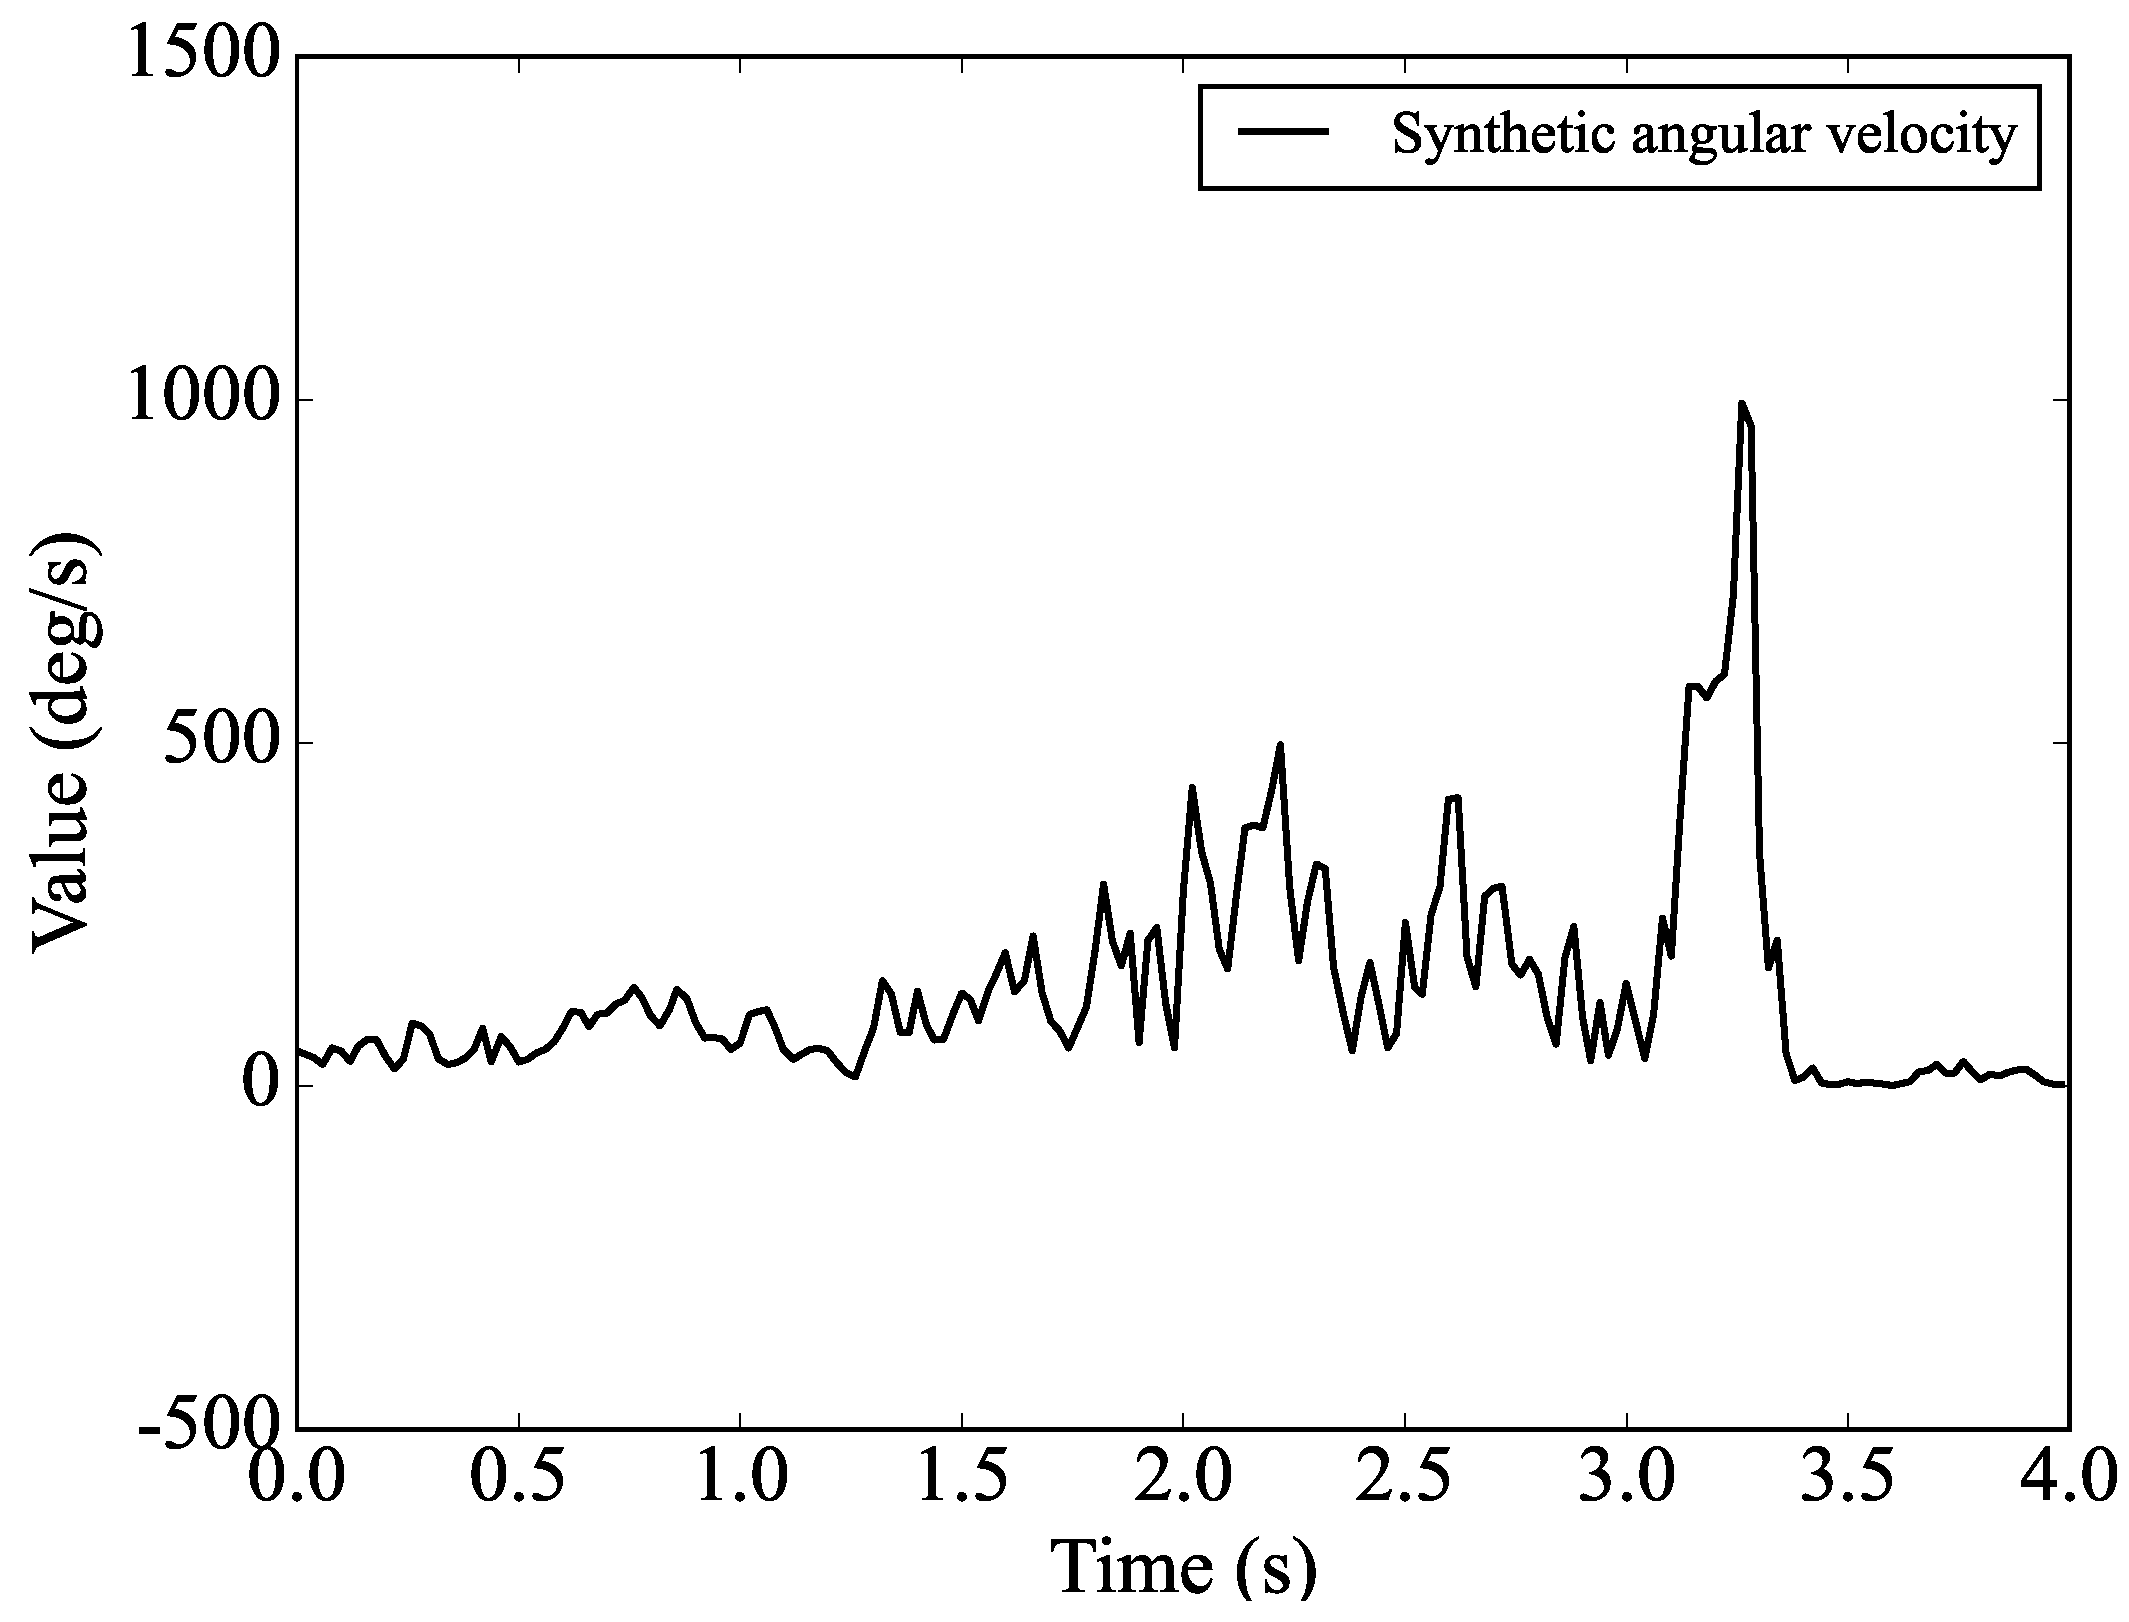
Figure 8.
Three−axis composite magnetic induction.
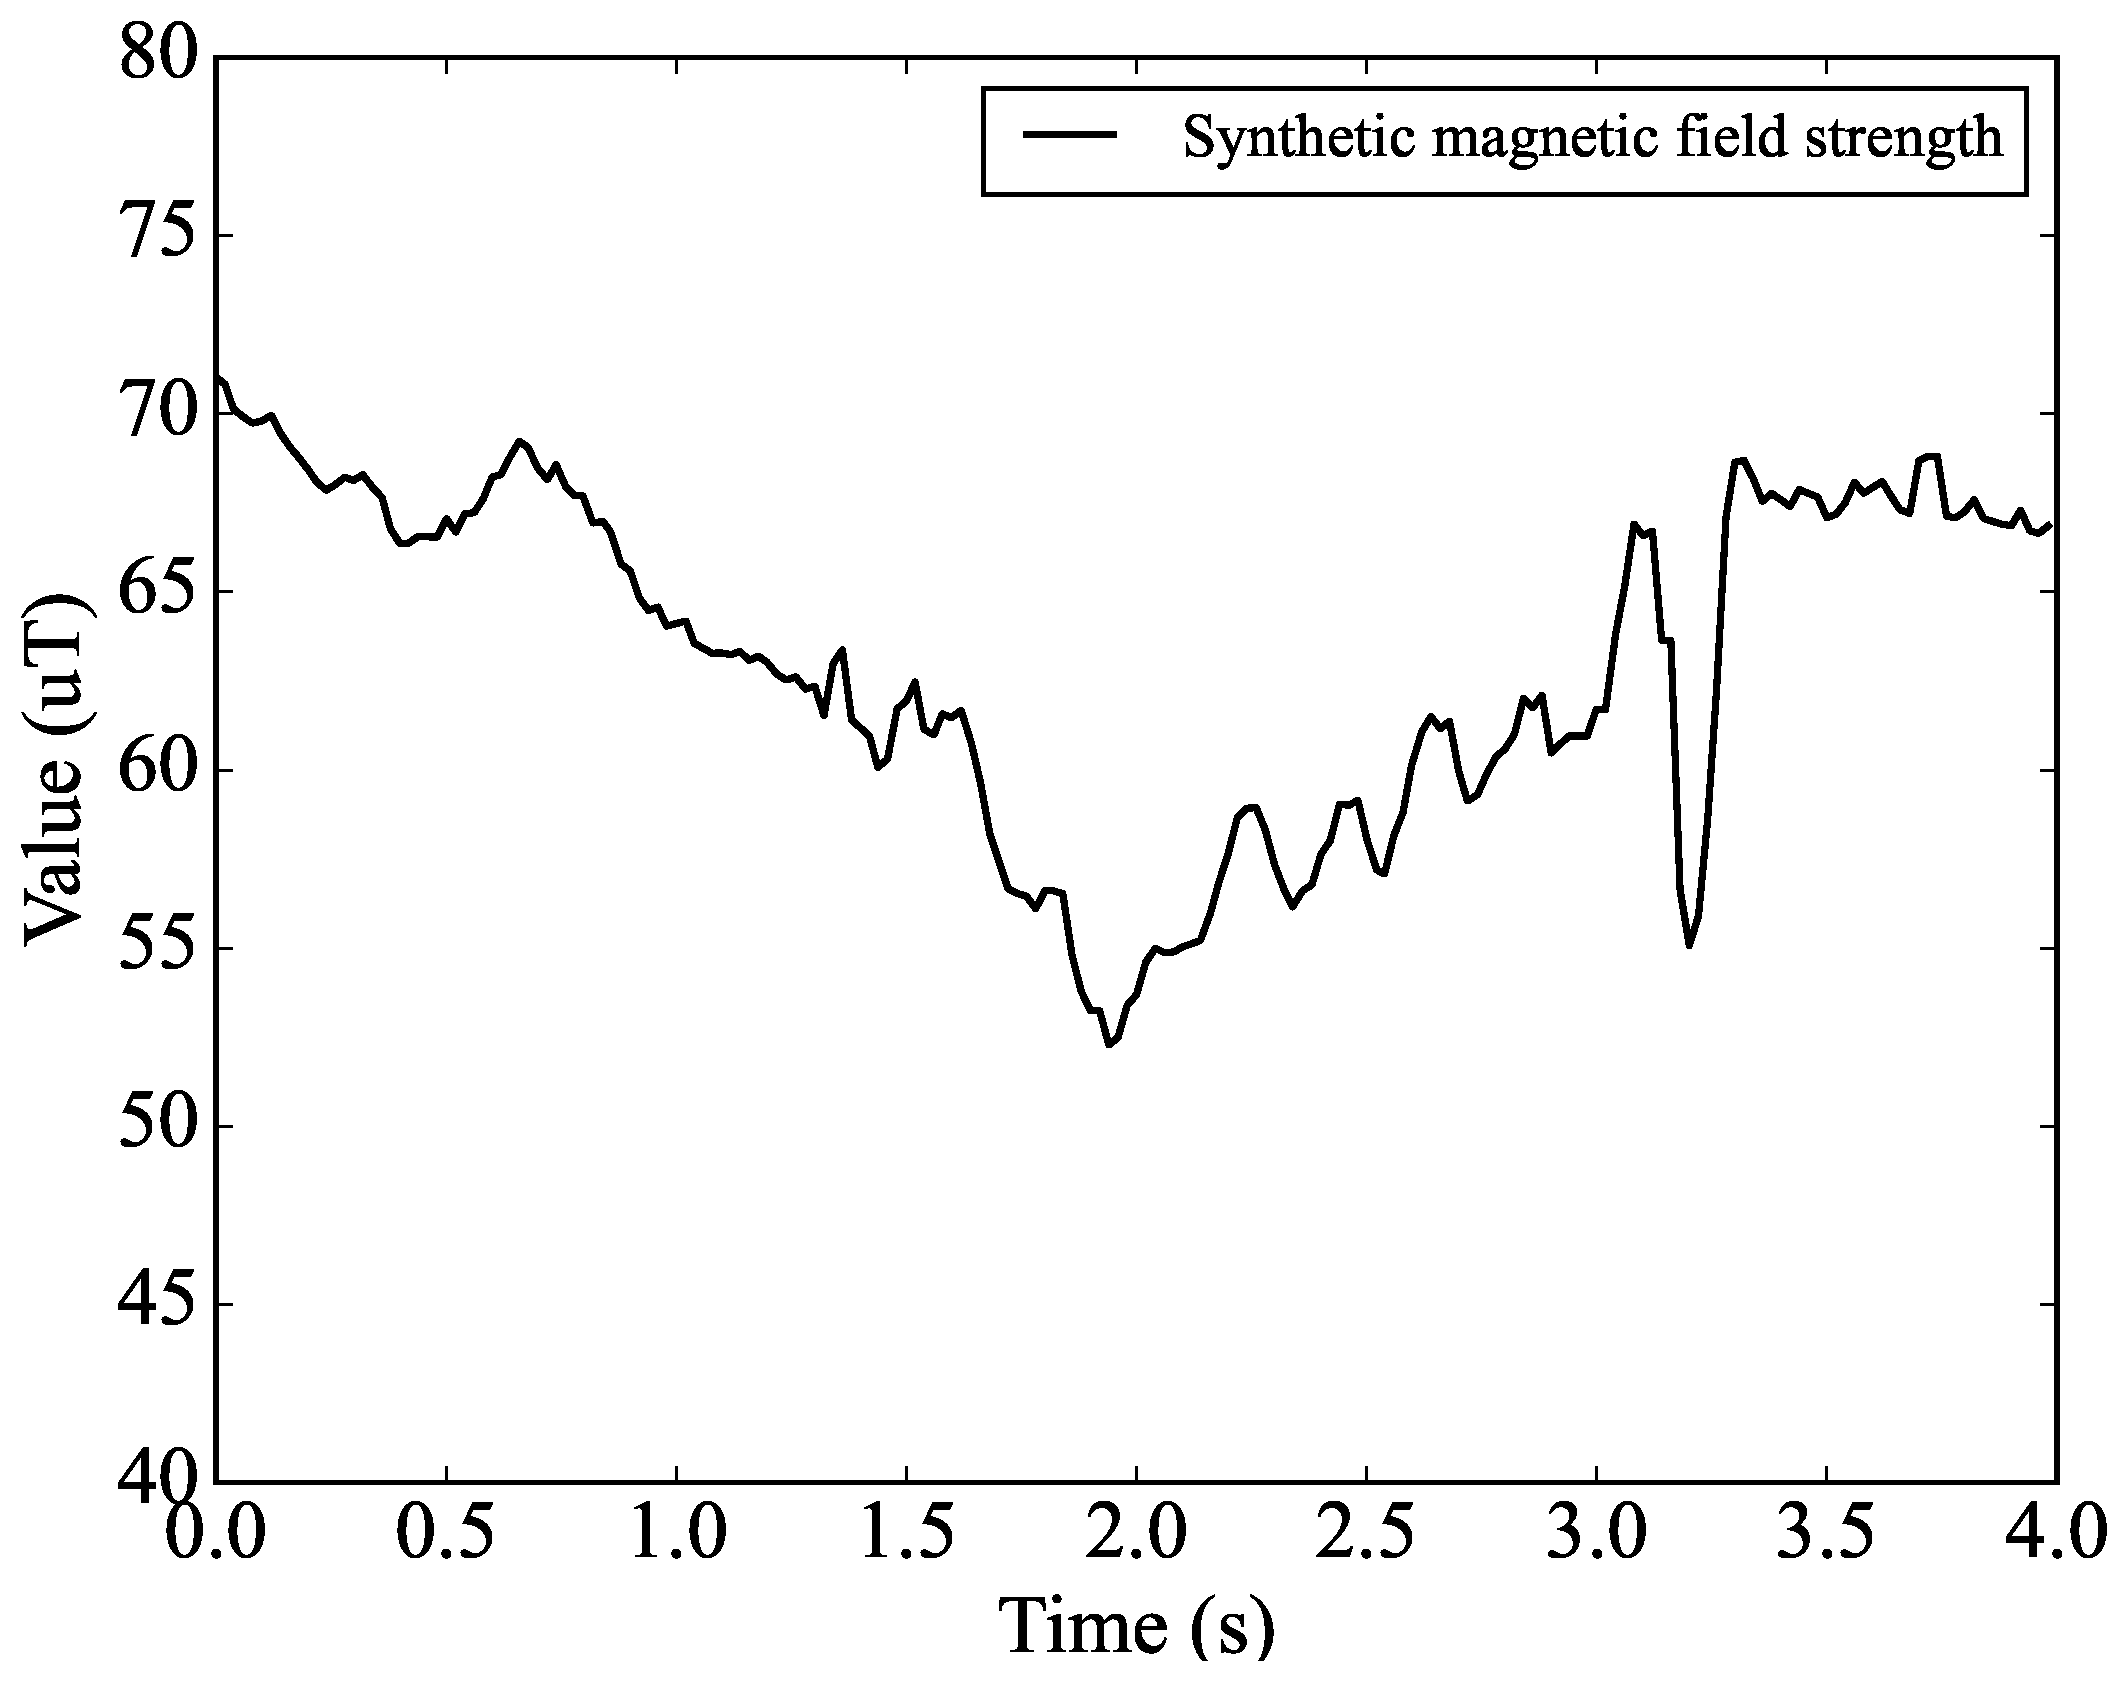
Figure 9.
Attitude angle of the safety rope buckle fastening action.
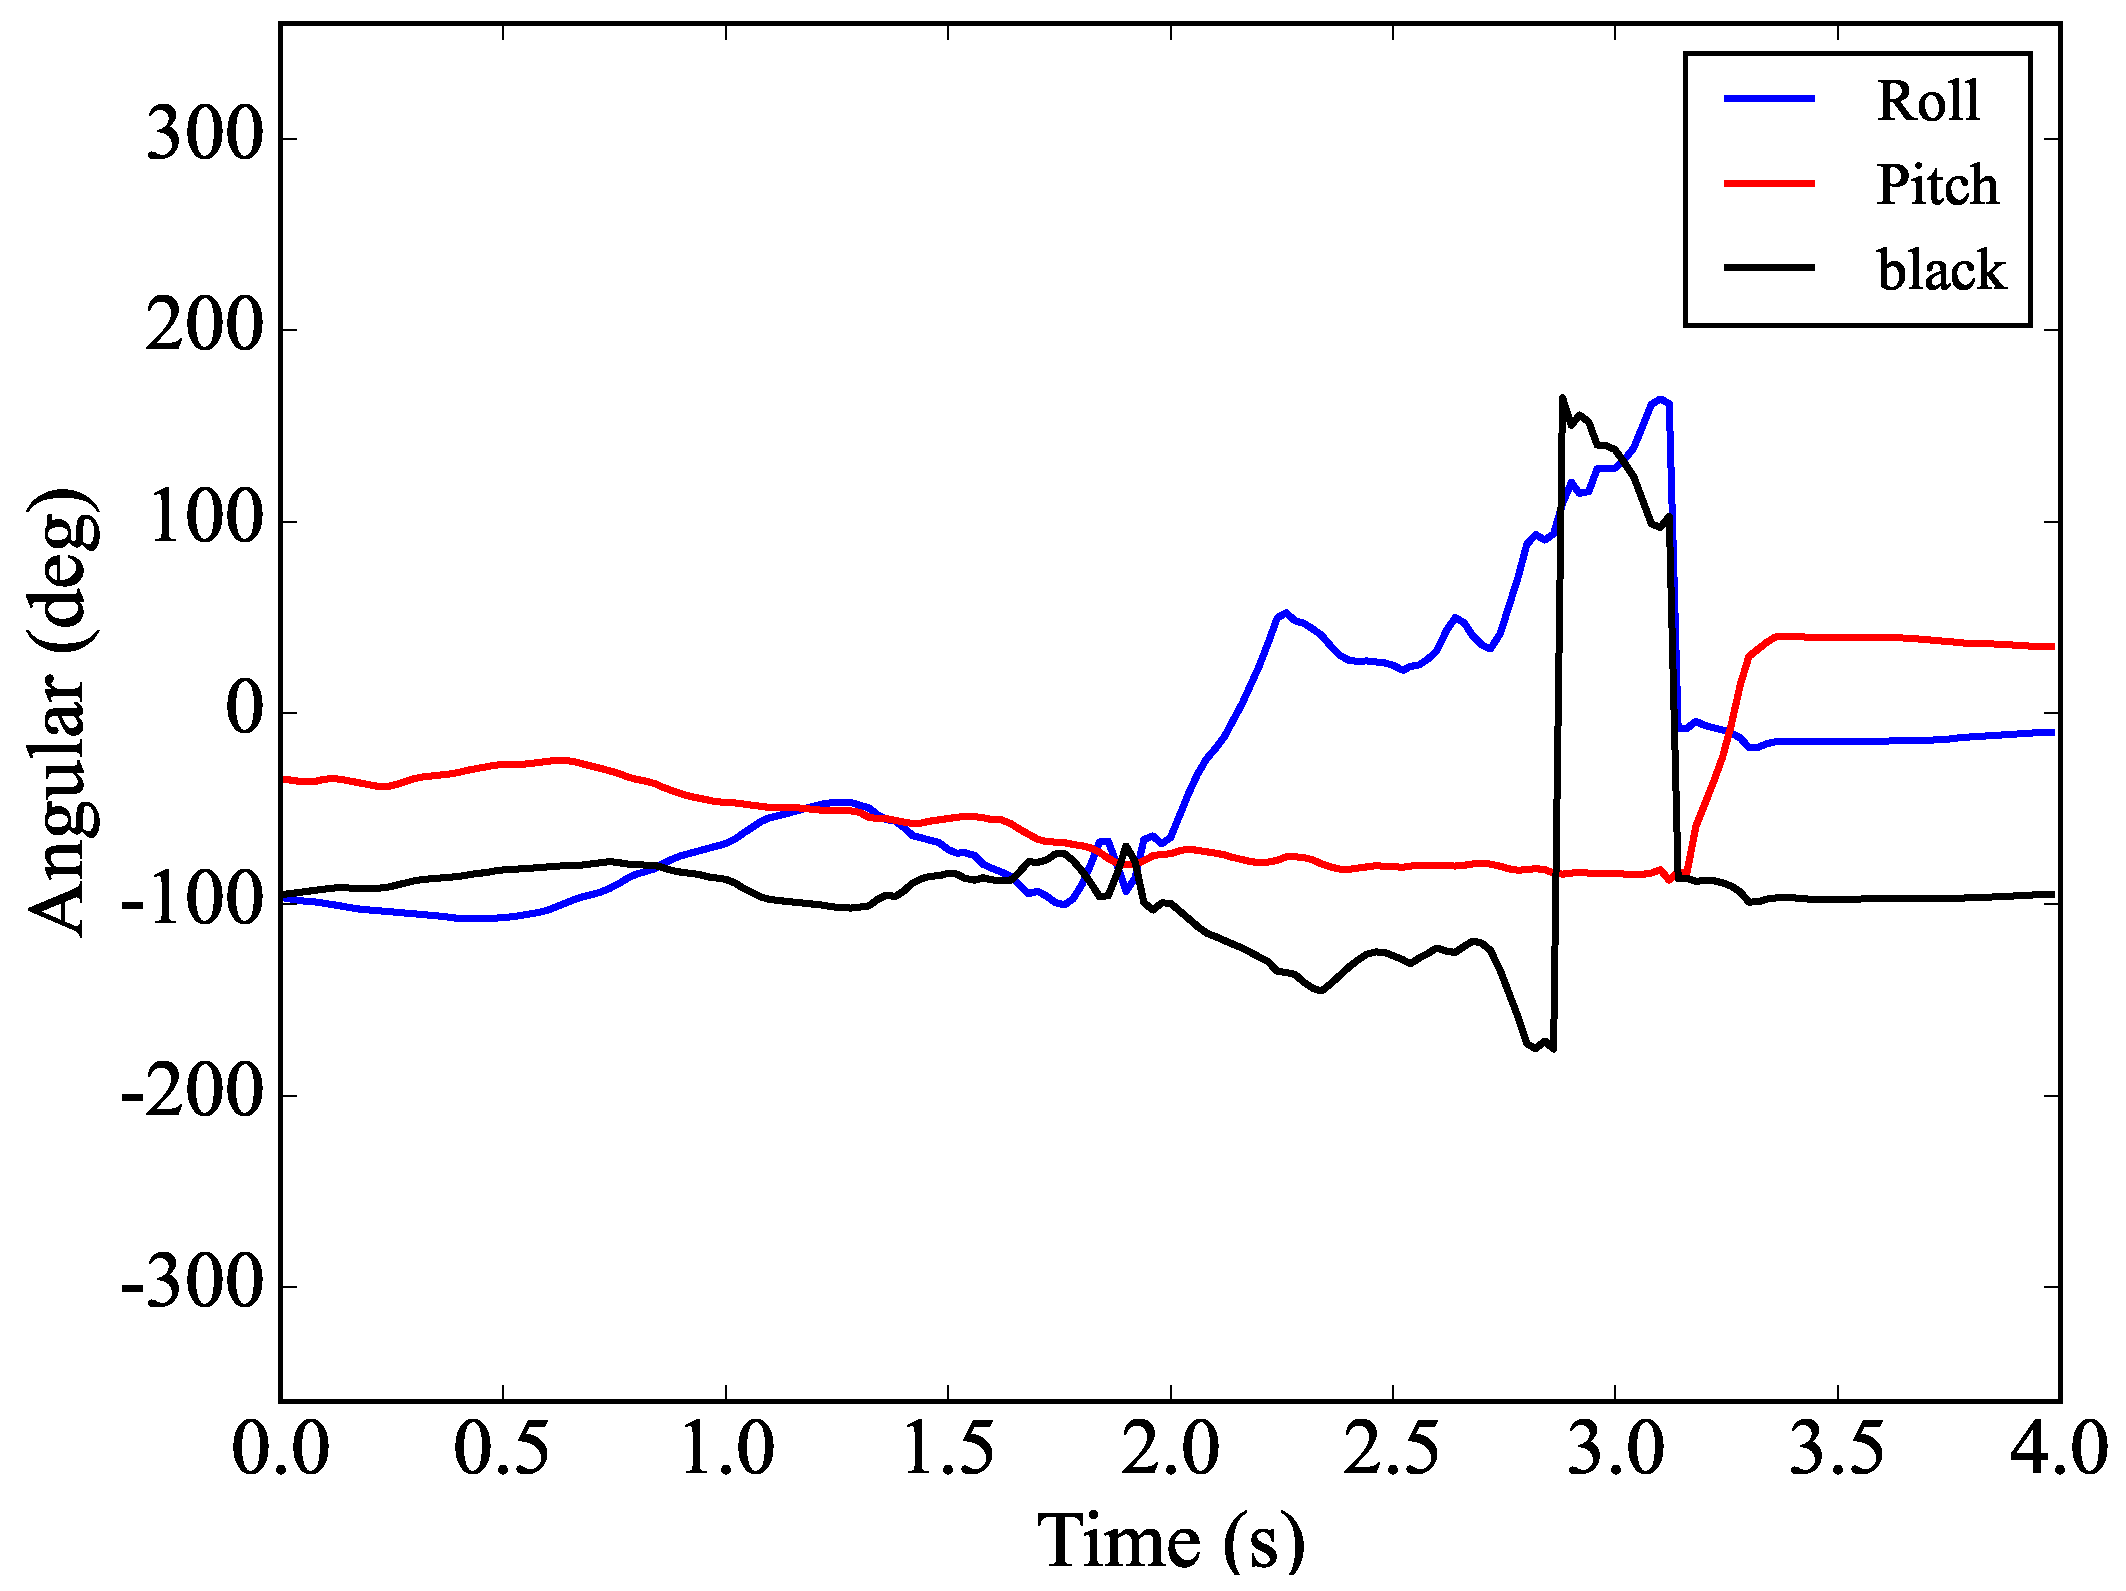
Figure 10.
Changes in the safety harness screw rotation vector.
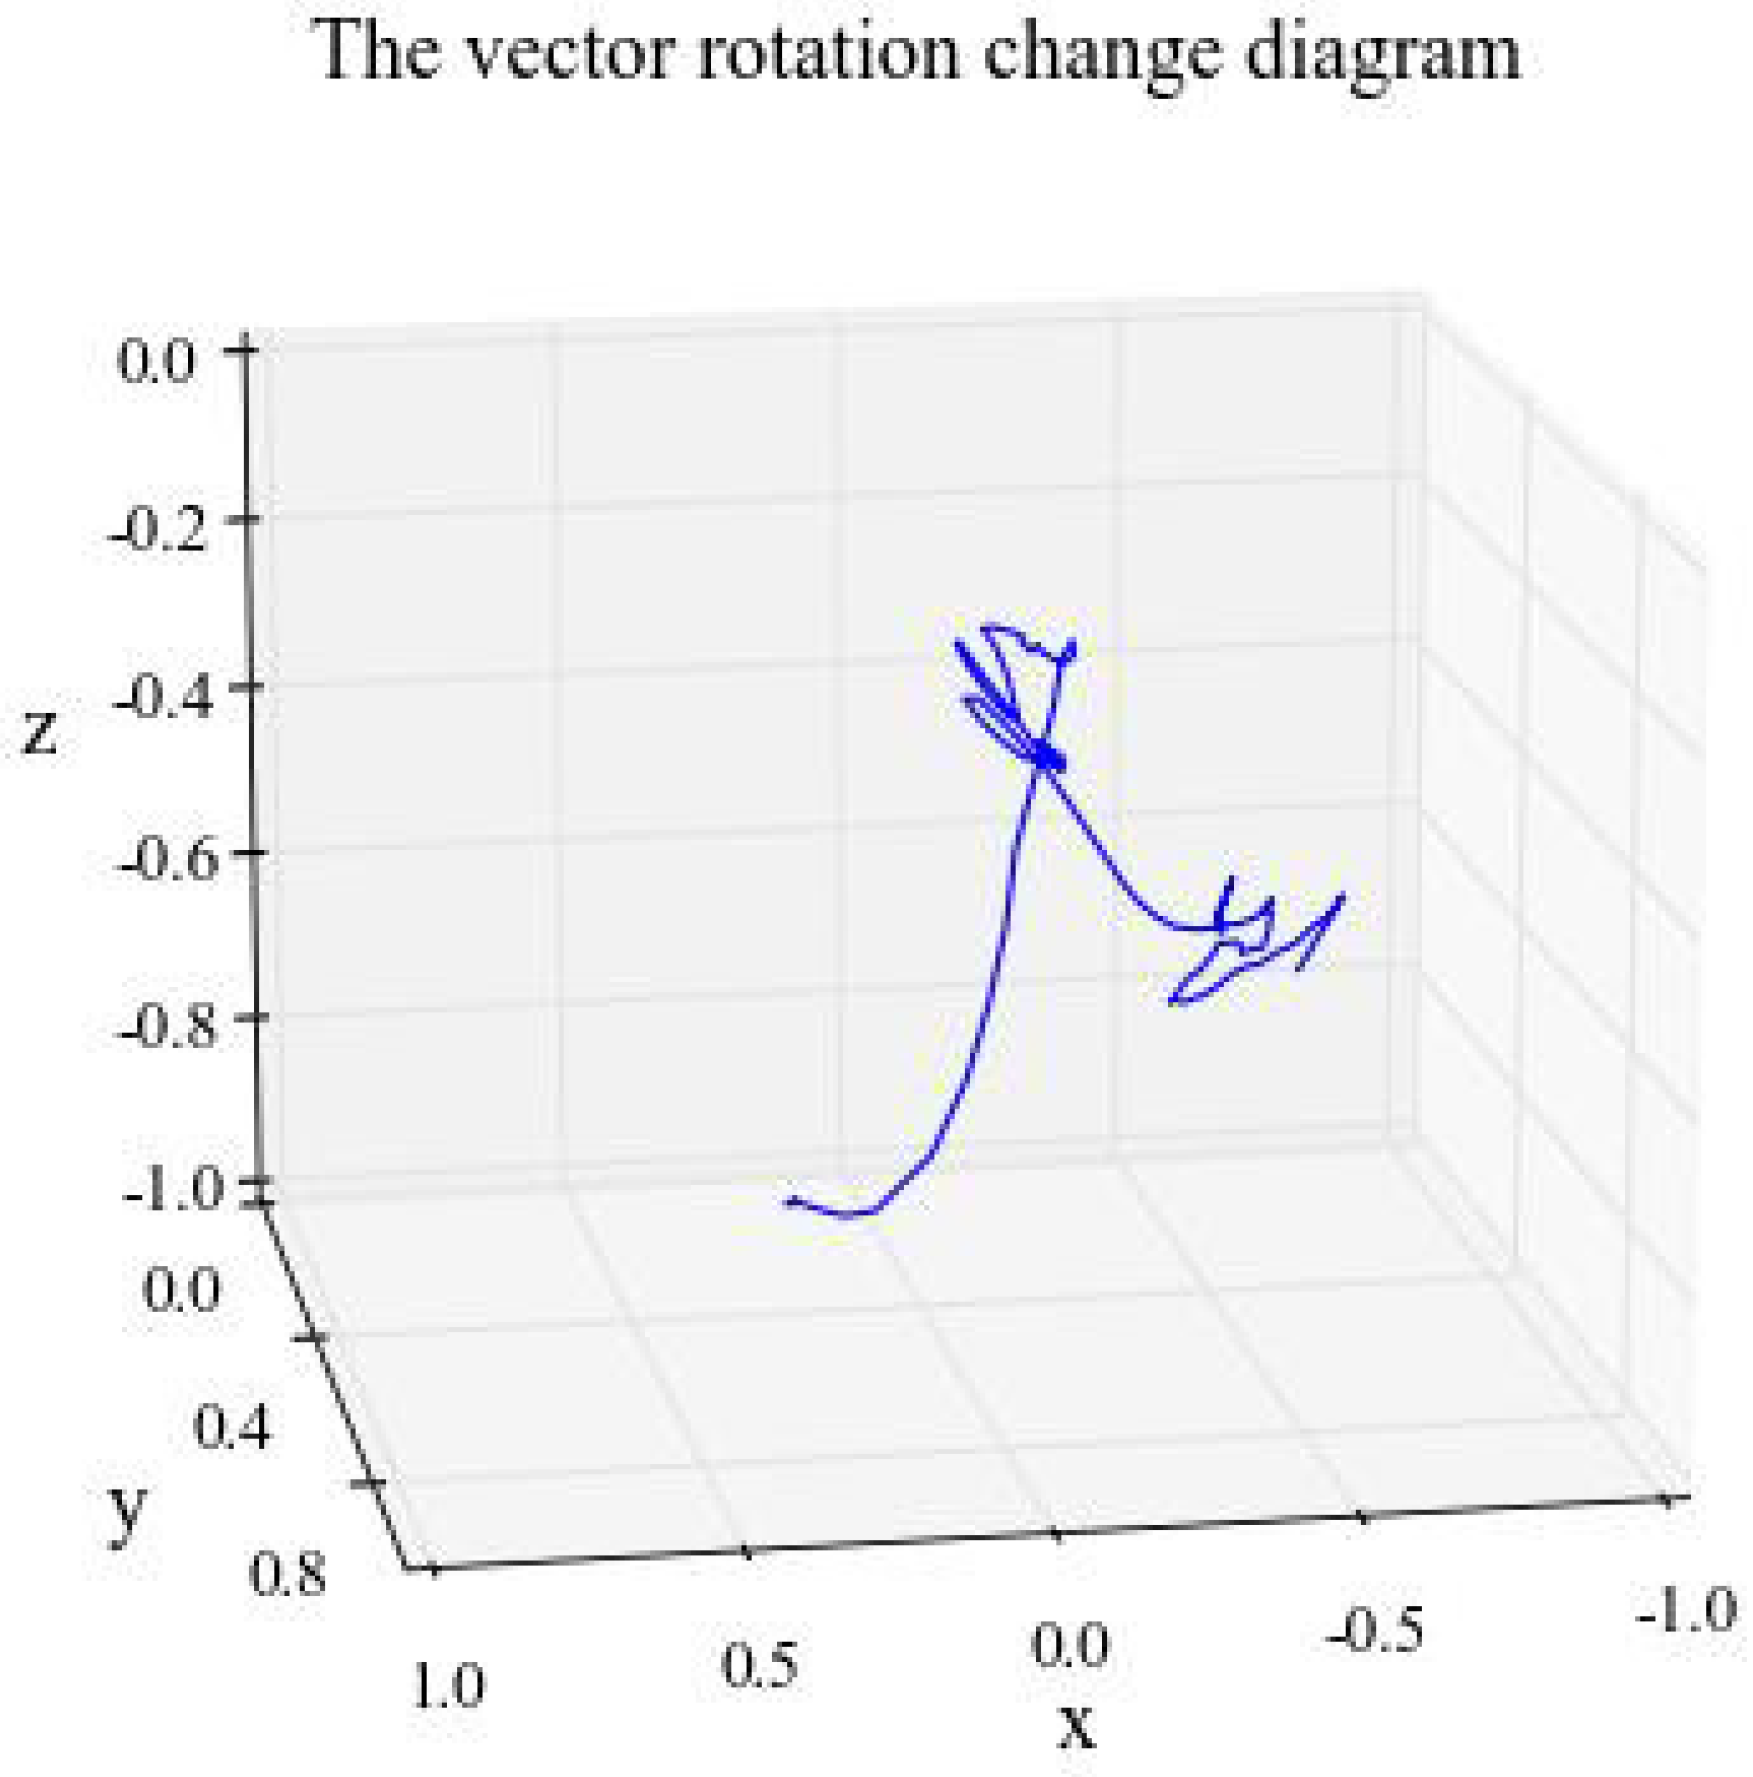
Figure 11.
Projection changes of the unit vector along three axes during the rotation process.

Figure 12.
Movement diagram for safety rope attachment.
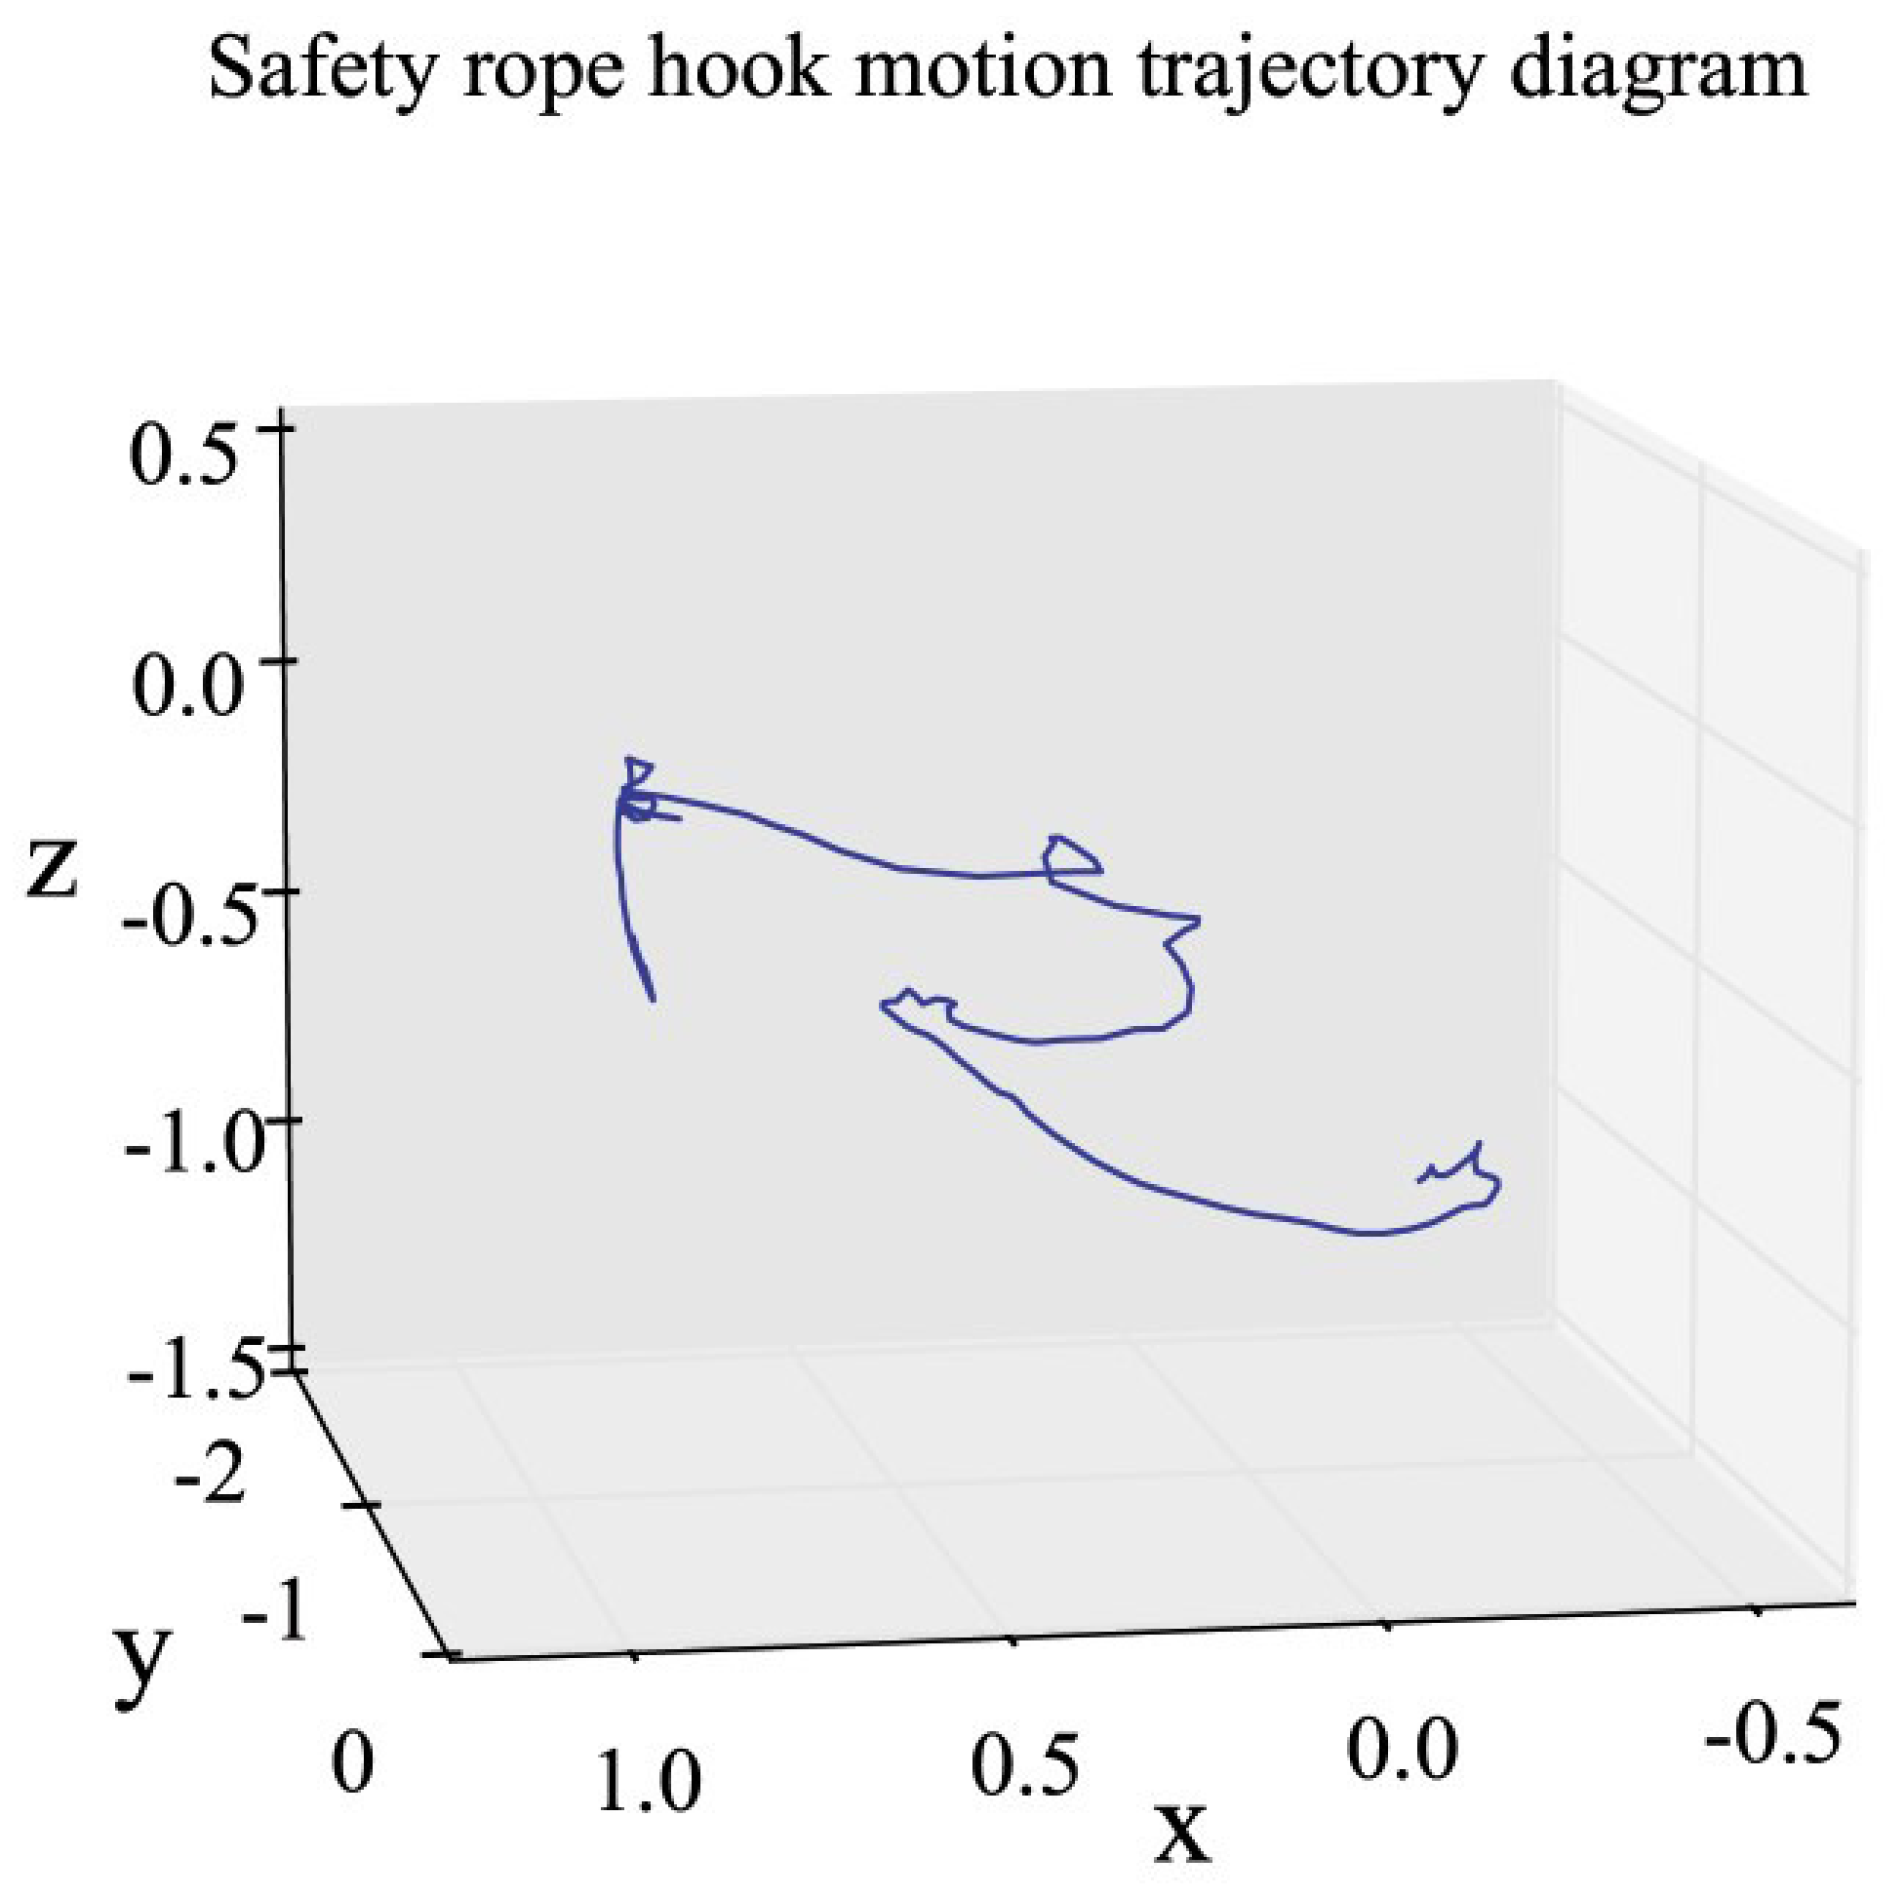
Figure 13.
Diagram of safety rope attachment trajectories in each dimension.

Table 1.
Some of the raw data collected using the IMU. (Time (ms), Acc(0) [G], Gyr(0) [deg/s], Mag(0) [uT]).
Table 1.
Some of the raw data collected using the IMU. (Time (ms), Acc(0) [G], Gyr(0) [deg/s], Mag(0) [uT]).
| Time | AccX(0) | AccY(0) | AccZ(0) | GyrX(0) | GyrY(0) | GyrZ(0) | MagX(0) | MagY(0) | MagZ(0) |
|---|---|---|---|---|---|---|---|---|---|
| 0 | −0.14 | −0.412 | 0.37 | −79.6 | 20.5 | −74.1 | 24.5 | 72.3 | −10.2 |
| 0.02 | −0.198 | −0.213 | 0.423 | −76.9 | −5.1 | −56.2 | 23.2 | 73 | −8.6 |
| 0.038 | −0.262 | −0.172 | 0.363 | −98.8 | −21.2 | −39.4 | 22.6 | 73.6 | −7.2 |
| 0.058 | −0.263 | −0.304 | 0.316 | −107.1 | −19.8 | −27.7 | 21.7 | 74 | −6.2 |
| 0.079 | −0.199 | −0.471 | 0.361 | −98.2 | −9.7 | −14.8 | 20.9 | 74 | −4.4 |
| 0.099 | −0.259 | −0.562 | 0.414 | −78.2 | −1.6 | −26 | 19.6 | 73.9 | −2.9 |
| 0.12 | −0.319 | −0.573 | 0.437 | −98.2 | 16.6 | −35.4 | 18.5 | 73.7 | −1.5 |
| 0.138 | −0.314 | −0.523 | 0.478 | −138.1 | 28.6 | −40.2 | 16.9 | 73.5 | 0.3 |
| 0.159 | −0.238 | −0.655 | 0.516 | −85.7 | 51.9 | −6.5 | 15.8 | 73.2 | 2.3 |
| 0.179 | −0.318 | −0.981 | 0.598 | −3.4 | 66.2 | 32.7 | 15.5 | 72.8 | 3.1 |
| 0.2 | −0.393 | −1.127 | 0.53 | −22.3 | 54.2 | 73.2 | 15.1 | 72.2 | 3.4 |
| 0.22 | −0.363 | −1.085 | 0.408 | 10.8 | 55.9 | 67.6 | 15.7 | 71.7 | 3.7 |
| 0.24 | −0.583 | −0.958 | 0.516 | 4.4 | 0.2 | 31 | 16.8 | 71.4 | 3.6 |
| 0.26 | −0.479 | −0.639 | 0.595 | −59.2 | −37.5 | −29.1 | 17 | 71.6 | 3.8 |
| 0.28 | −0.065 | −0.277 | 0.61 | −131.7 | −2 | −6.9 | 16.4 | 71.3 | 5.4 |
| 0.29 | −0.09 | −0.114 | 0.614 | −111.6 | 17.3 | 71.8 | 17.2 | 69.7 | 7.6 |
Disclaimer/Publisher’s Note: The statements, opinions and data contained in all publications are solely those of the individual author(s) and contributor(s) and not of MDPI and/or the editor(s). MDPI and/or the editor(s) disclaim responsibility for any injury to people or property resulting from any ideas, methods, instructions or products referred to in the content. |
© 2024 by the authors. Licensee MDPI, Basel, Switzerland. This article is an open access article distributed under the terms and conditions of the Creative Commons Attribution (CC BY) license (https://creativecommons.org/licenses/by/4.0/).
Share and Cite
MDPI and ACS Style
Han, Z.; Wang, Y. Inertial Measurement Unit- and Time Series Approach-Based Motion Trajectory Reconstruction of the Safety Rope Fastening Behaviour. Buildings 2024, 14, 219. https://doi.org/10.3390/buildings14010219
AMA Style
Han Z, Wang Y. Inertial Measurement Unit- and Time Series Approach-Based Motion Trajectory Reconstruction of the Safety Rope Fastening Behaviour. Buildings. 2024; 14(1):219. https://doi.org/10.3390/buildings14010219
Chicago/Turabian StyleHan, Zixin, and Yaowu Wang. 2024. "Inertial Measurement Unit- and Time Series Approach-Based Motion Trajectory Reconstruction of the Safety Rope Fastening Behaviour" Buildings 14, no. 1: 219. https://doi.org/10.3390/buildings14010219
Note that from the first issue of 2016, this journal uses article numbers instead of page numbers. See further details here.