
Machine Learning-Based Cost-Effective Smart Home Data Analysis and Forecasting for Energy Saving †
Department of Electronic, Information & Communication Engineering, Kangwon National University, Samcheok 25913, Republic of Korea
†
This paper is an extended version of our paper published in 2023 IEEE International Conference on Consumer Electronics (ICCE), Las Vegas, NV, USA, 6–8 January 2023; pp. 1–2.
Buildings 2023, 13(9), 2397; https://doi.org/10.3390/buildings13092397
Submission received: 28 July 2023
/
Revised: 1 September 2023
/
Accepted: 18 September 2023
/
Published: 21 September 2023
(This article belongs to the Special Issue Digital Technology and Smart Buildings)
Abstract
:This study aims to enable cost-effective Internet of Things (IoT) system design by removing redundant IoT sensors through the correlation analysis of sensing data collected in a smart home environment. This study also presents a data analysis and prediction technology that enables meaningful inference through correlation analysis of data from different heterogeneous IoT sensors installed inside a smart home for energy efficiency. An intelligent service model that can be implemented based on a machine learning algorithm in a smart home environment is proposed. Herein, seven types of sensor data are collected and classified into sets of input data (six environmental data) and target data (power data of HVAC). By using the six new input data, the power data can be predicted by the artificial intelligence model. The model performance was measured using RMSE, and the gradient-boosting regressor (gb) model performed the best, with an RMSE of 22.29. Also, the importance of sensor data is extracted through correlation analysis, and sensors with low importance are removed according to the importance of sensor values. This process can reduce costs by 13%, thereby providing a design guide for a cost-effective IoT system.
1. Introduction
The Internet of Things (IoT) is a technology that connects objects with embedded microprocessors, sensors, and wired/wireless communication functions in various objects, analyzes them, and provides learned information to users or allows users to control them remotely [1,2,3,4].
A smart home is a home that provides intelligent smart services to users owing to the IoT technology installed in the home. An IoT-based smart home does not incorporate a smart home service if it only monitors or controls one home appliance, sensor, or device through another device. For example, when a user enters their home, a motion sensor detects this and provides a simple function to turn on the TV or lights. This is not called a smart home; rather, this is simply a remote-control method. A real IoT-integrated system should be able to deal with data, such as data collection and analysis, including temperature/humidity sensors, CO2 sensors, and motion detection sensors, and reducing progressive tax can be considered to be the primary contribution of an IoT-based smart home. Presently, the most important technology is intelligence technology, for example, artificial intelligence (AI). AI-based smart homes are currently undergoing significant research [4,5,6].
This study discusses the application of AI technology to implement in a smart home. Currently, numerous emerging technologies use AI to build smart homes and provide intelligent services to users. Various services, such as providing a smart environment to users by applying AI technology or reducing energy consumption costs by reducing energy use, are emerging. Although various AI-based studies have been conducted, determining the optimal service is not yet feasible.
In this study, first, the existing research on AI and the present guidelines for reducing the internal energy use in machine learning-based smart homes are analyzed. Second, a cost-effective and high-performance smart IoT system design is proposed by removing and integrating redundant IoT sensors through correlation analysis of IoT sensor data collected in a smart home environment. Third, this study presents a data analysis and prediction technology that affords meaningful inference through correlation analysis of data acquired from different heterogeneous IoT sensors installed inside a smart home for energy efficiency. Thus, an intelligent service model is proposed that can be implemented in a machine learning-based smart home. The following points represent contributions to this study.
- Cost-effective system design: A cost-effective and high-performance smart IoT system is designed by removing and integrating redundant IoT sensors.
- AI-based energy prediction technology for energy efficiency: A data analysis and prediction technology that enables meaningful inference through correlation analysis of data acquired from different heterogeneous IoT sensors installed inside a smart home for energy efficiency.
2. Related Works
2.1. Machine Learning-Based Smart Home
Numerous studies have been published on machine learning-based smart home services [7,8]. Machine learning-based smart homes handle data and deliver meaningful information to users using prediction values generated through training based on large amounts of meaningful data.
Previously, HEMS-IoT, a smart home energy management system based on big data and machine learning, was presented for home comfort, safety, and energy saving. It uses the J48 machine learning algorithm and Weka API to learn user behavior and energy consumption patterns and classify houses relative to energy consumption [8]. In another study, machine learning technology was applied to a smart home, and a machine learning-based smart home auxiliary control model was proposed [9]. An end-to-end design of a voice recognition smart home controller for intelligent devices deployed in a real environment was verified in an experimental setting of automatic blinds to address the shortcomings of smart homes that have not been developed considering frequent changes in users’ habits and tastes [10]. Ref. [11] proposed solutions to various security threats that occur in a smart home environment. Machine learning-based traffic analysis has emerged in order to demystify the hidden patterns in IoT traffic and enable automatic device classification. An hour-ahead demand response (DR) algorithm [12] was proposed for energy management at home. It presents an artificial neural network (ANN) approach that uses stable cost predictions as a method for dealing with upcoming price uncertainties. The authors of [13] presented a machine learning-based context-aware system, which can provide service according to the trained model. Two effective learning algorithms, backpropagation neural network and temporal differential class of reinforcement learning, were used for prediction and adaptation, respectively. This indicates better adaptation for context-aware service due to the low error rate. Ref. [14] presents a data-driven approach that leverages reinforcement learning to manage the optimal energy consumption of a smart home with a rooftop solar photovoltaic system, energy storage system, and smart home appliances. Ref. [15] shows an intrusion detection system to protect the IoT security [16]. Hence, this paper proposes ML-based ensemble classifiers using random forest (RF), support vector machine (SVM), decision tree (DT), naive Bayes, K-nearest neighbor, and neural networks to handle all the possible anomalies in smart home energy consumption data.
2.2. Deep Learning-Based Smart Home
A modular platform that uses the power of cloud services to collect, aggregate, and store all collected data in a smart environment was proposed in a previous study. The data are subsequently used to develop advanced neural network models, essentially incorporating techniques to increase energy awareness by advising residents of smart environments on ways to improve their daily habits while reducing energy consumption and costs [17]. Another study introduced a technology that provides useful and practical services to home users by predicting the future energy use of home appliances. Note that, as IoT sensors are designed to collect real-time information from home appliances, such as energy usage, indoor and outdoor temperature measurements, and relative humidity measurements, data should be abundant to gain insights. In this study, these predictions are tested using various time-series algorithms, including classical algorithms, and compared with deep learning, which has emerged as a predictive tool suitable for learning highly nonlinear and complex patterns [18]. In [19], household electricity consumption data from a single household were analyzed. Exploratory data analysis (EDA) was carried out on the data, time-series analysis was performed, and time-series forecasting models, such as autoregressive integrated moving average (ARIMA) and recurrent neural network (RNN) model with long short-term memory (LSTM), were used to make electricity demand predictions. In [20], a novel method was proposed for gait posture recognition that utilized local directional patterns (LDPs) for the local feature extraction of depth silhouettes in a smart home. Ref. [21] presented a new Internet of Things (IoT)-based fully automated nutrition monitoring system, called Smart-Log, to advance the state of the art in smart healthcare. For the realization of Smart-Log, a novel 5-layer perceptron neural network and a Bayesian network-based accurate meal prediction algorithm were presented in this paper. Ref. [22] proposed a smart home appliance classification that utilizes the deep learning architecture of long short-term memory (LSTM) trained on the latest version of the Plug-Load Appliance Identification Database (PLAID). Table 1 shows the Analysis of related works with proposed system.
2.3. Merit of the Current Study
Although numerous studies have been conducted, this study is advantageous and novel because it develops a cost-effective AI-based IoT system by extracting relevant data. What is new about this paper is that it proposes an artificial intelligence-based smart home that achieves maximum performance using the minimum number of sensors.
- Eliminating redundant sensors: Establishment of a cost-effective smart home IoT system by eliminating redundant sensors.
- Increased accuracy: Reduction in unnecessary sensors actually increases the accuracy of the AI model.
- Power demand response: Prediction of power demand through environmental information sensor data analysis in the home.
3. Methodology
3.1. Methodology
Figure 1 shows the methodology of the proposed system. Overall, this proposed system proceeds through the following procedures:
- ①
- Sensing: Sensing environmental information inside the home from IoT sensors.
- ②
- Data acquisition: Collecting data from IoT sensors to Gateway.
- ③
- Training: Storing collected data in a database and performing machine learning training by importing the stored data. The algorithms used are Decision Tree Regressor (dt), Random Forest Regressor (rf), Extra Trees Regressor (et), Gradient-Boosting Regressor (gb), Hist Gradient-Boosting Regressor (hgb), and Deep Neural Network (DNN).
- ④
- Data analysis: Outputting the collected and trained data to the monitoring panel for users to visually check. Users can check the collected environmental information and also check the predicted data. At this time, the predicted data are HVAC power data.
- ⑤
- Data forecast: Predicting in advance how much power loss there will be in the future through predicted HVAC power. Through this, users can prevent their electricity bills from rising due to progressive power taxes.
- ⑥
- Management: Performing control for energy saving through predicted HVAC power data.
3.2. Background
3.2.1. Decision Tree
A decision tree is based on a multilevel or hierarchical decision-making system or tree-like structure. A tree consists of a root node (containing all data), a set of internal nodes (splits), and a set of terminal nodes (leaves). Each node in the decision tree structure constitutes a binary decision that separates one class from the rest. Processing is typically performed by moving the tree down until a leaf node is reached. This is known as the top-down approach [23].
3.2.2. Random Forest
3.2.3. Extra Trees
The extremely randomized tree (or extra tree algorithm) is a relatively recent machine learning technique that has been developed as an extension of the random forest algorithm and is less likely to overfit a dataset. An extra tree (ET) employs the same principle as random forest and uses a random subset of features to train each base estimator. However, it randomly selects the best feature and the corresponding value for node splitting. ET uses the entire training dataset to train each regression tree. By contrast, RF uses a bootstrap replica to train the model [26].
3.2.4. Gradient Boosting
The gradient-boosting algorithm (GBA) is a prediction model that can perform regression or classification analysis and is an algorithm that belongs to the boosting family of ensemble methodologies of prediction models. The GBA exhibits excellent performance in predicting tabular format and is known to demonstrate the best predictive performance among all machine learning algorithms [1].
3.2.5. Hist Gradient Boosting
The primary limitation of gradient boosting is that it retards the model training. This is a problem, particularly when using models on large datasets with tens of thousands of examples (rows). The discretization (binning) of continuous input variables into hundreds of distinctive values can significantly accelerate the training of trees added to an ensemble. A gradient-boosting ensemble that implements this technique and tailors the training algorithm to the input variables in this transform is called a histogram-based gradient-boosting ensemble [2].
3.2.6. Deep Neural Network (DNN)
DNN refers to a learning method with two or more hidden layers. The computer generates classification labels, distorts the space, and repeats the process of dividing the data to derive the optimal dividing line. It is currently widely used with a large amount of data, iterative learning, pretraining, and error backpropagation techniques.
3.2.7. Recurrent Neural Network (RNN)
The RNN algorithm is a type of artificial neural network specialized in learning repetitive and sequential data and is characterized based on the internal circulation structure. Using a circular structure, past learning is reflected in current learning through weight. This algorithm overcomes the limitations of the existing continuous, repetitive, and sequential data learning. It enables connection between current learning and past learning and also incorporates the characteristic of being time-dependent. It is used predominantly to determine speech waveforms or the leading and trailing components of text.
3.2.8. Convolutional Neural Network (CNN)
While learning is performed by extracting knowledge from data via the existing method, CNN is the structure that extracts features from data and identifies patterns of features. The CNN algorithm proceeds through convolution and pooling processes. The algorithm was developed by combining convolution and pooling layers.
This study proposed a machine learning-based smart home data analysis and forecasting method using the artificial intelligence algorithm described in Section 2 (background). Section 3 shows the overall structure of the proposed service, and Section 4 shows the implementation of this study. Conclusions are drawn in Section 5.
4. Service Overview
Figure 2 shows a schematic of the proposed service. It shows a system configuration that collects data by installing sensors directly in a domestic hotel by Zigbee and the MQTT protocol, similar to the smart home. The collected data are analyzed based on artificial intelligence to provide a predictive service for saving power use to users or managers. In this study, the service level was considered, rather than the system level. Essentially, the collected data were utilized without dealing with the hardware part. Assuming that the completeness of the hardware is already optimal, the proposed system provides analysis and forecasting services based on the collected data. By implementing a data-based service model, an AI-based model can be implemented, thereby providing an effective prediction service [4].
All IoT sensors communicate with the gateway via Zigbee, a wireless network technology based on the IEEE 802.15.4 standard. The gateway and server exchange data based on MQTT. Herein, the actual data transmission rate was measured to be >2.5 kbps. The data sampling rate was 1 sample/min; this cycle was subject to change. Data were collected by setting an optimal rate of 1 sample/min, considering the battery consumption period. Figure 3 shows a service flowchart of the installed IoT system. The entire system consists of sensors (namely, temperature/humidity, CO2, and fine-dust sensors), actuators (e.g., HVAC systems and home appliances), and servers. The server collects temperature/humidity, CO2, fine dust, and cooling/heating motion detection data from the power part of the fan coil, lighting, and room-wide power data. The collected data are transmitted to the central server based on MQTT through the gateway using a Zigbee-based wireless communication protocol. Temperature and humidity data are transmitted from each room using temperature and humidity sensors, and indoor air quality data are transmitted using CO2 and fine-dust sensors. The movement of an indoor user is detected by a motion sensor, and the power information is collected and transmitted by a smart submeter installed in the power part of the indoor duct fan coil responsible for HVAC cooling and heating. The power information of the fan coil can be used to measure whether the HVAC system in the room is active. Figure 4 shows an actual IoT device installed inside a test bed (hotel room). Table 2 presents the IoT device specifications installed in the test bed.
5. Implementation
5.1. Data Acquisition
Figure 5 shows the state of the data used as the input data for the AI model. Six types of data were considered: temperature, humidity, CO2, fine dust, light power, and fan coil power. The data were installed inside a hotel close to the home environment, and data were collected on an hourly basis for 1 month. The power of the entire room was used as the target data for the AI model. Sensor devices collected data in increments of 1 s; however, increments of 1 h are sufficient for data analysis. Table 3 presents the number of data points, average, standard deviation, minimum value, and maximum value for the collected sensor data [4].
5.2. Data Relevance Analysis
Figure 6 and Table 4 [27] present the relationships between the collected data. Figure 6 shows a heatmap, which is a visualization method that represents the distribution or pattern of data using colors. The value is expressed in darker colors as the size or frequency of the data increases, making it easier to intuitively see the overall distribution. When analyzing the correlation between multiple variables, using a heatmap makes it easy to visually understand the distribution of correlation coefficients. In particular, since the correlation coefficient is limited to a range of −1 to 1, representing it as a heatmap provides more intuitive results. Variables with correlation coefficients close to −1 and 1 are contrasted, and the size of the correlation coefficient can be easily compared depending on the intensity of the color.
Looking at Figure 6, the relationship between CO2 and CO2 is naturally the same value, so it has the highest correlation coefficient of 1. However, the relationship between CO2 and temperature is low, with a correlation coefficient of −0.2. Here, the meaning of the correlation coefficient of −0.2 can be seen as a relatively low correlation coefficient in category 3 when looking at Table 4
Relationships were investigated through the heatmap analysis of data from the seven sensors, and the numerical values of each relationship were derived from the meanings presented in Table 4. In this study, a deep learning model was trained by composing a training set with high relationship data and nonrelational data, and the accuracy was measured accordingly.
For example, the most relevant data for room power are light power, calculated as 0.71. This implies that the factor that most affects the room power is lighting, which exhibited the highest correlation, with a strong positive linear relationship. The fan power output was 0.48; a power sensor was installed on the fan coil, which is an air-conditioning and heating device, and it determined whether the air-conditioning device was operational. This is another factor that affects room power. The CO2 data output was 0.43. This is a clear positive linear relationship with a relatively high correlation. The data related to room power were found to be in the following order:
Room power: 1.000000 > Light power: 0.705991 > Fan power: 0.478669 > CO2: 0.430153 > Humidity: 0.380577 > Fine dust: 0.321560 > Temperature: 0.039314
5.3. Data Classification
Figure 7 shows the classification of the input and target data. The data used in this study include seven types of sensor data, which are classified into six types of input data and one type of target data. These seven data were classified as training data for training the model and as test data for testing the model. Of the total 721 data points, 80% were classified as training data and 20% as test data. The training data were used for model training, and the test data were used for testing the trained model.
5.4. Model Development
Figure 8 shows the composition of the deep learning-based model used in this study. The sensor data are entered as the input and trained with the total power as the target data. The input data, that is, environmental information, are trained during the times when the power consumption is high and low. Thus, the power consumption value when the user checks the environment information can be predicted. On the contrary, power can be saved by intentionally adjusting the value of environmental information to reduce the power consumption value over a certain time period. However, this requires a more sophisticated time-series-based prediction model, whereas, in this study, this is presented based on the results derived from the analysis of the similarity and the relationship between sensors and the effect of the addition of or reduction in sensors on the performance (RMSE) of the model.
In addition, a machine learning model was implemented. The following shows the five implemented machine learning models.
- Decision Tree Regressor (dt)
- Random Forest Regressor (rf)
- Extra Trees Regressor (et)
- Gradient-Boosting Regressor (gb)
- Hist Gradient-Boosting Regressor (hgb)
5.5. Scenarios
Figure 9 shows a data forecast graph due to deep learning. Figure 10 and Table 5 and Table 6 present how the accuracy of the deep learning model in Figure 8 changes as the sensing data group changes. This table represents a group of sensing data. S1 is composed of only CO2 and fine dust. One piece of sensor data for each type was added to each group from S1 to S5. Essentially, it shows the increase in performance (RMSE) of the model when the model is trained with data from the first two types of sensors. The RMSE can be calculated as follows.
This scenario was implemented with Google’s Collaboratory using a DNN (three hidden layers, 200 epochs), as shown in Figure 8. Evidently, from Figure 10, the performance of the model increased as the type of sensor being trained changed. However, because the performance of S5 was lower than that of S4, the Fan Power data can be viewed as data that impair the model performance. Therefore, the sensor must be removed to enhance the performance of IoT sensors and lower the costs of IoT systems.
S1 consists only of CO2 and fine dust, which can be seen in Table 6. The meaning of S1~S5 shows that the performance of the model increases as the variety of sensor data increases (refer to Table 5 and Table 6). As the sensor data become more diverse from S1 to S5, the RMSE decreases. However, it is not always true that the performance of the model increases as the number of sensor data types increases, but, rather, there should be an appropriate amount of sensor data types, that is, S4. As fan power was added, the performance of the model decreased, and it was confirmed that fan power data should be removed to improve the performance of the model.
The following shows the performance of the model developed using the machine learning model. Figure 11 shows the data forecast graph as a result of machine learning. The RMSE was measured by changing the model (Table 7) from the decision tree regressor (dt) model to the first gradient-boosting regressor (hgb) model. As shown in Figure 12 and Table 8, the performance of the gradient-boosting regressor (gb) model was the best.
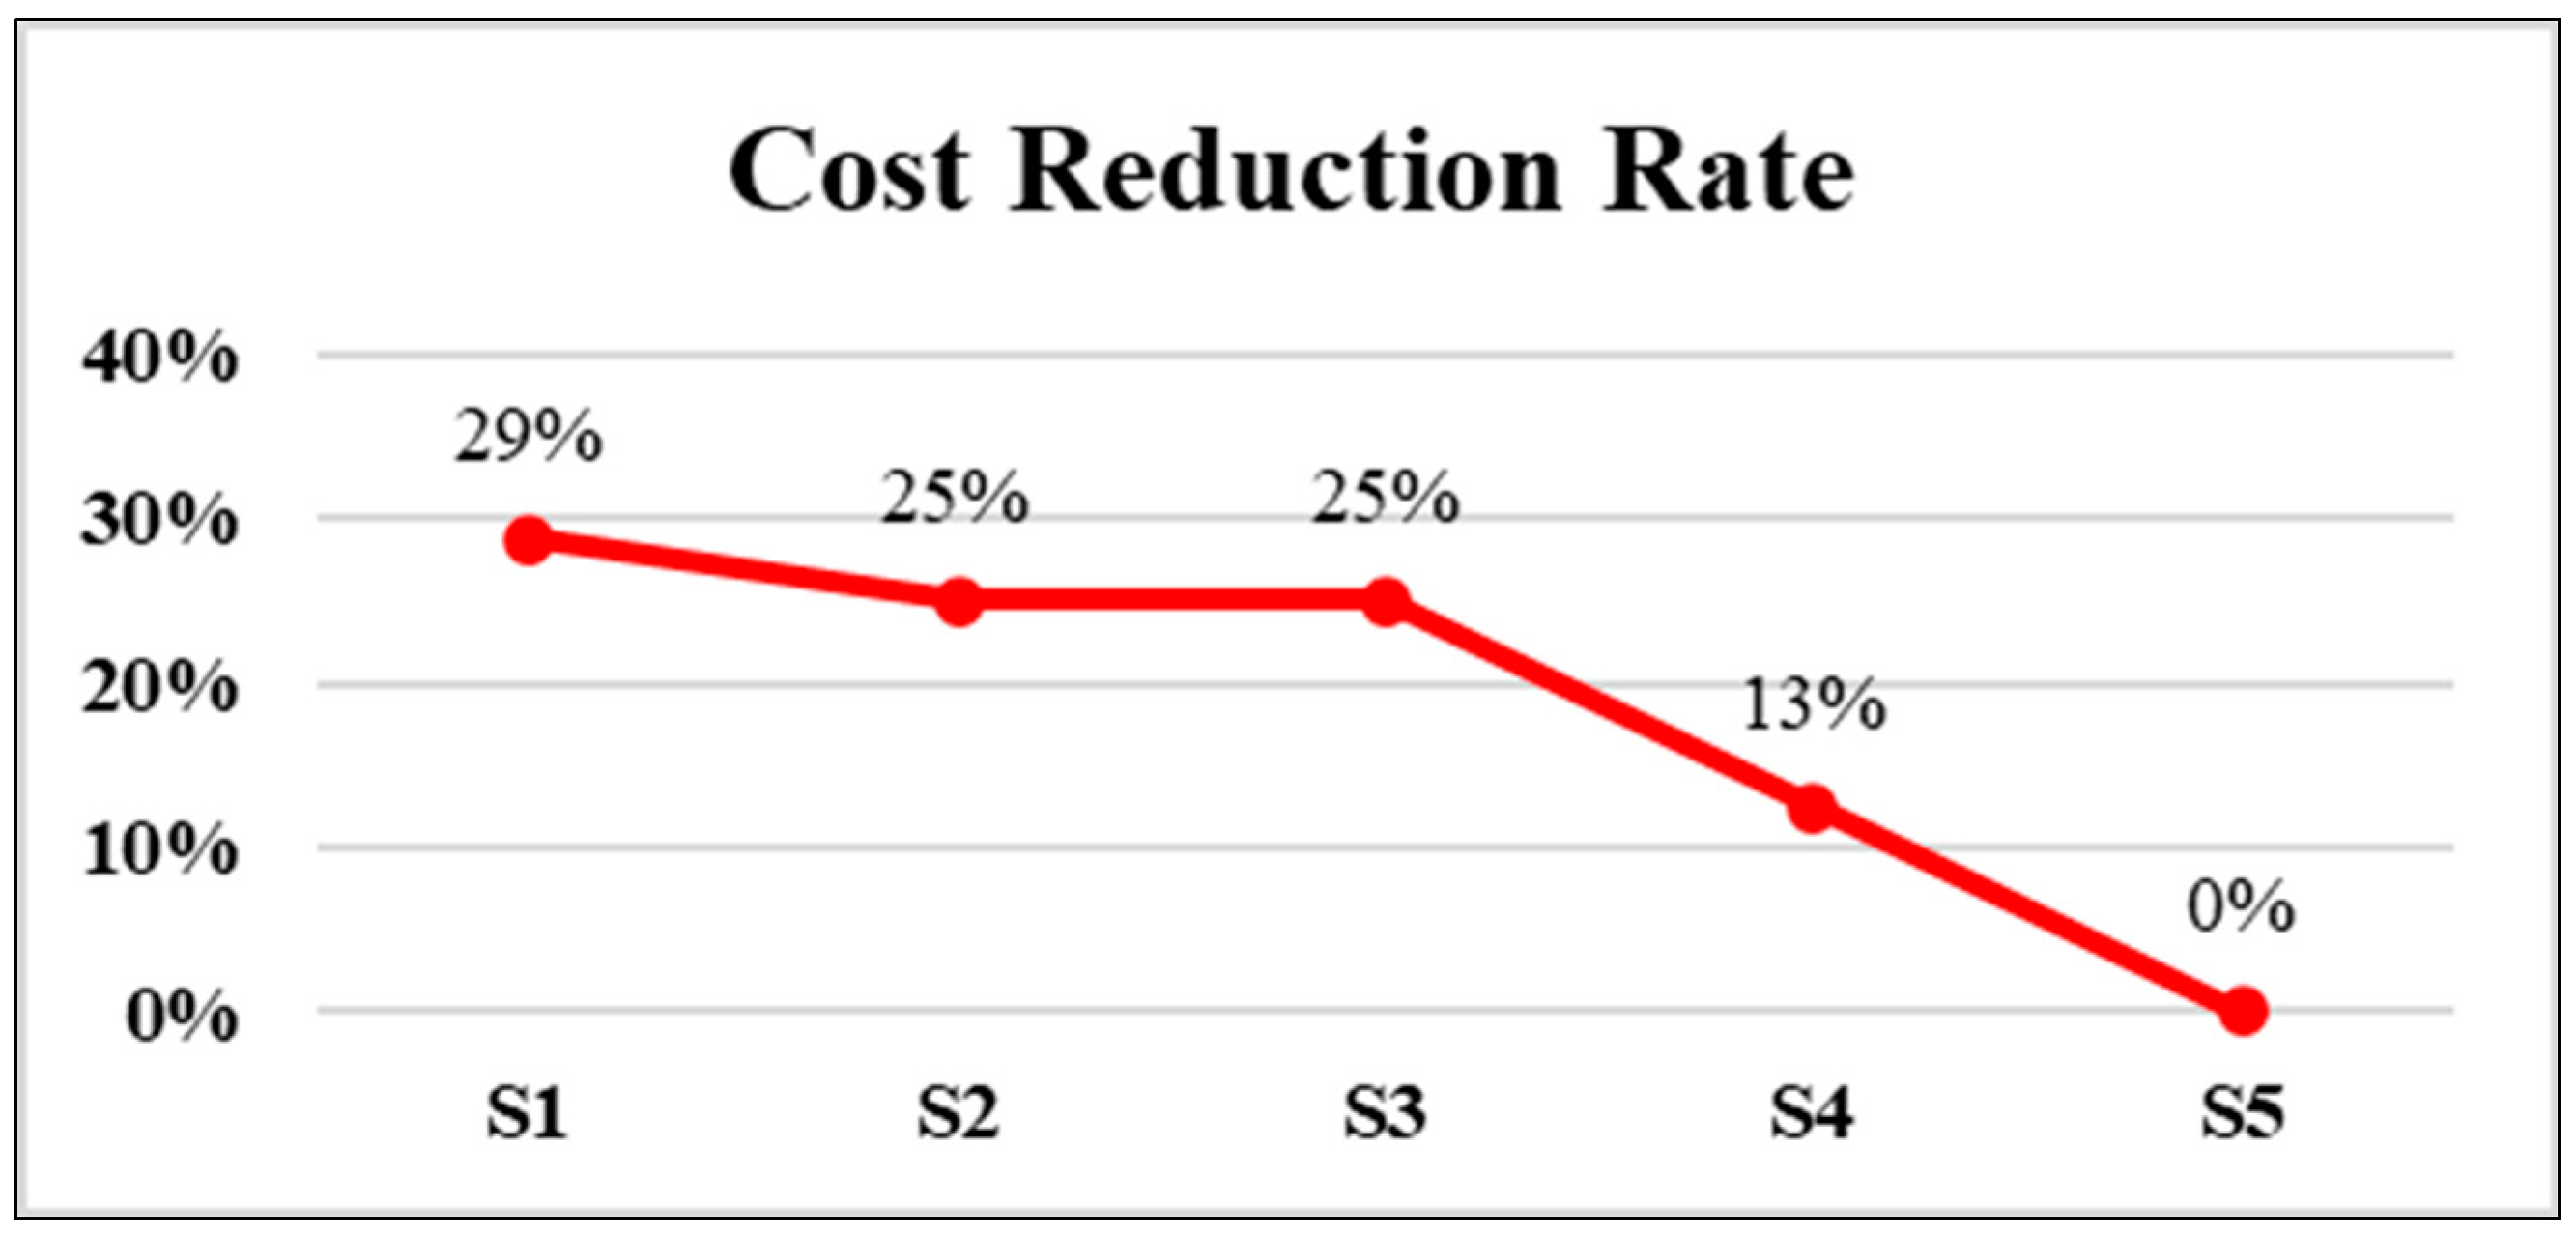
This scenario confirmed that the model with the gradient-boosting regressor (gb) exhibited the best performance. Of course, the performance of the deep learning model can be superior because it can be implemented as a model with superior performance by increasing the number of hidden layers, nodes, and epochs. Additionally, a higher model can be trained by collecting various data or increasing the amount of data; however, this study does not discuss this scenario. To develop a model with a higher performance in the future, research on securing related data and data preprocessing must be conducted. Above all, this study suggests that the following cost savings (Figure 13) can be achieved by eliminating irrelevant IoT sensors, as presented in Figure 10 and Table 5.
6. Conclusions
This study presented an intelligent service model by installing an IoT sensor inside a hotel that is similar to a smart home and analyzed these data to predict future energy consumption. Herein, seven types of sensor data were collected, and a service model for future energy saving in a smart home was presented by analyzing the correlation between data and training and constructing a model based on machine learning and deep learning. The accuracy of the smart home prediction model configured for energy saving was found to depend on the relevance of the collected data (input value). In addition, irrelevant data were found to be inappropriate inputs to the model because they degraded the model performance. By removing irrelevant data, high-accuracy and cost-effective machine learning-based smart home models can be realized.
This paper places great significance on energy saving in smart homes.
- Data-driven intelligent energy system: This proposed system provides an intelligent energy service based on data by installing inexpensive IoT devices in a smart home. It moves away from the existing schedule-based equipment control method and analyzes future energy usage based on AI-based predicted power energy data to compare with the present.
- High scalability of IoT system: This proposed system removes duplicate IoT devices installed in a smart home, resulting in a structure that can achieve greater efficiency in larger spaces than in smaller ones.
- High performance of model and cost-effective system construction: This system removes IoT sensors that have no correlation by collecting environmental data from IoT devices installed in a smart home and analyzing the correlation of the collected data. This can increase the performance of AI models and reduce the price of IoT systems.
Funding
This work was supported by the “Regional Innovation Strategy (RIS)” through the National Research Foundation of Korea (NRF) funded by the Ministry of Education (MOE) (2022RIS-005).
Data Availability Statement
Data are contained within the article.
Conflicts of Interest
The author declares no conflict of interest.
References
- Orfanos, V.A.; Kaminaris, S.D.; Papageorgas, P.; Piromalis, D.; Kandris, D. A Comprehensive Review of IoT Networking Technologies for Smart Home Automation Applications. J. Sens. Actuator Netw. 2023, 12, 30. [Google Scholar] [CrossRef]
- Mazhar, T.; Irfan, H.M.; Haq, I.; Ullah, I.; Ashraf, M.; Shloul, T.A.; Ghadi, Y.Y.; Imran; Elkamchouchi, D.H. Analysis of Challenges and Solutions of IoT in Smart Grids Using AI and Machine Learning Techniques: A Review. Electronics 2023, 12, 242. [Google Scholar] [CrossRef]
- Hussin, S.F.; Abdollah, M.F.; Ahmad, I.B. Acceptance of IoT Technology for Smart Homes: A Systematic Literature Review. In International Conference on Information Systems and Intelligent Applications; Springer: Cham, Switzerland, 2022; pp. 187–202. [Google Scholar]
- Park, S. Machine Learning-Based Smart Home Data Analysis and Forecasting Method. In Proceedings of the 2023 IEEE International Conference on Consumer Electronics (ICCE), Las Vegas, NV, USA, 6–8 January 2023; pp. 1–2. [Google Scholar]
- Kaur, B.; Dadkhah, S.; Shoeleh, F.; Neto, E.C.P.; Xiong, P.; Iqbal, S.; Lamontagne, P.; Ray, S.; Ghorbani, A.A. Internet of things (IoT) security dataset evolution: Challenges and future directions. Internet Things 2023, 22, 100780. [Google Scholar] [CrossRef]
- Almusaed, A.; Yitmen, I.; Almssad, A. Enhancing Smart Home Design with AI Models: A Case Study of Living Spaces Implementation Review. Energies 2023, 16, 2636. [Google Scholar] [CrossRef]
- Kang, J.; Kim, J.; Kim, M.; Sohn, M. Machine learning-based energy-saving framework for environmental states-adaptive wireless sensor network. IEEE Access 2020, 8, 69359–69367. [Google Scholar] [CrossRef]
- Machorro-Cano, I.; Alor-Hernández, G.; Paredes-Valverde, M.A.; Rodríguez-Mazahua, L.; Sánchez-Cervantes, J.L.; Olmedo-Aguirre, J.O. HEMS-IoT: A big data and machine learning-based smart home system for energy saving. Energies 2020, 13, 1097. [Google Scholar] [CrossRef]
- Wang, S.; Yang, S. Research on Smart Home Assistance Control Model Based on Machine Learning. In Proceedings of the 2020 Asia-Pacific Conference on Image Processing, Electronics and Computers (IPEC), Dalian, China, 14–16 April 2020; pp. 466–469. [Google Scholar]
- Filipe, L.; Peres, R.S.; Tavares, R.M. Voice-activated smart home controller using machine learning. IEEE Access 2021, 9, 66852–66863. [Google Scholar] [CrossRef]
- Jmila, H.; Blanc, G.; Shahid, M.R.; Lazrag, M. A survey of smart home iot device classification using machine learning-based network traffic analysis. IEEE Access 2022, 10, 97117–97141. [Google Scholar] [CrossRef]
- Huang, J.; Koroteev, D.D.; Rynkovskaya, M. Machine learning-based demand response in PV-based smart home considering energy management in digital twin. Sol. Energy 2023, 252, 8–19. [Google Scholar] [CrossRef]
- Kabir, M.H.; Hoque, M.R.; Seo, H.; Yang, S.-H. Machine learning based adaptive context-aware system for smart home environment. Int. J. Smart Home 2015, 9, 55–62. [Google Scholar] [CrossRef]
- Lee, S.; Choi, D.-H. Reinforcement learning-based energy management of smart home with rooftop solar photovoltaic system, energy storage system, and home appliances. Sensors 2019, 19, 3937. [Google Scholar] [CrossRef] [PubMed]
- Li, T.; Hong, Z.; Yu, L. Machine learning-based intrusion detection for iot devices in smart home. In Proceedings of the 2020 IEEE 16th International Conference on Control & Automation (ICCA), Sapporo, Japan, 9–11 October 2020; pp. 277–282. [Google Scholar]
- Kasaraneni, P.P.; Venkata Pavan Kumar, Y.; Moganti, G.L.K.; Kannan, R. Machine Learning-Based Ensemble Classifiers for Anomaly Handling in Smart Home Energy Consumption Data. Sensors 2022, 22, 9323. [Google Scholar] [CrossRef] [PubMed]
- Popa, D.; Pop, F.; Serbanescu, C.; Castiglione, A. Deep learning model for home automation and energy reduction in a smart home environment platform. Neural Comput. Appl. 2019, 31, 1317–1337. [Google Scholar] [CrossRef]
- Dey, N.; Fong, S.; Song, W.; Cho, K. Forecasting energy consumption from smart home sensor network by deep learning. In Proceedings of the Smart Trends in Information Technology and Computer Communications: Second International Conference, SmartCom 2017, Pune, India, 18–19 August 2017; Revised Selected Papers 2. pp. 255–265. [Google Scholar]
- Rahman, S.; Alam, M.G.R.; Rahman, M.M. Deep learning based ensemble method for household energy demand forecasting of smart home. In Proceedings of the 2019 22nd International Conference on Computer and Information Technology (ICCIT), Dhaka, Bangladesh, 18–20 December 2019; pp. 1–6. [Google Scholar]
- Uddin, M.Z.; Kim, M.R. A deep learning-based gait posture recognition from depth information for smart home applications. In Advances in Computer Science and Ubiquitous Computing: CSA-CUTE2016 8; Springer: Singapore; pp. 407–413.
- Sundaravadivel, P.; Kesavan, K.; Kesavan, L.; Mohanty, S.P.; Kougianos, E. Smart-log: A deep-learning based automated nutrition monitoring system in the iot. IEEE Trans. Consum. Electron. 2018, 64, 390–398. [Google Scholar] [CrossRef]
- Solatidehkordi, Z.; Ramesh, J.; Al-Ali, A.; Osman, A.; Shaaban, M. An IoT deep learning-based home appliances management and classification system. Energy Rep. 2023, 9, 503–509. [Google Scholar] [CrossRef]
- Xu, M.; Watanachaturaporn, P.; Varshney, P.K.; Arora, M.K. Decision tree regression for soft classification of remote sensing data. Remote Sens. Environ. 2005, 97, 322–336. [Google Scholar] [CrossRef]
- El Mrabet, Z.; Sugunaraj, N.; Ranganathan, P.; Abhyankar, S. Random forest regressor-based approach for detecting fault location and duration in power systems. Sensors 2022, 22, 458. [Google Scholar] [CrossRef] [PubMed]
- Breiman, L. Random forests. Mach. Learn. 2001, 45, 5–32. [Google Scholar] [CrossRef]
- John, V.; Liu, Z.; Guo, C.; Mita, S.; Kidono, K. Real-time lane estimation using deep features and extra trees regression. In Proceedings of the Image and Video Technology: 7th Pacific-Rim Symposium, PSIVT 2015, Auckland, New Zealand, 25–27 November 2015; Revised Selected Papers 7. pp. 721–733. [Google Scholar]
- Mukaka, M.M. A guide to appropriate use of correlation coefficient in medical research. Malawi Med. J. 2012, 24, 69–71. [Google Scholar] [PubMed]
Figure 1.
Methodology of proposed system.
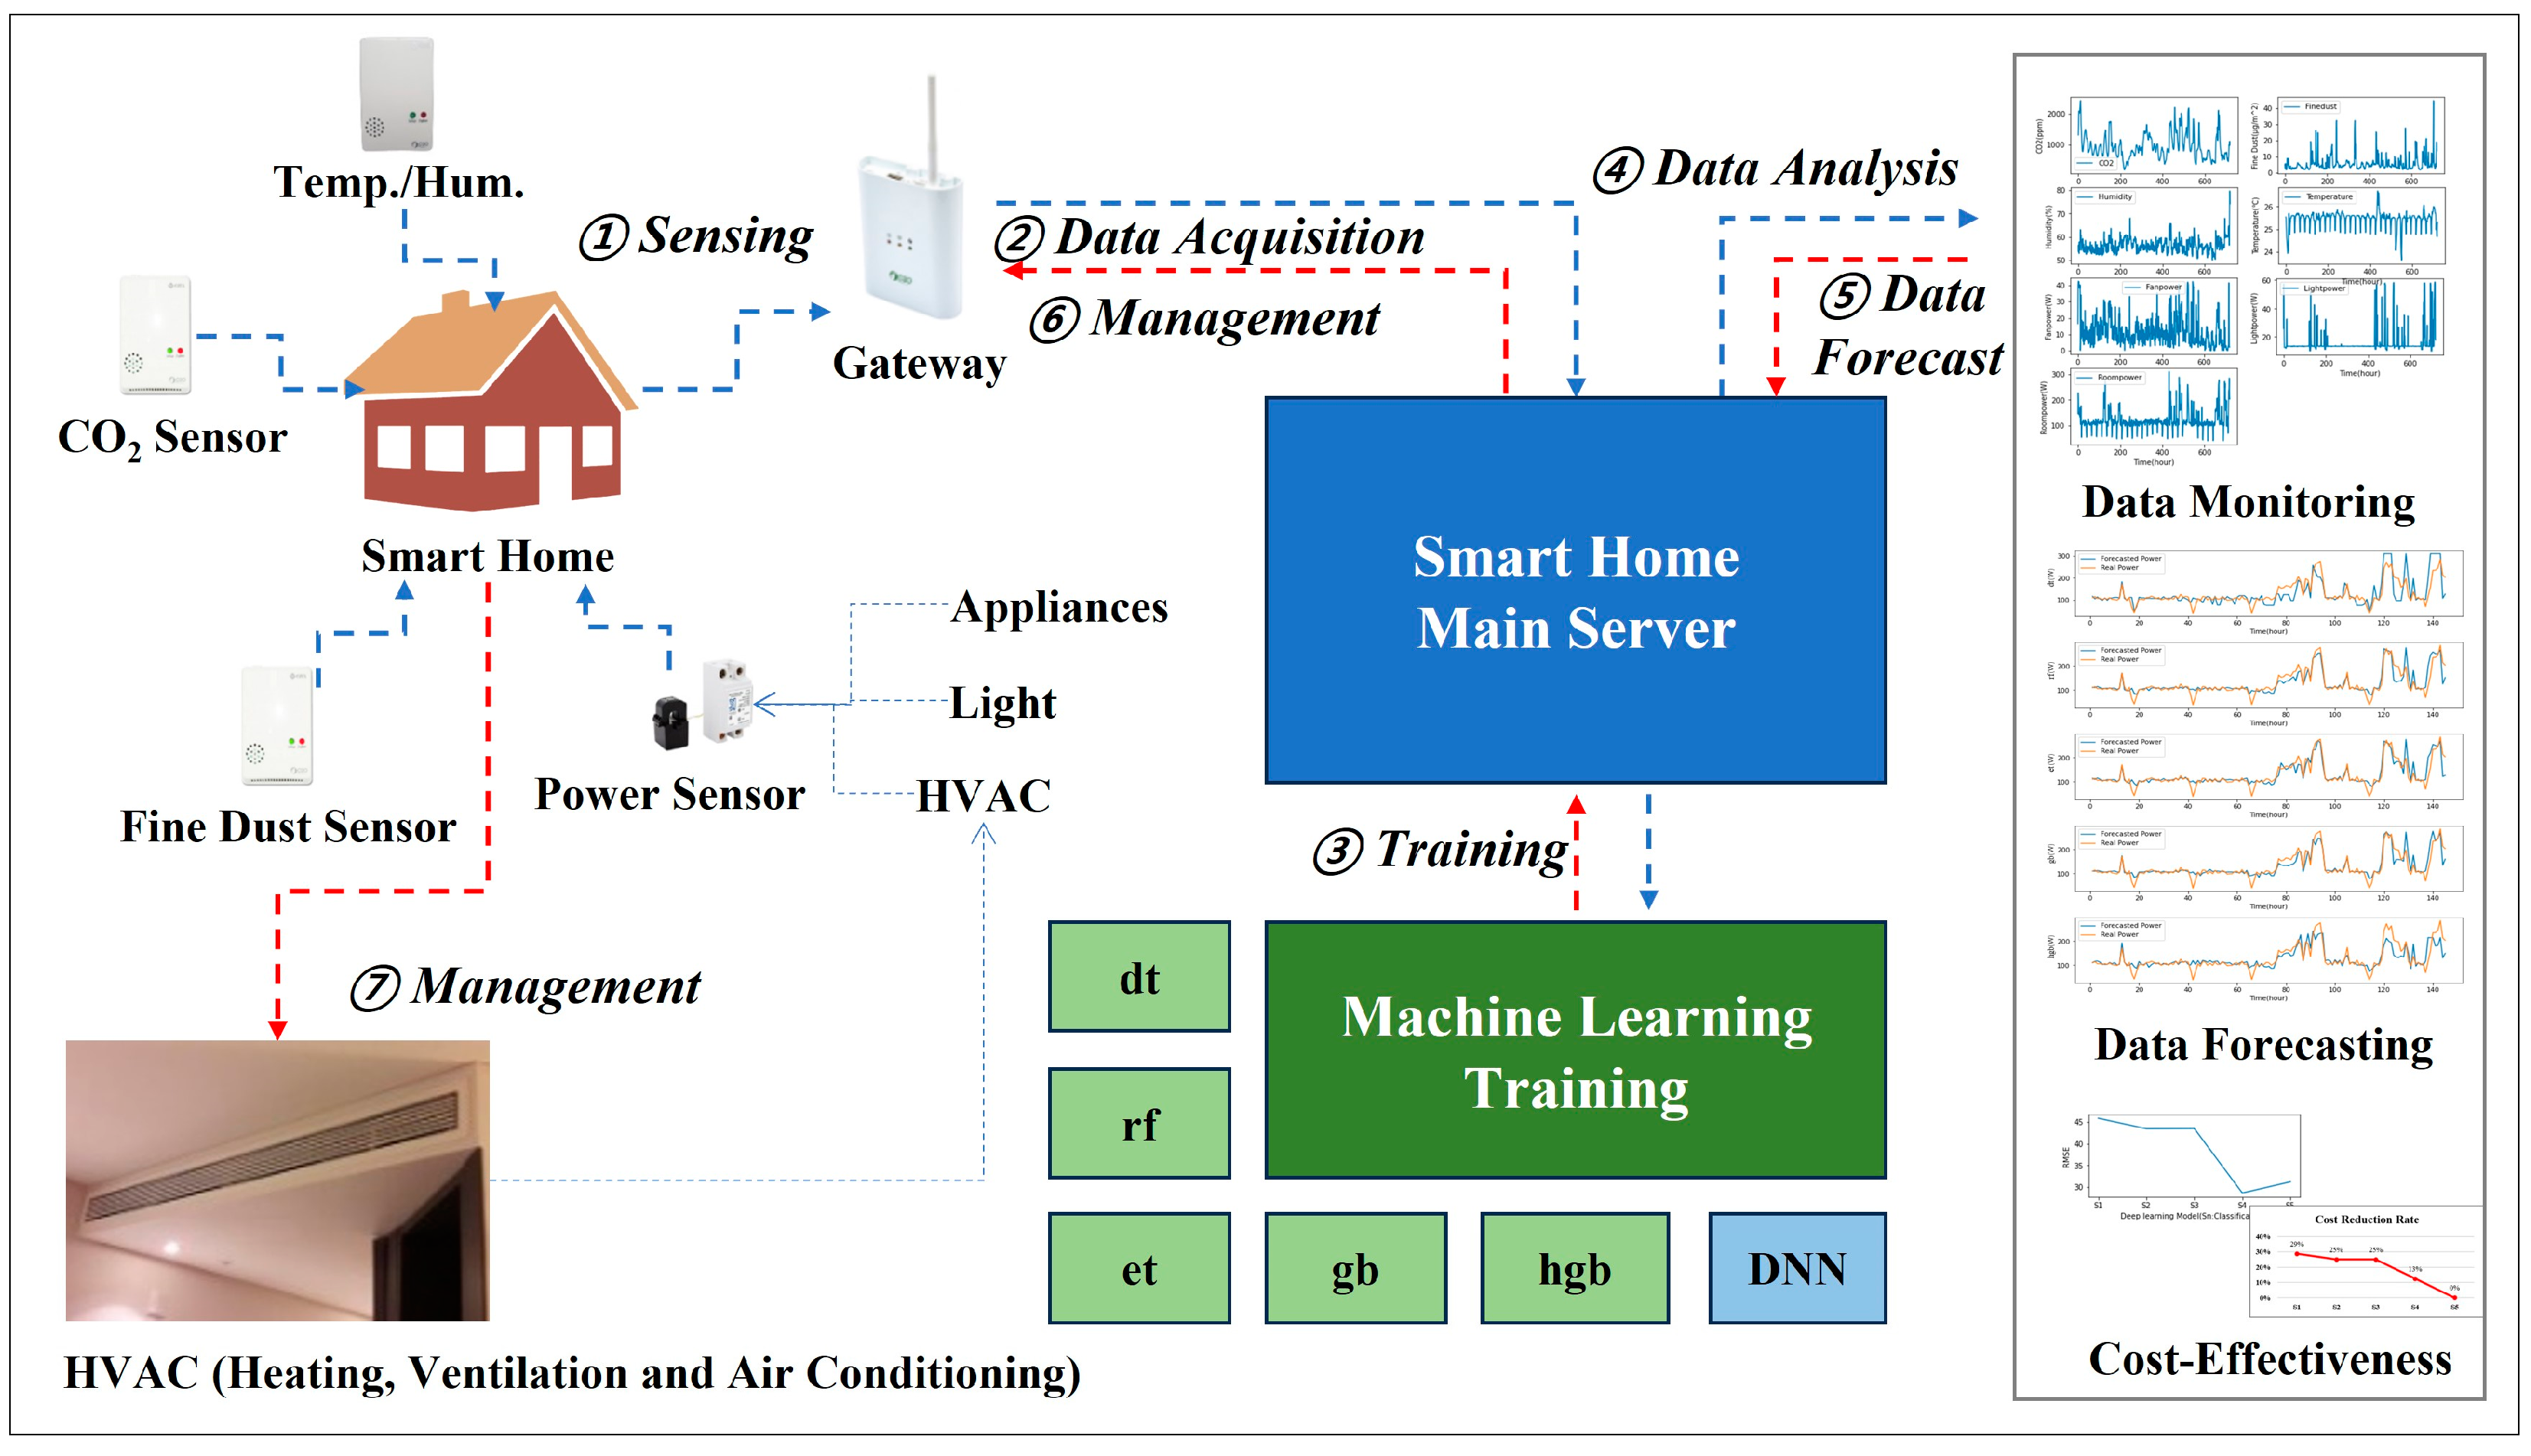
Figure 2.
Service Infrastructure.
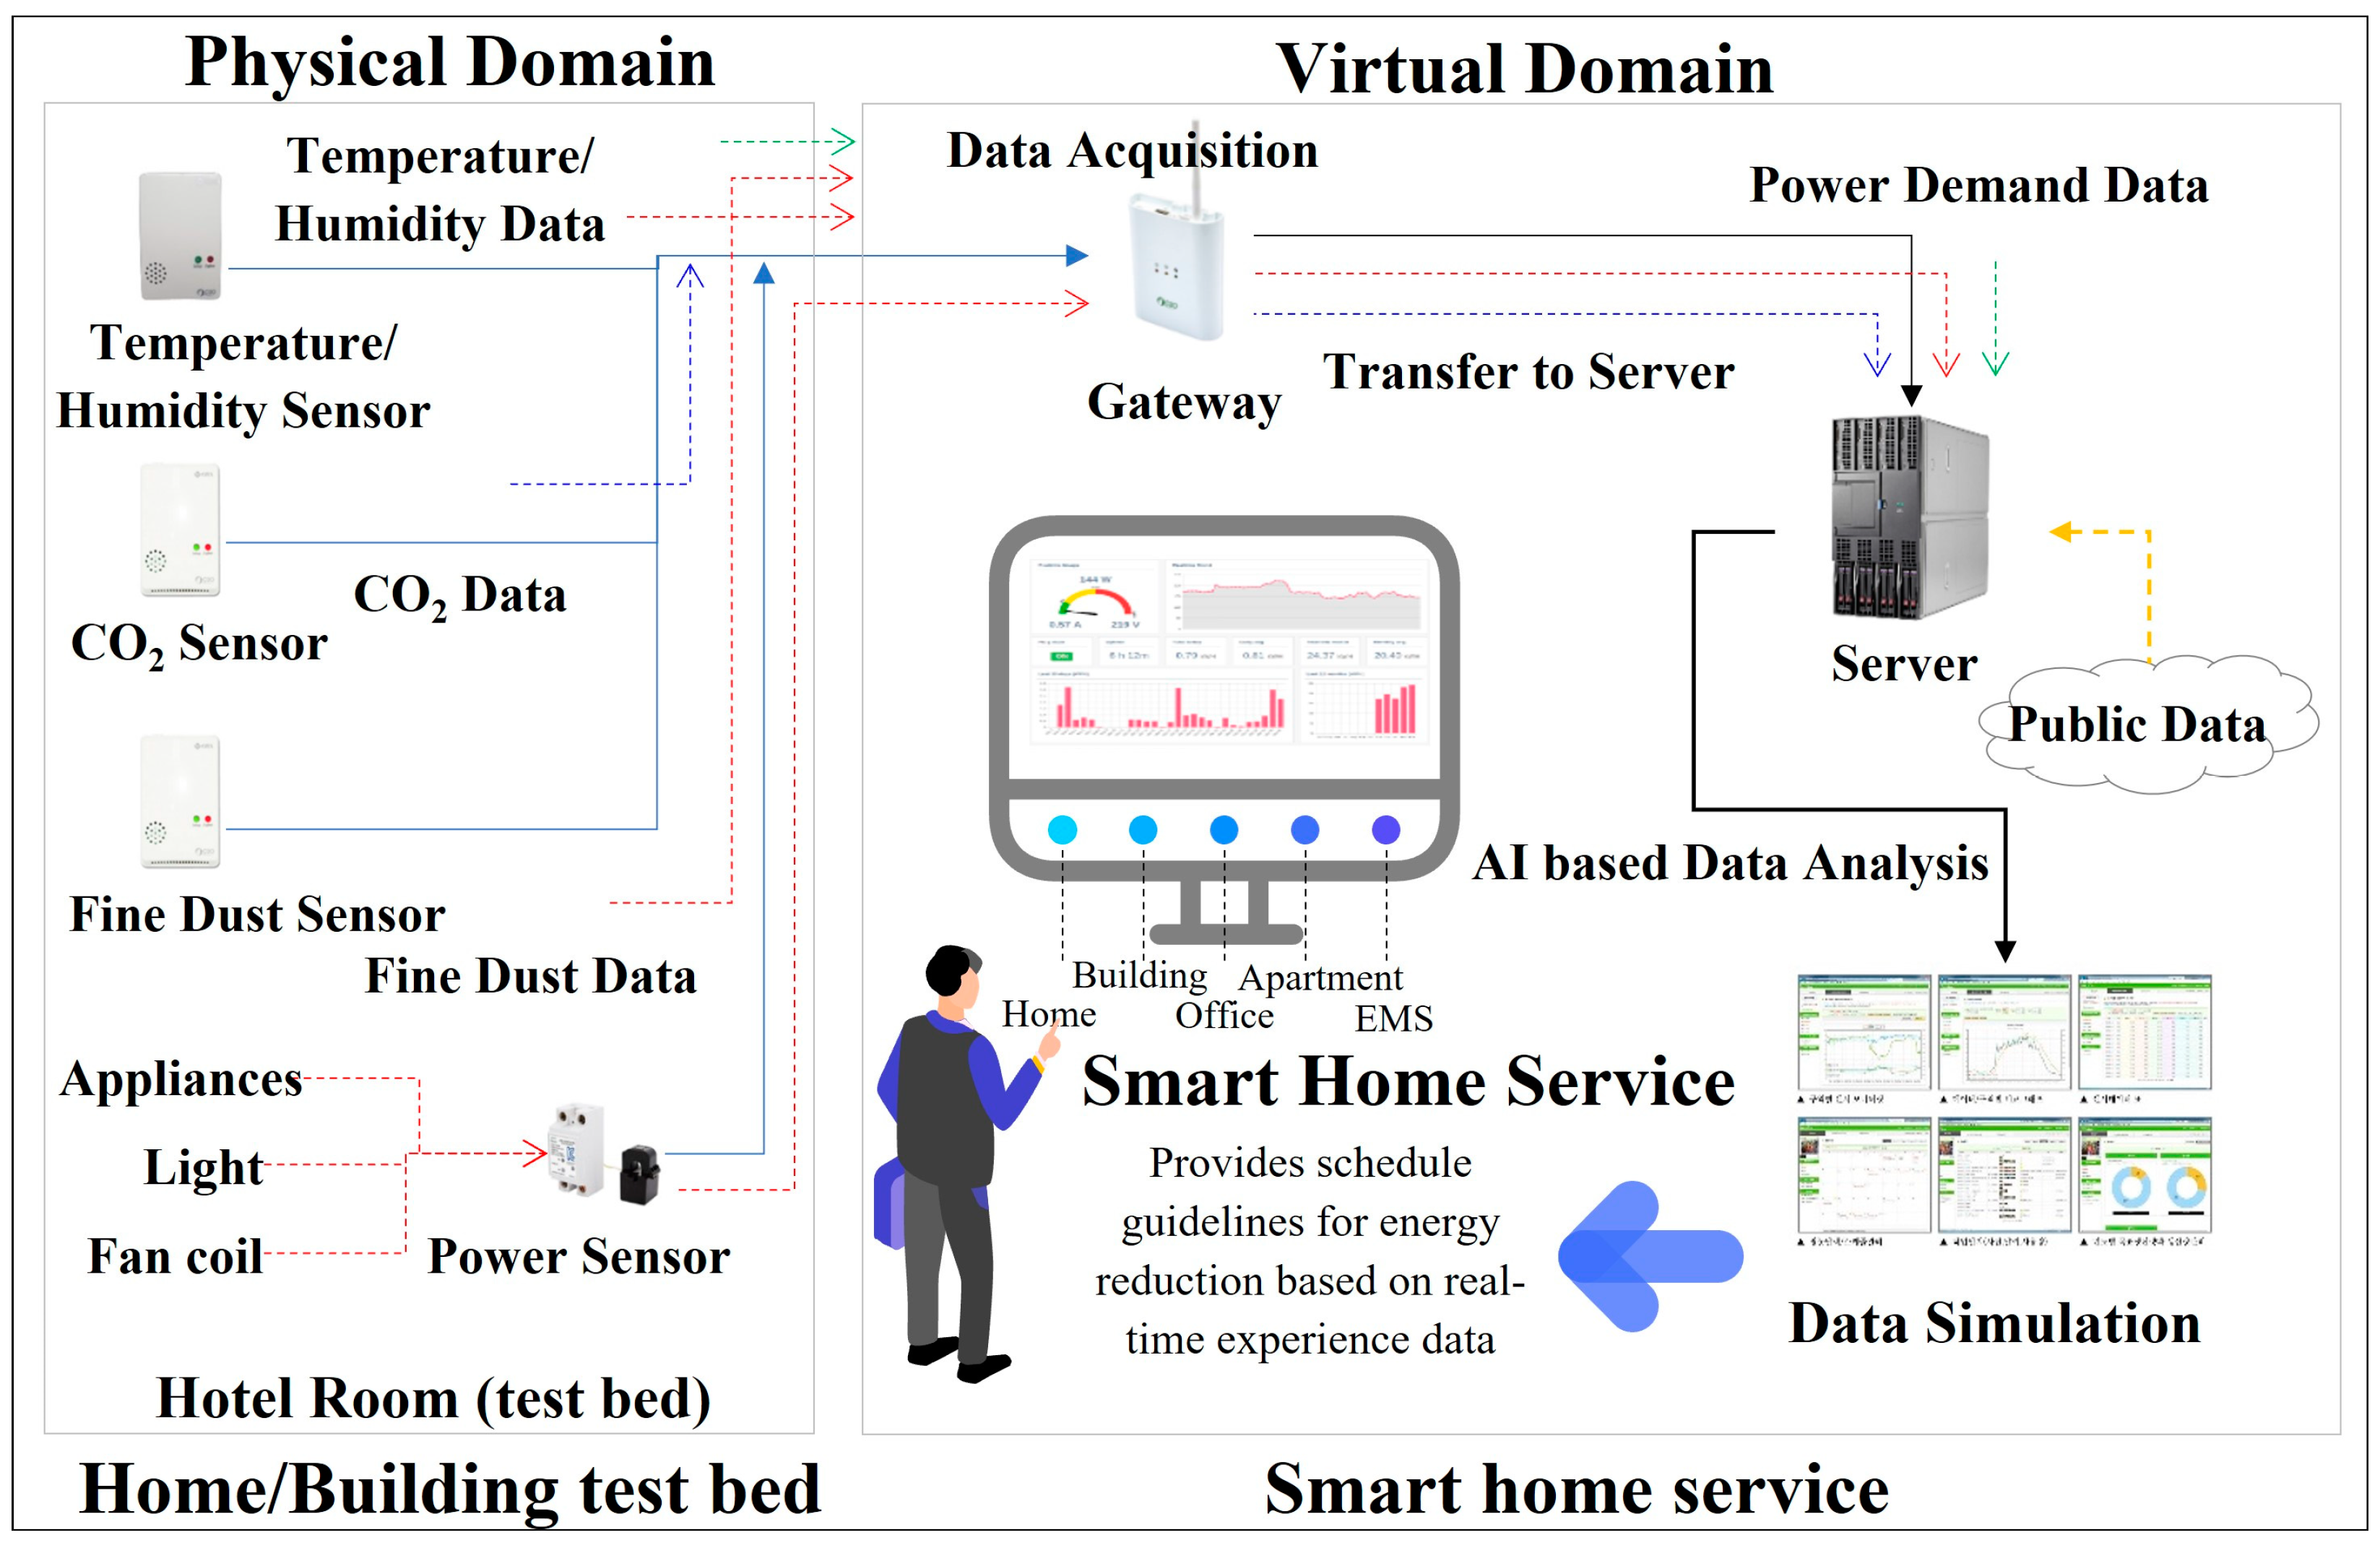
Figure 3.
Service flowchart.
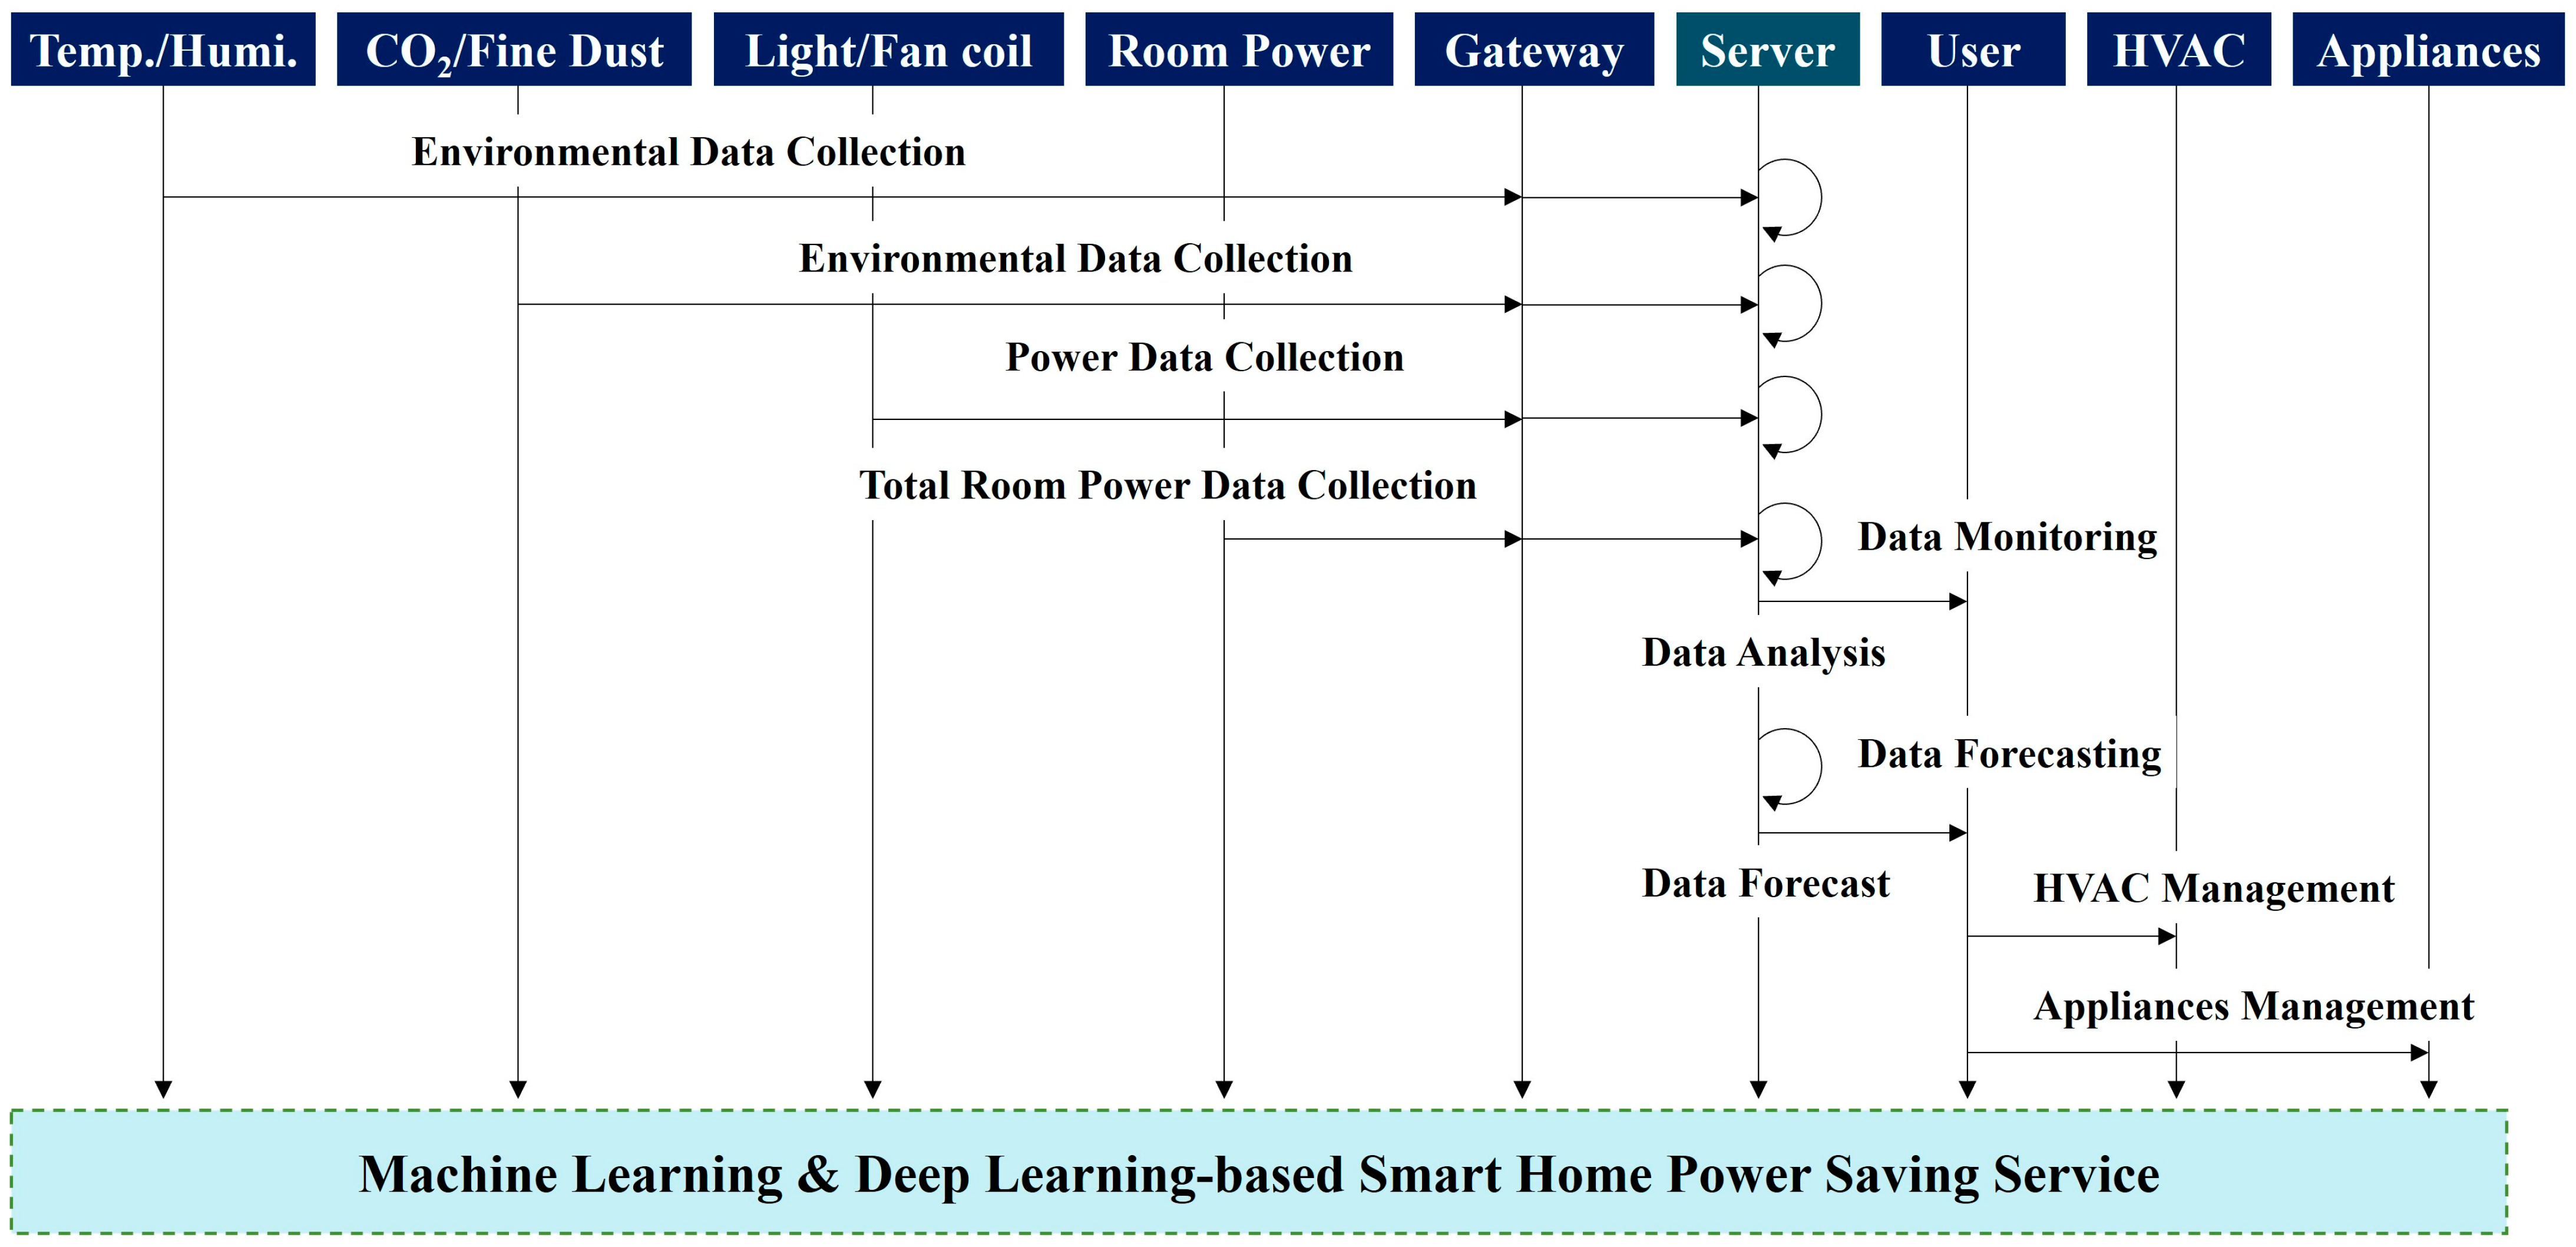
Figure 4.
Test bed.
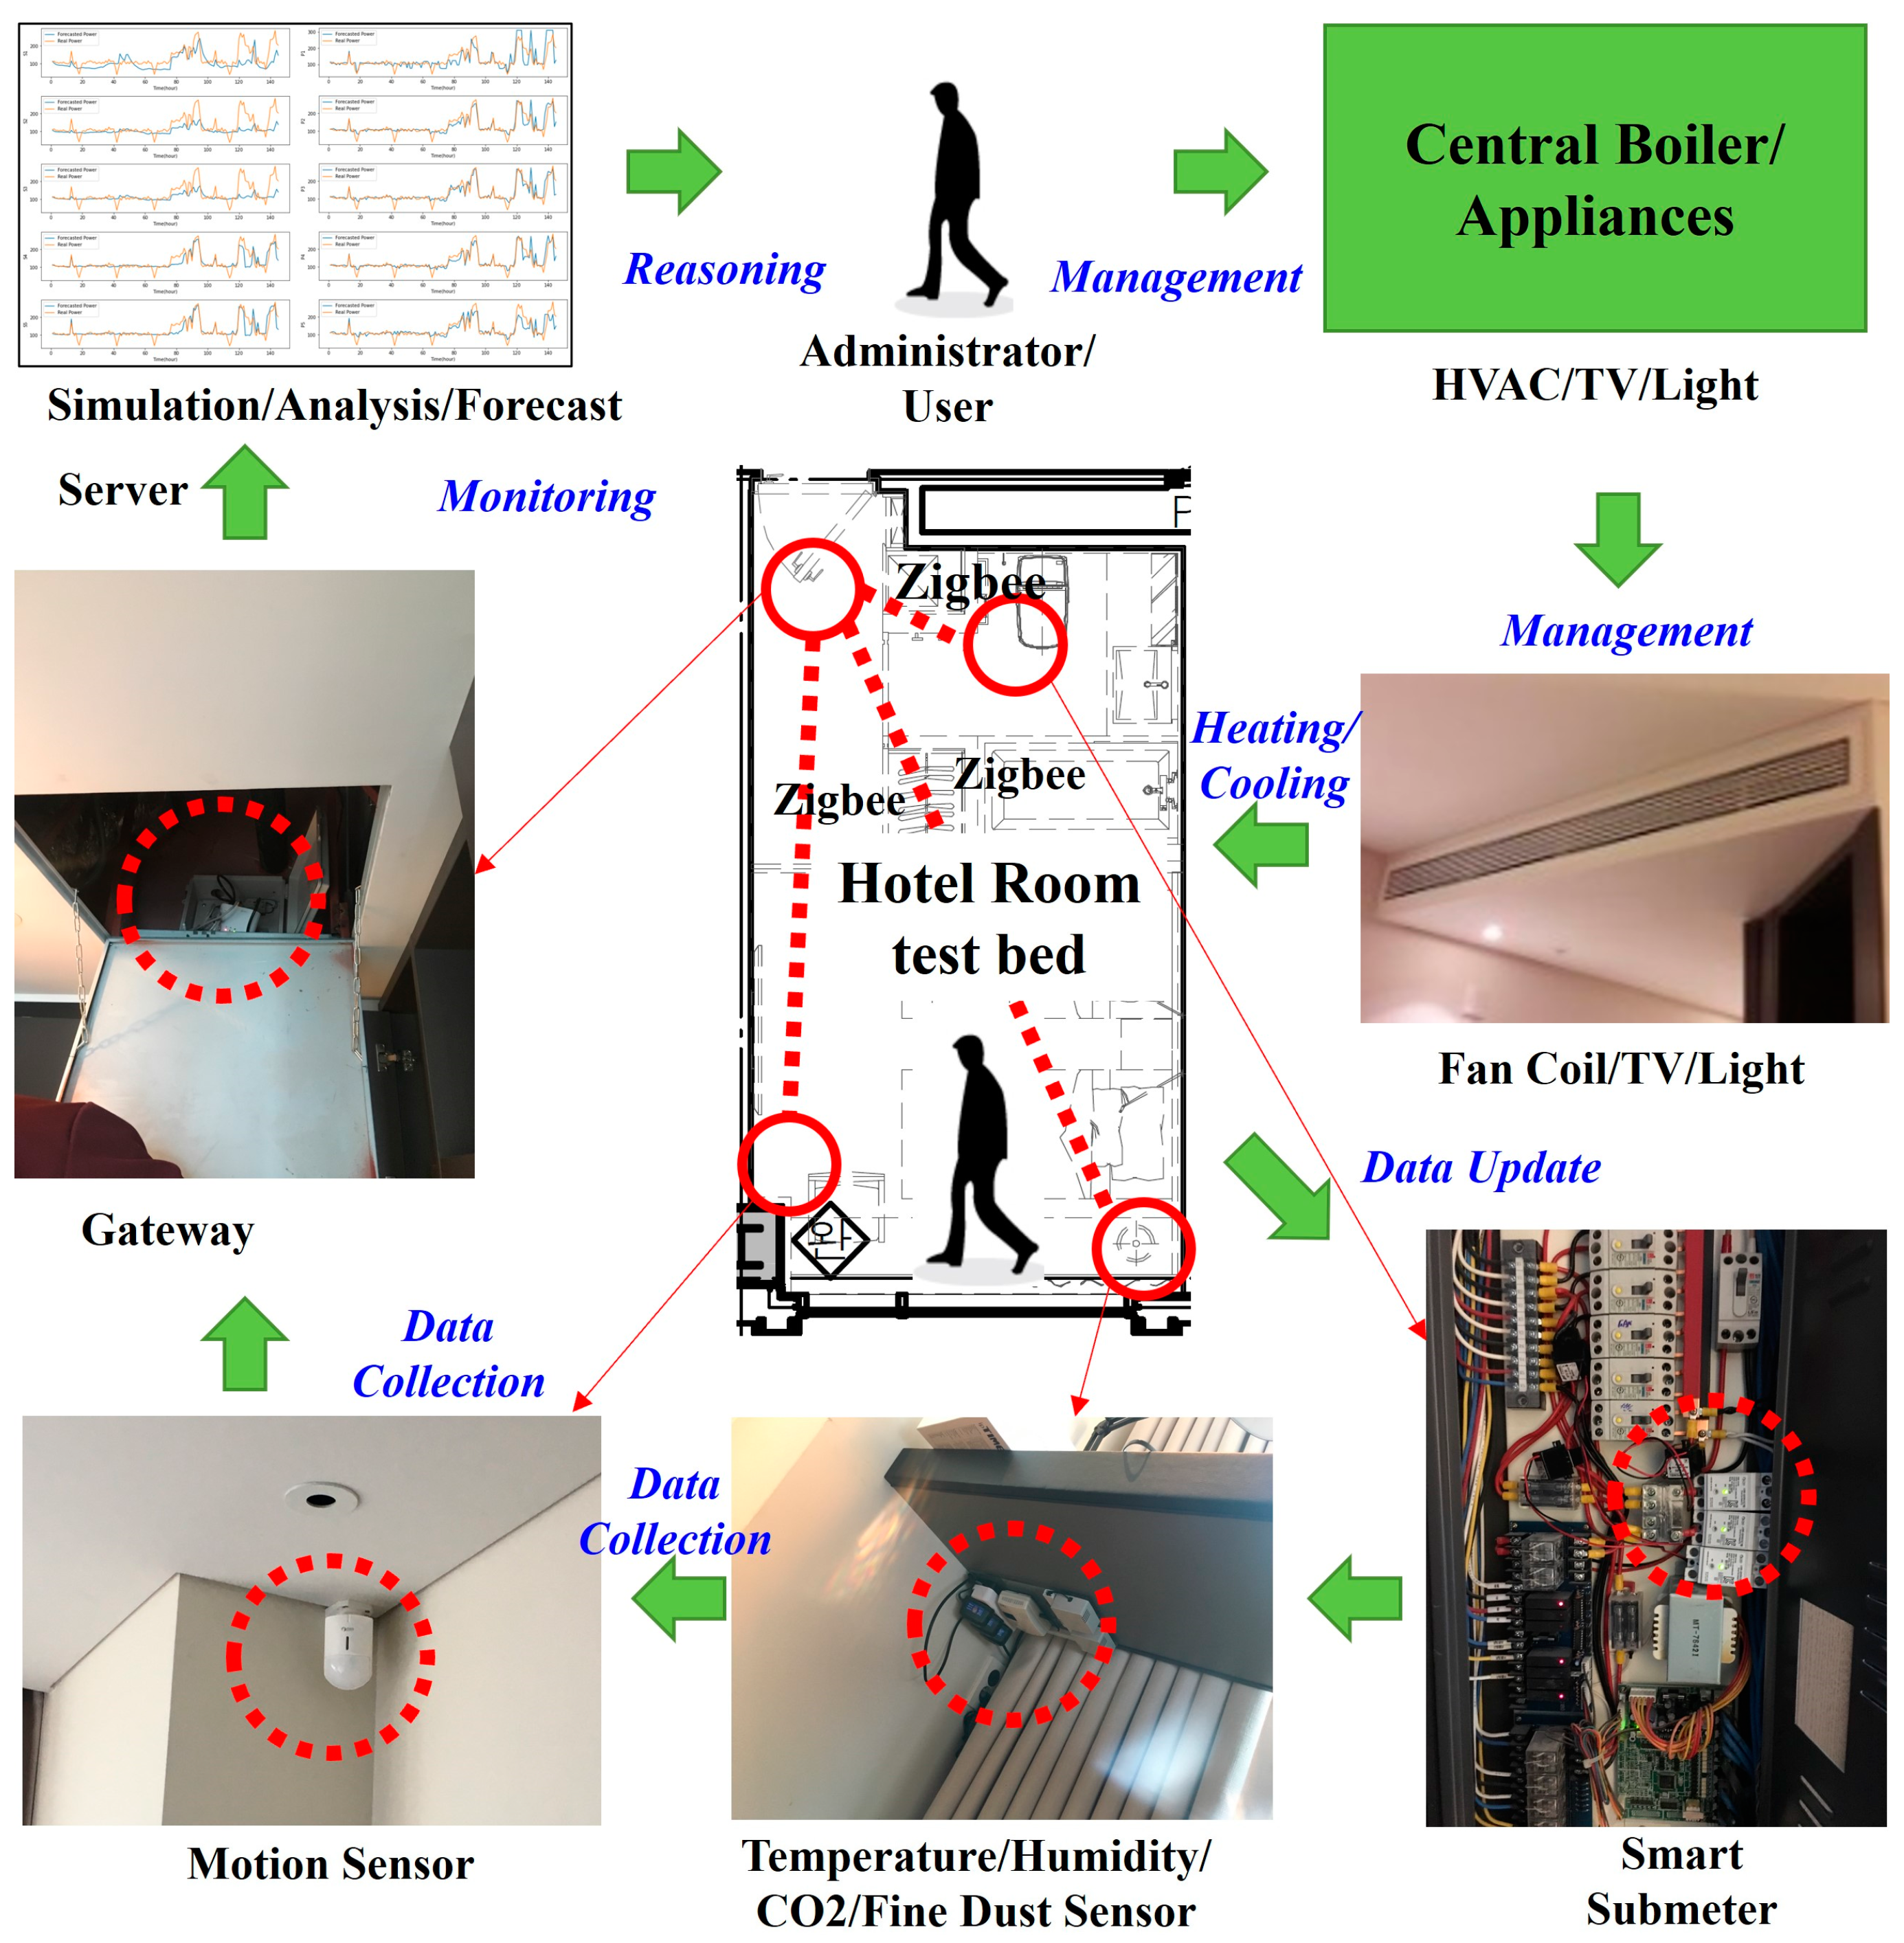
Figure 5.
Sensing data.
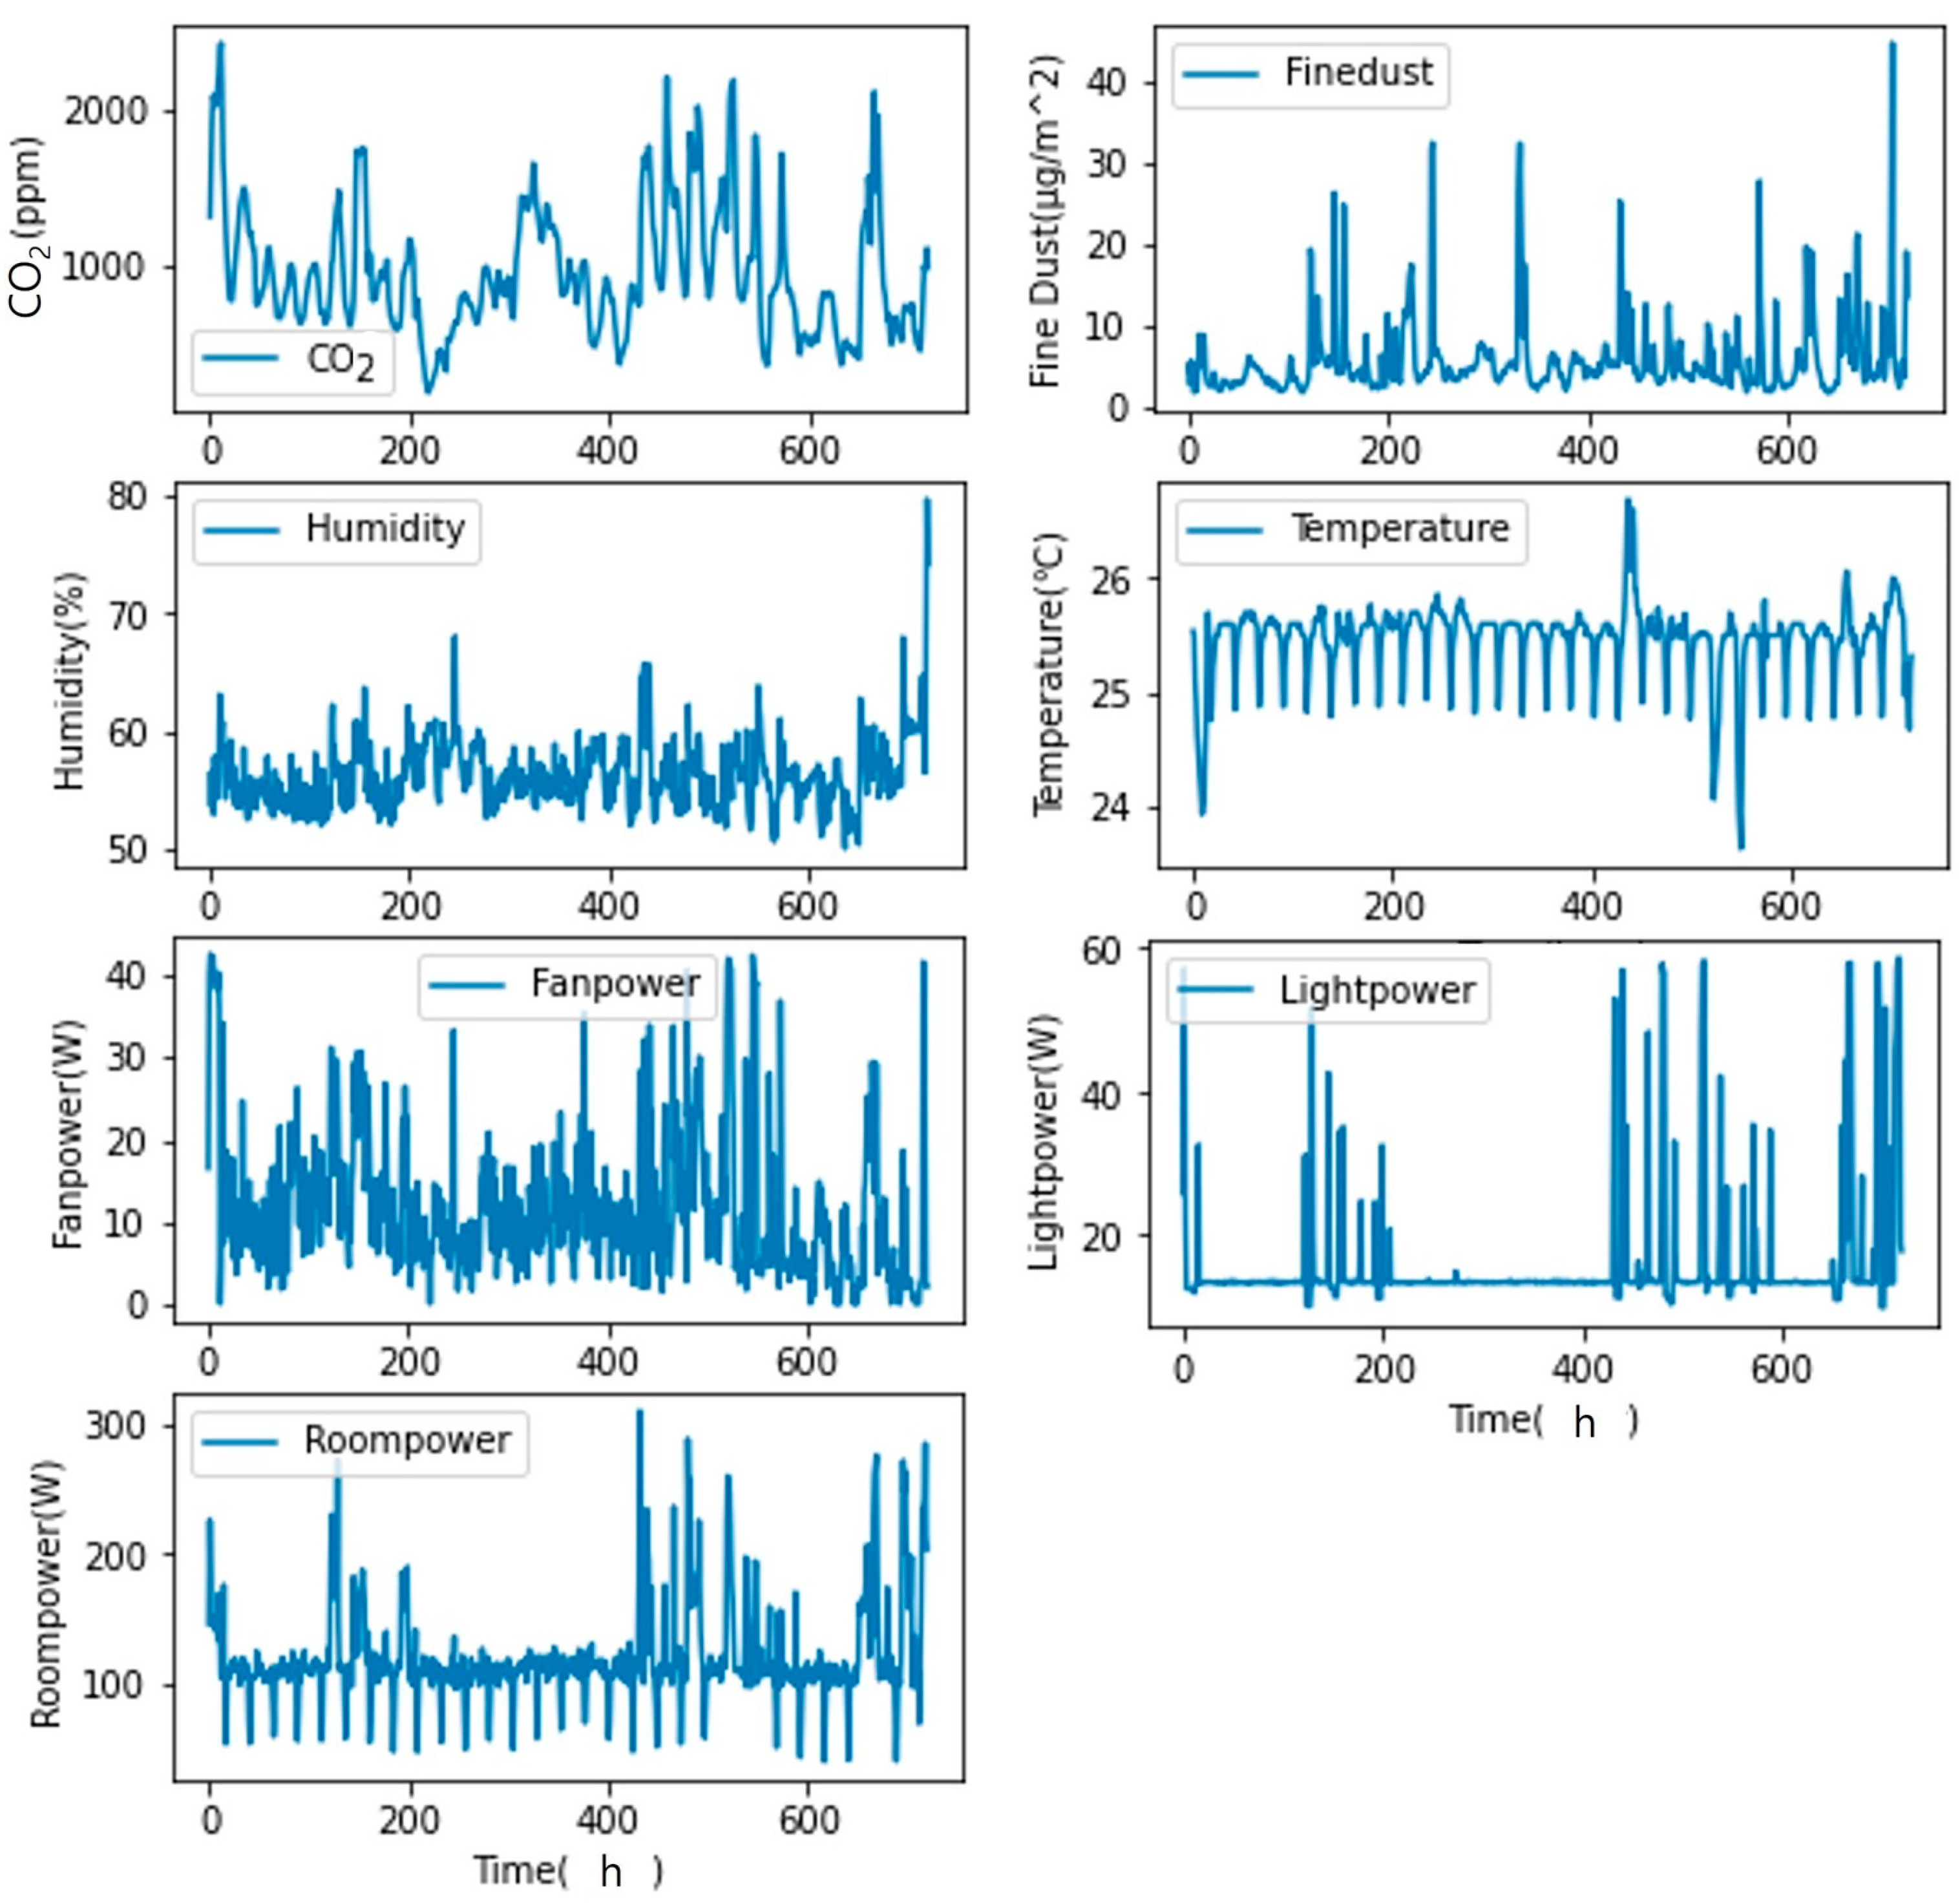
Figure 6.
Correlation between environmental information data.
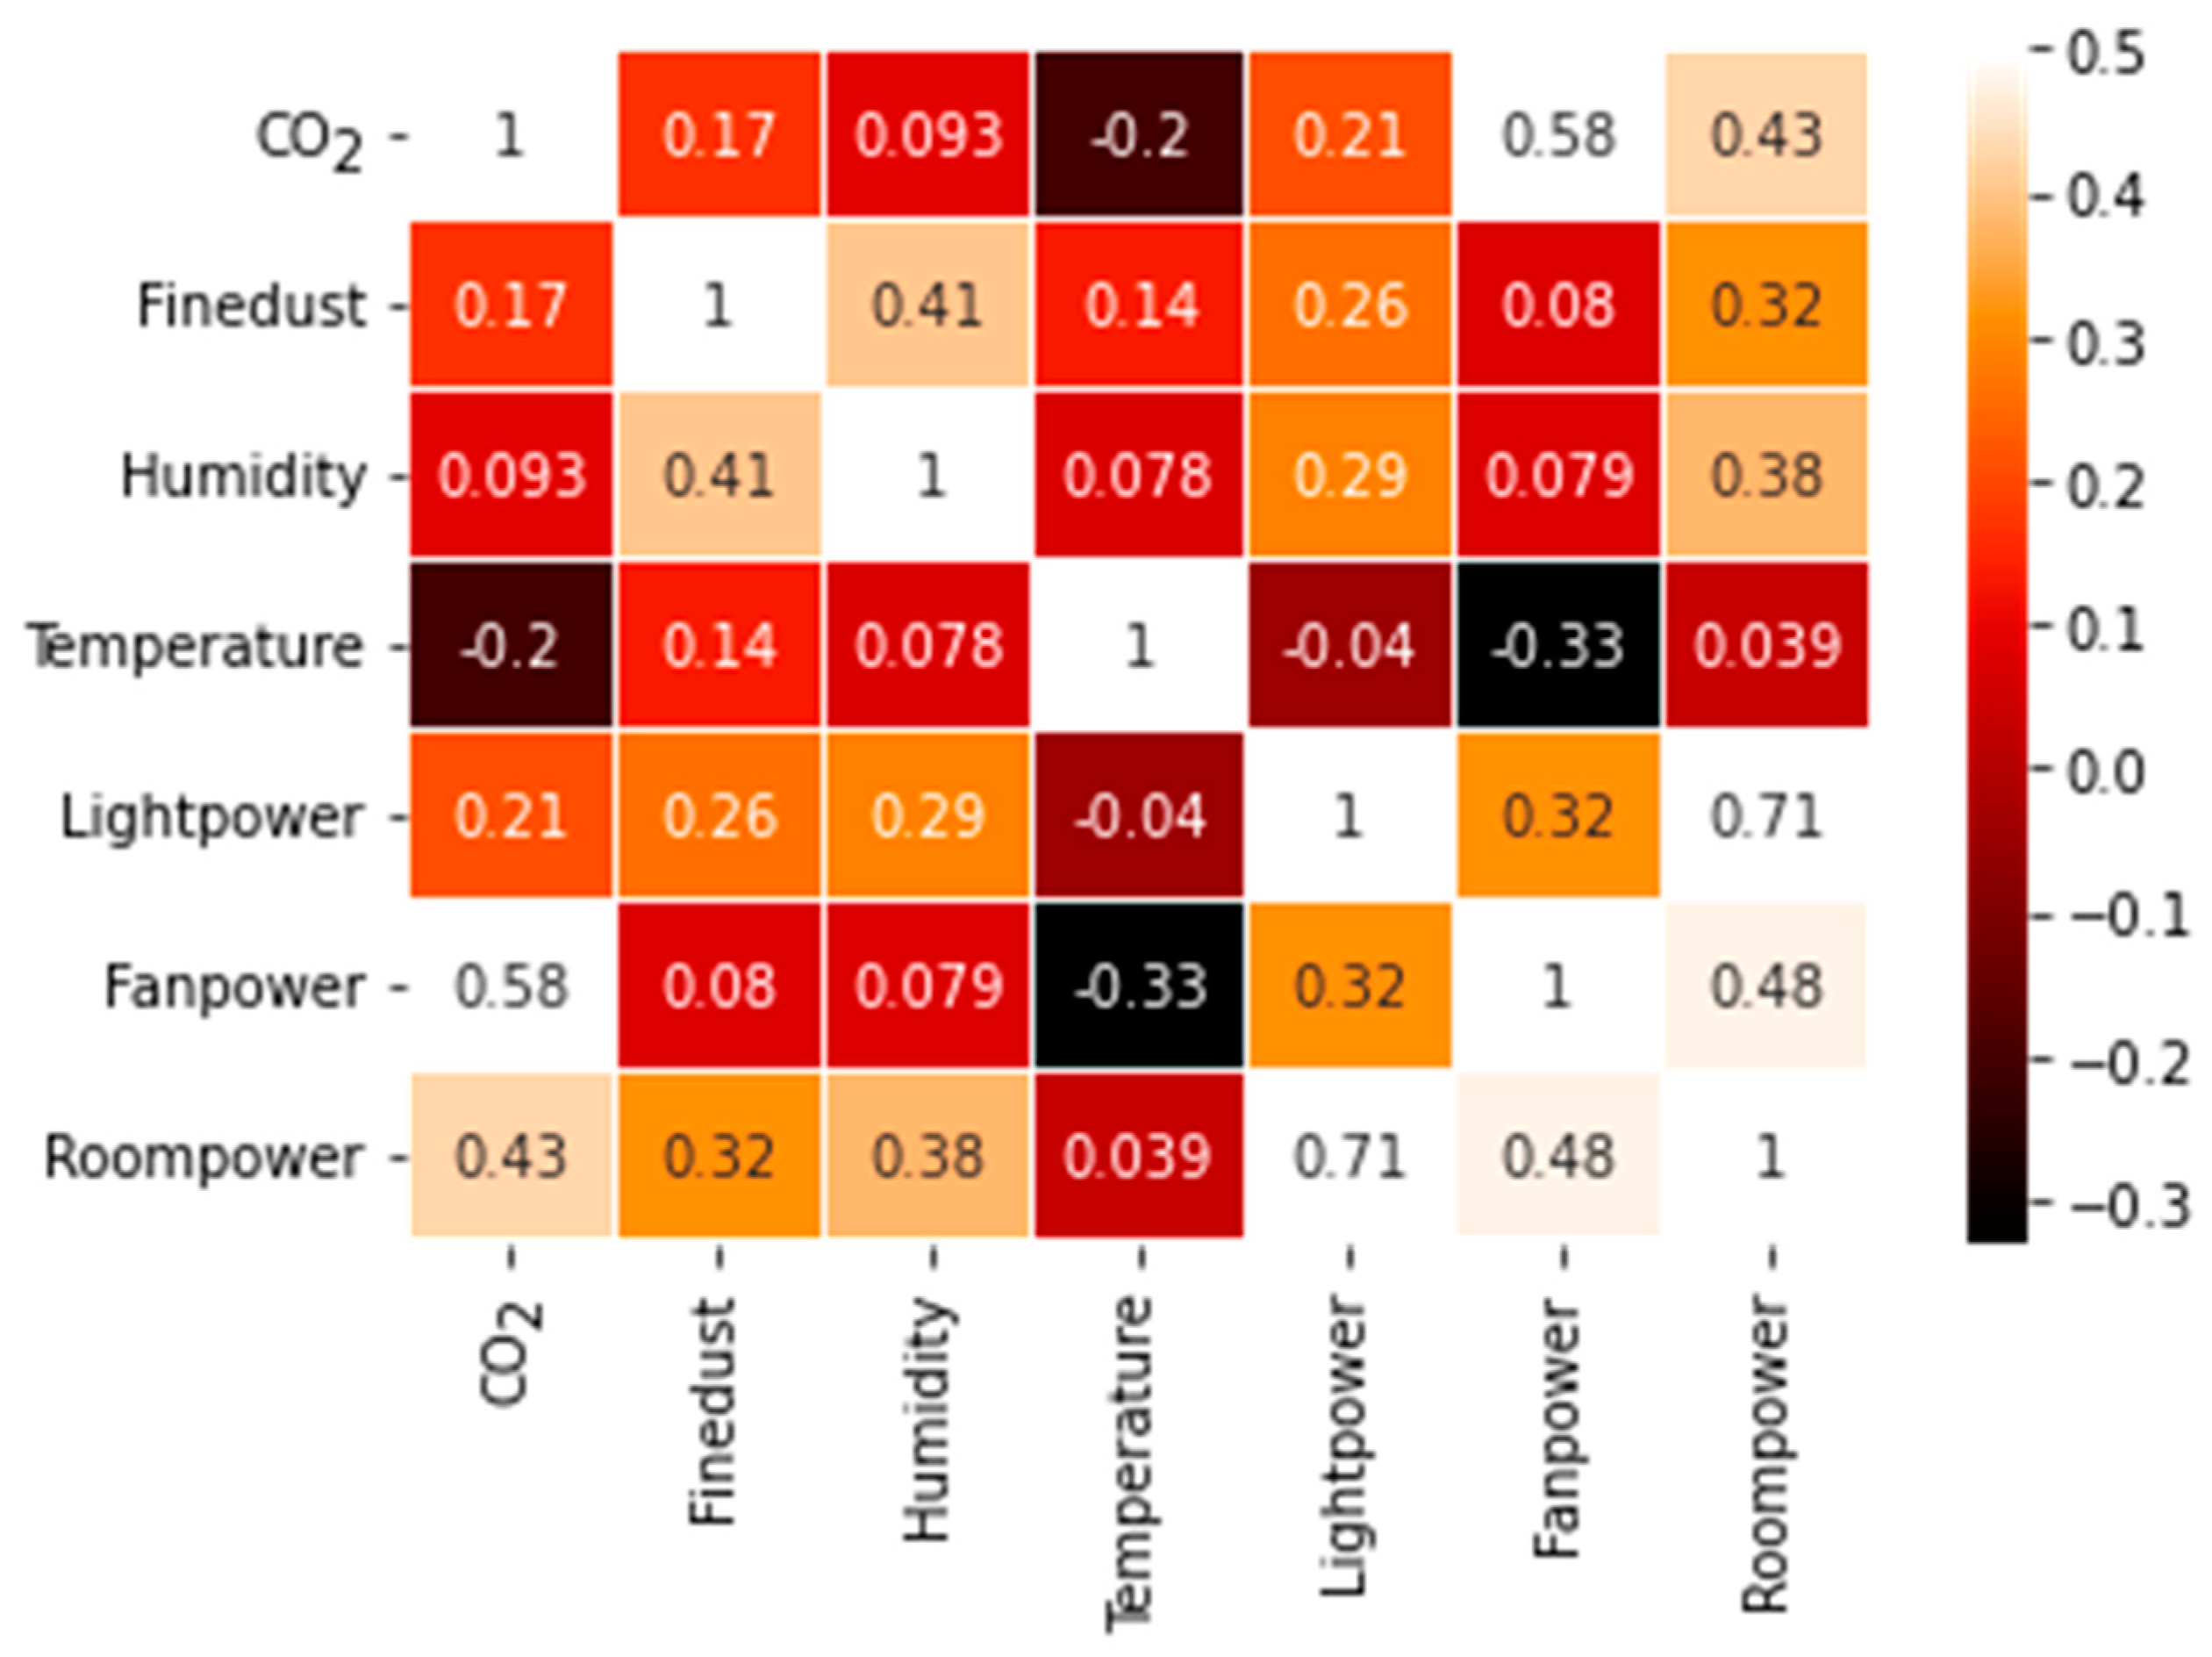
Figure 7.
Data classification.

Figure 8.
Implementation of the optimal prediction model.
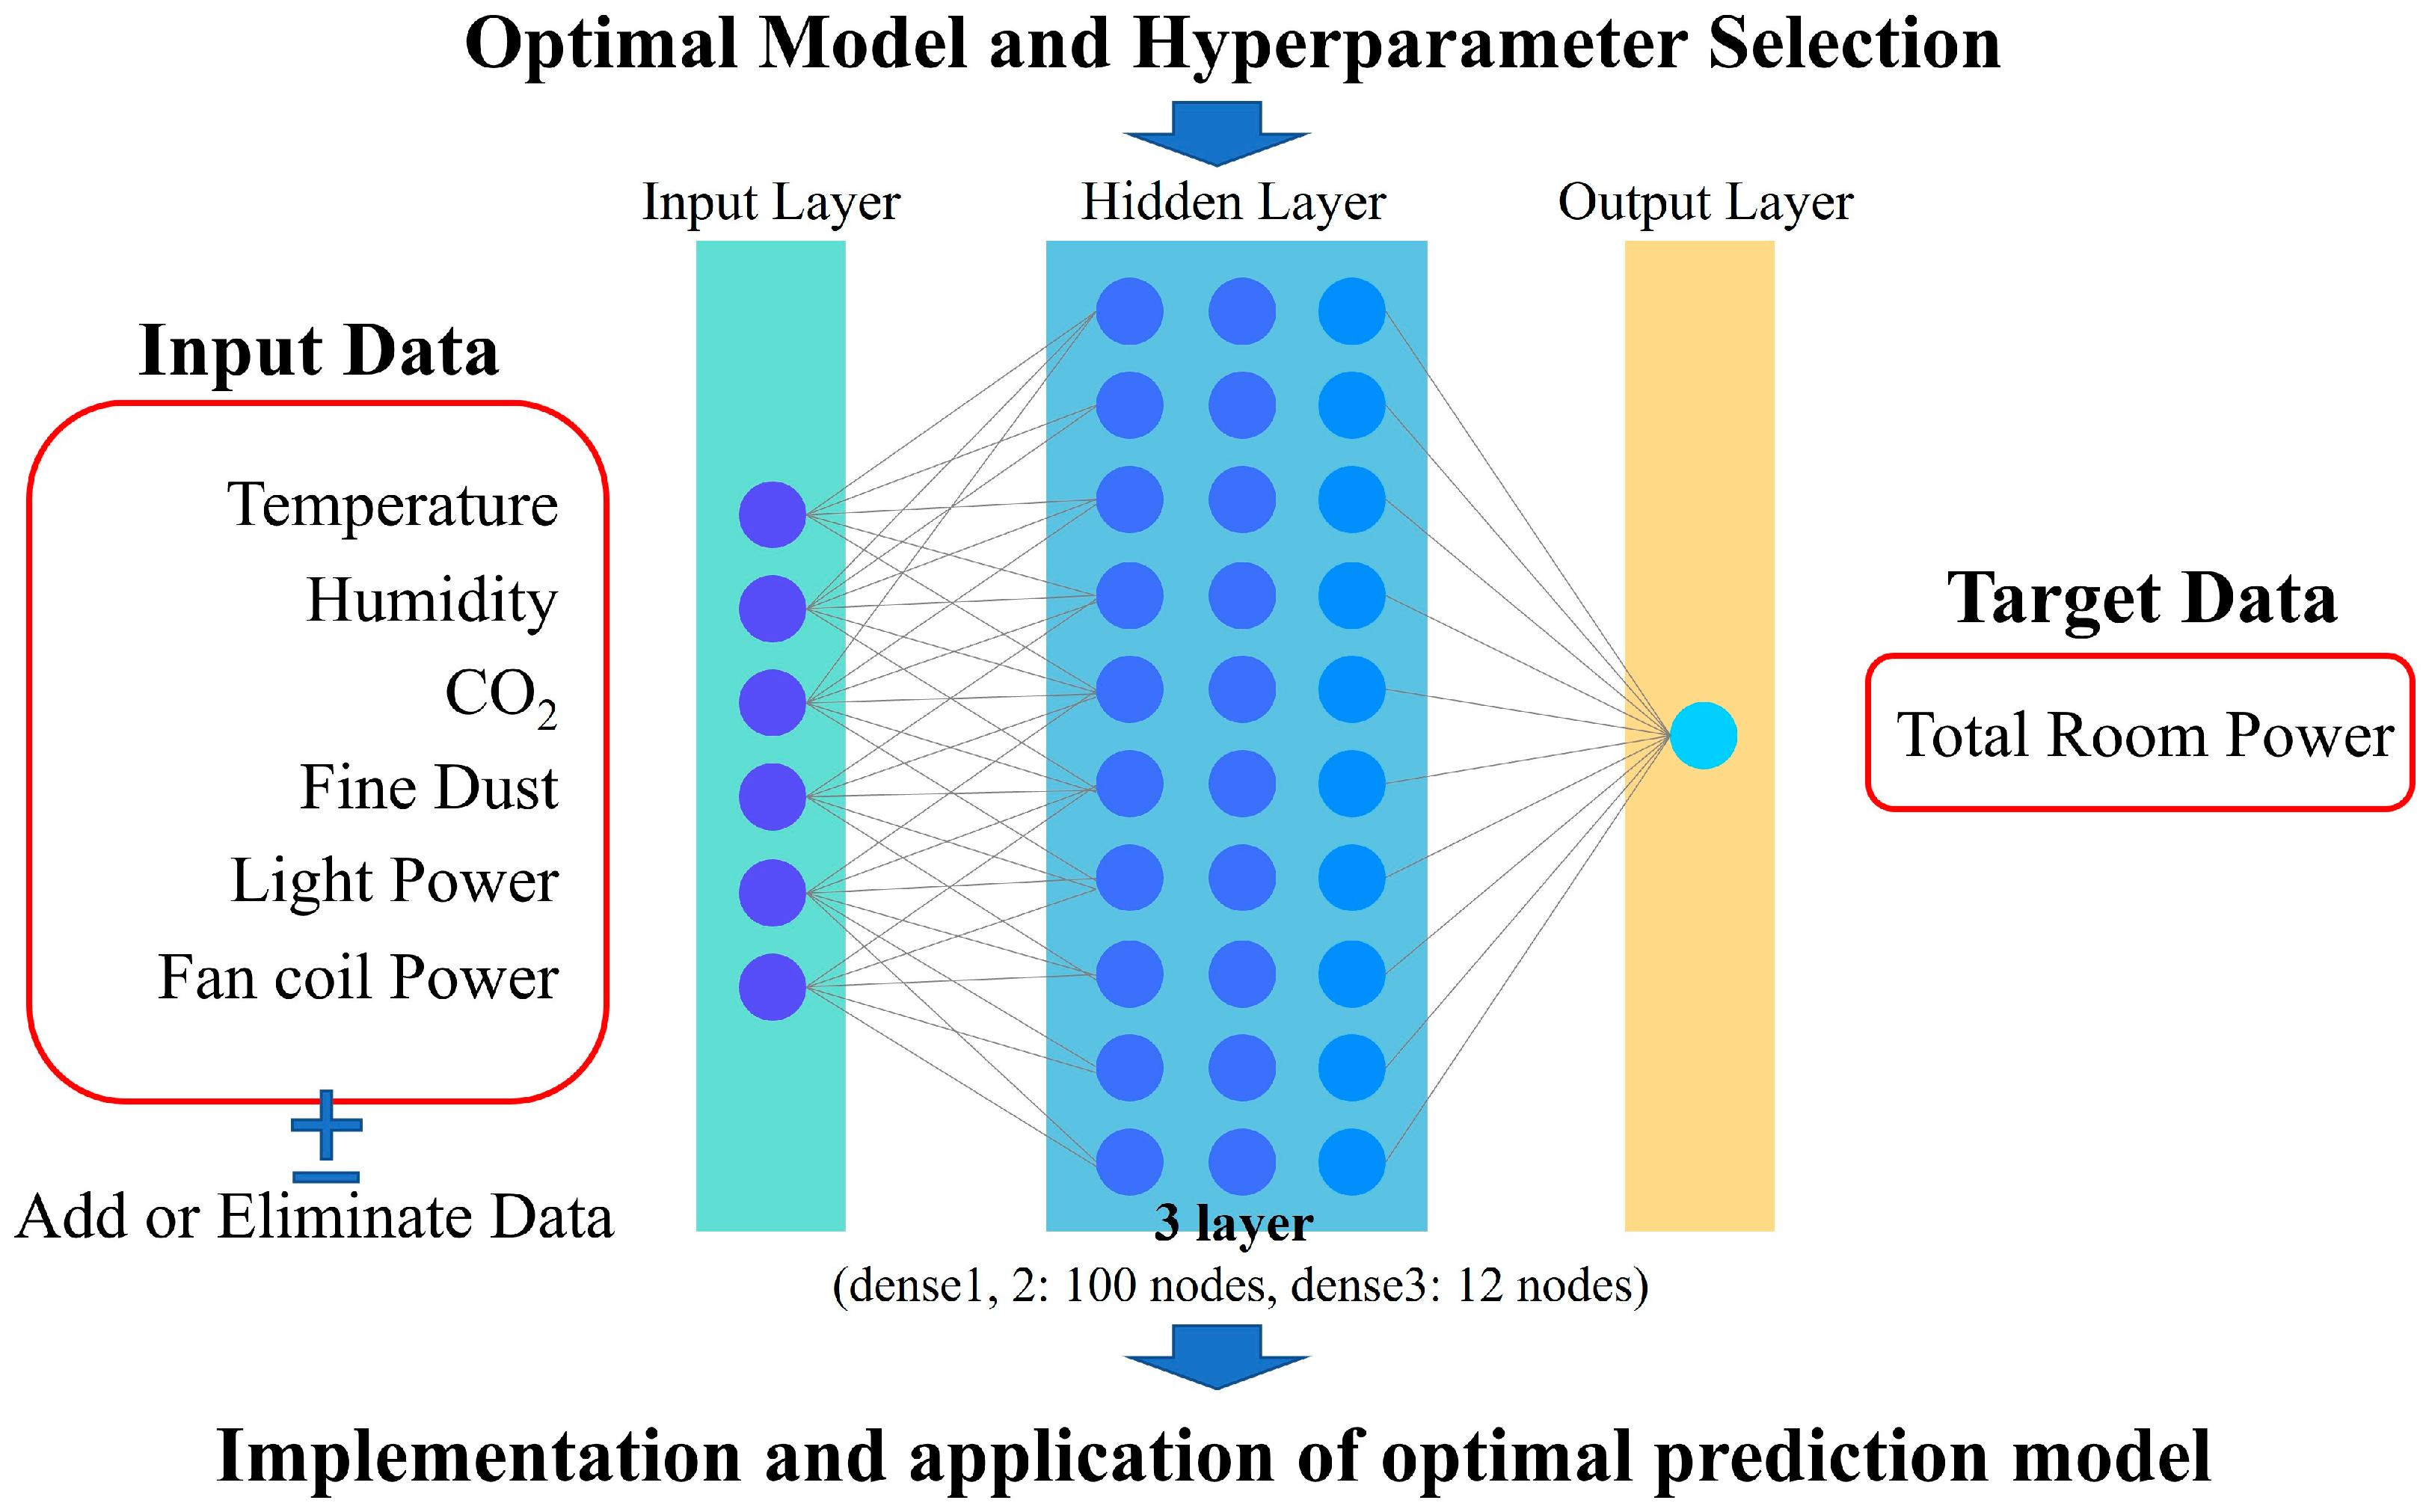
Figure 9.
Data forecast graph as a result of deep learning.

Figure 10.
Variation in model performance (RMSE) per sensing classification in the deep learning model.
Figure 10.
Variation in model performance (RMSE) per sensing classification in the deep learning model.
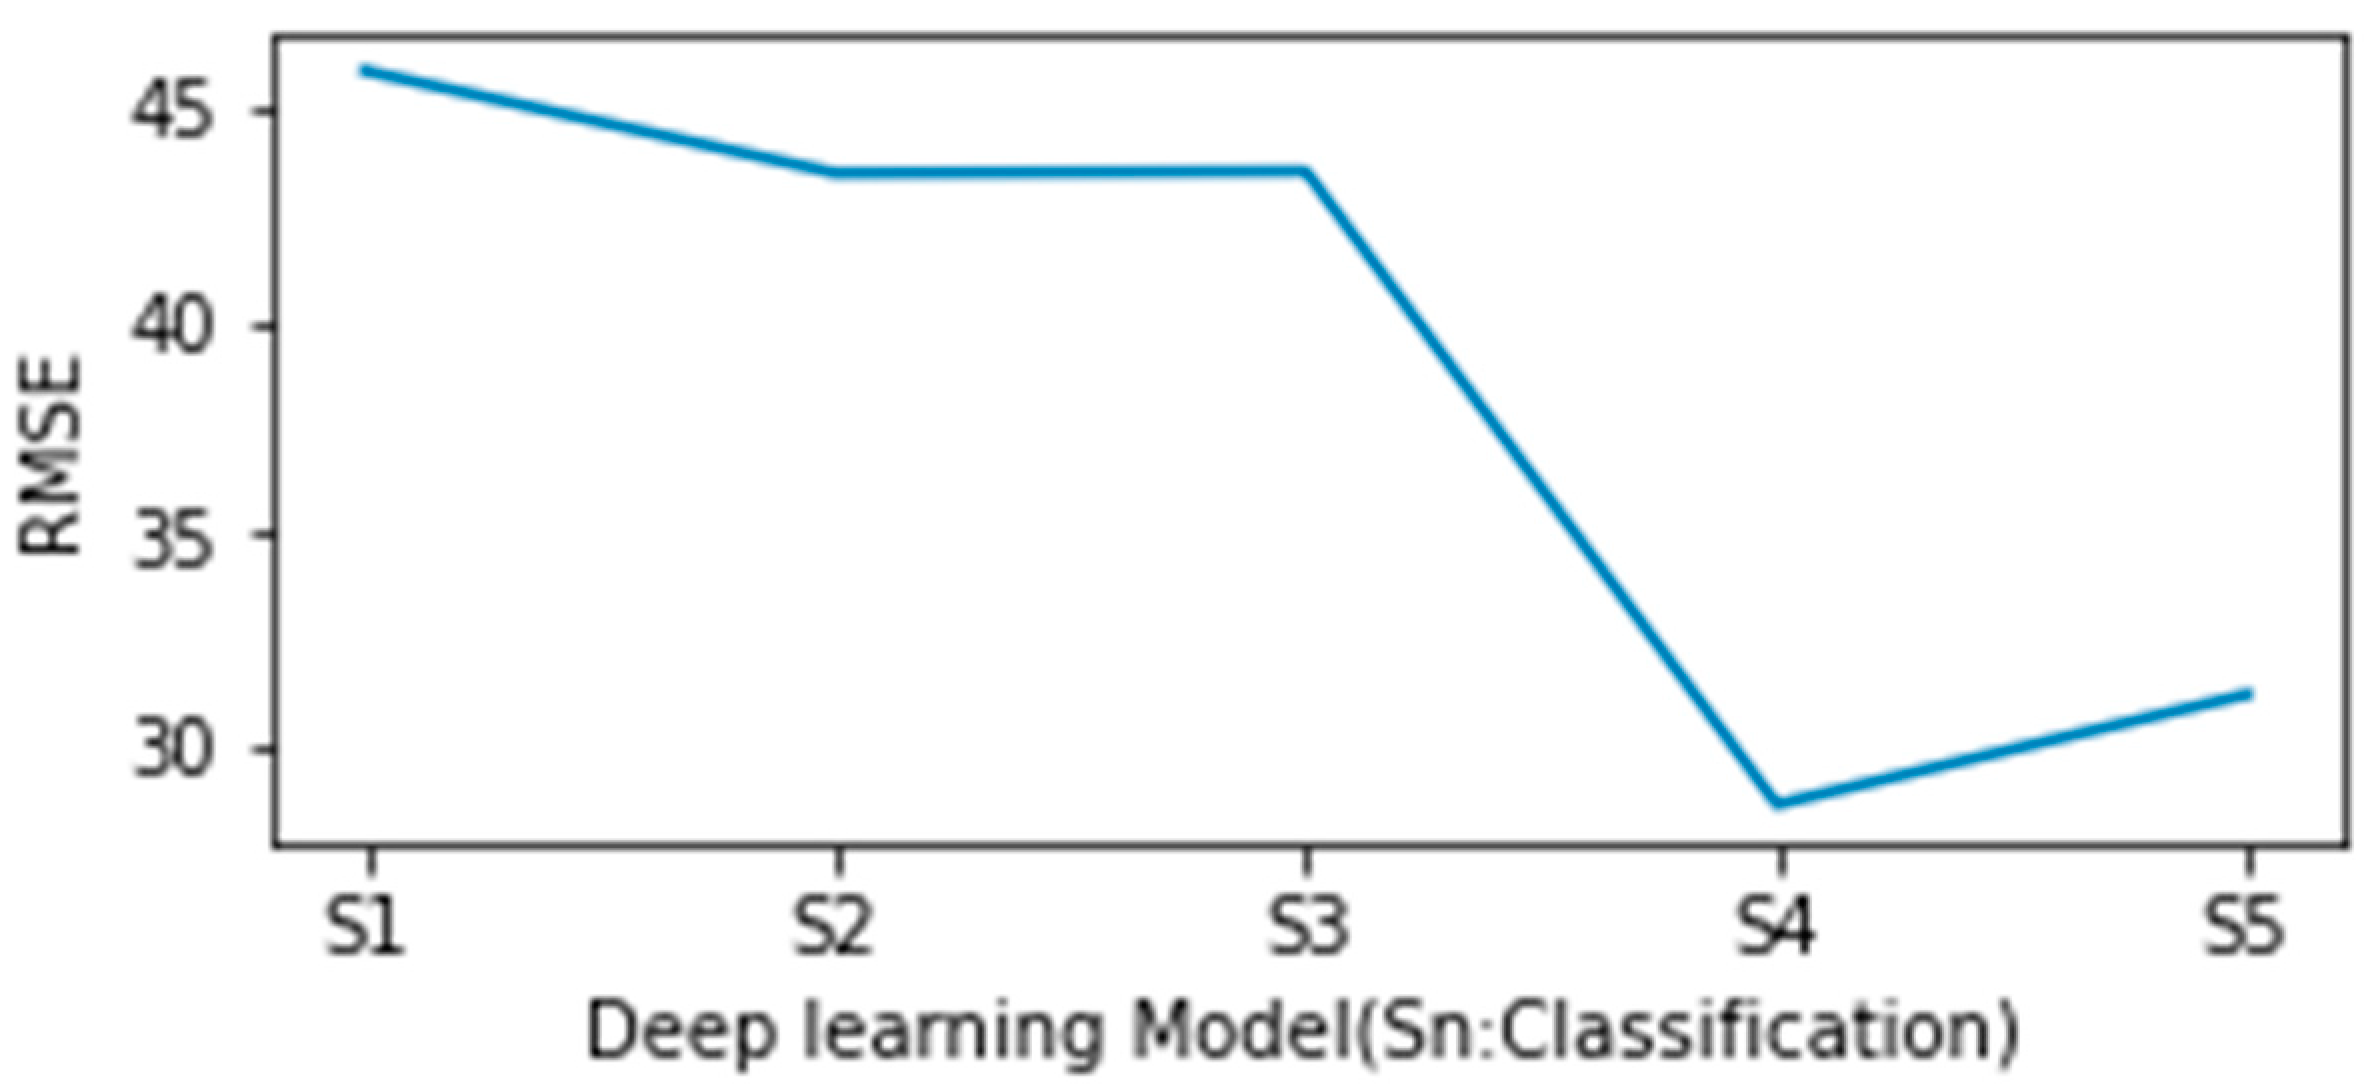
Figure 11.
Data forecast graph from machine learning.
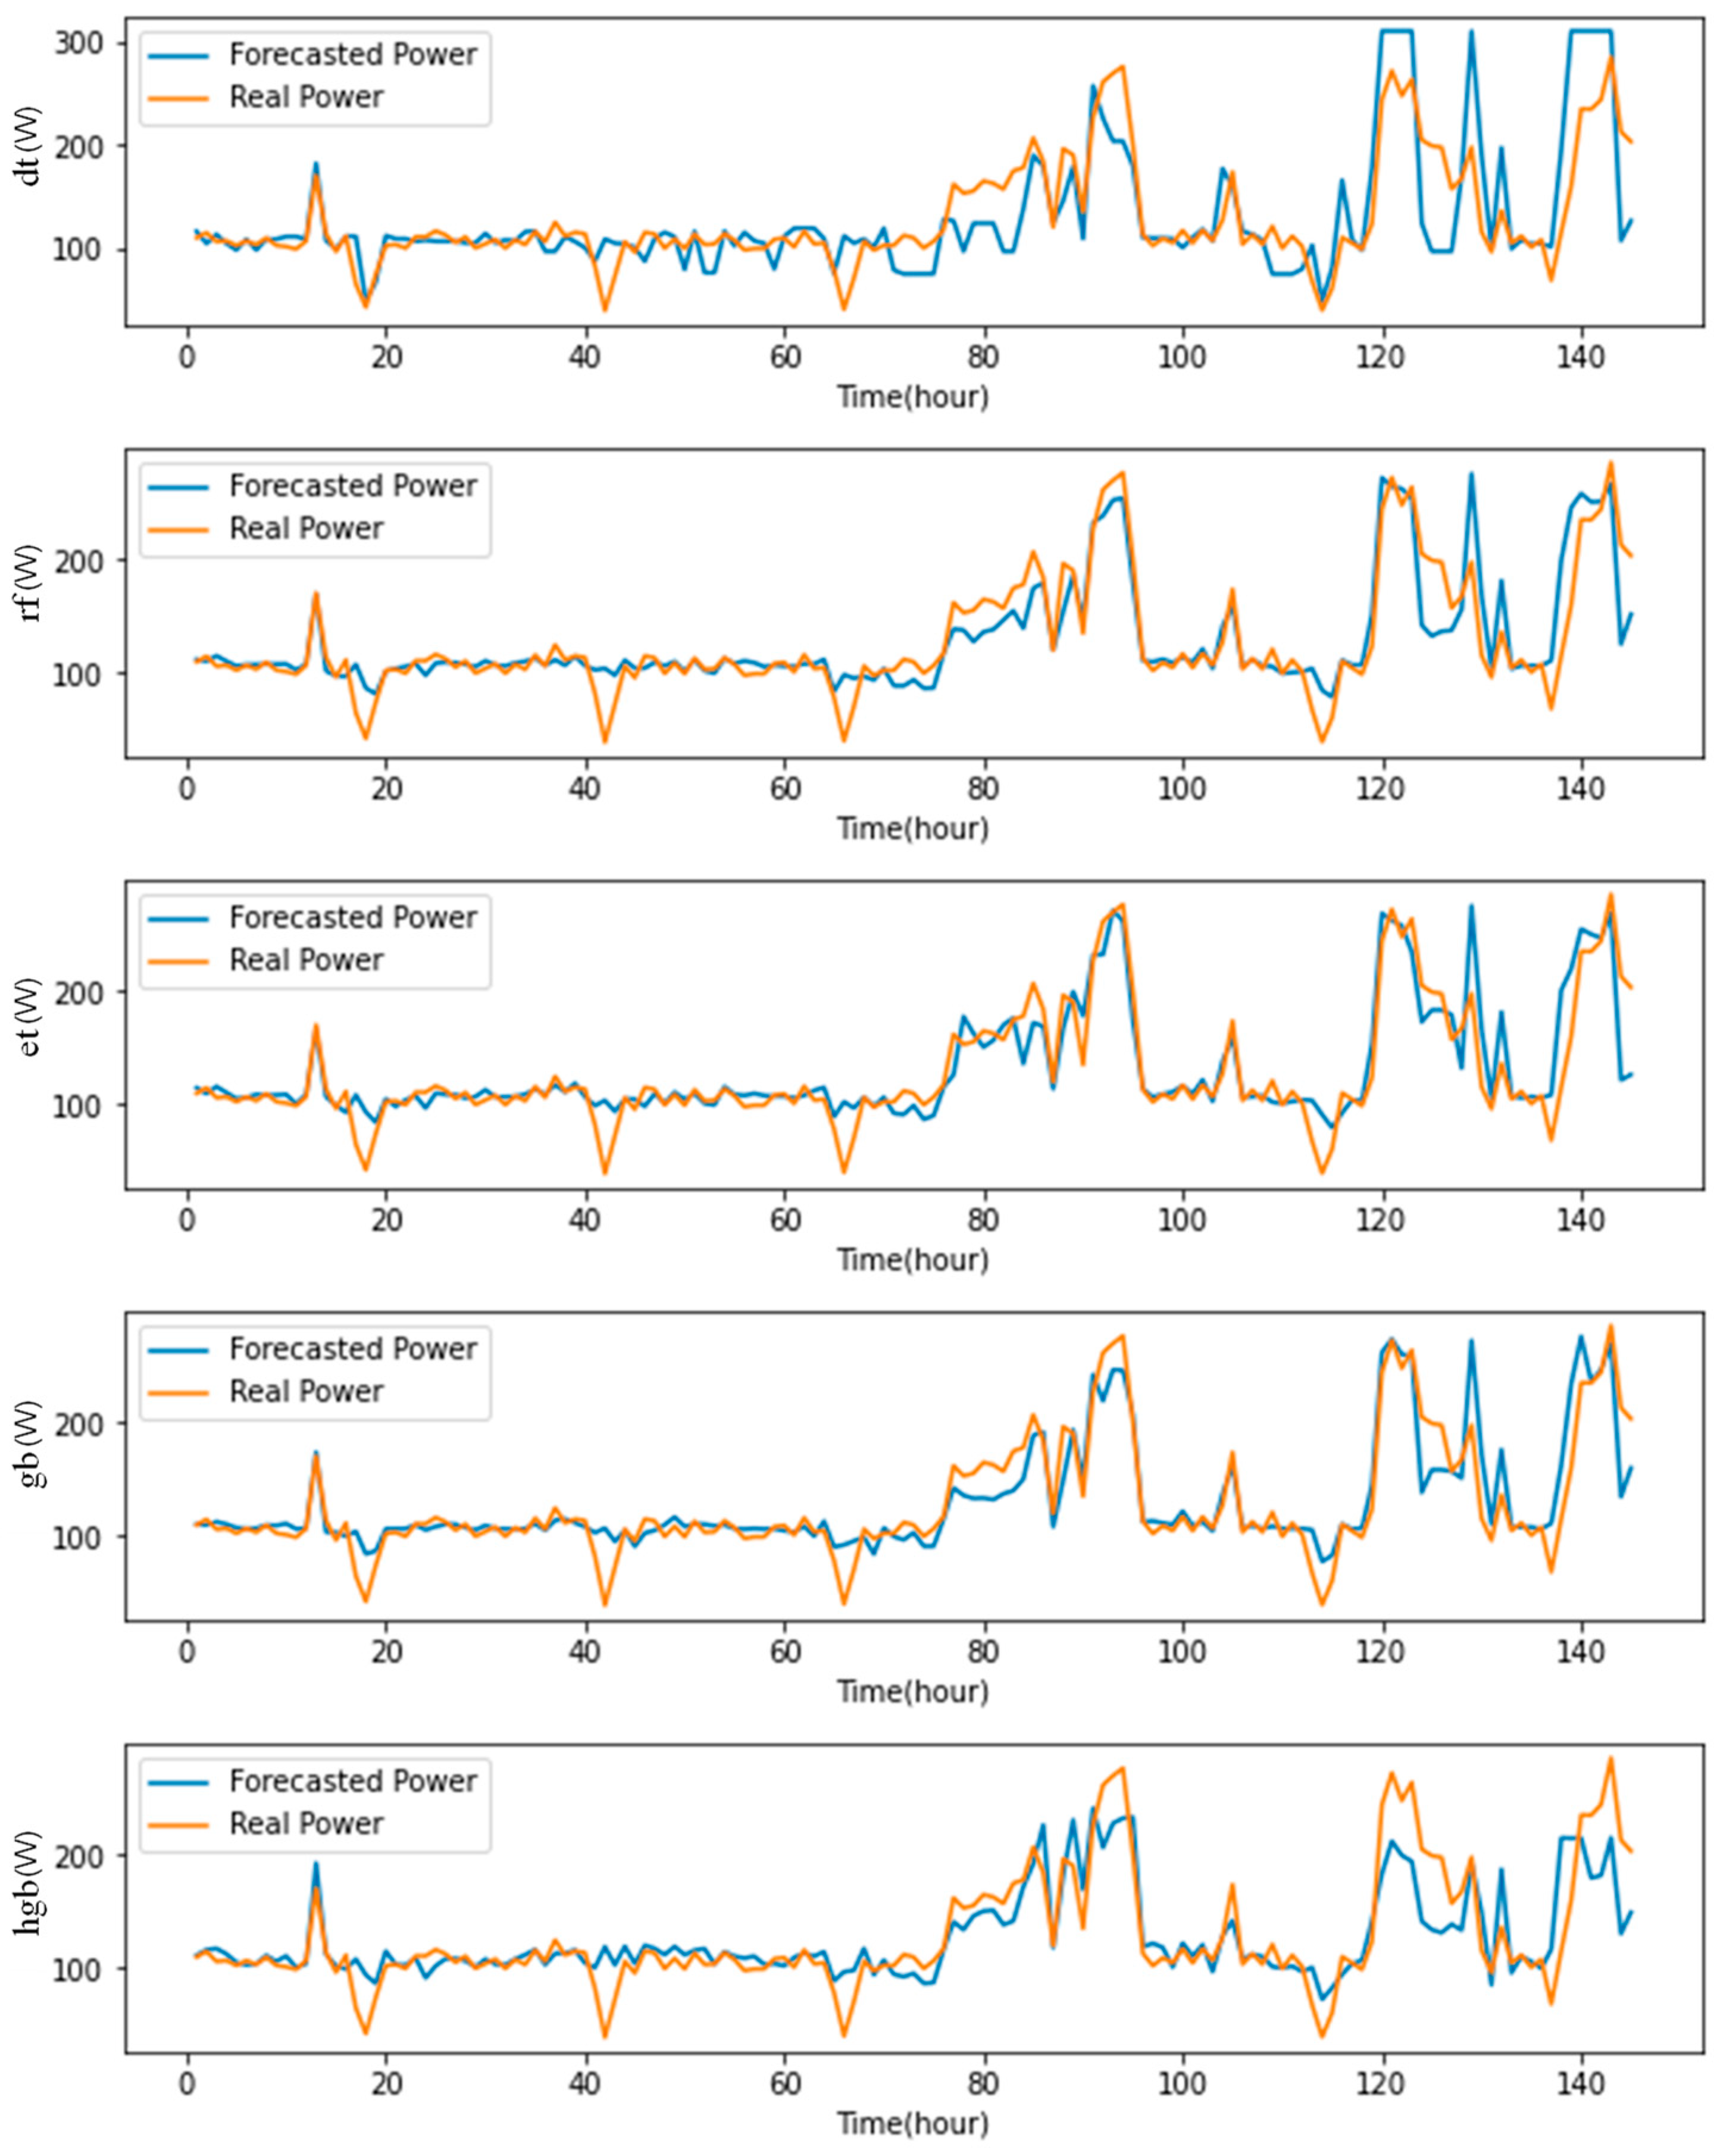
Figure 12.
Variation in model performance (RMSE) of each machine leaning model.
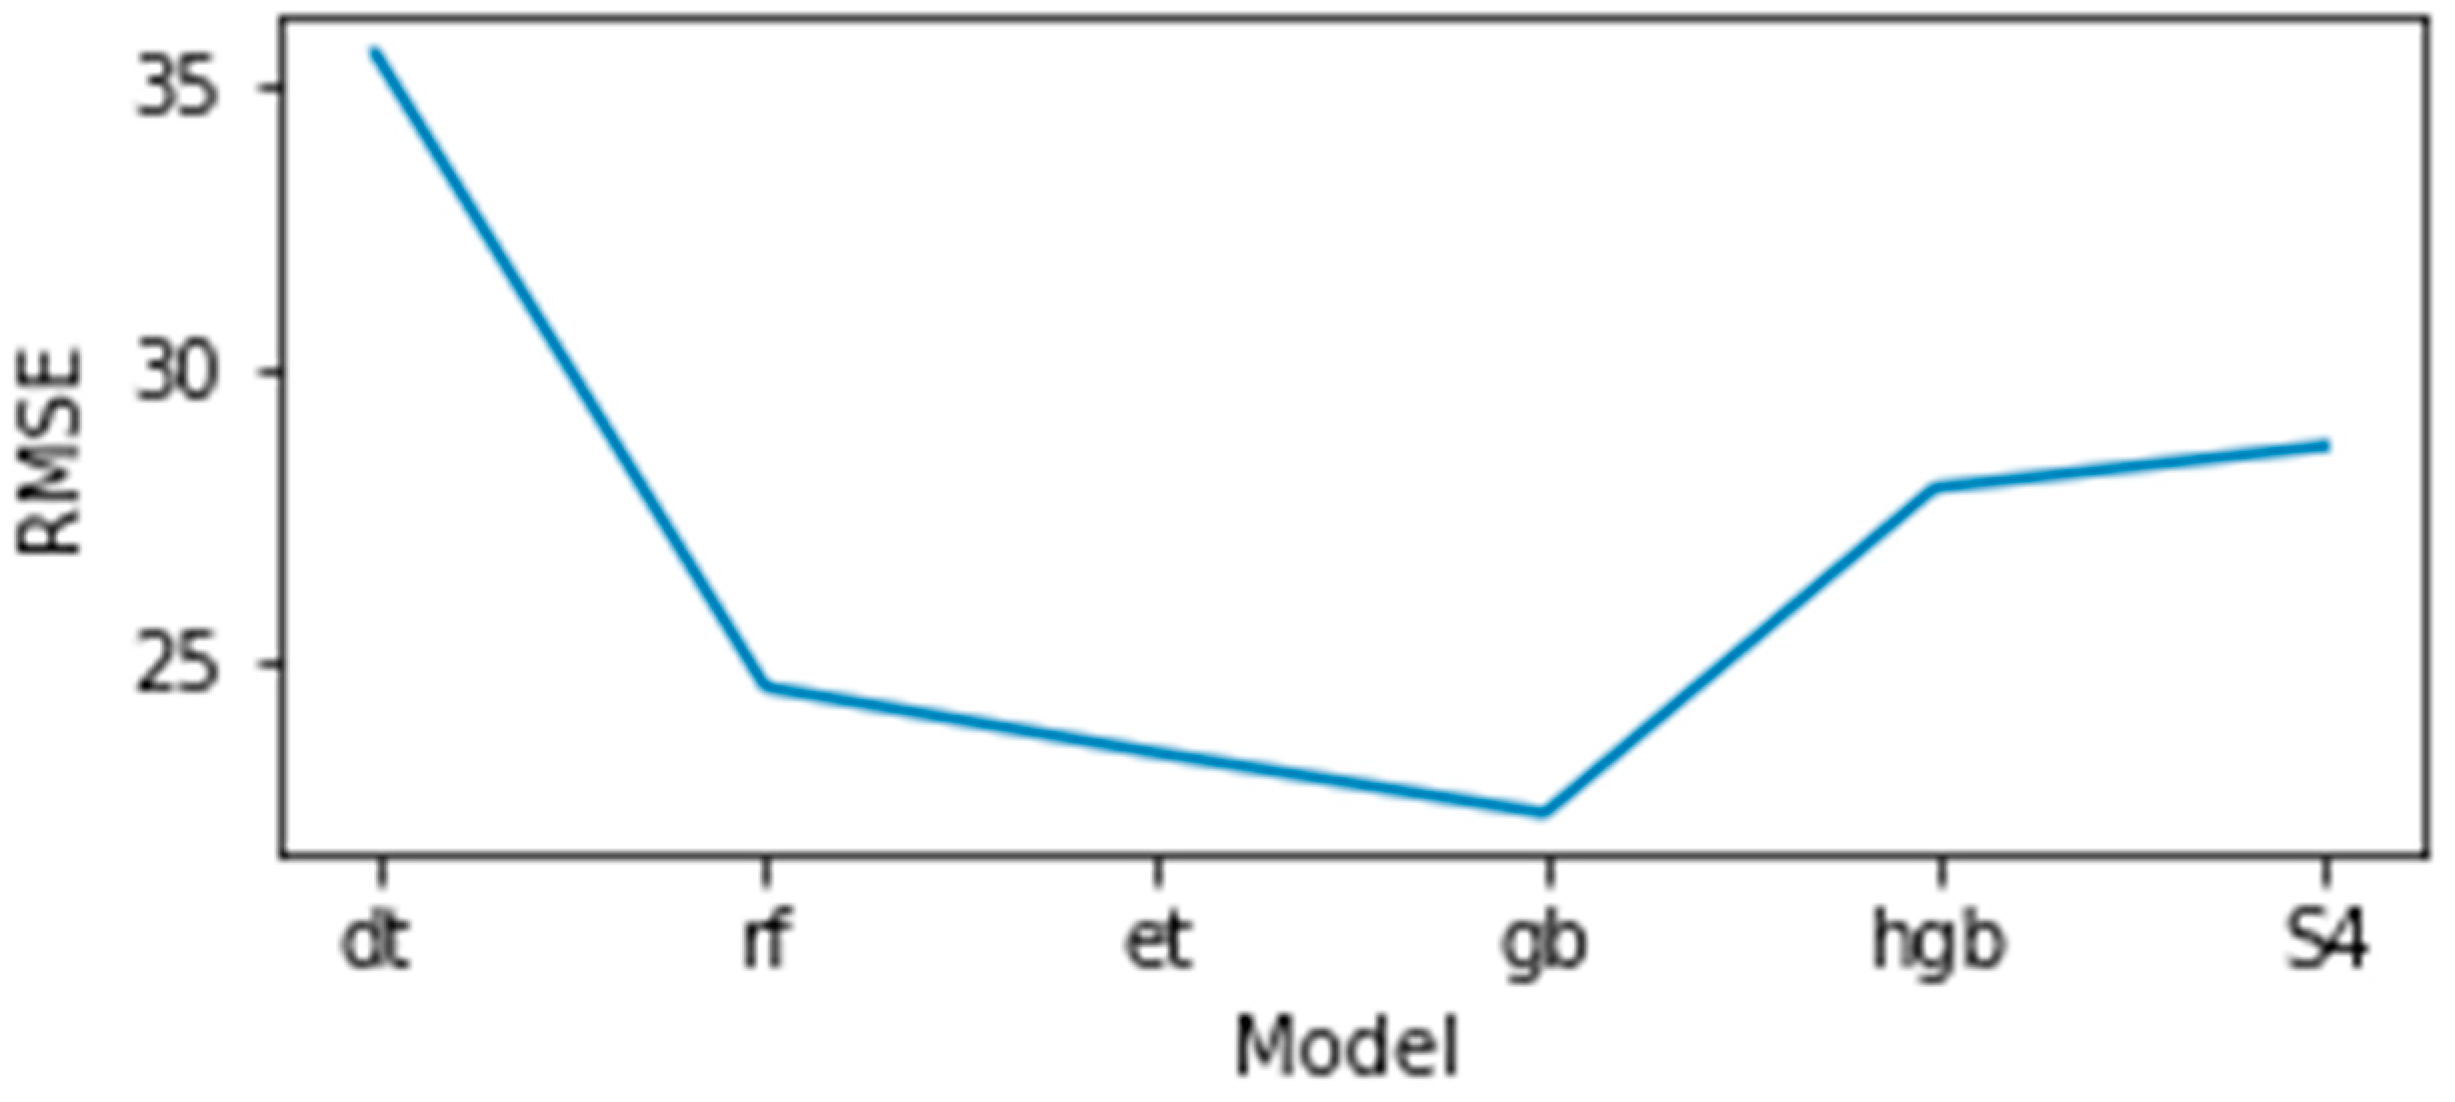
Figure 13.
Cost reduction rate.

Table 1.
Analysis of related works with proposed system.
| Author(s) | Publication Date | Application Field | Similarity | ||||||
|---|---|---|---|---|---|---|---|---|---|
| AI | IoT | Smart Home | Energy Management | Health Care | Security | Cost-Effective System Design | |||
| Machorro-Cano, et al. [8] | 2020 | √ | √ | √ | √ | 75% | |||
| Wang, et al. [9] | 2020 | √ | √ | √ | 50% | ||||
| Filipe, et al. [10] | 2021 | √ | √ | √ | 60% | ||||
| Jmila, et al. [11] | 2022 | √ | √ | √ | √ | 30% | |||
| Huang, et al. [12] | 2023 | √ | √ | √ | √ | 60% | |||
| Kabir, et al. [13] | 2015 | √ | √ | √ | √ | 55% | |||
| Lee, et al. [14] | 2019 | √ | √ | √ | √ | 60% | |||
| Li, et al. [15] | 2020 | √ | √ | √ | √ | 40% | |||
| Kasaraneni, et al. [16] | 2022 | √ | √ | √ | √ | √ | 40% | ||
| Popa, et al. [17] | 2019 | √ | √ | √ | √ | 65% | |||
| Dey, et al. [18] | 2017 | √ | √ | √ | √ | 70% | |||
| Rahman, et al. [19] | 2019 | √ | √ | √ | √ | 75% | |||
| Uddin, et al. [20] | 2017 | √ | √ | √ | √ | 50% | |||
| Sundaravadivel, et al. [21] | 2018 | √ | √ | √ | √ | 40% | |||
| Solatidehkordi, et al. [22] | 2023 | √ | √ | √ | √ | 65% | |||
| Proposed System | √ | √ | √ | √ | √ | - | |||
Table 2.
IoT sensor devices.
| Items | Characteristics | Uses | |
|---|---|---|---|
 | Temperature and humidity sensor |
| Collecting indoor temperature/humidity data |
 | Fine dust/ CO2 sensor |
| Collecting indoor CO2, fine dust data |
 | Smart motion sensor |
| Indoor user movement detection |
 | Smart submeter |
| Measure the room’s power utilization |
Table 3.
Sensing data described.
| Index | CO2 (ppm) | Fine Dust (µg/m2) | Humidity (%) | Temperature (°C) | Light Power (W) | Fan Power (W) | Room Power (W) |
|---|---|---|---|---|---|---|---|
| Count | 721 | 721 | 721 | 721 | 721 | 721 | 721 |
| Mean | 947.2059 | 5.836186 | 56.14233 | 25.46187 | 15.7639 | 11.62537 | 119.0838 |
| Std | 420.4869 | 4.574005 | 2.96905 | 0.331475 | 8.86753 | 8.814615 | 37.96945 |
| Min | 168.15 | 1.92 | 50.03 | 23.64 | 9.87 | 0.12 | 38.99 |
| 25% | 655.91 | 3.35 | 54.17 | 25.44 | 13.35 | 5.72 | 104.67 |
| 50% | 839.03 | 4.5 | 55.7 | 25.54 | 13.41 | 9.55 | 111.03 |
| 75% | 1186.46 | 6.26 | 57.62 | 25.6 | 13.49 | 14.95 | 119.76 |
| Max | 2441.44 | 44.88 | 79.69 | 26.69 | 58.75 | 42.62 | 311.35 |
Table 4.
Analysis of relationship.
| Range | Meaning |
|---|---|
| From −1.0 to −0.7 | Strong negative linear relationship |
| From −0.7 to −0.3 | Distinct negative linear relationship |
| From −0.3 to −0.1 | Weak negative linear relationship |
| From −0.1 to +0.1 | A linear relationship that can be almost neglected |
| From +0.1 to +0.3 | Weak positive linear relationship |
| From +0.3 to +0.7 | Clear positive linear relationship |
| From +0.7 to +1.0 | Strong positive linear relationship |
Table 5.
Model performance per sensing classification.
| Classifications | S1 | S2 | S3 | S4 | S5 |
|---|---|---|---|---|---|
| RMSE | 45.83 | 43.43 | 43.48 | 28.68 | 31.25 |
Table 6.
Sensing classifications.
| Classifications | Sensor List |
|---|---|
| S1 | CO2, Fine Dust |
| S2 | S1 + Humidity |
| S3 | S2 + Temperature |
| S4 | S3 + Light Power |
| S5 | S4 + Fan Power |
Table 7.
Machine learning model.
| Classifications | Machine Learning Model |
|---|---|
| dt | Decision Tree Regressor |
| rf | Random Forest Regressor |
| et | Extra Trees Regressor |
| gb | Gradient-Boosting Regressor |
| hgb | Hist Gradient-Boosting Regressor |
Table 8.
Model performance per machine learning model.
| Classifications | dt | rf | et | gb | hgb | S4 |
|---|---|---|---|---|---|---|
| RMSE | 35.50 | 24.48 | 23.35 | 22.29 | 27.95 | 28.68 |
Disclaimer/Publisher’s Note: The statements, opinions and data contained in all publications are solely those of the individual author(s) and contributor(s) and not of MDPI and/or the editor(s). MDPI and/or the editor(s) disclaim responsibility for any injury to people or property resulting from any ideas, methods, instructions or products referred to in the content. |
© 2023 by the author. Licensee MDPI, Basel, Switzerland. This article is an open access article distributed under the terms and conditions of the Creative Commons Attribution (CC BY) license (https://creativecommons.org/licenses/by/4.0/).
Share and Cite
MDPI and ACS Style
Park, S. Machine Learning-Based Cost-Effective Smart Home Data Analysis and Forecasting for Energy Saving. Buildings 2023, 13, 2397. https://doi.org/10.3390/buildings13092397
AMA Style
Park S. Machine Learning-Based Cost-Effective Smart Home Data Analysis and Forecasting for Energy Saving. Buildings. 2023; 13(9):2397. https://doi.org/10.3390/buildings13092397
Chicago/Turabian StylePark, Sanguk. 2023. "Machine Learning-Based Cost-Effective Smart Home Data Analysis and Forecasting for Energy Saving" Buildings 13, no. 9: 2397. https://doi.org/10.3390/buildings13092397
Note that from the first issue of 2016, this journal uses article numbers instead of page numbers. See further details here.