


Reliability-Based Proof Load Factors for Assessment of Bridges
by
 , ,
, ,
Christian Overgaard Christensen
1,*,
Kenneth Dahl Schiøttz Damsgaard
1,2,
John Dalsgaard Sørensen
1 ,
,
Svend Engelund
2,
Per Goltermann
3 and
Jacob Wittrup Schmidt
1 1
Department of the Built Environment, University of Aalborg, 9220 Aalborg, Denmark
2
Transport Infrastructure, COWI A/S, 9000 Aalborg, Denmark
3
Department of Civil and Mechanical Engineering, Technical University of Denmark, 2800 Kongens Lyngby, Denmark
*
Author to whom correspondence should be addressed.
Buildings 2023, 13(4), 1060; https://doi.org/10.3390/buildings13041060
Submission received: 17 March 2023
/
Revised: 13 April 2023
/
Accepted: 14 April 2023
/
Published: 18 April 2023
(This article belongs to the Special Issue Experiment and Analysis of Building Structures)
Abstract
:Advanced reliability assessment can be required when evaluating existing bridge structures through proof load testing. The target load of a proof load test typically requires input from resistance models; however, bridges with a low documentation level are often the most relevant for proof load testing, and resistance models thus involve significant uncertainties. This paper presents a different approach to proof loading and target proof load, in which the resistance model is not included in the determination of this load. Instead, the target proof load is determined based on load models coupled to the desired target failure probability, thus ensuring sufficient safety of the existing bridge. The method is in line with the proposal for a new Eurocode on assessment of existing structures and is deemed to be superior to existing approaches. An essential assumption of the method is that monitoring systems can identify stop criteria before irreversible damage occurs. The approach was applied in a case study, where an OT-slab bridge with a span of 6.5 m was proof-load-tested and reclassified for capacity upgrading of a road stretch in Denmark.

1. Introduction
Assessment of existing bridges is a topic of growing interest among bridge owners, especially within the road and railway systems of the European Union. A significant part of the bridge stock was built in the 1960s and 1970s, and existing capacity estimates fail to satisfy the requirements set by present-day traffic loads. In addition, many of these bridges are often without documentation or with reduced documentation; consequently, assessment by analytical tools may be challenging due to missing input. These aspects raise concerns regarding reliability and continued service life. From all engineering, sustainability, and societal perspectives, there is a strong incentive for the conservation and service life extension of such bridges.
In recent years, many studies have been initiated to identify the actual in situ capacity of the aging bridge stock [1,2,3,4,5,6]. A common observation from the literature and associated load tests is that the standard theoretical methods that are used in the capacity assessment give conservative results and that the actual resistance is usually higher [7,8,9,10,11]. This is because many methods do not precisely reflect the complex structural behavior [12]. The structural behavior may, for example, be affected by different system effects, the contribution of non-structural elements, load redistribution, and bearings not behaving in an “idealized” manner [5,13,14,15,16]. It is desirable that the assessment of existing bridges is not overly conservative and, thus, results in the replacement of satisfactory bridges. As such, load testing using diagnostic or proof loading methods may be appropriate in cases in which the analytical analysis is expected to provide an unsatisfactory result or is challenging to perform due to a lack of input data [3,17,18]. A successful proof load test immediately demonstrates that the resistance of a bridge is greater than the proof load. From a reliability perspective, this eliminates the problem of unknown resistance and demonstrates a satisfactory reliability level [3,19]. Most existing reliability methods for determining the target proof load require input parameters on the bridge resistance; however, since proof loading is primarily relevant for structures with uncertainty surrounding such parameters, the existing methods may thus be inadequate [3].
Hypothesis and Research Scope
This paper follows the line of thought of a possible new Eurocode “prEN 1990-2: Eurocode—Basis of assessment and retrofitting of existing structures: general rules and actions” [20], by which the target proof load may be determined by using a different approach to structural reliability. The method dedicates its focus toward load modeling. An example of a successful proof load test and reclassification of an existing bridge is given with a basis in the Danish classification system [21,22] and the Danish probabilistic design guideline [23].
Research questions:
- Can the target proof load be determined based on load modeling and without input from a resistance model while ensuring sufficient reliability (safety) of an existing bridge structure after a successful proof load test?
- Can advanced real-time monitoring be applied in a simplified and selective way for stop criteria evaluation?
2. State of the Art
2.1. Reliability-Based Methods
The reliability (or safety) of a structure is influenced by resistance and loading variability. This is most simply presented in the form of a limit state equation, see Equation (1).
where R is the resistance, Q is the load effect, and are random variables for loads, resistance, and models. The probability of failure is given by and may, thus, be determined from the random variables and associated statistical distributions. The failure probability can also be expressed by the reliability index; see Equation (2).
where is the inverse normal probability distribution function. Several methods are available to calculate the reliability index, and structural reliability theory has a wide range of applications [24]. However, a target failure probability or reliability index is often used to determine a design parameter in the management of structures through reliability-based design. National annexes often set appropriate reliability levels for the assessment of existing structures [20].
Before considering load testing, the probabilistic model controlling the bridge resistance may be updated by site-specific data by using Bayes theorem, a general theorem applicable to any case in which existing probabilistic knowledge is updated with new information [25]. Although on-site inspections are “risk-free” in this respect, they may not be sufficient in themselves to assess an existing bridge for a proposed load rating. Following a target proof load, the bridge reliability may similarly be updated [3]. It is important to note that the observation that a bridge survives a proof load test indicates the minimum load-carrying capacity of the bridge at the time of testing; it does not reveal the actual bridge capacity. Such an updating was performed by [26] in a systematic updating of bridge reliability through proof loading. Figure 1 shows the effect of a proof load test on the probability density function of a resistance model. As a result of a successful proof load test, all realizations below the proof load level are removed, and the lower tail of the distribution is, thus, truncated at the target proof load level. This results in a higher reliability level. A similar representation is presented in the study of [27], in which the reliability index was determined based on proof load testing, and a sensitivity analysis was performed regarding the variation in the resistance parameters. Other relevant studies dealing with bridge reliability evaluation by using load tests are [3,6,12,28,29].
2.2. Load Modeling
The load component of Equation (1) is typically represented by a stochastic load model based on traffic loads, intensities and frequencies, and associated uncertainty parameters. Due to differences in traffic intensity, along with legislation, administration, and handling of special vehicles, such load models vary significantly between countries. For instance, the study of Casas et al. [12] considers load models from five different European countries, among which, the Dutch road network has a significantly higher demand for bridges of the road network. This emphasizes the importance of choosing the right load model and explains why it is challenging to implement a general European load model for road bridges. The “prEN 1990-2” [20] thus states that traffic loads on bridges should generally be assessed by using EN 1991-2, but that alternative traffic load models for assessment may be set by national annexes.
For a typical highway bridge, the load includes dead load, live load, dynamic load effects, environmental load, braking forces, collision loads, etc. For short and medium-span bridges, the dead load, live load, and dynamic load often govern the design [26]. In addition, the statistical characteristics of the individual axle loads are important for short-span bridges [12]. For longer-span bridges, it is relevant to consider other effects, such as pulse effects from the formation of vehicle queues [30].
Design loads are normally calibrated such that the loads are only exceeded with a sufficiently long return period. In modern design codes, such calibration is based on probabilistic models of the loading, broadly valid for all bridges within the considered class. In Denmark, traffic loads on highway bridges are defined through a classification system, which prescribes axle load configurations for different vehicle classes [21,22]. The classification system is supported by a guideline for probability-based design [23]. The combined documents provide a strong tool for traffic load administration. The important estimates of parameters in the probabilistic model are the load level (mean values), the coefficient of variation, and the frequency of the load events. As previously noted, these parameters vary between countries and are highly dependent on three primary aspects:
- Legislation and demands for heavy vehicles: What are the requirements for the considered bridge and associated traffic?
- Administration of the legislation and demands. How are the legislation and demands handled? In Denmark, for instance, heavy special vehicles must apply for a specific permit and have the full route of transport approved by the authorities.
- Check and verification of vehicles. How efficiently is it checked that vehicles do carry an illegal overload?
In Denmark, the bridge class is typically defined by the high-magnitude loads from special vehicles requiring a permit. These are few in frequency and less likely to carry an overload. In many cases, a low coefficient of variation may thus be used. However, this may not be the case in other countries, and the coefficient of variation significantly affects the load model and the reliability of a bridge. For instance, the study of [31] states that the coefficient of variation in the traffic action has a greater influence than the type of distribution (Normal, Lognormal, Gumbel).
2.3. Proof Loading, Target Load, and Stop Criteria
With an adequate load model defined, it is possible to define a target load and, thus, perform proof load testing. To perform a proof load test is a complicated and often bridge-specific task associated with both practical and theoretical challenges [32]. Several countries have national guidelines touching or dedicated to the topic of diagnostic and proof load testing [33,34,35,36,37,38,39,40,41,42,43,44,45,46,47]; however, the existing guidelines predominantly use general terms or are limited in their application. The most known of these are The Manual for Bridge Rating Through Load Testing [37] (background document for the Manual for Bridge Evaluation (MBE) of AASHTO [40]), the German guideline DAfStb [34], and the ACI 437.2M-13 [41]. The study of [48] presents flowcharts associated explicitly with the methods of diagnostic load testing and proof load testing.
Multiple approaches to determining the target proof load currently exist [3,4,12,26,27,28,49,50,51,52,53]. Most studies determine the target load based on reliability analysis, including uncertain parameters for the resistance model [3,6,27,49]. However, if sufficient information is available for the resistance model, the need for testing may be more irrelevant. This is supported by the results of [3], which show that proof load testing is less efficient when a lower resistance variability is adopted in the initial design. Thus, the bridges most relevant for proof load testing are the undocumented ones, for which conventional reliability analysis cannot be applied. In contrast, [12] determines proof loading factors to be applied to the nominal value of the traffic action based on simple parameters such as span length and percentage of heavy traffic but might also be quite conservative, with proof loading factors as high as 2.75 for an annual reliability index of β = 5.0.
Most evaluations of target load by reliability analysis primarily seek to ensure sufficient reliability of the structure after testing. Still, the risk of damaging the bridge during the proof loading test must also be considered [12]. However, it should be noted that the risk of causing irreversible damage during testing may be minimal, provided that the test is planned and executed carefully and sufficiently monitored. For example, of the more than 250 bridge tests conducted in Ontario, not a single bridge suffered any damage because of testing [12,54]. Casas et al. [12] additionally recommend that the load should be applied in increments while observing the structural response.
As such, the target load acts as the primary stop criteria, but it is supported by monitoring-based stop criteria. Current research focuses much on this with suggestions for theoretically based stop criteria [55,56] and more qualitative approaches [57]. Stop criteria define the limit between an acceptable and an unacceptable state of the considered structure during the execution of a test load.
3. A Different Approach to Proof Loading and Target Load
The proposal for a new Eurocode on the assessment of existing structures, prEN 1990-2 [20], is based on the general requirements and principles of structural reliability provided in EN 1990-1 and may yet be included in EN 1990 as chapters or annexes. The preliminary guideline includes some general assumptions regarding the assessment of existing structures:
- Sufficient skill and care appropriate to the circumstances are exercised in the assessment; this is based on the knowledge and good practice generally available at the time.
- The assessment of the structure is performed by appropriately qualified and experienced personnel.
- Adequate supervision and quality control are provided during the assessment process.
The above assumptions are relevant in both the preliminary assessment and in assessment through load testing. When assessing an existing structure, it shall be verified whether the structure has an adequate level of reliability. In a proof load test, the applied load level must thus give grounds to conclude that the bridge has sufficient reliability compared to the actual traffic loads that may be expected on the bridge. If no information on the structural resistance is available, the test load may be determined as a factor multiplied by the design load effect, such that the probability that the load effect, , exceeds the proof load effect, , corresponds to the target reliability level, —see Equation (3)—i.e., the resistance and associated uncertainties are not included in estimating the reliability.
In many cases, such load effects are computed by using structural input; however, this challenge can be overcome by applying a load configuration that, to the greatest possible extent, reflects the configuration of the actual loads acting on the considered structure. In this regard, the Danish classification system provides an excellent basis with well-defined special vehicle classes and axle load configurations [21]. The following method concerns the determination of proof loading factors to be applied with such a well-defined classification system.
3.1. Proof Loading Factors Based on Load Model
In the following example, proof loading factors are determined based on the stochastic model given in the Danish probabilistic design guideline [23]; the example originates in a background document of the proposed Eurocode [58]. The case study presented in this paper considers a short-span concrete slab bridge comprised of Overturned T-section (OT) beam elements, which was assessed as being critical in flexure. Flexural failure is a non-brittle failure mode for which the annual target probability of failure in consequence class three (CC3) is set to = 10−6, corresponding to an annual target reliability index of [59]. The magnitude of the total proof load is found as the proof load factor, , multiplied by the characteristic value of extreme vehicle weight and characteristic dynamic factor, , such that proves the desired annual reliability index.
The proof loading factor, , is determined such that the probability of the traffic load, , exceeding the proof load, , is equal to the specified annual probability of failure, as stated in Equation (3). This may also be expressed by a limit state equation, see Equation (4).
where
- is the annual extreme vehicle weight (characteristic value (): 98% quantile).
- is the traffic load model uncertainty.
- is the dynamic factor (characteristic value (Ks,k) depends on bridge geometry; Ks,k = 1.25 is used [21]).
- is the proof loading factor.
The distribution for the annual extreme vehicle weight is given as Equation (5):
where
- is the distribution function for the annual extreme vehicle weight.
- is the normal distribution of vehicle weight for individual vehicles.
- is the number of vehicles in the reference period (1 year).
The weight of standard vehicles, W, is assumed to be normally distributed with stochastic parameters: mean value, standard deviation, and the number of vehicles per year, as defined by the Danish classification system and probabilistic design guide [21,23]. For a class 100 vehicle (which is the target classification of the case study), these parameters take values of , , and , respectively.
The dynamic effects from vehicles on the bridge during normal passage are modeled by multiplying the static load with a dynamic factor, , see Equation (6).
where
- is the dynamic supplement, which is normally distributed with N(41.5/W,41.5/W) for global effects [23].
- W is the weight of the vehicle in kN.
It should be noted that the magnitude of the dynamic factor and the dynamic supplement is under continuous discussion among experts in the field. It may be deserving of an entirely separate study and is, therefore, not considered further in this paper.
The model uncertainty of the variable load effect is described by the normally distributed stochastic variable, , which has a mean value, = 1.0, and a coefficient of variation, corresponding to low, medium, or high uncertainty [23]. For conditional passage in the Danish road network, the coefficient of variation is set as low (), but it can be adjusted to fit the traffic demands of any nation [58].
Following the definition of the model parameters, the annual failure probability may be determined through Monte Carlo simulations, and the proof loading factors may be determined through iteration. The procedure is as follows (using the inverse method):
- The characteristic annual extreme vehicle weight, (98% quantile), is determined by solving for “x” in Equation (5).
- An appropriate number of simulations are run. In this example, 108 is applied to identify a failure probability of .
- In each simulation, realizations of the stochastic variables are obtained by simulating realizations of the cumulative distribution function as uniformly distributed between 0 and 1. Statistically independent realizations are applied to each of the variables.
- The annual extreme vehicle weight, , may be determined in the same way as .
- The dynamic supplement, , and the model uncertainty, , may similarly be determined by solving for x in the cumulative distribution function; however, the mean and standard deviation of are dependent on the vehicle weight. It is important to note that the vehicle weight, , in this case, refers to the realizations of the annual extreme vehicle weight, , which was determined in the previous point for each specific simulation.
The above procedure is followed by the steps listed below:
- A value is guessed for the proof load factor, , and the product of Equation (4) is determined.
- Negative values represent a failure event. The simulated failure probability, , is determined as the sum of failure events over the number of simulations.
- The value of the proof load factor is changed until the simulated failure probability is equal to the target failure probability, .
For a standard vehicle class 100, the proof loading factor yields corresponding to a total vehicle proof load of , including dynamic effects. The total load increase factor is, thus, (to the characteristic load) and (to the mean vehicle weight, to which the individual axle loads are given in the Danish classification system [21]). As an approximation, this factor may be applied to individual axles.
It should be noted that for short-span bridges, the full proof load cannot be situated on the bridge since the span length limits the number of axles that can affect the bridge. Depending on the span, this effect may be minor or quite significant. For instance, for bridges with a span of less than 5.6 m, it takes the same load level to achieve a class 150 as to achieve a class 50. This is because the load on such bridges depends on only a few axles, and even though the mean value increases as a function of the vehicle class, the uncertainty of the load and the dynamic factor is reduced. As such, this method should be used carefully and by experienced professionals.
3.2. Conservative or Not?
The method for determining the proof load factor presented in this paper does not take into account a resistance model. Compared to a method containing a resistance model, the proof load factor from the presented method will be conservative. In addition, should the bridge not be assessed as critical in a non-brittle failure mode, the proof load factor would be even higher, adding to the conservatism of the presented method; this is because the target probability of failure for brittle failure is [59]. However, in the case of undocumented bridges, this method still may be suitable, as many short-span bridges involve large capacity reserves and proof loading still results in successful tests [2,3,4,5,6]. As such, if there is a qualified reason to assume that a capacity reserve may be revealed by proof load testing for an undocumented bridge, the authors believe that this method is superior.
Compared to the proof loading factors determined for similar reliability indexes for undocumented bridges by [12], the values of the presented method are quite comparable, but given that the Danish traffic load effects resemble the Dutch traffic load effects more than the other nations, this method may be less conservative.
The method considers only the post-proof loading reliability and not the risk associated with the test itself, as this is not possible with no prior knowledge of the resistance. Therefore, the presented method adds to the necessity of applying a monitoring package, which is capable of identifying stop criteria, during testing in order to avoid irreversible damage.
3.3. Proof Loading Recommendations
The prEN 1990-2 [20]; its associated background documents, e.g. [58]; and a new Danish guideline on the topic [60] include recommendations for the preparation and execution of proof load testing. The recommendations are in line with the latest research, and the primary aspects may be listed in the following:
- A test should consider all plausible and relevant failure modes.
- The loading may be applied in three load levels with smaller increments. Large increments at the beginning and smaller when nearing the target load.
- Before testing, criteria should be specified to control and monitor the behavior of the structure during the test in order to avoid permanent damage to the structure.
- A detailed monitoring plan should be prepared prior to testing.
- During testing, time should be dedicated between load increments for the registration and evaluation of measurements.
A significant focus is dedicated to the choice of monitoring for stop criteria evaluation. There exists an immense toolbox of monitoring systems that could quickly result in an overly monitored test. An extensive review of the existing monitoring methods was performed by [61]. The Danish guideline [60] recommends simple monitoring parameters and suggests four measurable quantities. These are given below along with the chosen stop criteria for the case study bridge presented in Section 4:
- Deflection of the bridge (L/400 = 16.25 mm).
- Crack identification and width monitoring (0.2 mm).
- The degree of non-linearity of the response as a function of the deflection of the structure (25% stiffness change or engineering judgment).
- Settling of the foundation (Engineering judgment).
However, this is not an exhaustive list, and other relevant stop criteria may be relevant depending on the considered type of structure. In addition, the monitoring should also account for any plausible shift in critical failure mode. Unique combinations of monitoring systems and associated precision levels may thus be applied for specific test cases.
Applying the target load in conjunction with monitoring-based stop criteria should ideally result in one of two scenarios. (1) If the target load is reached without activation of any stop criteria, the structural reliability has been demonstrated to be acceptable, and (2) if any stop criteria are activated before reaching the target load, the test should be stopped, and the load carrying capacity and associated reliability level may be determined based on the achieved loading.
4. Proof Loading Pilot Project and Case Study
The case study of this paper is a one-span OT-slab bridge on a road stretch between the two Danish towns, Assens and Nørre Aaby. It was tested in flexure as part of a proof loading pilot project, along with three other bridges in December 2020, which was motivated by the need for capacity upgrading of the road stretch. An additional practical and scientific scope of the pilot proof load tests was to verify the methods presented in the upcoming Danish guideline on proof loading of bridges [60].
The bridge had a span of 6.5 m, consisting of two driving lanes and emergency lanes near the edges. It was previously classified as a class 80 bridge, and class 100 was desired for the road stretch. The initial assessment evaluations proved insufficient, and it was decided to perform proof load testing. Previous tests on OT-slab bridges and subcomponents provided a strong indication that the bridge would contain a capacity reserve [5,57,62].
4.1. Loading with Special Transport Vehicles
The loading was applied in increments by using standard heavy transport vehicles with hydraulically adjustable wheel and axle loads; see Figure 2.
Using such vehicles, it was possible to apply loading representative for the heavy special permit vehicles driving on Danish roads and, thus, accurately reflect the axle load configurations of the Danish classification system [21]. The loading setup was quite similar to that of the BelFa loading vehicle [63,64], but BelFa usually operates at lower load levels, and the increased availability of the standard transport vehicles must be considered a significant benefit.
The Danish classification system specifies that two adjacent vehicles should be applied [21], a standard vehicle A and a standard vehicle B. Figure 3 shows the two vehicles on the tested bridge. Vehicle B was placed centrally in its lane with a fixed load of 45 tons on 3 axles combined (class 50 vehicle). Vehicle A always represents the classification vehicle, and it was placed centrally in the adjacent lane. The values for vehicle B were found in [23] for this situation. The combination of the two vehicles may be handled through Turkstra’s Rule [60], which would provide the same value for the proof load factor, . The applied axle loads of vehicle A were controlled through the hydraulic system of the vehicle, thus enabling a controlled loading procedure. Figure 4 illustrates how the supporting axles acted outside the bridge span and how the loading axles of vehicle A could be raised for zero loading; this without moving the vehicle.
The loading procedure involved incremental loading to three load peaks in compliance with the guideline and the recommendations of [12] that the maximum target load should be applied in several increments (large increments at the beginning and smaller when nearing the target load) while reserving time for observation of the structural response. The load application is presented in four phases, along with incremental measurement points, as seen in Figure 5.
From Figure 4 and Figure 5, it is seen that only three axles were applied. With a span of 6.5 m, the 5 rear axles of a class 100 vehicle could be situated on the bridge [21]; see Figure 6. However, because the bridge was skewed and for other practical reasons, the number of loading axles was reduced from five to three. To justify this, the axle loads were increased so that the moment of the three axles was equivalent to that of the classification system.
Applying the determined load increase factor to the two different rear axle loads yields 3 axle loads of 11.5 tons × 1.78 = 20.5 tons and 2 axle loads of 15.1 tons × 1.78 = 26.9 tons, which should be applied in the critical position. The moment of these loads is equivalent to 3 axle loads of 27.81 tons. Figure 5 defines 3 × 31 tons as the target load; this is because additional safety was added for the presented case study and pilot project. It should also be noted that a different load configuration would be used for a shear load test. Furthermore, an alternative approach to the identification of the load configuration for proof loading, as performed above, is to model the axles individually and determine the load effect in each simulation. This may be a topic for future research.
4.2. Monitoring
A limited but specialized monitoring package was specified based on previous experience from load testing [5,65,66] and laboratory evaluations concerning 2D DIC [57,67,68,69,70]. The primary test output was load and deflection data obtained through the hydraulic system readouts and land surveyor measurements. In addition to the midspan deflection, the land surveyor also measured the settlement of the supports. The response curve was also used to identify any non-linearity in the response. Two-dimensional (2D) Digital Image Correlation (DIC) was applied for real-time crack identification and crack width monitoring.
Minimal artificial lighting (two LED lights) was applied underneath the bridge to improve the DIC pattern recognition. For safety reasons, the analysis station was moved beyond the bridge boundaries, and therefore, long self-powered amplifier cabling was required. The light sources were battery-powered and equipped with power banks for additional service time. A generator was brought on-site for power and additional computational capacity, but the full setup could run without power for multiple hours. An overview of the bridge and the whole setup with the test vehicle, monitoring station, and light sources is shown in Figure 7. Based on previous evaluations, the bridge was not considered shear-critical, and the described monitoring package was deemed sufficient for this and similar future tests.
4.3. Results
The bridge test was set up and executed, and the setup was taken down within four hours. No indications of distress were observed from the bridge, and the target load was reached as planned. The response curve is given in Figure 8, where it may be observed that the maximum deflection at the target load was 2 mm, while minor settlements were observed at the supports. At one support, this minor settlement was 0.45 mm at loading phase “d” and has not been subtracted from the deflection in Figure 8. No significant signs of non-linearity are visible, and the deviations that are observed may be attributed to the plastic settlements at the supports, the low deflection level, associated measurement uncertainties, and time-specific effects. In addition, no cracks were identified by DIC. This indicates that the test was performed in the linear elastic uncracked regime and that there may yet be additional capacity reserve in the bridge.
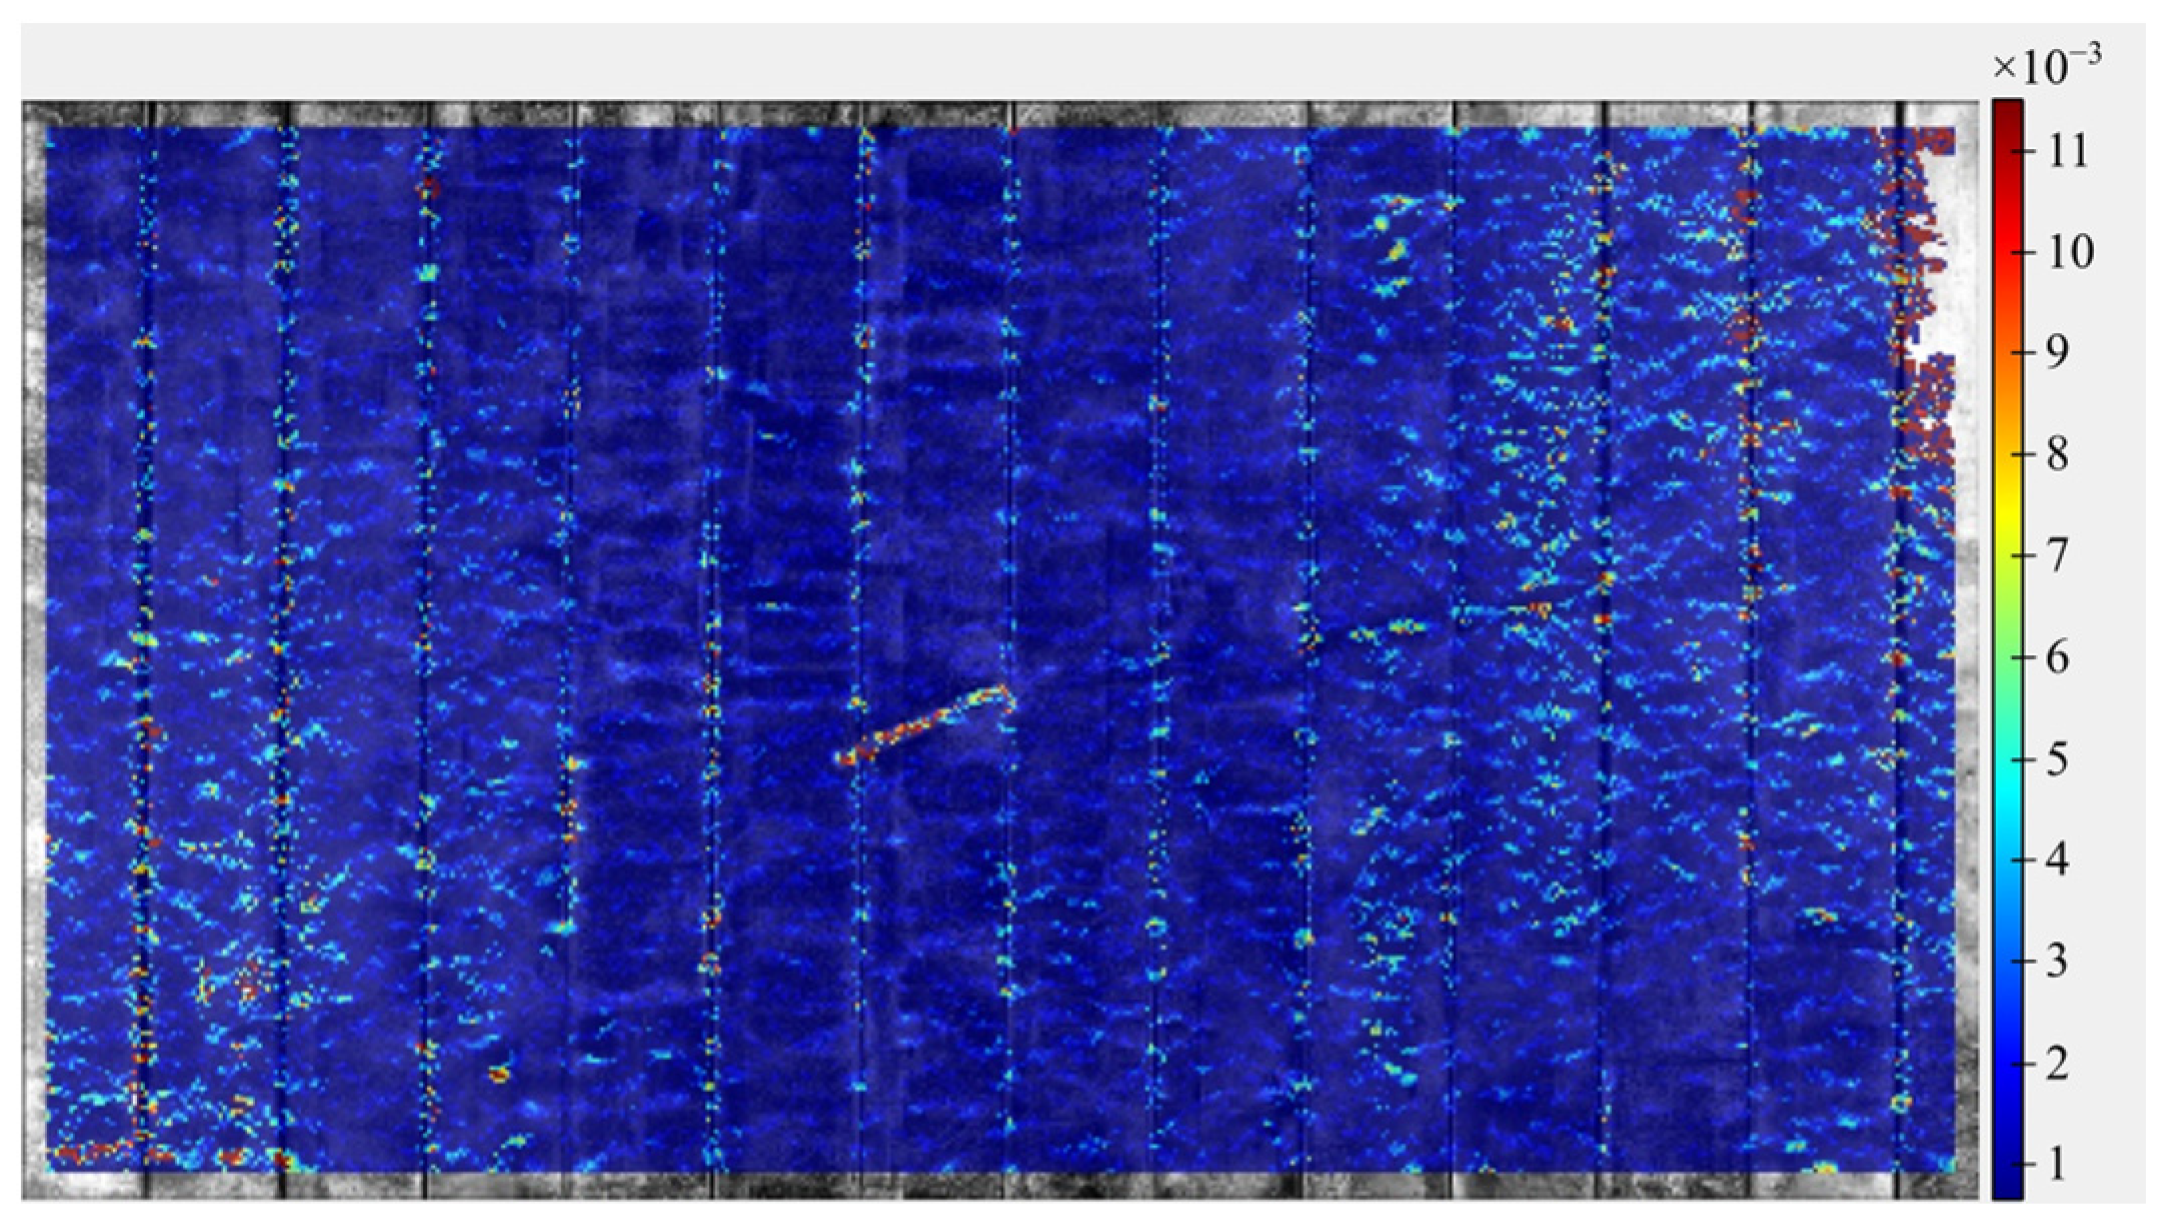
The DIC results provided continuous real-time monitoring of the bottom surface of the bridge slab. Although some noise was present due to challenging environmental conditions, it was clear that the concrete surface was uncracked at the target load; see Figure 9. As such, the monitoring provided additional reassurance of the structural state during testing.
The presented test method provided an efficient, simplified methodology, ensuring that the project could keep within the short time frame and budget. Because the target load was reached without signs of distress and based on reliability assessment, the bridge was reclassified from bridge class 80 to bridge class 100. Ultimately, this meant that the entire road stretch between Assens and Nørre Aaby could be upgraded for class 100 heavy transports.
5. Conclusions
This paper considers a practical approach to determination of the target load and ensuring sufficient reliability of a bridge after proof load testing. It follows the line of thought of a proposed new Eurocode “prEN 1990-2: Eurocode-Basis of assessment and retrofitting of existing structures: general rules and actions” [20], in which, instead of relying on input from resistance models, the target load may be determined based on load models and the desired failure probability. The determined proof load factors were found comparable to factors from the literature and did not seem overly conservative. Coupled with a well-defined classification system, such as the Danish classification system [21], the method may be superior for undocumented bridges and offer a strong alternative for cases in which the initial evaluation and following reliability assessment yield an unsatisfactory result.
A case study with a proof load test on a short-span OT-slab bridge was performed to verify the approach. The procedure was supported by the Danish classification system [21], probabilistic design guideline [23], and the proof loading recommendations of prEN 1990-2. The target load was reached without activation of any stop criteria, and the bridge was proven to have sufficient reliability and was, thus, reclassified to a higher bridge class. The monitoring worked as intended and provided real-time monitoring results during the test. The test was an example of a bridge with a significant capacity reserve but for which poor documentation rendered the traditional capacity evaluation challenging. Since the test was performed only in the linear elastic uncracked range, there may yet be a significant capacity reserve; however, the method proved that the bridge could carry the current traffic demands with sufficient reliability. Any additional capacity reserves may be investigated in the future if the need arises.
The results emphasize that the reliability of an existing bridge may be verified through proof load testing by using a target proof load determined without input from resistance models and that real-time monitoring can be simplified in a selective way for stop criteria evaluation.
Author Contributions
Conceptualization, C.O.C., K.D.S.D., J.D.S., P.G. and J.W.S.; methodology, C.O.C., K.D.S.D., S.E. and J.W.S.; software, C.O.C.; validation, C.O.C. and K.D.S.D.; formal analysis, C.O.C. and K.D.S.D.; investigation, C.O.C.; resources, J.W.S. and S.E.; data curation, C.O.C. and K.D.S.D.; writing—original draft preparation, C.O.C.; writing—review and editing, C.O.C., K.D.S.D., J.D.S., S.E., J.W.S. and P.G.; visualization, C.O.C., S.E. and J.W.S.; supervision, J.D.S., S.E., J.W.S. and P.G.; project administration, J.W.S. and P.G.; funding acquisition, J.W.S. All authors have read and agreed to the published version of the manuscript.
Funding
The funding source does not wish to be revealed in this section.
Data Availability Statement
All data and information needed for the evaluations discussed are provided in the paper.
Acknowledgments
Sincere gratitude is addressed to the Danish Road Directorate for their continued financial support and assistance. In addition, a big thank you is extended to the project partners at COWI A/S. Both have shown significant commitment to the mutual collaboration and, thus, contributed to our advances within the current research.
Conflicts of Interest
The authors declare no conflict of interest.
References
- Aguilar, C.V.; Jáuregui, D.V.; Newtson, C.M.; Weldon, B.D.; Cortez, T.M. Load rating a prestressed concrete double t-beam bridge without plans by field testing. Transp. Res. Rec. 2015, 2522, 90–99. [Google Scholar] [CrossRef]
- Lantsoght, E.O.L.; Koekkoek, R.T.; Hordijk, D.; de Boer, A. Towards standardisation of proof load testing: Pilot test on viaduct zijlweg. Struct. Infrastruct. Eng. 2017, 14, 365–380. [Google Scholar] [CrossRef]
- Faber, M.H.; Val, D.V.; Stewart, M.G. Proof load testing for bridge assessment and upgrading. Eng. Struct. 2000, 22, 1677–1689. [Google Scholar] [CrossRef]
- Halicka, A.; Lantsoght, E.O.L.; Hordijk, D.A. Rating of Concrete Road Bridges with Static Proof Load Tests; ACI Symposium Publication: Farmington Hills, MA, USA, 2017; Volume 323, pp. 3.1–3.6. [Google Scholar] [CrossRef]
- Schmidt, J.W.; Halding, P.S.; Jensen, T.W.; Engelund, S. High magnitude loading of concrete bridges. ACI Struct. J. 2018, 323, 9.1–9.20. [Google Scholar]
- Saraf, V.; Sokolik, A.F.; Nowak, A.S. Proof load testing of highway bridges. Transp. Res. Rec. J. Transp. Res. Board 1996, 1541, 51–57. [Google Scholar] [CrossRef]
- Gosbell, K.B.; Stevens, L.K. Test Loading of a Full Scale Bridge. In Proceedings of the A.R.R.B Proceedings; ARRB Transport Research: Victoria, VA, Canada, 1968; Volume 4, pp. 2018–2041. [Google Scholar]
- Goodpasture, D.W.; Burdette, E.G. Full scale tests to failure of four highway bridges. Am. Railw. Eng. Assoc. 1973, 74, 454–473. [Google Scholar]
- Isaksen, H.R.; Kanstad, T.; Olsen, P.-E. Prøvebelastning Av Bru Nr 02-1234 Smedstua Bru; Statens Vegvesen: Vegdirektoratet, Oslo, Norway, 1998. [Google Scholar]
- Zhang, J.; Peng, H.; Cai, C.S. Field study of overload behavior of an existing reinforced concrete bridge under simulated vehicle loads. J. Bridg. Eng. 2011, 16, 226–237. [Google Scholar] [CrossRef]
- Zhang, J.; Peng, H.; Cai, C.S. Destructive testing of a decommissioned reinforced concrete bridge. J. Bridg. Eng. 2013, 18, 564–569. [Google Scholar] [CrossRef]
- Casas, J.R.; Gómez, J.D. Load rating of highway bridges by proof-loading. KSCE J. Civ. Eng. 2013, 17, 556–567. [Google Scholar] [CrossRef]
- Bakht, B.; Jaeger, L.G. Bridge testing—A surprise every time. J. Struct. Eng. 1990, 116, 1370–1383. [Google Scholar] [CrossRef]
- Saraf, V.; Nowak, A.S. Proof load testing of deteriorated steel girder bridges. J. Bridg. Eng. 1998, 3, 82–89. [Google Scholar] [CrossRef]
- Minervino, C.; Sivakumar, B.; Moses, F.; Mertz, D.; Edberg, W. New AASHTO guide manual for load and resistance factor rating of highway bridges. J. Bridg. Eng. 2004, 9, 43–54. [Google Scholar] [CrossRef]
- Barker, M.G. Quantifying field-test behavior for rating steel girder bridges. J. Bridg. Eng. 2001, 6, 254–261. [Google Scholar] [CrossRef]
- Moses, F.; Lebet, J.P.; Bez, R. Applications of field testing to bridge evaluation. J. Struct. Eng. 1994, 120, 1745–1762. [Google Scholar] [CrossRef]
- Lantsoght, E.O.L.; van der Veen, C.; de Boer, A.; Hordijk, D.A. State-of-the-art on load testing of concrete bridges. Eng. Struct. 2017, 150, 231–241. [Google Scholar] [CrossRef]
- Fujino, Y.; Lind, N.C. Proof-Load Factors and Reliability. ASCE J. Struct. Div. 1977, 103, 853–870. [Google Scholar] [CrossRef]
- prEN 1990-2; Eurocode—Basis of Assessment and Retrofitting of Existing Structures: General Rules and Actions. Project Team CEN/TC 250/WG 2/WG2.T2; Ver. November 2021. CEN: Brussels, Belgium, 2021.
- Vejdirektoratet (The Danish Road Directorate). DS/EN 1991-2 DK NA:2017, Annex A: Lastmodeller for Klassificering Og Bæreevnevurdering (Models of Special Vehicles for Road Bridges); The Danish Road Directorate: Copenhagen, Denmark, 2017. [Google Scholar]
- Vejdirektoratet (The Danish Road Directorate). Vejledning Til Belastnings—Og Beregningsgrundlag; The Danish Road Directorate: Copenhagen, Denmark, 2010. [Google Scholar]
- Vejdirektoratet (The Danish Road Directorate). Guideline for Reliability-Based Classification of the Load Carrying Capacity of Existing Bridges; The Danish Road Directorate: Copenhagen, Denmark, 2004. [Google Scholar]
- Thoft-Christensen, P.; Baker, M.J. Structural Reliability Theory and Its Applications; Springer: Berlin/Heidelberg, Germany, 1982. [Google Scholar]
- Box, G.E.P.; Tiao, G.C. Bayesian Inference in Statistical Analysis; Wiley: Hoboken, NJ, USA, 1992. [Google Scholar]
- Saraf, V.K. Reliability-Based Criteria for Proof Load Testing of Bridges; ProQuest Dissertations Publishing: Ann Arbor, MI, USA, 1997; ISBN 978-0-591-61868-6. [Google Scholar]
- Lantsoght, E.O.L.; van der Veen, C.; Hordijk, D.A.; de Boer, A. Reliability Index after Proof Load Testing: Viaduct de Beek. In Proceedings of the Safety and Reliability—Theory and Applications—Proceedings of the 27th European Safety and Reliability Conference, ESREL 2017, Portoroz, Slovenia, 18–22 June 2017. [Google Scholar]
- Nowak, A.S.; Tharmabala, T. Bridge reliability evaluation using load tests. J. Struct. Eng. 1988, 114, 2268–2279. [Google Scholar] [CrossRef]
- Kapoor, M.; Christensen, C.O.; Schmidt, J.W.; Sørensen, J.D.; Thöns, S. Decision analytic approach for the reclassification of concrete bridges by using elastic limit information from proof loading. Reliab. Eng. Syst. Saf. 2023, 232, 109049. [Google Scholar] [CrossRef]
- Ditlevsen, O.; Madsen, H.O. Stochastic vehicle-Queue-Load model for large bridges. J. Eng. Mech. 1994, 120, 1829–1847. [Google Scholar] [CrossRef]
- Gómez, J.D.; Casas, J.R. Assessment of Bridge Capacity through Proof Load Testing. In Proceedings of the Life-Cycle Civil Engineering—Proceedings of the 1st International Symposium on Life-Cycle Civil Engineering, IALCCE ’08, Varenna, Italy, 11–14 June 2008. [Google Scholar]
- Schmidt, J.W.; Thöns, S.; Kapoor, M.; Christensen, C.O.; Engelund, S.; Sørensen, J.D. Challenges related to probabilistic decision analysis for bridge testing and reclassification. Front. Built Env. 2020, 6. [Google Scholar] [CrossRef]
- ICE. Guidelines for the Supplementary Load Testing of Bridges; The Institution of Civil Engineers—National Steering Commitee for the Load Testing of Bridges: London, UK, 1998. [Google Scholar]
- DAfStb. DAfStb-Guideline: Load Tests on Concrete Structures; Deutscher Ausschuss für Stahlbeton: Berlin, Germany, 2000. [Google Scholar]
- Ministerio de Fomento. Instrucción de Acciones a Considerar En Puentes de Ferrocarril (IAPF); Ministerio de Fomento: Madrid, Spain, 2010. [Google Scholar]
- SIA. Existing Structures—Bases for Examination and Interventions; SIA: Singapore, 2011. [Google Scholar]
- NCHRP. Manual for Bridge Rating through Load Testing; NCHRP: Washington, DC, USA, 1998. [Google Scholar]
- Research Institute of Roads and Bridges. The Rules for Road Bridges Proof Loadings (In Polish) (Zalecenia Dotyczace Wykonywania Badan Pod Próbnym Obciazeniem Drogowych Obiektów Mostowych); Research Institute of Roads and Bridges: Warsaw, Poland, 2008. [Google Scholar]
- Lantsoght, E.O.L. Load Testing of Bridges: Current Practice and Diagnostic Load Testing, 1st ed.; Lantsoght, E.O.L., Ed.; CRC Press: Boca Raton, FL, USA, 2019; ISBN 9780367210823. [Google Scholar]
- AASHTO. The Manual for Bridge Evaluation, 2nd ed.; American Association of State Highway and Transportation Officials: Washington, DC, USA, 2011. [Google Scholar]
- ACI Commitee 437. Code Requirements for Load Testing of Existing Concrete Structures (ACI 437.2M-13); ACI Commitee 437: Farmington Hills, MA, USA, 2013. [Google Scholar]
- NRA. Load Testing for Bridge Assessment; NRA: Dublin, Ireland, 2014. [Google Scholar]
- Slovak Standardization Institute. Loading Tests of Bridges (ZataŽovacie Skúšky Mostov); Slovak Standardization Institute: Bratislava, Slovakia, 1979. [Google Scholar]
- Czech Normalization Institute. Loading Tests of Bridges; Czech Normalization Institute: Prague, Czech Republic, 1996. [Google Scholar]
- Hungarian Chamber of Engineers. Guidelines for Interventions in Hungary; Hungarian Chamber of Engineers: Budapest, Hungary, 2013. (In Hungarian) [Google Scholar]
- Ministerio de Fomento. Recomendaciones Para la Realizacion de Pruebas de Carga de Recepcion en Puentes de Carretera; Ministerio de Fomento—Direccion General de Carreteras: Madrid, Spain, 1999. [Google Scholar]
- Ministerio de Fomento. Instrucciones Para La Puesta En Carga de Estructuras (Pruebas de Carga Provisionales); Ministerio de Fomento: Tokyo, Japan, 2009. [Google Scholar]
- Alampalli, S.; Frangopol, D.M.; Grimson, J.; Kosnik, D.; Halling, M.; Lantsoght, E.; Weidner, J.S.; Yang, D.Y.; Zhou, Y.E. Primer on Bridge Load Testing; Transport; Transportation Research Board (TRB): Washington, DC, USA, 2019; ISBN 0097-8515. [Google Scholar]
- Fu, G.; Tang, J. Risk-based proof-load requirements for bridge evaluation. J. Struct. Eng. 1995, 121, 542–556. [Google Scholar] [CrossRef]
- Lantsoght, E.O.L.; Boer, A.; van der Veen, C.; Hordijk, D.A. Modelling of the Proof Load Test on Viaduct De Beek. In Proceedings of the Computational Modelling of Concrete Structures—Proceedings of the Conference on Computational Modelling of Concrete and Concrete Structures, EURO-C 2018, Bad Hofgastein, Austria, 26 February–1 March 2018; CRC Press/Balkema: Boca Raton, FL, USA, 2018; pp. 535–544. [Google Scholar]
- AASHTO. Guide Manual for Condition Evaluation and Load and Resistance Factor Rating (LRFR) of Highway Bridges; AASHTO: Washington, DC, USA, 2003. [Google Scholar]
- Lantsoght, E.O.L.; van der Veen, C.; de Boer, A.; Hordijk, D.A. Required proof load magnitude for probabilistic field assessment of viaduct de beek. Eng. Struct. 2017, 148, 767–779. [Google Scholar] [CrossRef]
- Lantsoght, E.; Veen, C.V.D.; Hordijk, D.A.; Boer, A. De development of recommendations for proof load testing of reinforced concrete slab bridges. Eng. Struct. 2017, 152, 202–210. [Google Scholar] [CrossRef]
- ISIS. Guidelines for Structural Health Monitoring-Design Manual N 2; ISIS: Mayadin, Syria, 2001. [Google Scholar]
- Lantsoght, E.O.L.; Yang, Y.; Veen, C.V.D.; Hordijk, D.A. Stop criteria for flexure for proof load testing of reinforced concrete structures. Front. Built Environ. 2019, 5. [Google Scholar] [CrossRef]
- Benitez, K.; Lantsoght, E.O.L.; Yang, Y. Development of a Stop Criterion for Load Tests Based on the Critical Shear Displacement Theory. In Life Cycle Analysis and Assessment in Civil Engineering: Towards an Integrated VisionLife; CRC Press: Boca Raton, FL, USA, 2018; pp. 145–152. [Google Scholar]
- Christensen, C.O.; Schmidt, J.W.; Halding, P.S.; Kapoor, M.; Goltermann, P. Digital image correlation for evaluation of cracks in reinforced concrete bridge slabs. Infrastructures 2021, 6, 99. [Google Scholar] [CrossRef]
- prEN 1990-2; Load Testing, Background Document for: prEN 1990-2 (CEN/TC 250/WG 2/WG2.T2). Project Team CEN/TC 250/WG 2/WG2.T2; Ver. November 2021. CEN: Brussels, Belgium, 2021.
- CEN/TC 250; EN 1990-1: Eurocode 0—Basis of Structural Design. European Committee for Standardization: Bruxelles, Belgium, 2002.
- Vejdirektoratet (The Danish Road Directorate). Vejledning for Prøvebelastning Af Broer (Guideline for Proof-Loading of Bridges); Vejdirektoratet (The Danish Road Directorate): Copenhagen, Denmark, 2021. [Google Scholar]
- Garnica, G.I.Z.; Zhang, F.; Yang, Y.; van der Veen, C.; Lantsoght, E.O.L.; Naaktgeboren, M.; Fennis, S.A.A.M. Monitoring Structural Responses during Proof Load Testing of Reinforced Concrete Bridges: A Review. In Proceedings of the Bridge Maintenance, Safety, Management, Life-Cycle Sustainability and Innovations, IABMAS 2020, Japan (Online), 11–18 April 2021. [Google Scholar]
- Jensen, T.W.; Poulsen, P.N.; Hoang, L.C. Finite element limit analysis of slabs including limitations on shear forces. Eng. Struct. 2018, 174, 896–905. [Google Scholar] [CrossRef]
- Lantsoght, E.O.L. (Ed.) Load Testing of Bridges Proof Load Testing and the Future of Load Testing, 1st ed; CRC Press: London, UK, 2019; ISBN 9780429265969. [Google Scholar]
- Steffens, K.; Opitz, H.; Quade, J.; Schwesinger, P. The loading truck BELFA for loading tests on concrete bridges and sewers. Bautechnik 2001, 78, 391–397. [Google Scholar] [CrossRef]
- Christensen, C.O.; Halding, P.S.; Schmidt, J.W.; Goltermann, P. Large-Scale OT-Slab Tests Laboratory Measurements and Evaluation. In Proceedings of the 11th International Conference on Bridge Maintenance, Safety and Management, Barcelona, Spain, 11–15 July 2022; pp. 2099–2106. [Google Scholar] [CrossRef]
- Halding, P.S.; Schmidt, J.W.; Jensen, T.W.; Henriksen, A.H. Structural Response of Full-Scale Concrete Bridges Subjected to High Load Magnitudes. In Proceedings of the Fourth Conference on Smart Monitoring, Assessment and Rehabilitation of Civil Structures, Zürich, Switzerland, 13–15 September 2017. [Google Scholar]
- Halding, P.S.; Schmidt, J.W.; Christensen, C.O. DIC-Monitoring of Full-Scale Concrete Bridge Using High-Resolution Wide-Angle Lens Camera. In Proceedings of the Maintenance, Safety, Risk, Management and Life-Cycle Performance of Bridges, Melbourne, Australia, 9–13 July 2018; pp. 1492–1499. [Google Scholar] [CrossRef]
- Halding, P.S.; Christensen, C.O.; Schmidt, J.W. Surface Rotation Correction and Strain Precision of Wide-Angle 2D DIC for Field Use. J. Bridg. Eng. 2019, 24, 04019008. [Google Scholar] [CrossRef]
- Christensen, C.O.; Lantsoght, E.O.L.; Schmidt, J.W. Quantification of Digital Image Correlation Applicability Related to In-Situ Proof Load Testing of Bridges. In Proceedings of the Fifth Conference on Smart Monitoring, Assessment and Rehabilitation of Civil Structures, Potsdam, Germany, 27–29 August 2019; pp. 1–8. [Google Scholar]
- Christensen, C.O.; Zhang, F.; Garnica, G.Z.; Lantsoght, E.O.L.; Goltermann, P.; Schmidt, J.W. Identification of stop criteria for large-scale laboratory slab tests using digital image correlation and acoustic emission. Infrastructures 2022, 7, 36. [Google Scholar] [CrossRef]
Figure 1.
Probability density function (PDF) before and after proof loading.
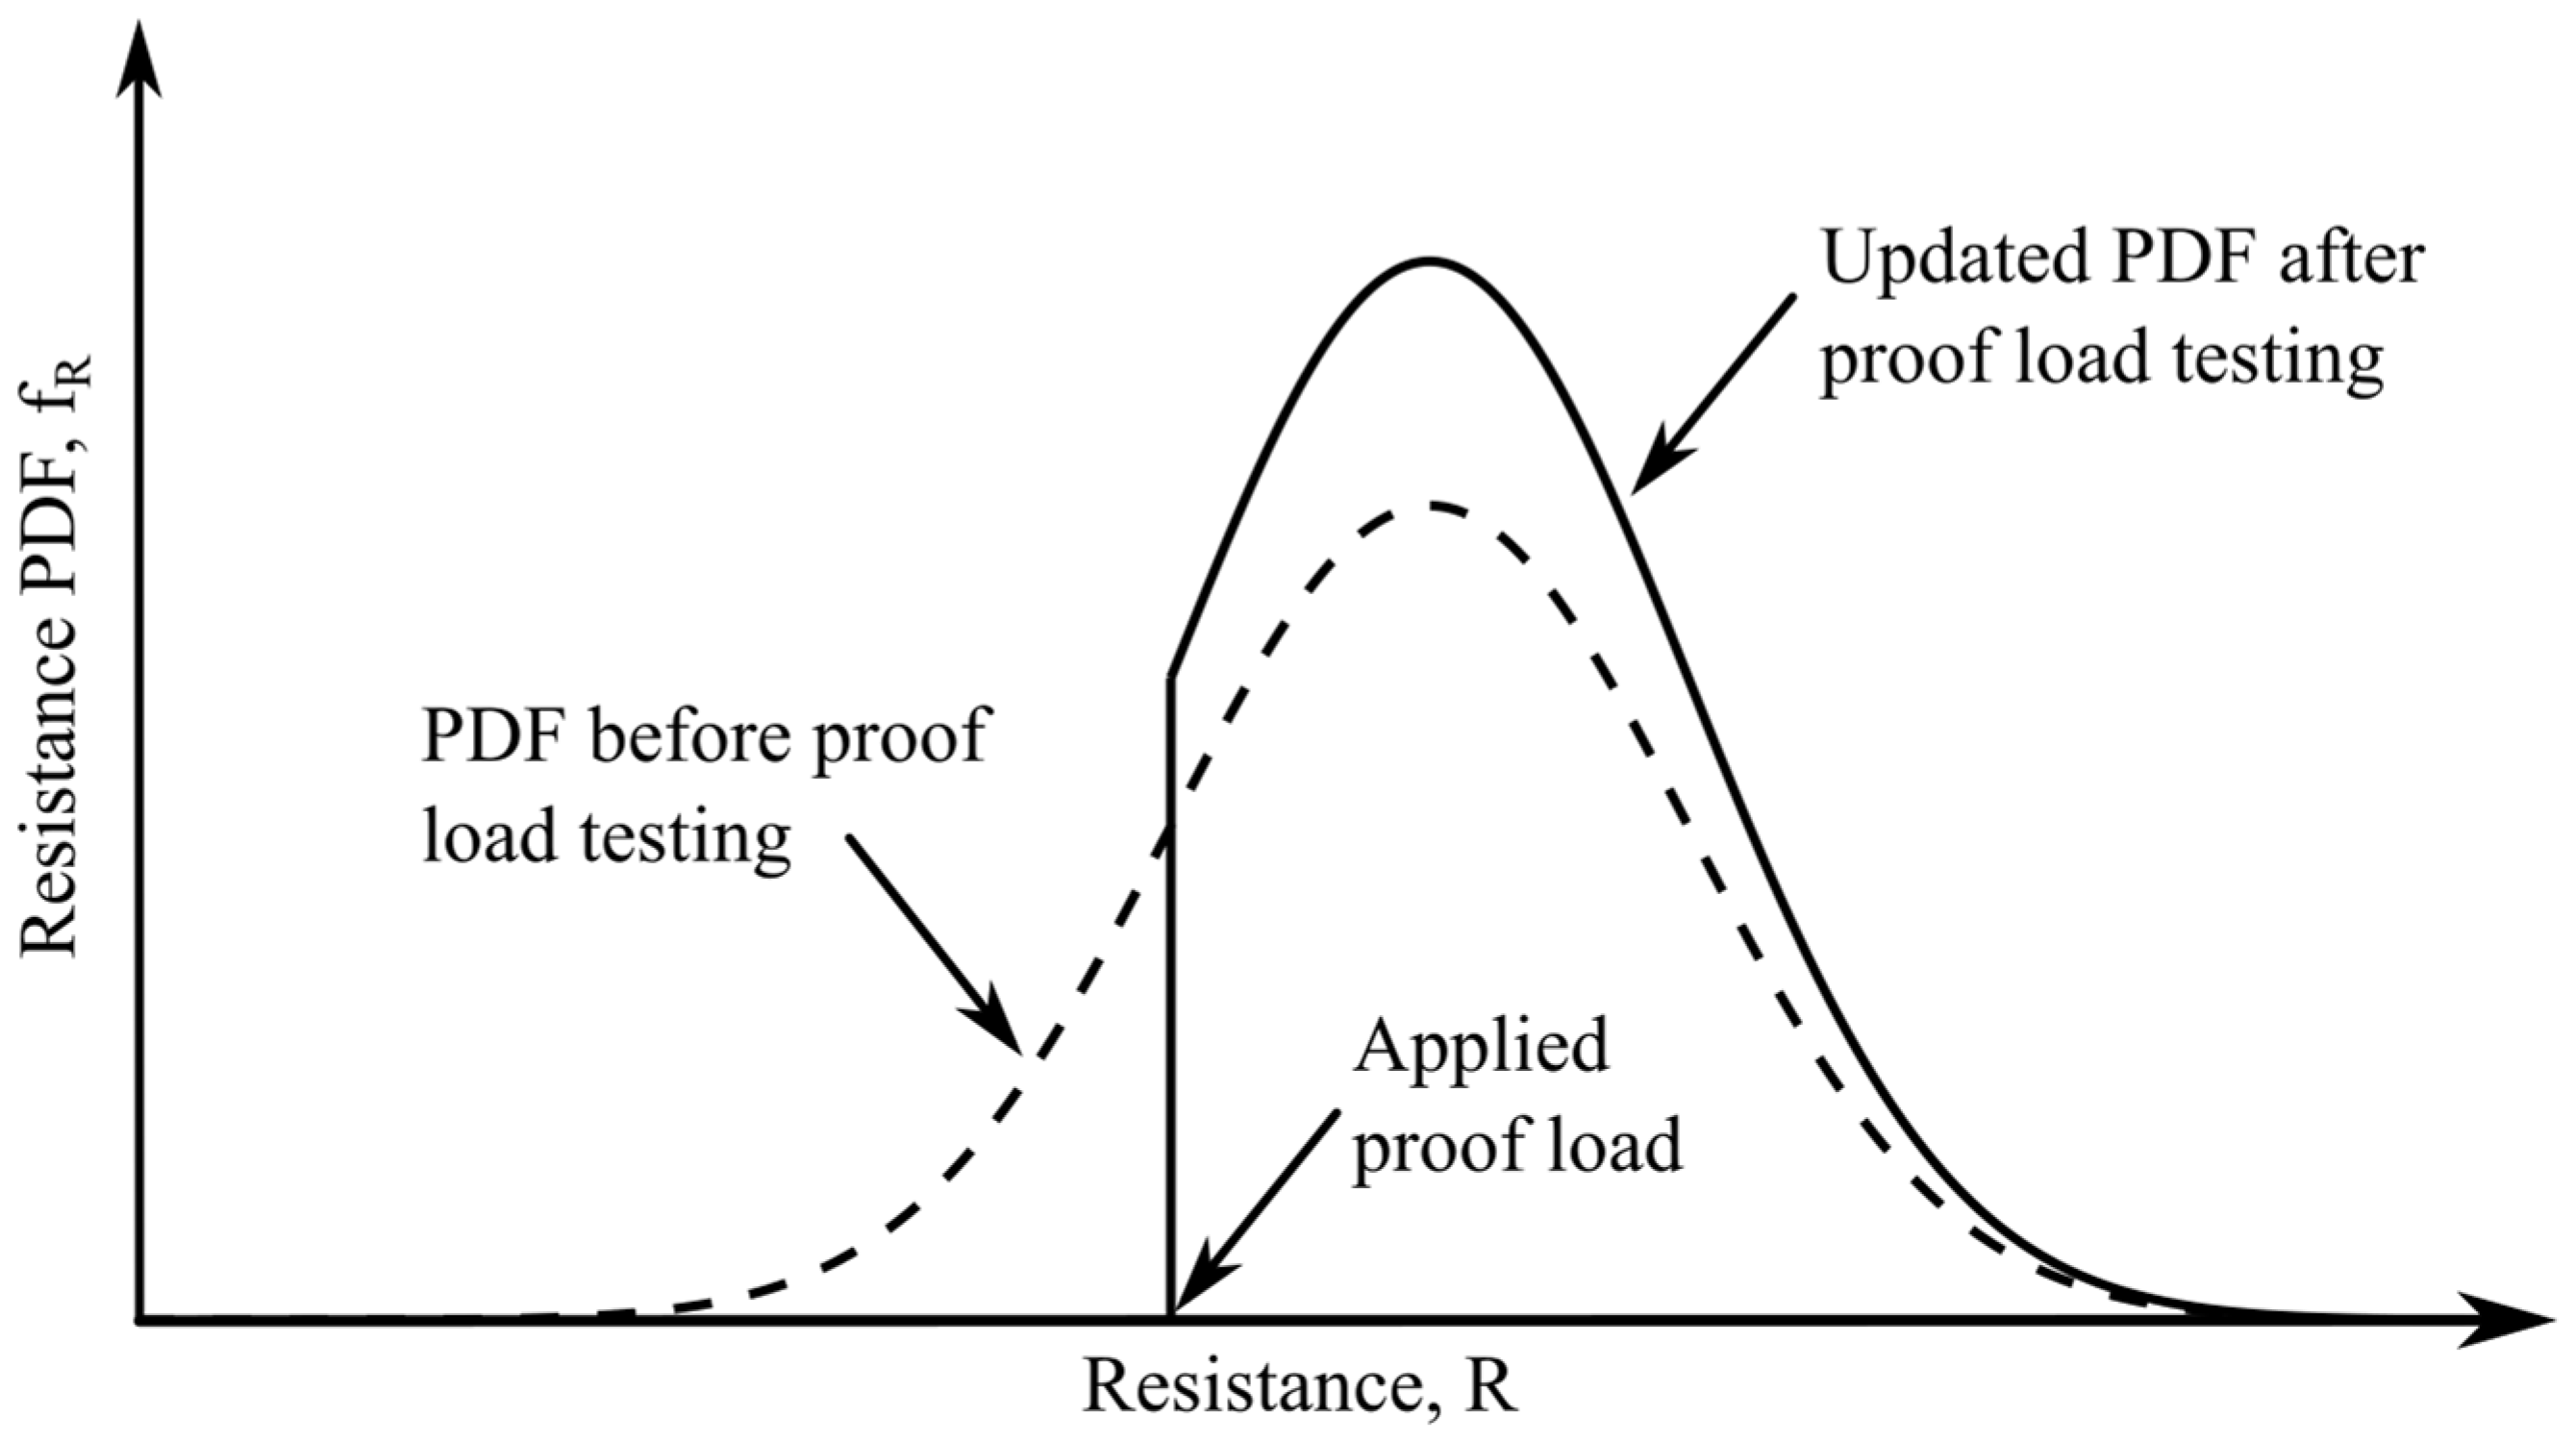
Figure 2.
Bridge loading with a special vehicle while being monitored via 2D DIC.

Figure 3.
Trucks were used to apply accurate loading in accordance with the Danish classification system [21].
Figure 3.
Trucks were used to apply accurate loading in accordance with the Danish classification system [21].
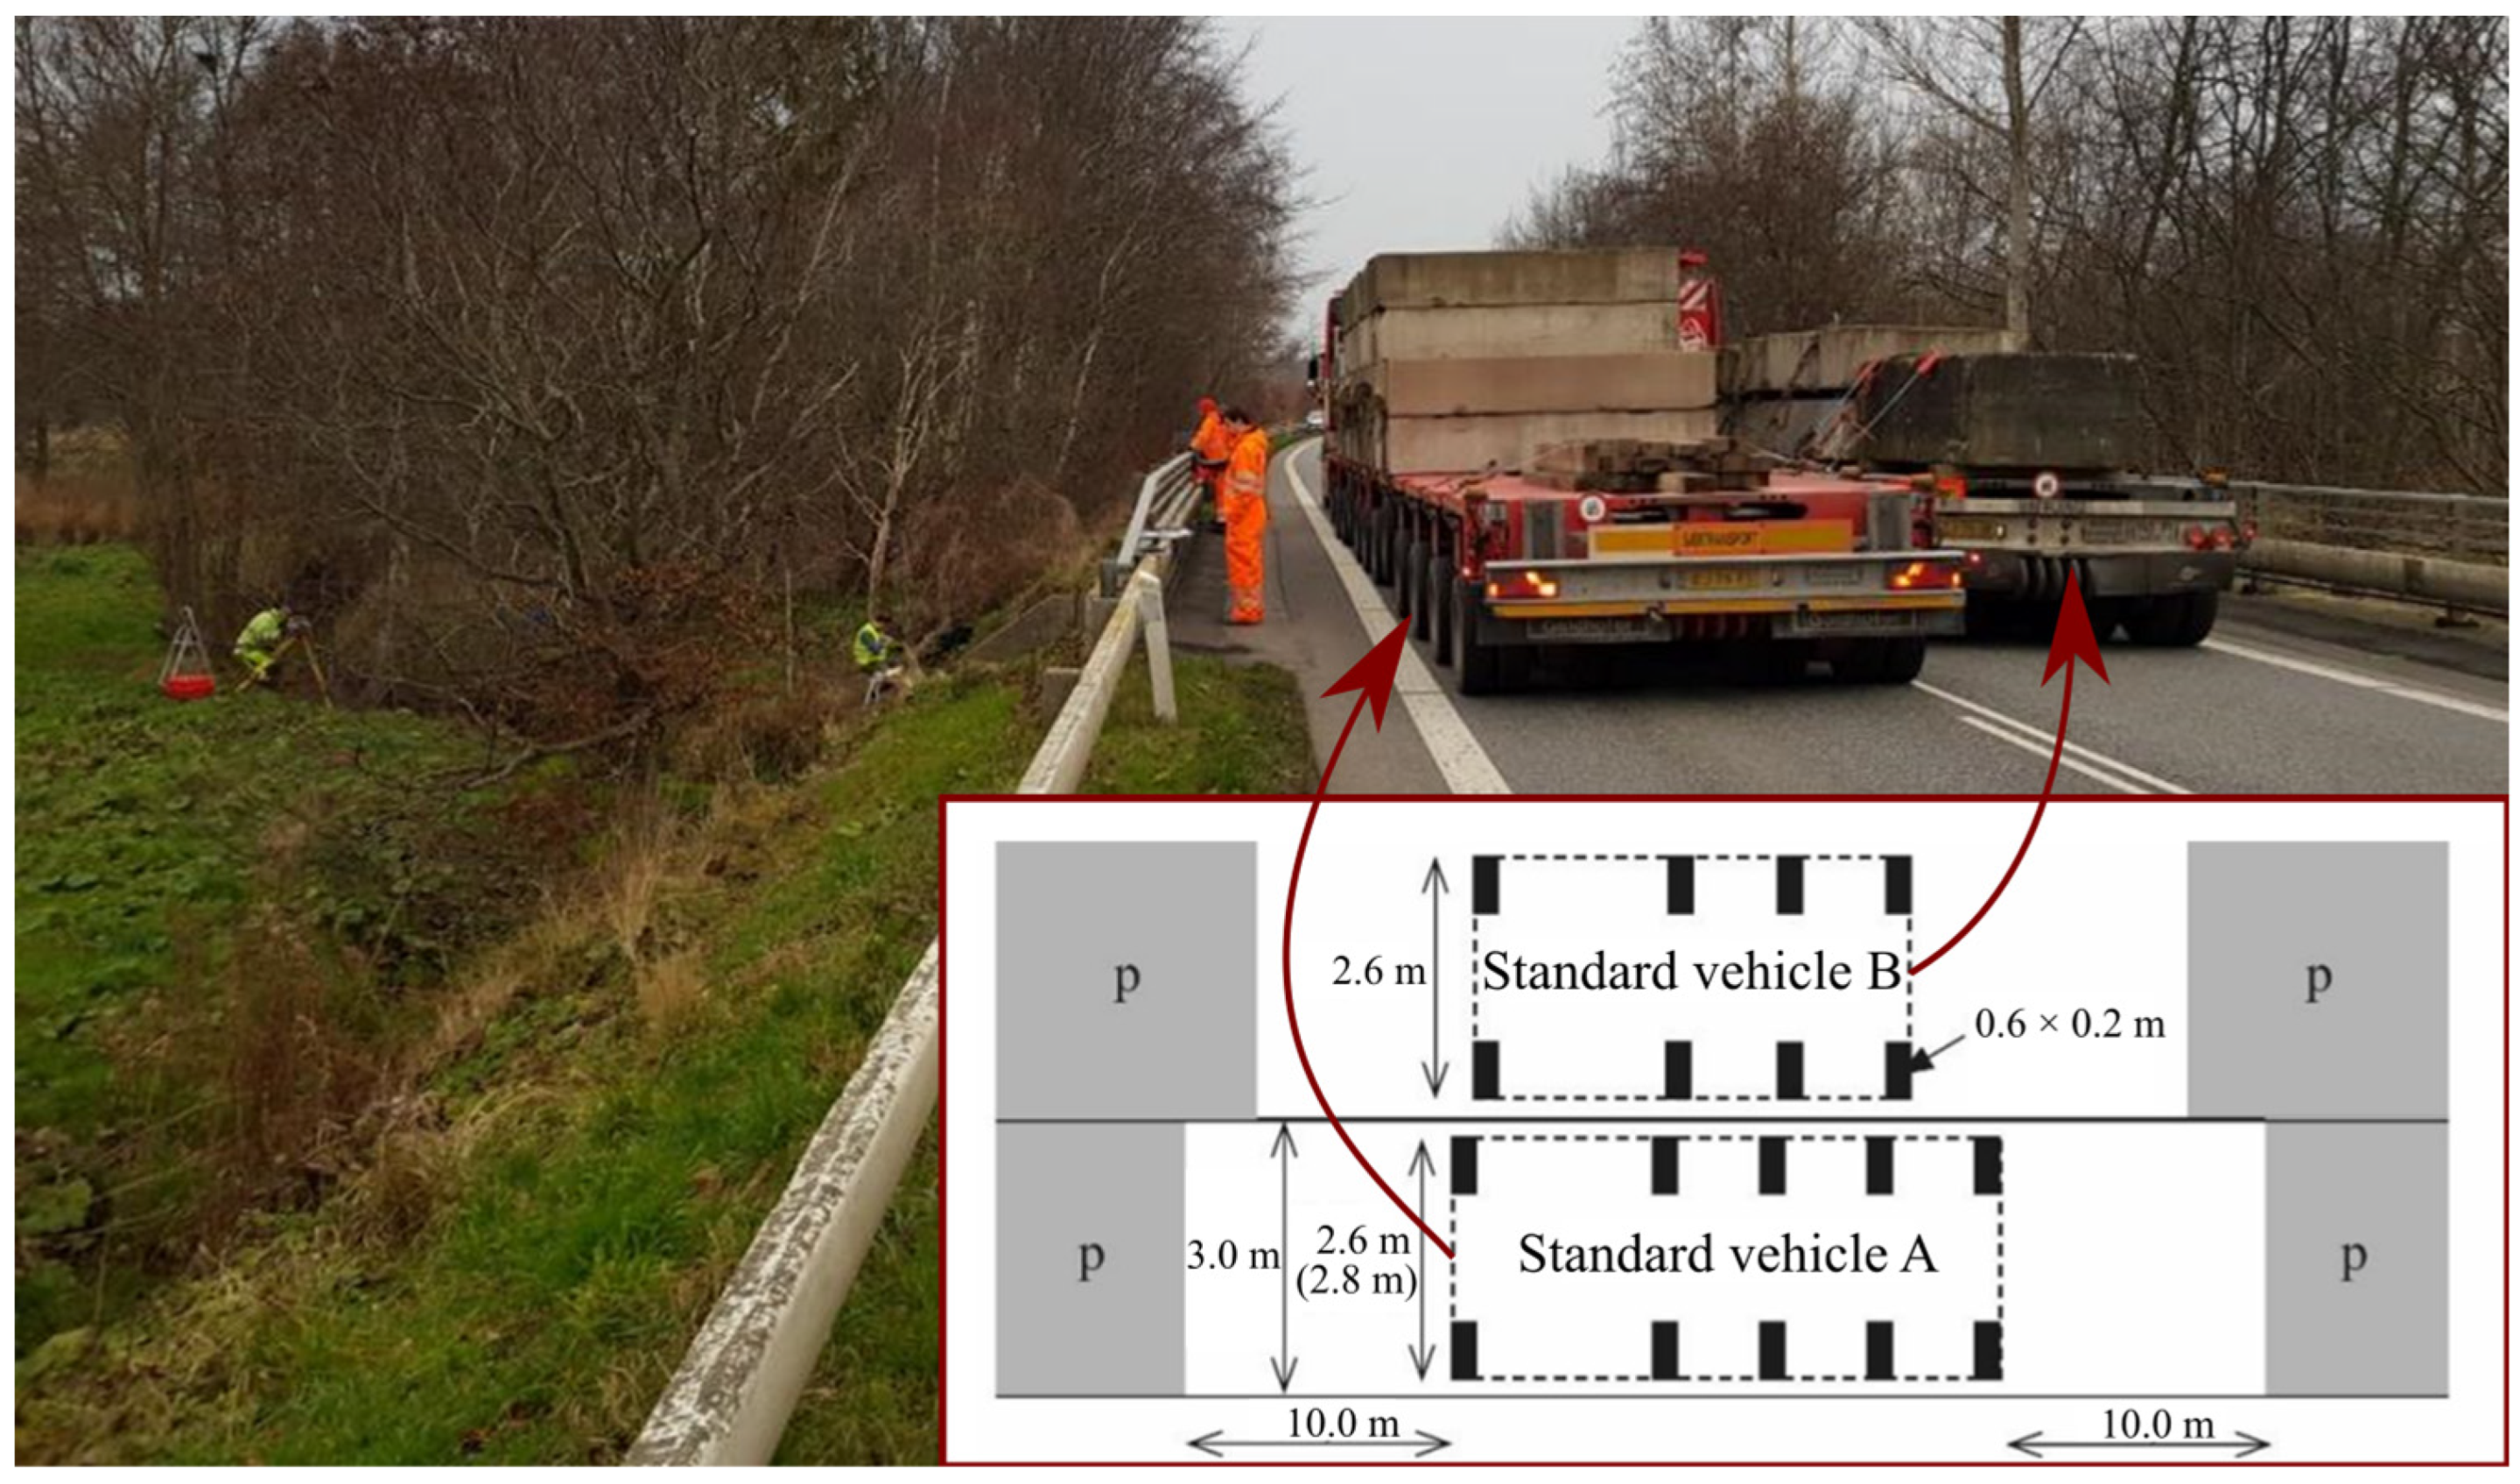
Figure 4.
Load placing and application: (a) placing of vehicle A (the classification vehicle) and vehicle B (a class 50 vehicle), and (b) loading and supporting axles.
Figure 4.
Load placing and application: (a) placing of vehicle A (the classification vehicle) and vehicle B (a class 50 vehicle), and (b) loading and supporting axles.
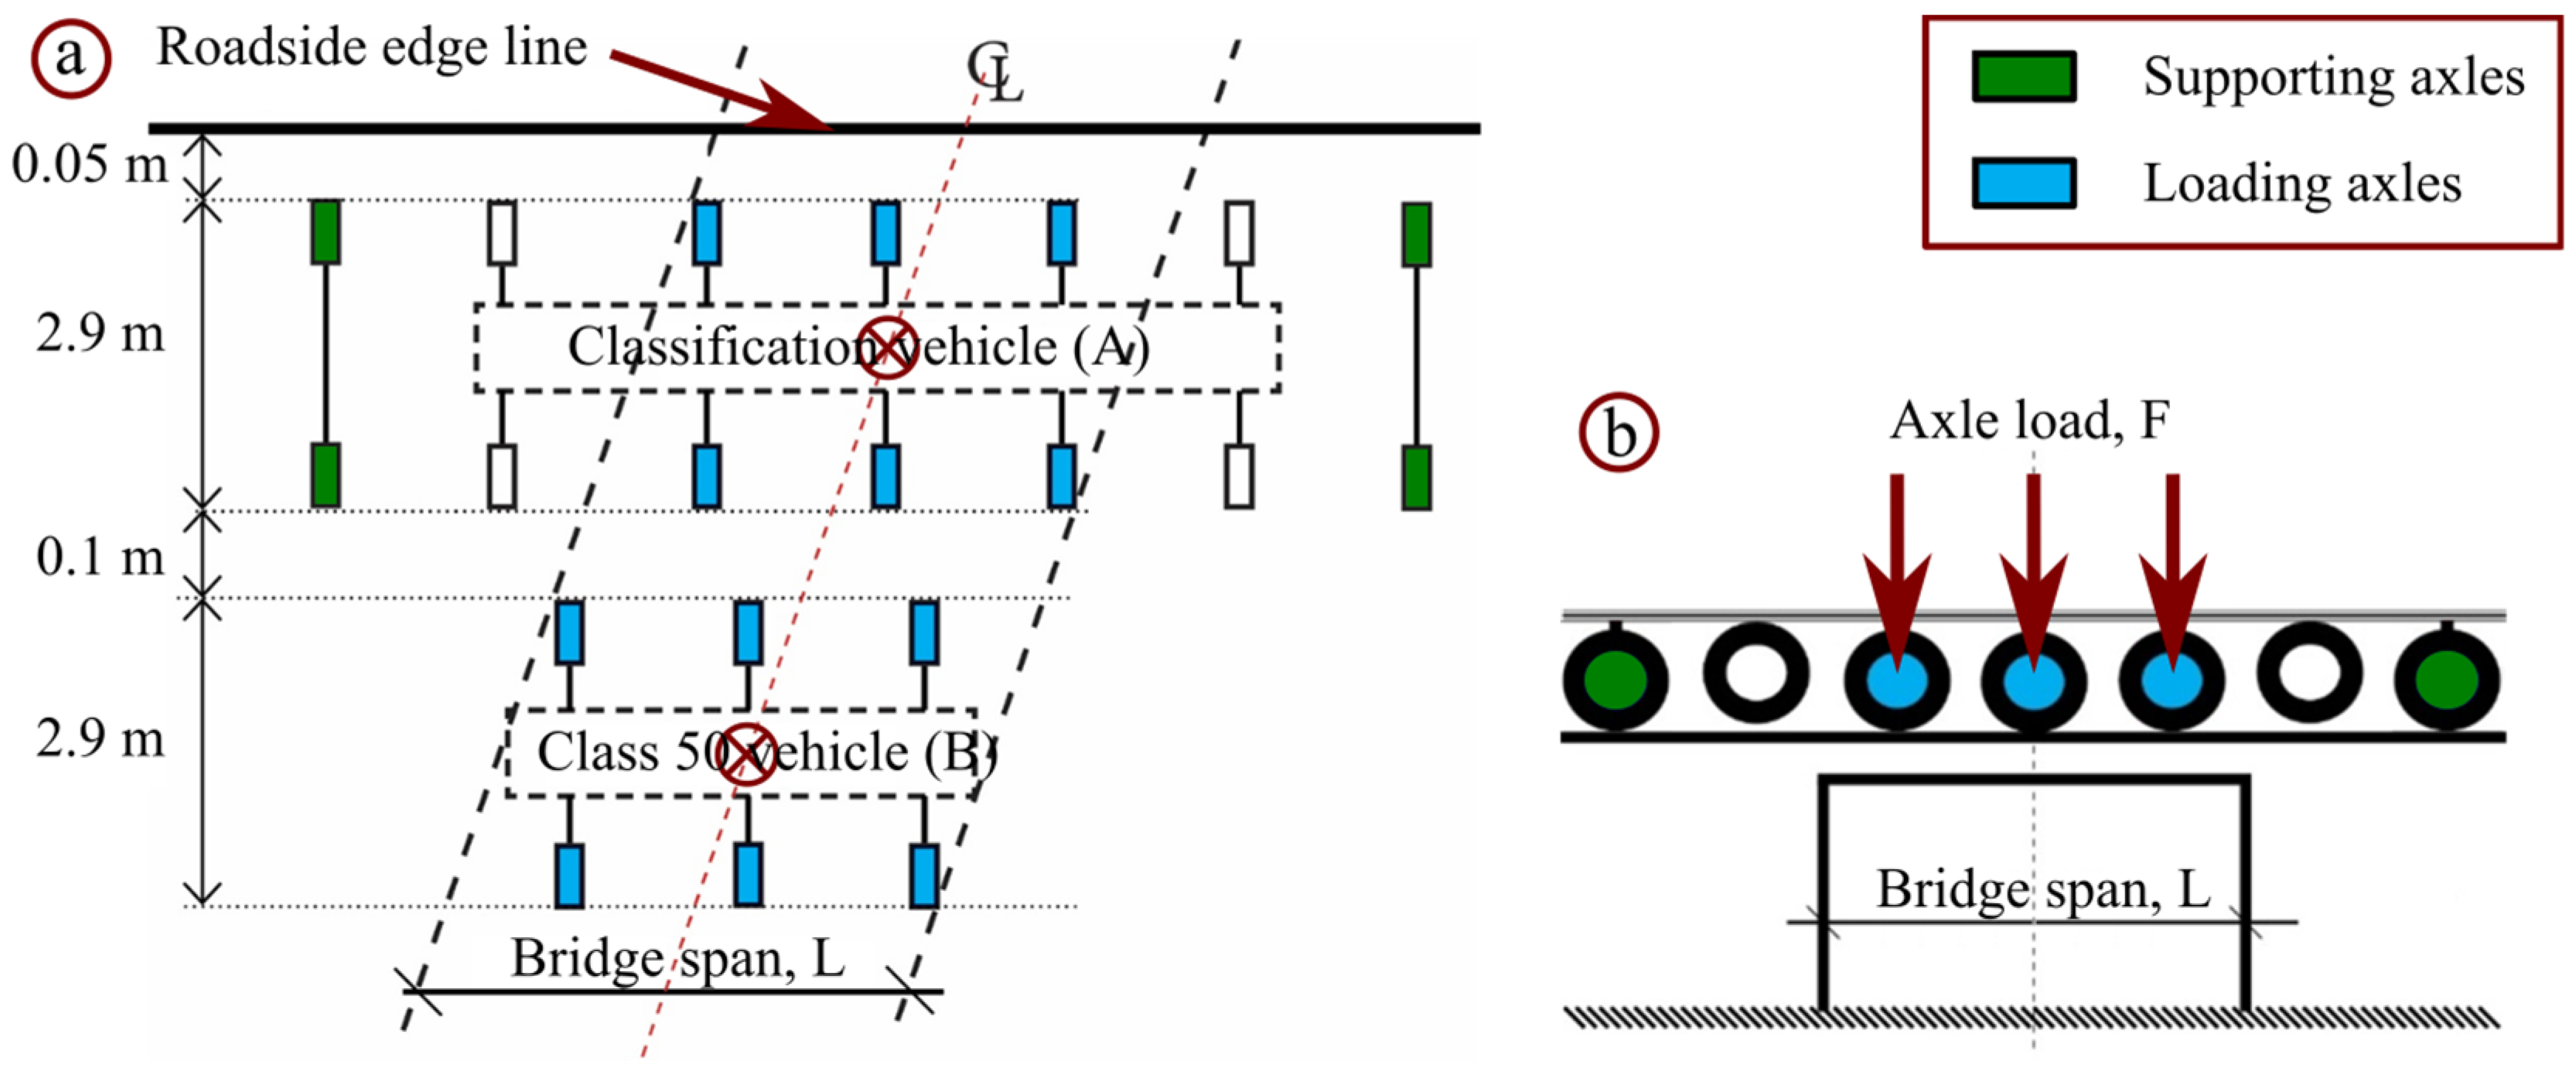
Figure 5.
The loading scheme used in the case study with four loading phases. Phase (a) involves the fixed load of vehicle B, while the three following phases (b–d) concern vehicle A.
Figure 5.
The loading scheme used in the case study with four loading phases. Phase (a) involves the fixed load of vehicle B, while the three following phases (b–d) concern vehicle A.
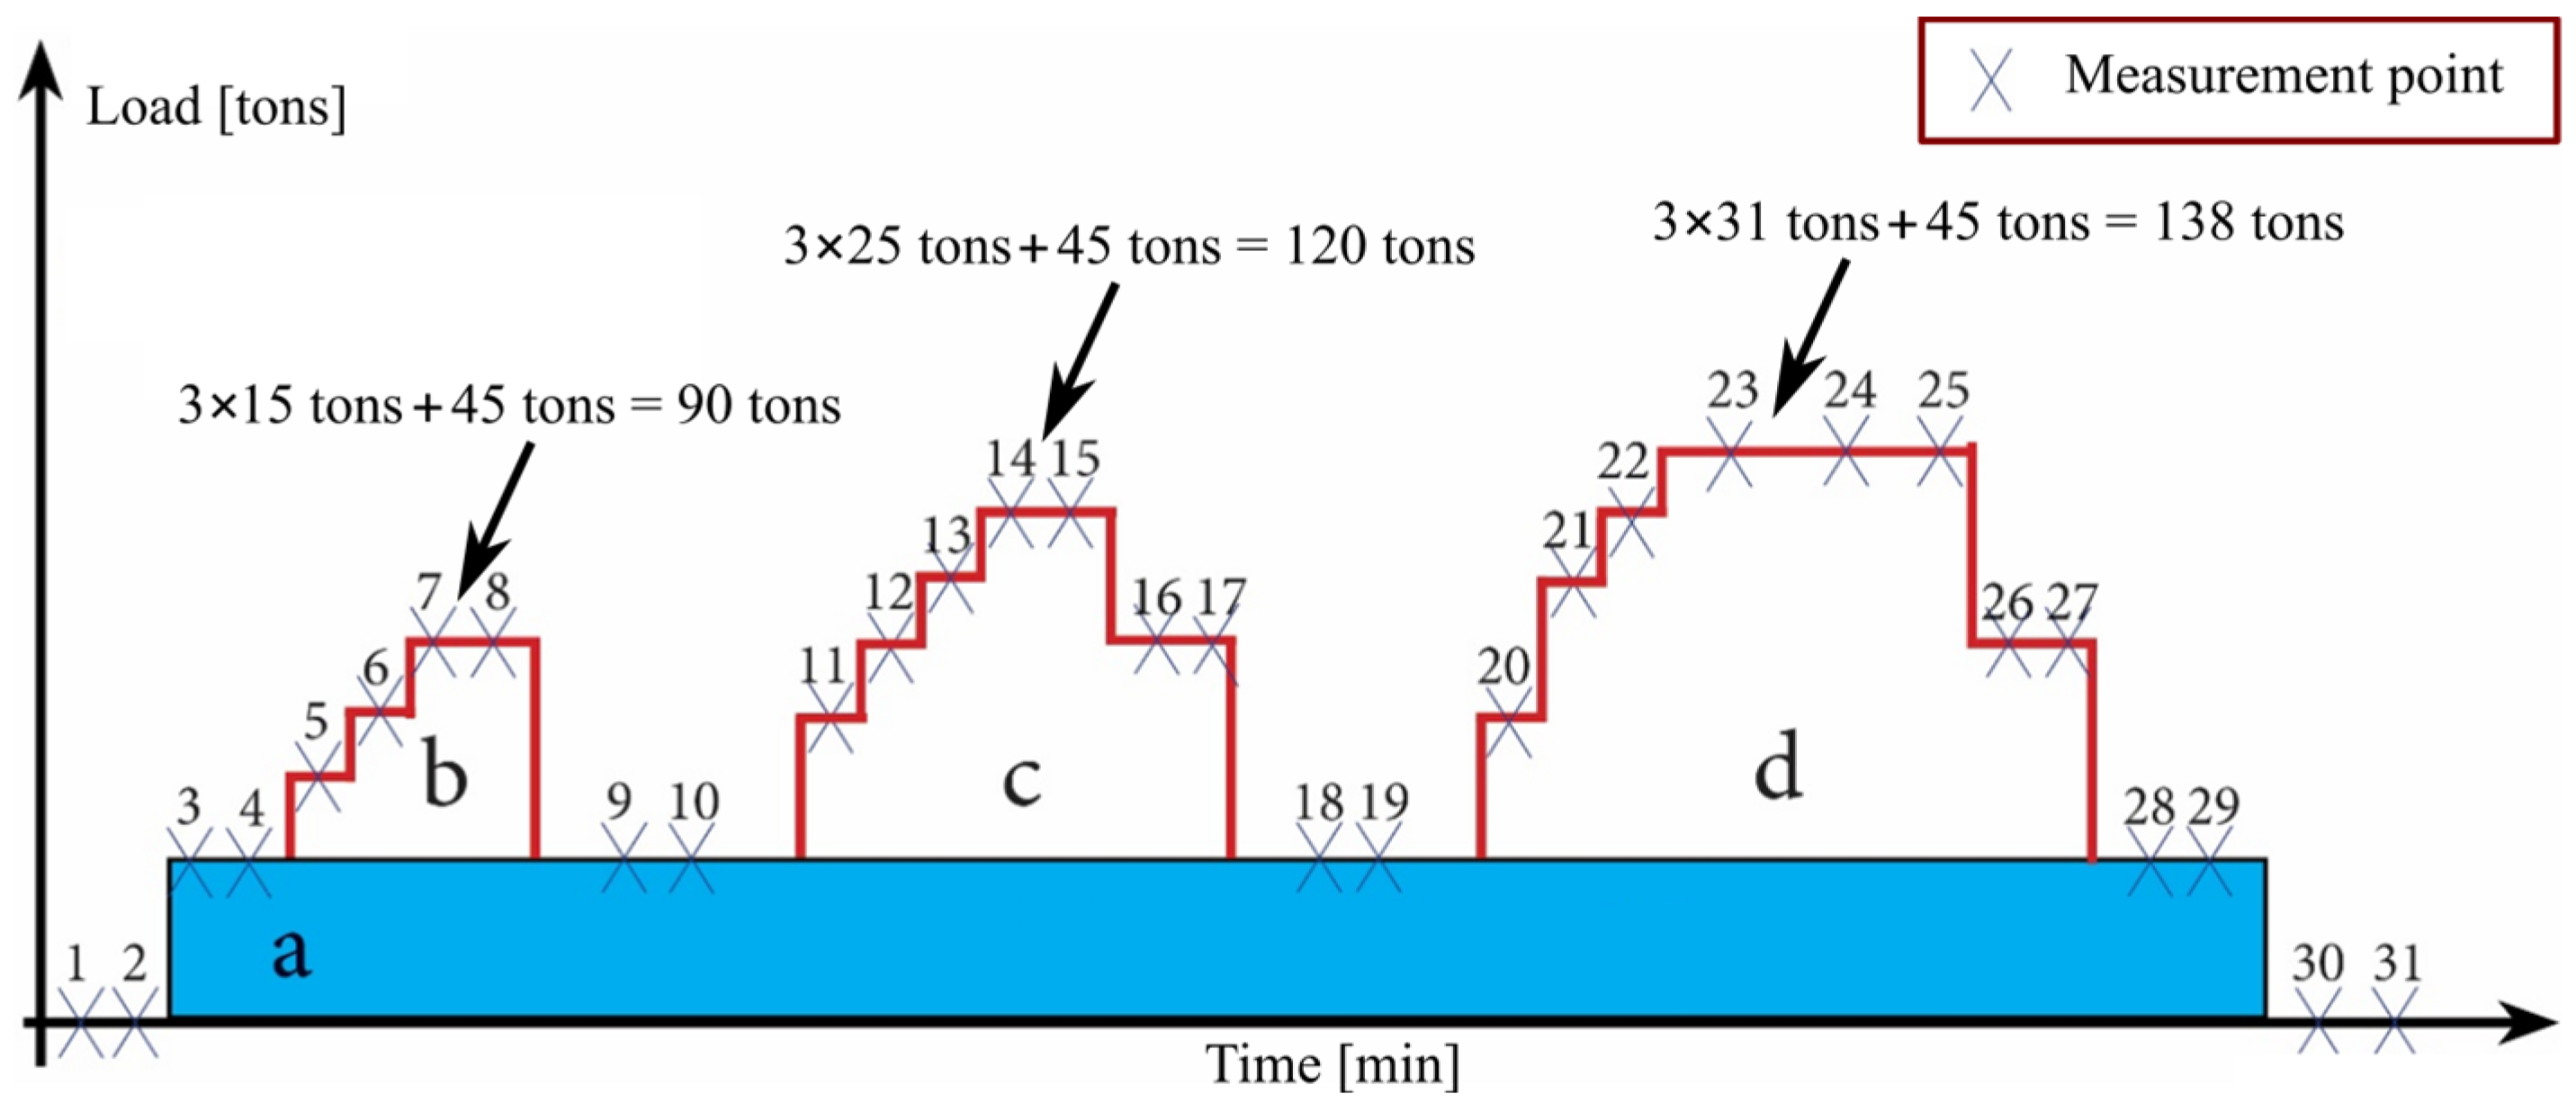
Figure 6.
Axle load distribution for a class 100 vehicle in the Danish classification system [21], axle loads in tons and spacing in meters.
Figure 6.
Axle load distribution for a class 100 vehicle in the Danish classification system [21], axle loads in tons and spacing in meters.
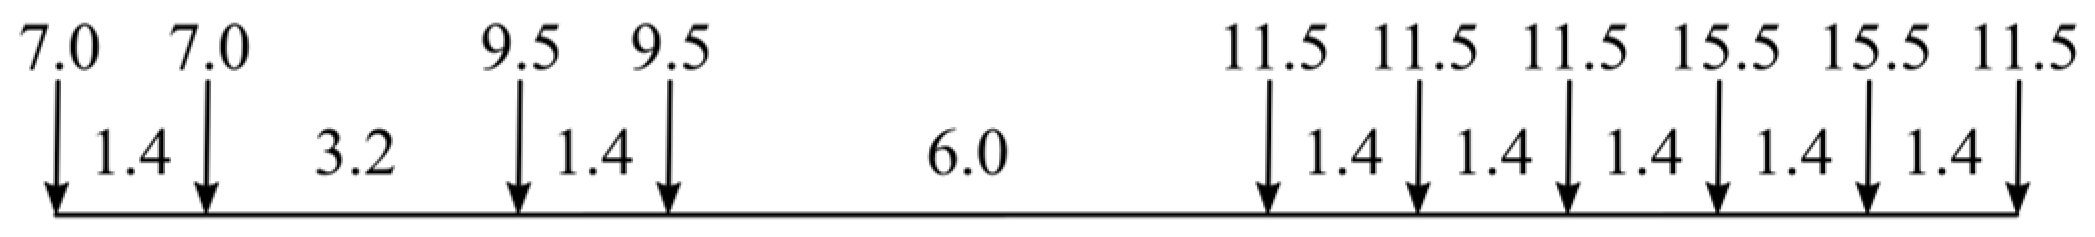
Figure 7.
Real-time DIC setup for field testing.
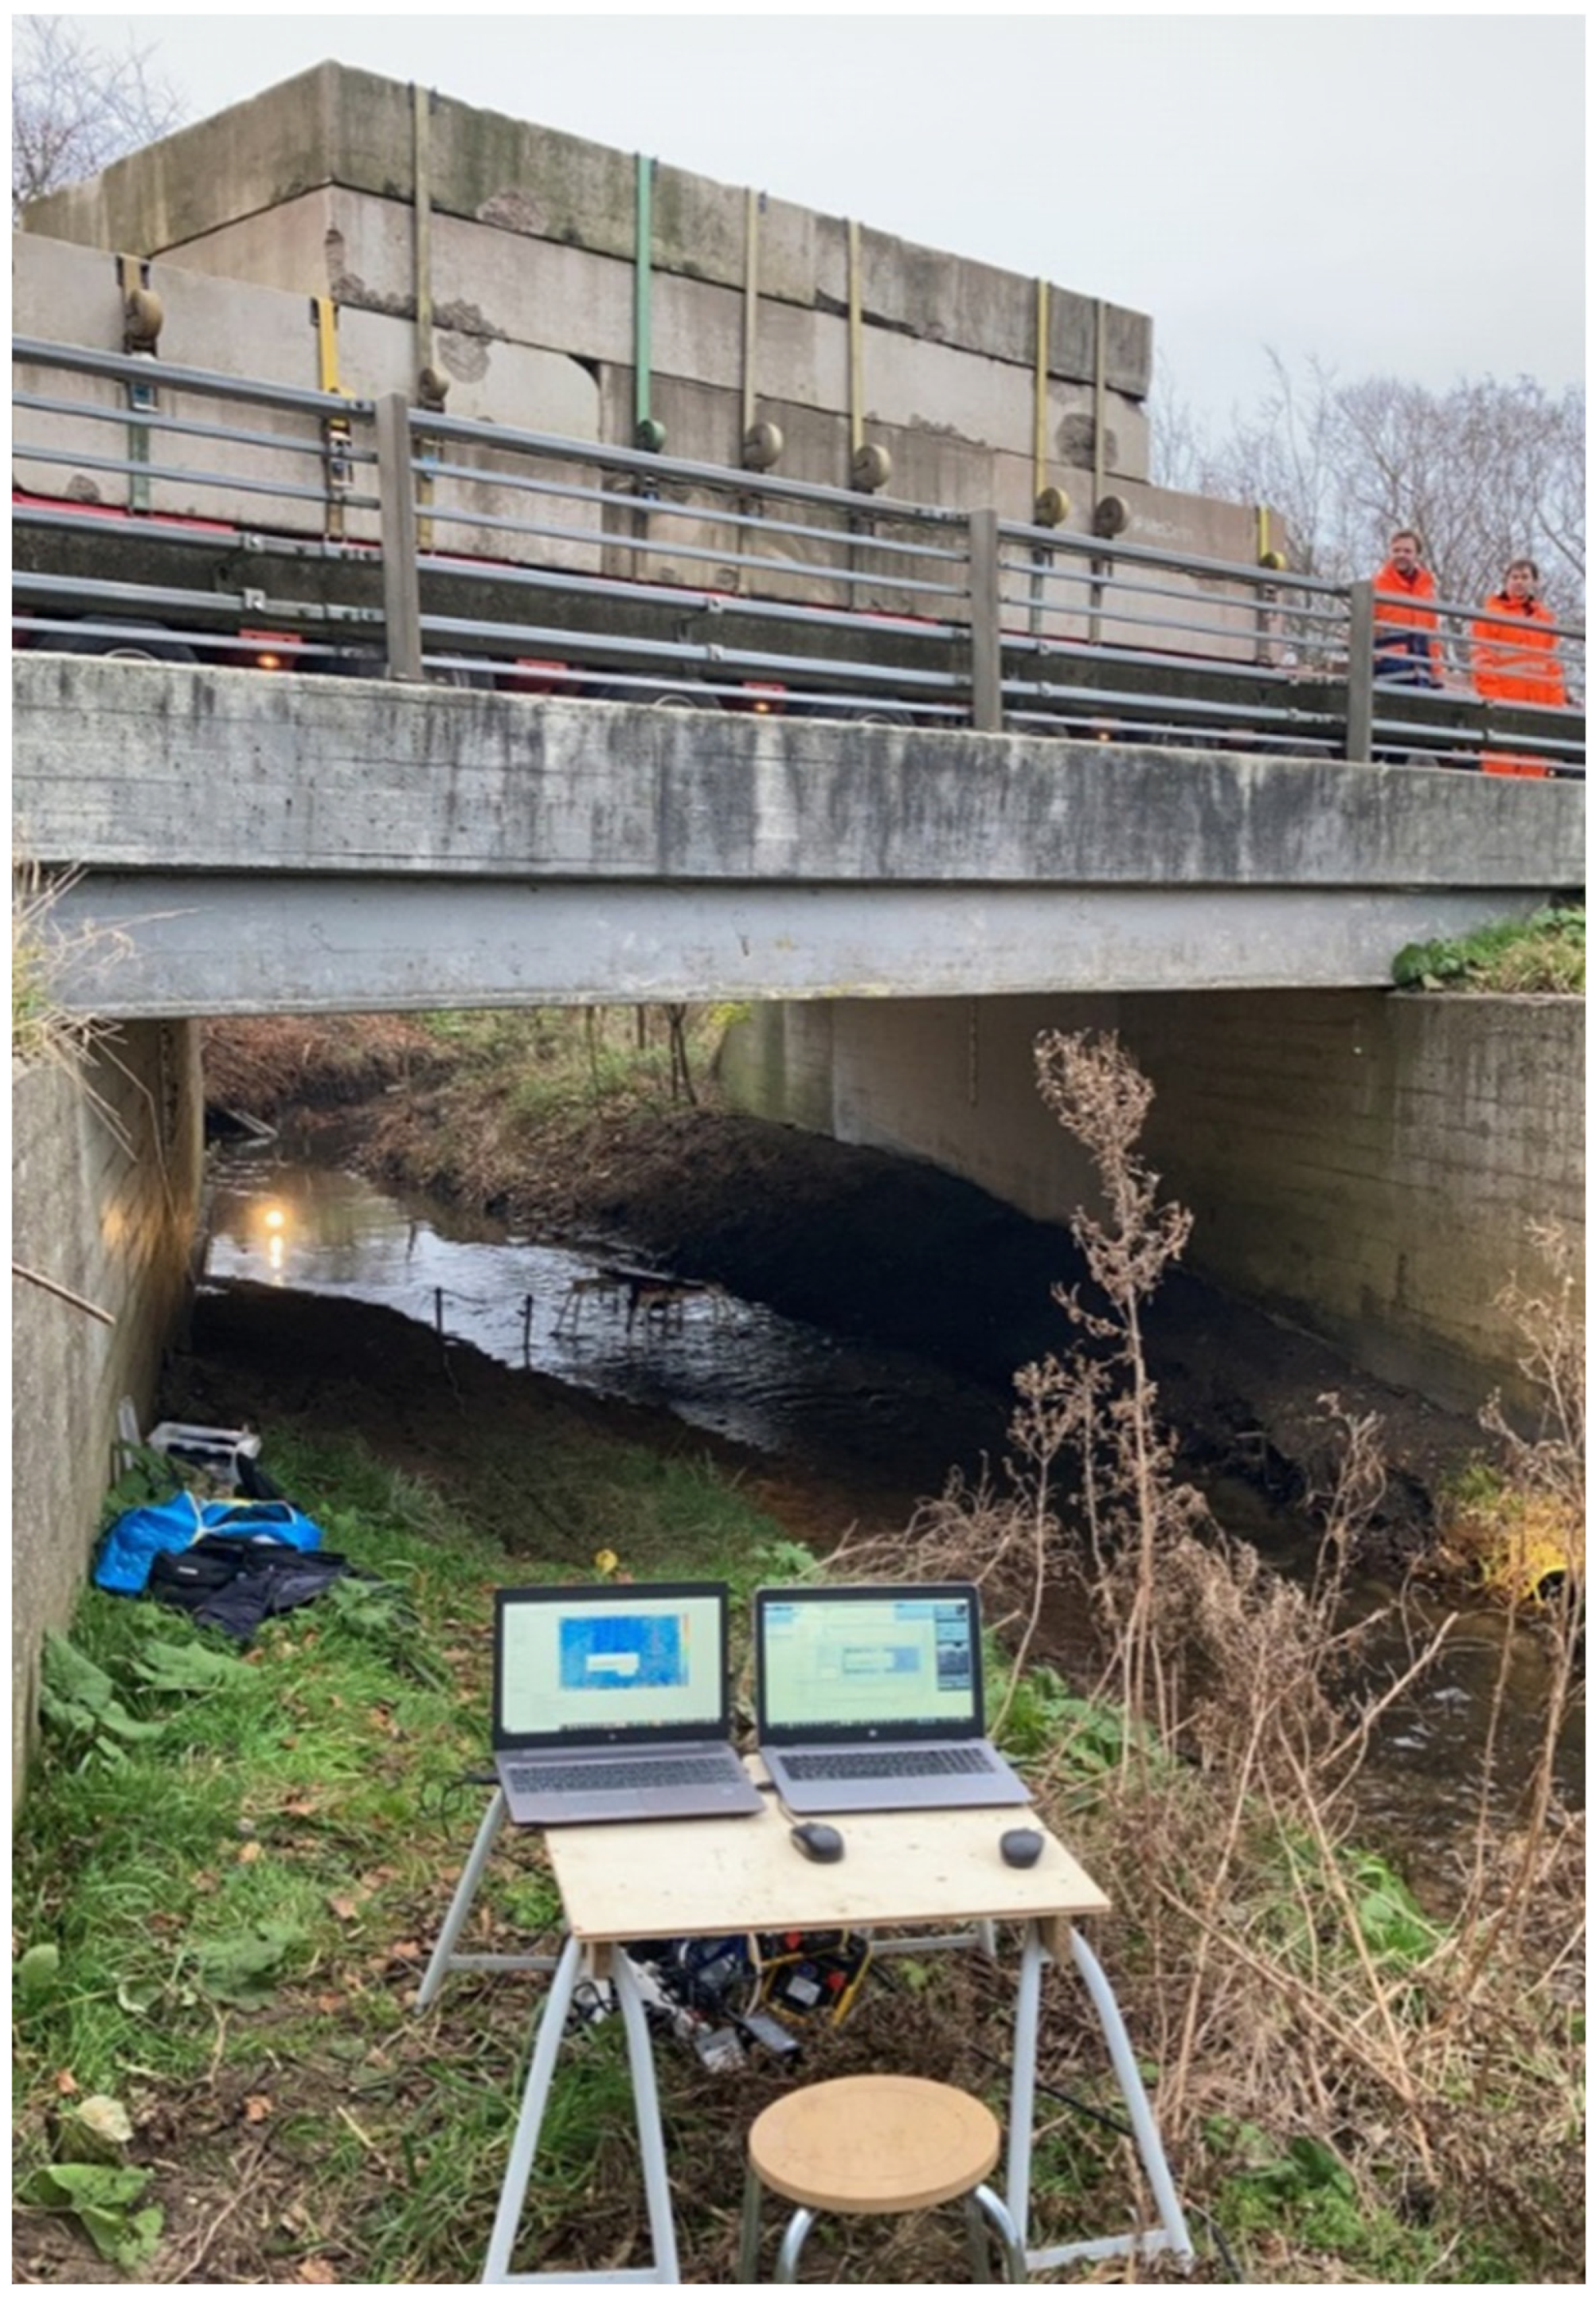
Figure 8.
The response curve for the tested OT-slab bridge.
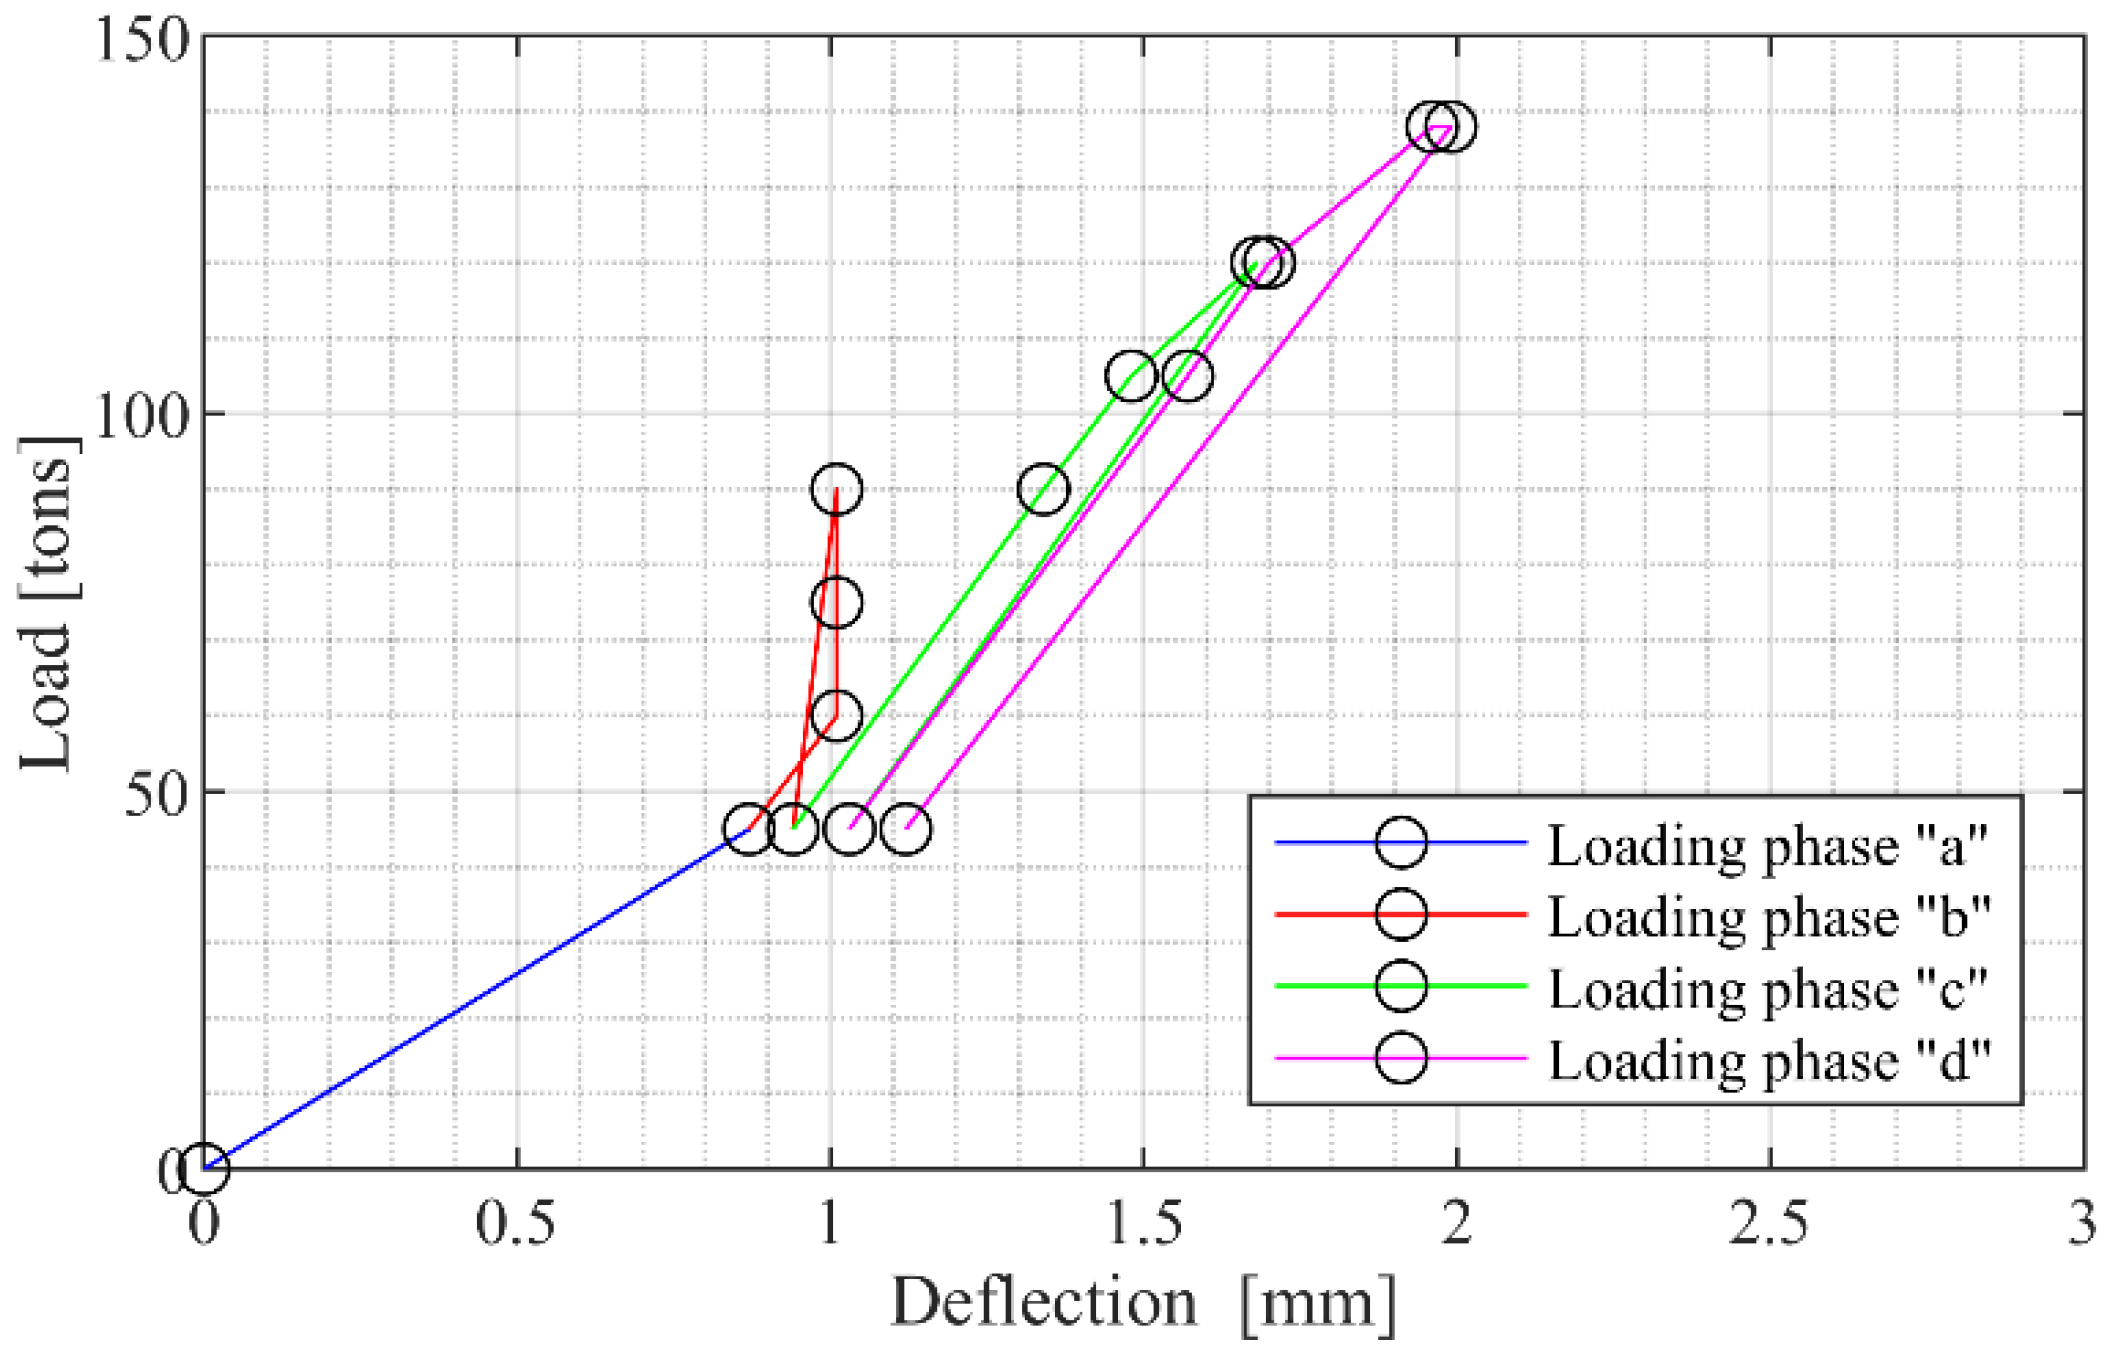
Figure 9.
DIC strain plot at the target load (45 tons + 3 × 31 tons).
Disclaimer/Publisher’s Note: The statements, opinions and data contained in all publications are solely those of the individual author(s) and contributor(s) and not of MDPI and/or the editor(s). MDPI and/or the editor(s) disclaim responsibility for any injury to people or property resulting from any ideas, methods, instructions or products referred to in the content. |
© 2023 by the authors. Licensee MDPI, Basel, Switzerland. This article is an open access article distributed under the terms and conditions of the Creative Commons Attribution (CC BY) license (https://creativecommons.org/licenses/by/4.0/).
Share and Cite
MDPI and ACS Style
Christensen, C.O.; Damsgaard, K.D.S.; Sørensen, J.D.; Engelund, S.; Goltermann, P.; Schmidt, J.W. Reliability-Based Proof Load Factors for Assessment of Bridges. Buildings 2023, 13, 1060. https://doi.org/10.3390/buildings13041060
AMA Style
Christensen CO, Damsgaard KDS, Sørensen JD, Engelund S, Goltermann P, Schmidt JW. Reliability-Based Proof Load Factors for Assessment of Bridges. Buildings. 2023; 13(4):1060. https://doi.org/10.3390/buildings13041060
Chicago/Turabian StyleChristensen, Christian Overgaard, Kenneth Dahl Schiøttz Damsgaard, John Dalsgaard Sørensen, Svend Engelund, Per Goltermann, and Jacob Wittrup Schmidt. 2023. "Reliability-Based Proof Load Factors for Assessment of Bridges" Buildings 13, no. 4: 1060. https://doi.org/10.3390/buildings13041060
Note that from the first issue of 2016, this journal uses article numbers instead of page numbers. See further details here.