Perspective

Role of In-Field Experimental Diagnostic Analysis for the Derivation of Residual Capacity Indexes in Existing Pedestrian Glass Systems

Department of Engineering and Architecture, University of Trieste, Via Valerio 6/1, 34127 Trieste, Italy
*
Author to whom correspondence should be addressed.
Buildings 2023, 13(3), 754; https://doi.org/10.3390/buildings13030754
Submission received: 22 February 2023 / Revised: 10 March 2023 / Accepted: 11 March 2023 / Published: 13 March 2023
(This article belongs to the Collection Innovation in Structural Analysis and Dynamics for Constructions)

Abstract

:
The use of simplified tools in support of the mechanical performance assessment of pedestrian structures is strongly attractive for designers due to practical efficiency, as well as for researchers in terms of innovation and the assessment of new proposals. On the side of design, the vibration serviceability requires that specific comfort levels for pedestrians are satisfied by taking into account conventional performance indicators and the class of use, or the structural typology for pedestrian systems’ object of analysis. A major issue, in this context, is represented by long-term performance of systems (especially pedestrian) that are based on innovative or sensitive materials and possibly affected by degradation or even damage, and thus potentially unsafe. Consequently, it is clear that, especially for in-service structures, the availability of standardized non-destructive protocols for a reliable (and possibly rapid) structural assessment can represent an efficient support for diagnostics. This perspective paper poses the attention on the residual capacity quantification of laminated glass (LG) pedestrian structures, and on the assessment of experimental and/or numerical tools for their analysis. To this aim, three modular units belonging to two different indoor, in-service pedestrian systems are taken into account like pilot studies. On the practical side, as shown, a primary role is assigned to Operational Modal Analysis (OMA) procedures, which are used on-site, to quantify their structural performance based on vibration response, including damage detection and inverse characterization of materials degradation. As shown, based on earlier detailed validation, it is proven that a rapid structural assessment can be based on a single triaxial Micro Electro-Mechanical System (MEMS) accelerometer, which can be used to derive relevant capacity measures and indicators. To develop possible general recommendations of technical interest for in-service LG pedestrian systems, the so-calculated experimental performance indicators are assessed towards various traditional design procedures and literature approaches of classical use for structural diagnostic purposes, which are presently extended to the structural typology of LG systems.

1. Introduction

In the civil and structural engineering fields, monitoring and diagnostic tools have a primary role for safety level preservation. To minimize the number of possible injuries in case of structural damage, the availability of simplified and standardized operational protocols for in-field diagnostics is particularly advantageous. In general, the primary objective of a possibly rapid but especially robust/sound structural safety assessment for a given construction/building system is to quickly inspect and quantitatively evaluate its residual load-bearing capacity under ordinary or even exceptional design actions, and, consequently, to address whether the presence/initiation/propagation of any damage can represent a major issue and possible risk for the safety of customers. As such, this task is particularly challenging, particularly in case of accidental damage or extreme events on buildings ([1,2], etc.).
In the framework of a residual capacity assessment of traditional existing buildings (reinforced concrete-framed structures, masonry constructions, etc.), two primary concerns need to be properly taken into account, namely consisting of (i) a quick evaluation and preliminary detection of “structural” and “non-structural” components; and (ii) the sound individuation of any visual sign of damage, and thus, in the consequent detection of possible “unsafe” members (Figure 1). For “structural” components in reinforced concrete buildings, for example, visual damage can be recognized in the form of typical failure evidence like cracks, spalling, etc., which are well-known conditions associated to possible risk. In-field diagnostic inspections, with eventual localized measurements of few key parameters, can suggest the opportunity and the urgency of a rapid retrofit intervention, or at least the convenience of an additional structural health monitoring process for a given time interval [3] before any kind of retrofit planning. Ad-hoc protocols for in-field diagnostic campaigns, in this regard, may be required and may appear particularly convenient, especially for those buildings and constructions in which, due to severe damage, the accessibility or the practical execution of in-field measurements could be extremely difficult or unsafe [4]. For cultural heritage diagnostics considerations, such as ancient masonry structures or monumental buildings, specific uncertainties could require additional appropriate assessments in problem solving [5]. Overall, based on the above considerations, it is clear that the availability of systematic, robust monitoring and diagnostics protocols, as well as the availability of simplified operational methods for in-field interventions, assumes an increasingly strategic role [6,7].
Typical monitoring tools of buildings can be efficiently adapted to bridge structures and even pedestrian walkways, which have a direct interaction with occupants and thus, are possibly associated with human discomfort and even risks of falling in cases of structural damage. The use of accelerometers and vibration-based damage detection for bridges, in particular, is notoriously characterized by several advantages compared to traditional methods of non-destructive evaluation, as well as a reduced cost thanks to recent technologies [8,9]. For traditional bridge structures, recent studies show that Virtual Reality (VR) environments, in the same way as innovative image-based structural health monitoring strategies, can also integrate classical monitoring tools and instruments [10,11]. In addition, maximum predictive details and data can be achieved from the development of integrated smart sensors based on the application of GPS receivers, accelerometers, and smartphones for bridges [12]. As a common rule of the multitude of research studies and industrial applications, there is the general need of engineering knowledge and monitoring of performance indicators for those structural parameters—to address in terms of conventional performance indicators—which have a primary role in safety issues with a predictivity capacity that can anticipate possible severe damage. This primary goal, which is especially challenging for ancient structures, can take advantage of robust procedures of analysis, which are in most cases integrated by experimental, analytical, and numerical methods, as well as reference performance limits to address and satisfy [13,14,15].
Such a basic need of deep engineering knowledge and damage prevention for safety maximization, in general terms, can also be rationally expected for innovative constructional solutions and/or materials, which, for example, are subjected to unfavourable operational conditions or —compared to traditional solutions—a lack of sufficiently deep engineering knowledge in term of residual capacity assessments. In the field of laminated glass (LG) elements, for example, one of the major open challenges is represented by post-fracture behaviour characterization and optimization. This aspect is particularly urgent (but presently solved by an overdesign of new LG members), especially for load-bearing components characterized by a prevailing human-structure interaction (i.e., floors, partitions, etc.) or even unfavourable operational conditions (Figure 2a,b).
Typical examples are pedestrian LG systems under long-term effects and subjected to random walks [16,17] or balustrades with a deliberate fracture [18]. Due to intrinsic material properties and structural design assumptions, even partial evidence of glass fracture (i.e., Figure 2c) or material degradation can, in fact, suggest urgent maintenance and retrofit interventions [19], or even the replacement of original components by higher robustness elements. In this regard, it is recognized that the visual detection of glass fracture, even partial, for an existing structural glass system still represents a “no-return” condition for the structure itself, and thus, the origin of possible short-term risks for customers. On the other side, glass fracture itself does not correspond to immediate structural collapse and thus, could offer a minimum post-fracture resistance to facilitate a fast retrofit intervention. In some cases, the progressive degradation of mechanical parameters can be detected early by interlayer discolouring, which can possibly represent an efficient indicator of incoming severe deterioration phenomena. However, on the other side, it is hardly quantifiable [20]. A quantitative in-field measure of key performance indicators for improved control and risk minimization of post-fracture performances and residual capacities of glass structures, in this regard, should unavoidably take advantage from a dedicated, easy-to-apply and optimised experimental protocol. Apart from risk minimization in case of mechanical capacity degradation or damage, the present approach fulfils various serviceability aspects for the whole lifetime of a given glass structure.
In the same way of damage and collapse prevention, additional attention to design procedures is, in fact, also given to comfort maximization for those customers that take advantage of structural glass functionality (i.e., against vibrations, etc.) during daily activities. Overall, it is clear that the satisfaction of appropriate comfort and safety levels for in-service LG structures is necessarily correlated to a robust engineering knowledge of real-time performances and mechanical properties of stand-alone or assembled components. The higher is the direct interaction of customers with glass structures (i.e., pedestrian systems, balustrades, etc.) and the need of dedicated diagnostic protocols for risk minimization, comfort optimization, and thus, functionality preservation. The intrinsic material and geometrical features of typical use for LG solutions, more in detail, suggest the need of dedicated assessment methods and the consequent instruction for the correlation of evidence discovered in experimental outcomes of “Current” load-bearing capacities to reliable performance/safety indicators. Huang et al. [21], for example, proposed a rapid safety assessment of curtain wall panels based on their remote vibration frequency measurement. Starting from modal analysis results, the study showed that the first order inherent frequency of linearly restrained curtain wall panels is expected to decrease with an increase of sealant failure and degradation.
In this paper, in accordance with the investigation earlier reported in [22] and based on the above considerations, the in-field experimental derivation of possibly efficient and easy-to-use structural performance indicators for safety and residual capacity assessments of in-service LG pedestrian systems is explored. The feasibility and potential of procedural steps as in Section 2, in support of structural health diagnostics, are addressed by taking into account three different case-study applications. Limits and open gaps are also discussed in Section 3, Section 4 and Section 5 about the elaboration of a robust methodology of general applicability.

2. Research Methods

2.1. Constituent Materials

Talking about diagnostics in glass constructional members is particularly challenging for several reasons. On one side, the engineering knowledge for existing in-service structures is limited, because monitoring data and diagnostic programs are still very few [16,17]. Lack of experimental data to support the interpretation of long-term or accidental behaviours for these special structures is a first practical obstacle.
In parallel, material intrinsic features and their sensitivity to several external and operational aspects represent an additional source of uncertainty for diagnostics [23,24], which can be still addressed by experimental tools and monitoring programs. However, this necessitates (as it happens for different structural typologies) a wide set of experimental data, case studies, and real applications.
Structurally speaking, the working assumption for design is, in fact, that glass material behaves as linear elastic material with brittle behaviour in tension, while the glass layers are bonded by viscoelastic interlayers (see Table 1 [23,24]). Moreover, in practical applications for in-service LG systems, all the above aspects are further mutually affected by the final destination these structural systems have in buildings (i.e., type of loading, etc.), by external ambient conditions (see also Section 3, Section 4 and Section 5) and by the occurrence of possible degradation in materials.

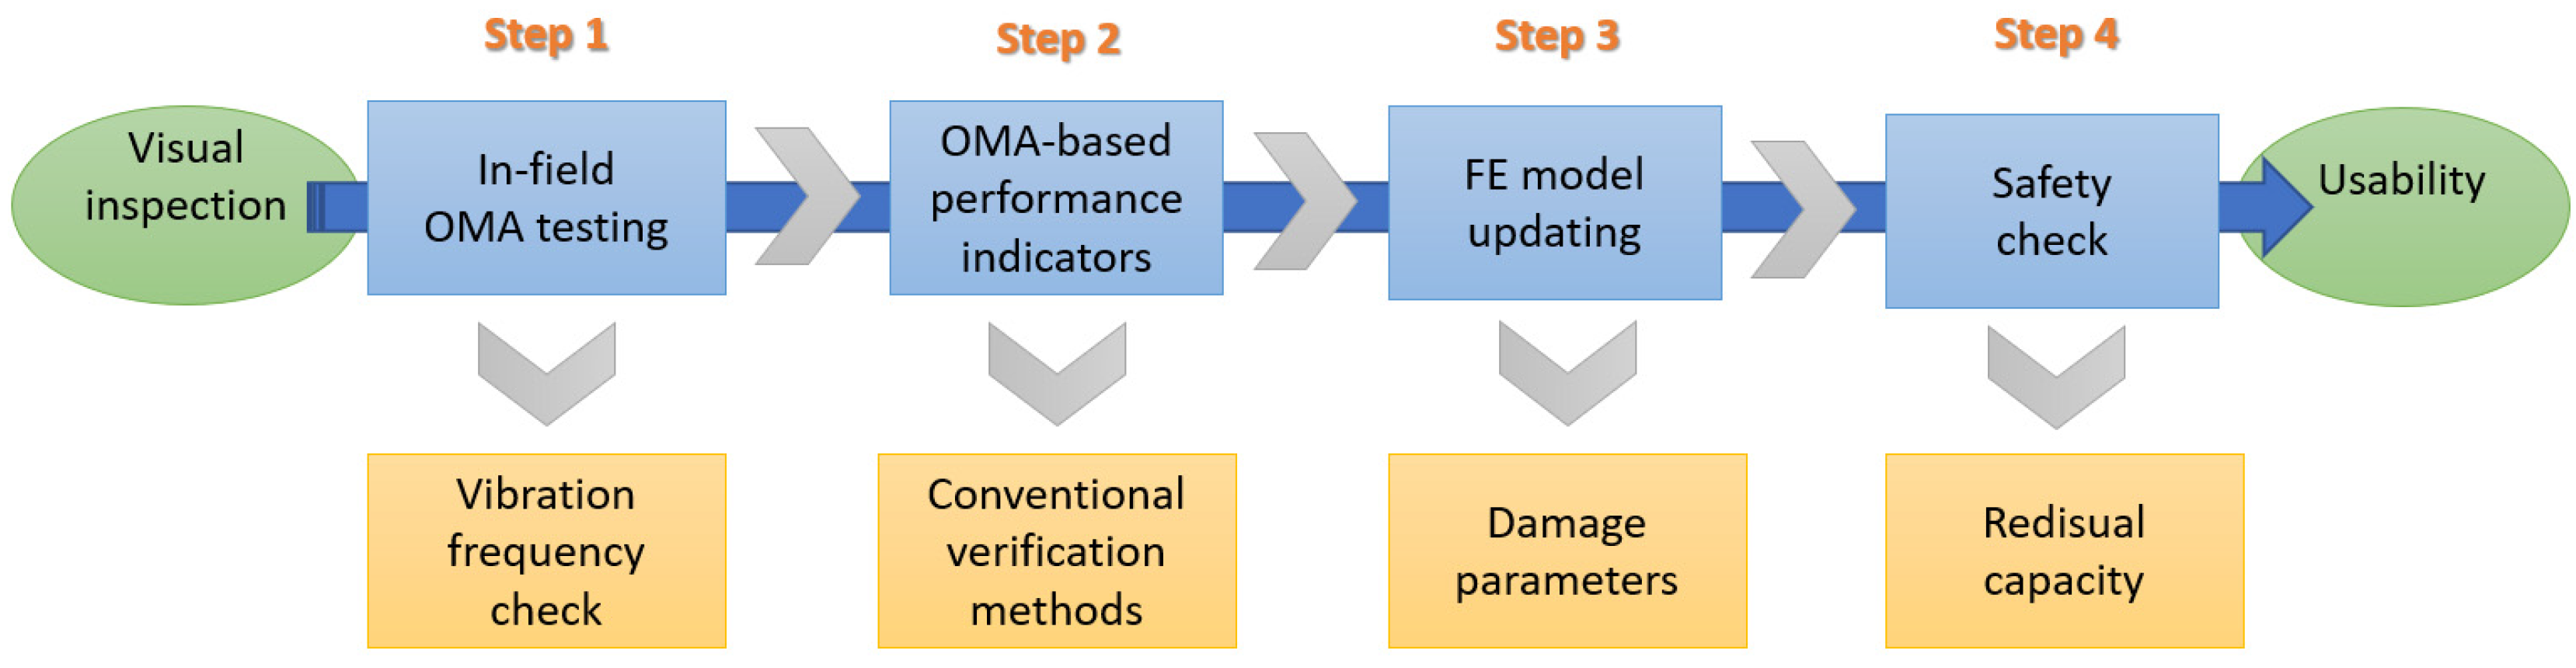
2.2. Procedural Steps for Residual Capacity Assessment

Based on above considerations, technical issues, and lack of specific regulations for in-service LG structural assessment, it is clear that the availability of a standardized procedural protocol is a primary need [22]. In this paper, the attention is thus focused on the elaboration and practical application of a possible diagnostic methodology in which a primary role is assigned to in-field testing, but experimental evidence is then properly integrated (Figure 3). To note that—as a first pilot experimental and numerical assessment—the specific technology of structural LG pedestrian systems is taken into account.
Differing from “ad hoc” laboratory protocols and testing configurations, the experimental assessment of in-service LG systems is notoriously affected by several technical challenges and restrictions, which suggest the use of a minimum number of instruments and the maximization of experimental outputs (Step 1 in Figure 3). To this aim, a preliminary visual inspection is also recommended (Figure 3).
Once the most relevant performance indicators are extrapolated from in-field testing, specific limits and indicators are required for safety assessment (Step 2 in Figure 3). To note, LG systems may offer relatively “high vibration frequency”, according to definitions from ISO 10137:2007 [25], but they still suffer from marked sensitivity to vibrations or even damage. In this context, the preliminary knowledge of the real vibration frequency for an in-service structural system (and its possible sensitivity and modification under external loads) notoriously represents a powerful indicator for structural diagnostics [16,17,19]. At the same time, the vibration frequency itself is limited in interpretation as single parameter for monitoring purposes. A more refined analysis of experimental evidence, based on post-processing elaboration of basic in-field data, is thus recommended to derive possible quantification of damage parameters under real-time operational conditions.
A more detailed interpretation of experimental outputs can take further advantage of the support of dedicated Finite Element (FE) numerical models in order to characterize basic equivalent material properties for the constituent LG components (Step 3 in Figure 3). Most importantly, these FE models—once validated in experimental data—can support a more realistic quantification of long-term effects for the examined LG systems and thus a rationale measure of residual capacity parameters, which are of primary interest for safety purposes in structural systems interacting with occupants (Step 4 in Figure 3). All these steps are applied to three different case-study systems and discussed in terms of practical convenience, impact, present uncertainties, and future developments.

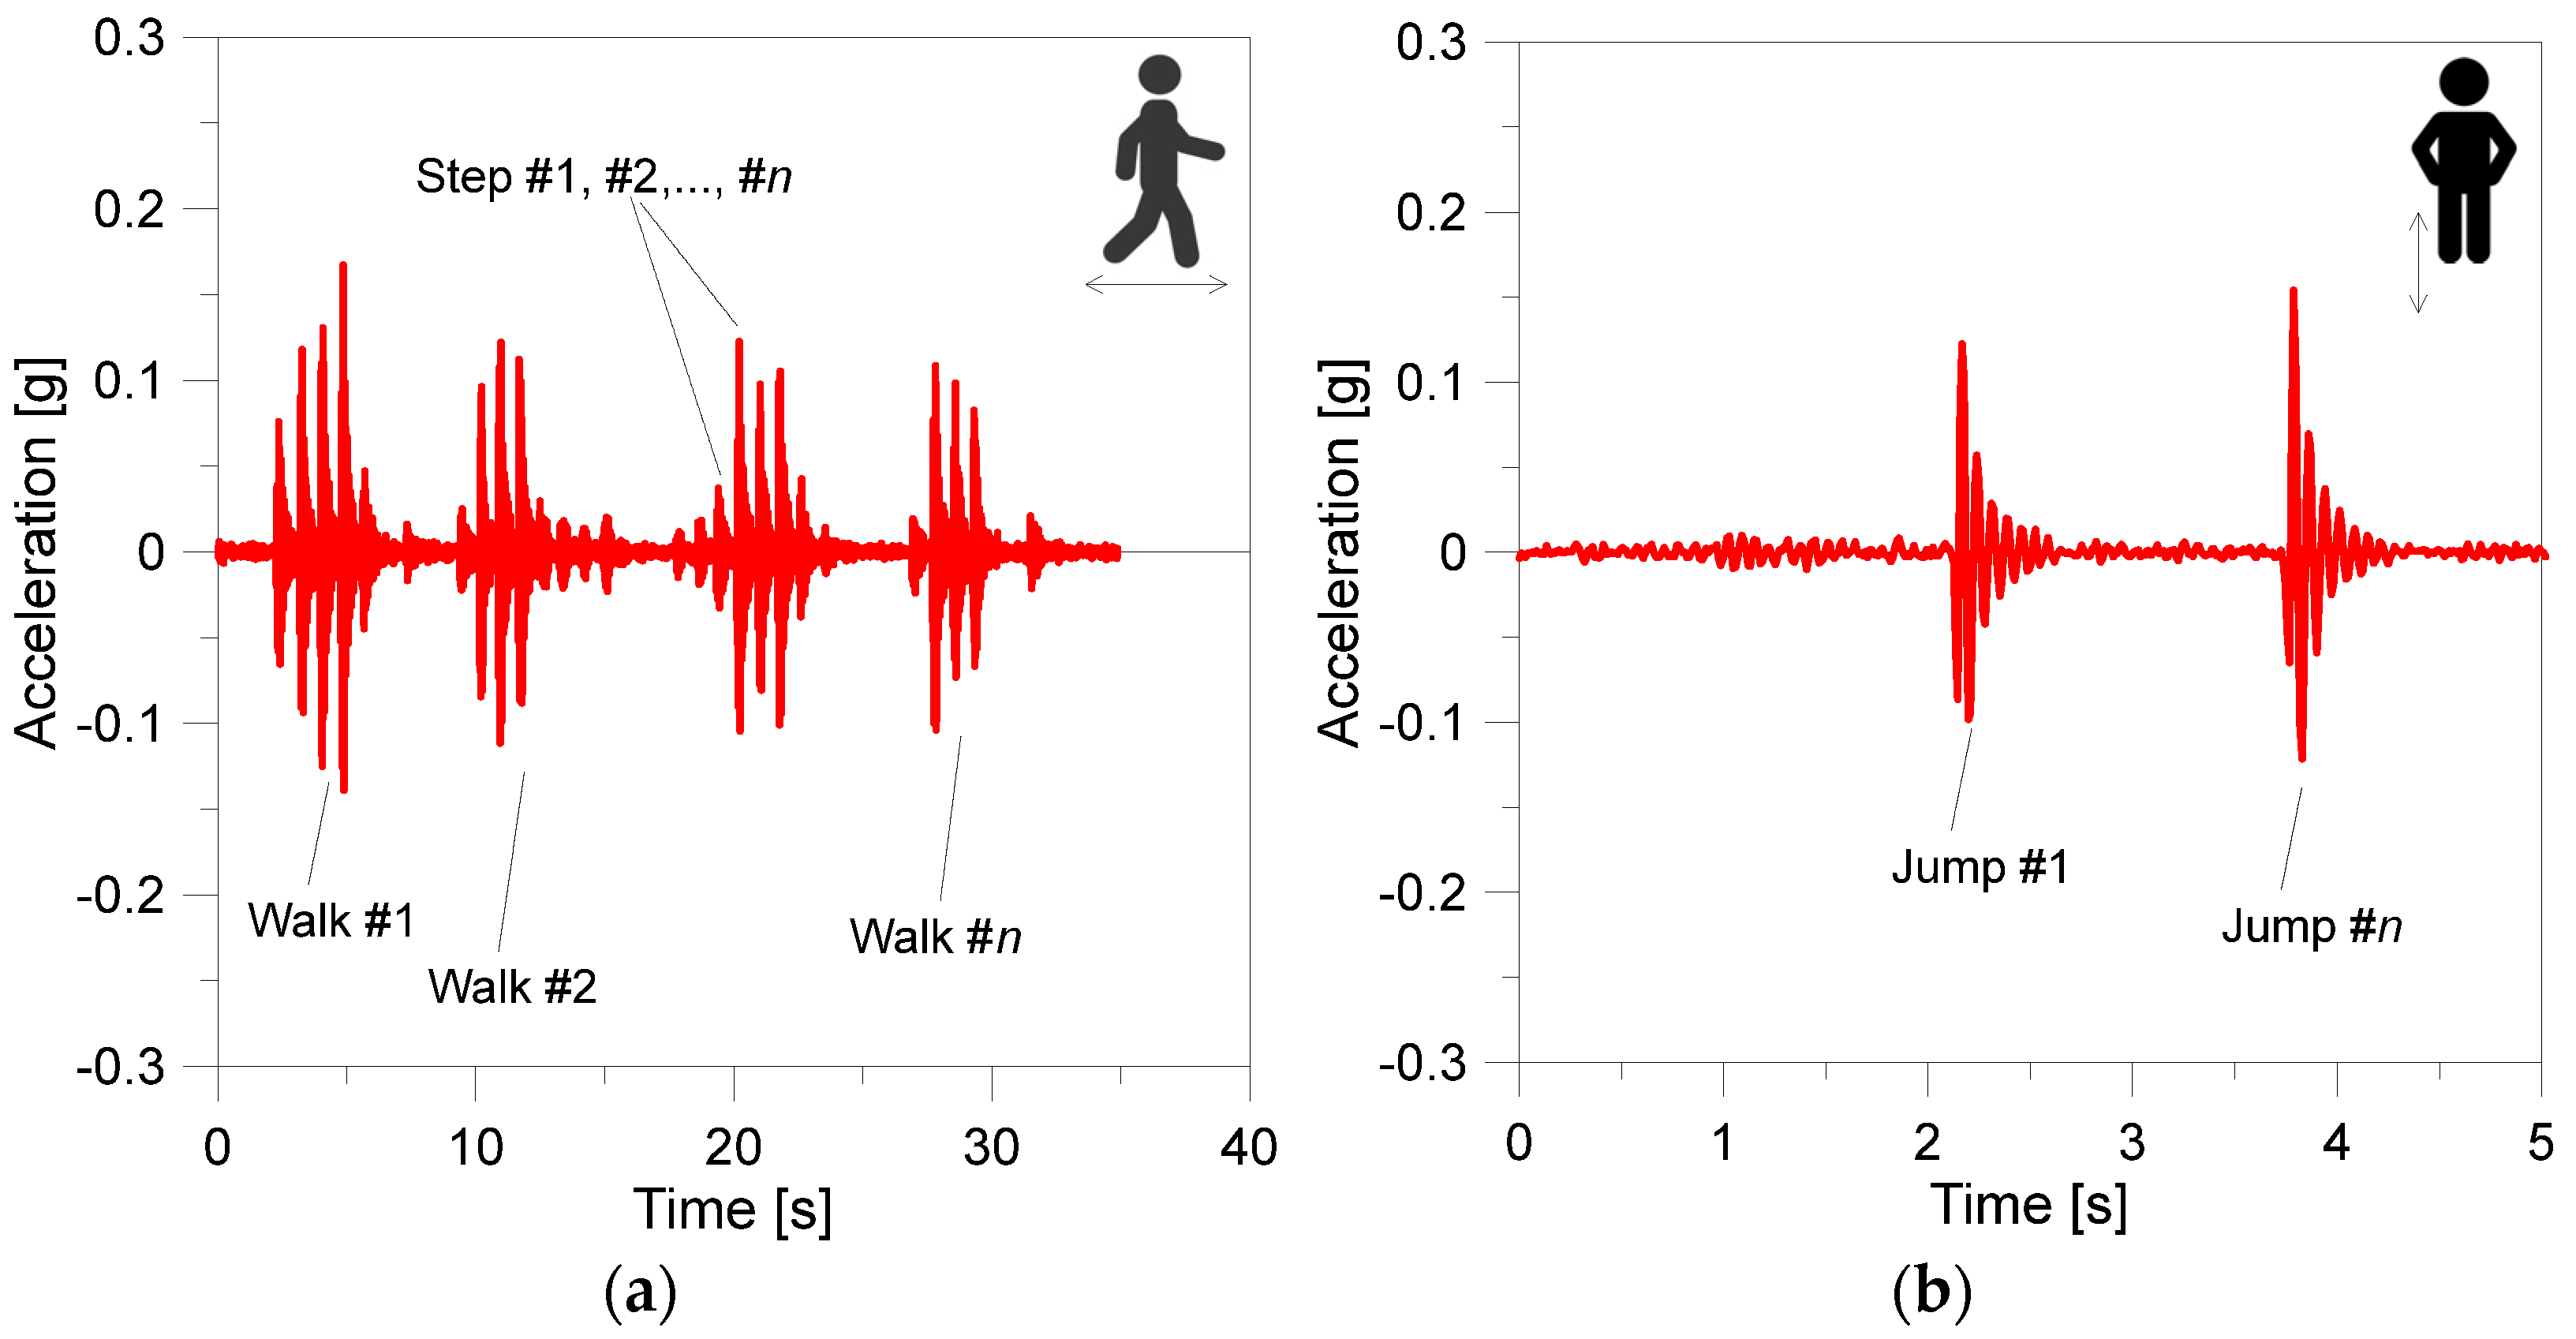
2.3. Operational Modal Analysis (OMA) Testing for In-Service LG Systems

Operational Modal Analysis (OMA) for structures and building components—Step 1 in Figure 3—is known to represent a robust and efficient technique, able to offer a multitude of material and damage parameters (Figure 4a). Major benefits of OMA techniques are related to possible application in various structural components without the need of destructive interventions and service interruptions [26]. The optimal setup definition is a critical step to capture relevant dynamic mechanical parameters, especially for complex assemblies. OMA is, in fact, very attractive because tests are generally cheap and fast, and they do not usually interfere with the normal use of the structure. Moreover, the identified modal parameters are representative of the actual behaviour of the structure under in-service conditions since they refer to realistic levels of vibration in the structure and not to artificially generated vibrations [27]. Successful experimental research studies can be found in the literature for a multitude of civil engineering applications, most of them consisting in towers and minarets [28,29], bridges [30,31], or special structures [32,33]. For glass structures, practical OMA evidence can also be coupled to different customers behaviours and reactions for comfort analysis [34,35].
In the framework of existing LG systems, the typical size of panels and structural mass parameters can be efficiently addressed based on experimental tools and protocols for OMA testing and low-level imposed vibrations. In [16,17], for example, multiple Micro Electro-Mechanical System (MEMS) accelerometers, resulting from prototypes validated in [9], have been used for diagnostic purposes of a suspension glass walkway (Figure 4b). A total of six MEMS sensors were placed on the investigated modules to capture the typical beam-like bending vibration response. Partial glass fracture and damage effects under random walks were explored in [19]. The effect of psychological discomfort for customers asked to move in the context of glass structures, including LG pedestrian systems, was addressed in [34,35]. As a matter of fact, the primary concern for customers may be represented by uncertainty of actual safety levels of glass pedestrian systems.
Following earlier experiences, especially [16,17], the present study shows recent trends of in-field experimental diagnostic tools for LGs. To facilitate an efficient in-field investigation, the acquisition system is optimized in number of sensors and recorded data to maximize the interpretation of in-field experimental outcomes based on a single MEMS sensor (Figure 4c). This kind of working assumption corresponds to a diagnostic protocol that could be extremely advantageous for those situations affected (as it is for in-service systems in general) by major operational and technical limitations and restrictions for testing (i.e., due to normal service use of the structure object of study). In addition, the proposed approach is advantageous for all those situations affected by major technical issues as it is for emergency conditions and thus where it is not possible to take advantage of time, resources, instruments, and integrated tools, which are of typical use of more sophisticated experimental protocols. On the side of in-field experimental testing, it is, in any case, important to note that the setup arrangement or other material issues could make particularly challenging the inverse detection of structural parameters, as discussed in the following.

2.4. Vibration Frequency Estimation for In-Service LG Systems

As far as OMA techniques are applied to an in-service LG system, and, in particular, to a LG pedestrian structure, the first performance indicator to experimentally address is represented by a preliminary—but still possibly meaningful for early damage detection—vibration frequency estimate (Step 1 in Figure 3). The latter is notoriously able to take into account several influencing parameters that, for LG systems, have intrinsic modifications and trends compared to other constructional materials and components, such as possible modification of materials (including degradation events like in Figure 4a), but also important effects of interaction with occupants (see, for example, Figure 4b,c). The intrinsic advantage of frequency analysis based on in-field testing is thus a more realistic measurement of “actual” performances compared to, for example, analytical calculations. A beam-like LG member, regardless of its constituent layers, can be, in fact, theoretically assimilated to a slender Euler–Bernoulli beam, which is characterized in out-of-plane bending and vibration performances by an equivalent, monolithic b × h section, and its response is governed by:
2 x 2 E J x 2 υ x , t x 2 + ρ A 2 υ x , t t 2 = 0
where v(x,t) is the vertical displacement, at the abscissa x and time instant t, E and  ρ  are the modulus of elasticity and density of glass material (Table 1), J is the second moment of area, and A is the cross-section. However, as also shown in [36], Equation (1) supports a rational vibration frequency estimation only under the ideal assumptions of perfect restraints (i.e., simply support or clamp) and rigid bonding of the constituent LG layers:
f 1 = ω 1 2 π = 1 2 π β 1 4 E 12 m h 3
where βn is given in Table 2 and m is the mass per unit of length.
For LG sections, in support of Equation (2), major benefits and accuracy of estimates can be obtained from the use of an equivalent monolithic glass thickness hef = h [37,38]. This assumption is of utmost importance to include—even in simplified way—possible viscous effects of bonding interlayers and thus capture the corresponding frequency shift between the lower “abs” bound (weak bond of glass layers) and an upper “full” limit (rigid bond):
f 1 , a b s f 1 f 1 , f u l l
However, multiple intrinsic limits affect the usability of Equation (2) for “real” LG structural members and, consequently, the correlation in Equation (3) can also suffer for major sensitivity. Among others, Equation (2) lacks, in fact, major effects due to real, non-ideal boundaries. For the specific case of LG pedestrian systems, the occupant’s mass is disregarded. In addition, Equation (2) neglects the progressive modification of shear stiffness for the bonding viscoelastic interlayer with ageing and time loading [39,40] (see Figure 5) or even possible delamination phenomena [36], as well as unsymmetrical of flexibility parameters of restraints [41].
To note, vibration frequency changes, according to several literature applications for load-bearing cantilever of beam elements made of various constructional materials, is a relevant parameter, especially for damage severity detection and quantification (i.e., presence of cracks, and detection of their depth/size/location). Moreover, many other factors and boundary conditions may affect the vibration frequency for glass elements, as a major effect of their intrinsic material properties and needs for restraints. The stiffness and mechanical efficiency of fixing systems, in this case, may be efficiently addressed by frequency estimates (see for example Figure 6), as well as for LG components, which are still in the uncracked stage.
A major challenge for diagnostic purposes in LG structures is thus represented, according to Step 2 in Figure 3, by the experimental derivation and interpretation of relevant performance indicators. These are inclusive of vibration frequencies and, especially, their assessment towards reference performance indicators, which presently are not available for LG structures [34]. For the current study, all these elaborations are proposed in Section 4, by taking into account three different case-study systems.

2.5. Finite Element (FE) Model Updating for In-Service LG Systems

For SHM and diagnostic applications, the use of Finite Element (FE) numerical methods is known to represent a strategic method in support of mechanical analysis and inverse detection of unknown parameters. As such, it is expected that FE model updating can also efficiently support the residual capacity assessment of in-service LG structures (Step 3 in Figure 3). Moreover, specific details that are intrinsic of LG structures should be necessarily taken into account.
Most practical examples and case-study applications from literature are focused on bridge structures or historical buildings affected by structural damage after earthquakes [27]. The combined use of Genetic Algorithms and Artificial Intelligence tools can be also extremely efficient in model updating and optimal calibration of input parameters [42,43,44,45], including complex geometries and damage scenarios [46,47].
In the present study, FE model updating is primarily used to detect and quantify damage severity (including bonding degradation), and to address its effects on the performance of the examined in-service LG systems. On the practical side, it is clear that such a methodology requires detailed knowledge of geometrical properties for structural and non-structural components, which have a primary role in dynamic response assessment, especially for LG systems (i.e., [41]). For the herein discussed FE model updating and fitting procedure, more in detail, the target performance indicator is represented by the experimentally derived fundamental vibration frequency of the examined systems under random walks, which is known to represent a first strategic parameter for SHM purposes [25]. In this regard, it is worth to note that LG pedestrian systems are generally characterized by the use of repeated modular units, often limited in size, with relatively small structural mass and high or low vibration frequency. Accordingly, relevant dynamic effects could be also expected from the interaction of structures with occupants [17,48,49].

2.6. Final Verification Check and Residual Capacity Quantification

The final procedural diagnostic step for residual capacity quantification (see Step 4 in Figure 3) is finalized when the residual load-bearing capacity and thus the need of any maintenance intervention can be univocally quantified. There are no doubts that a robust engineering knowledge of “Current” capacity for a given existing structural system and its response to ordinary design actions is crucial for both safety and comfort purposes.
However, such a quantitative consideration represents a major challenge in the overall procedure in Figure 3, and the response is mutually affected by a multitude of working steps and operational assumptions, both for experiments and integrated models. Among others, a major issue can be represented by comparison and quantitative assessment of experimental evidence towards an “initial”, or “Time 0”, set of performance trends, which, in most cases, are unknown. Thus, it is clear that such a series of considerations may necessitate the support of “ad-hoc” numerical tools (for material properties sensitivity assessment, etc.), which could implicitly involve additional uncertainties in calibration.
Most importantly, once the “Current” performance is known, a specific reference level is needed for comparative purposes (for example, in terms of stress analysis or deflection amplitude). This crucial assessment step could be solved based on conventional verification procedures for stress verification (at the Ultimate Limit State—ULS) and deformation limit prevention (at the Serviceability Limit State—SLS) by taking into account the reference parameters conventionally in use for the “Time 0” structural design of LG structural systems.
As a final result, the major, initial issue or residual capacity could be thus clarified. Is the “Current” system able to ensure a sufficient functionality against ordinary loads? In addition, how much of the mechanical degradation/damage of materials affect its original load-bearing capacity? In the present study, following Figure 3, such an assessment and verification procedure is extrapolated for the selected case-study systems based on the Italian CNR-DT 210/2013 recommendations for design of structural glass elements [24]. To this aim, experimental and numerical evidence are first discussed in Section 3, Section 4 and Section 5, based on Steps 2–4 of Figure 3.

3. Practical Applications for Selected LG Pedestrian Systems

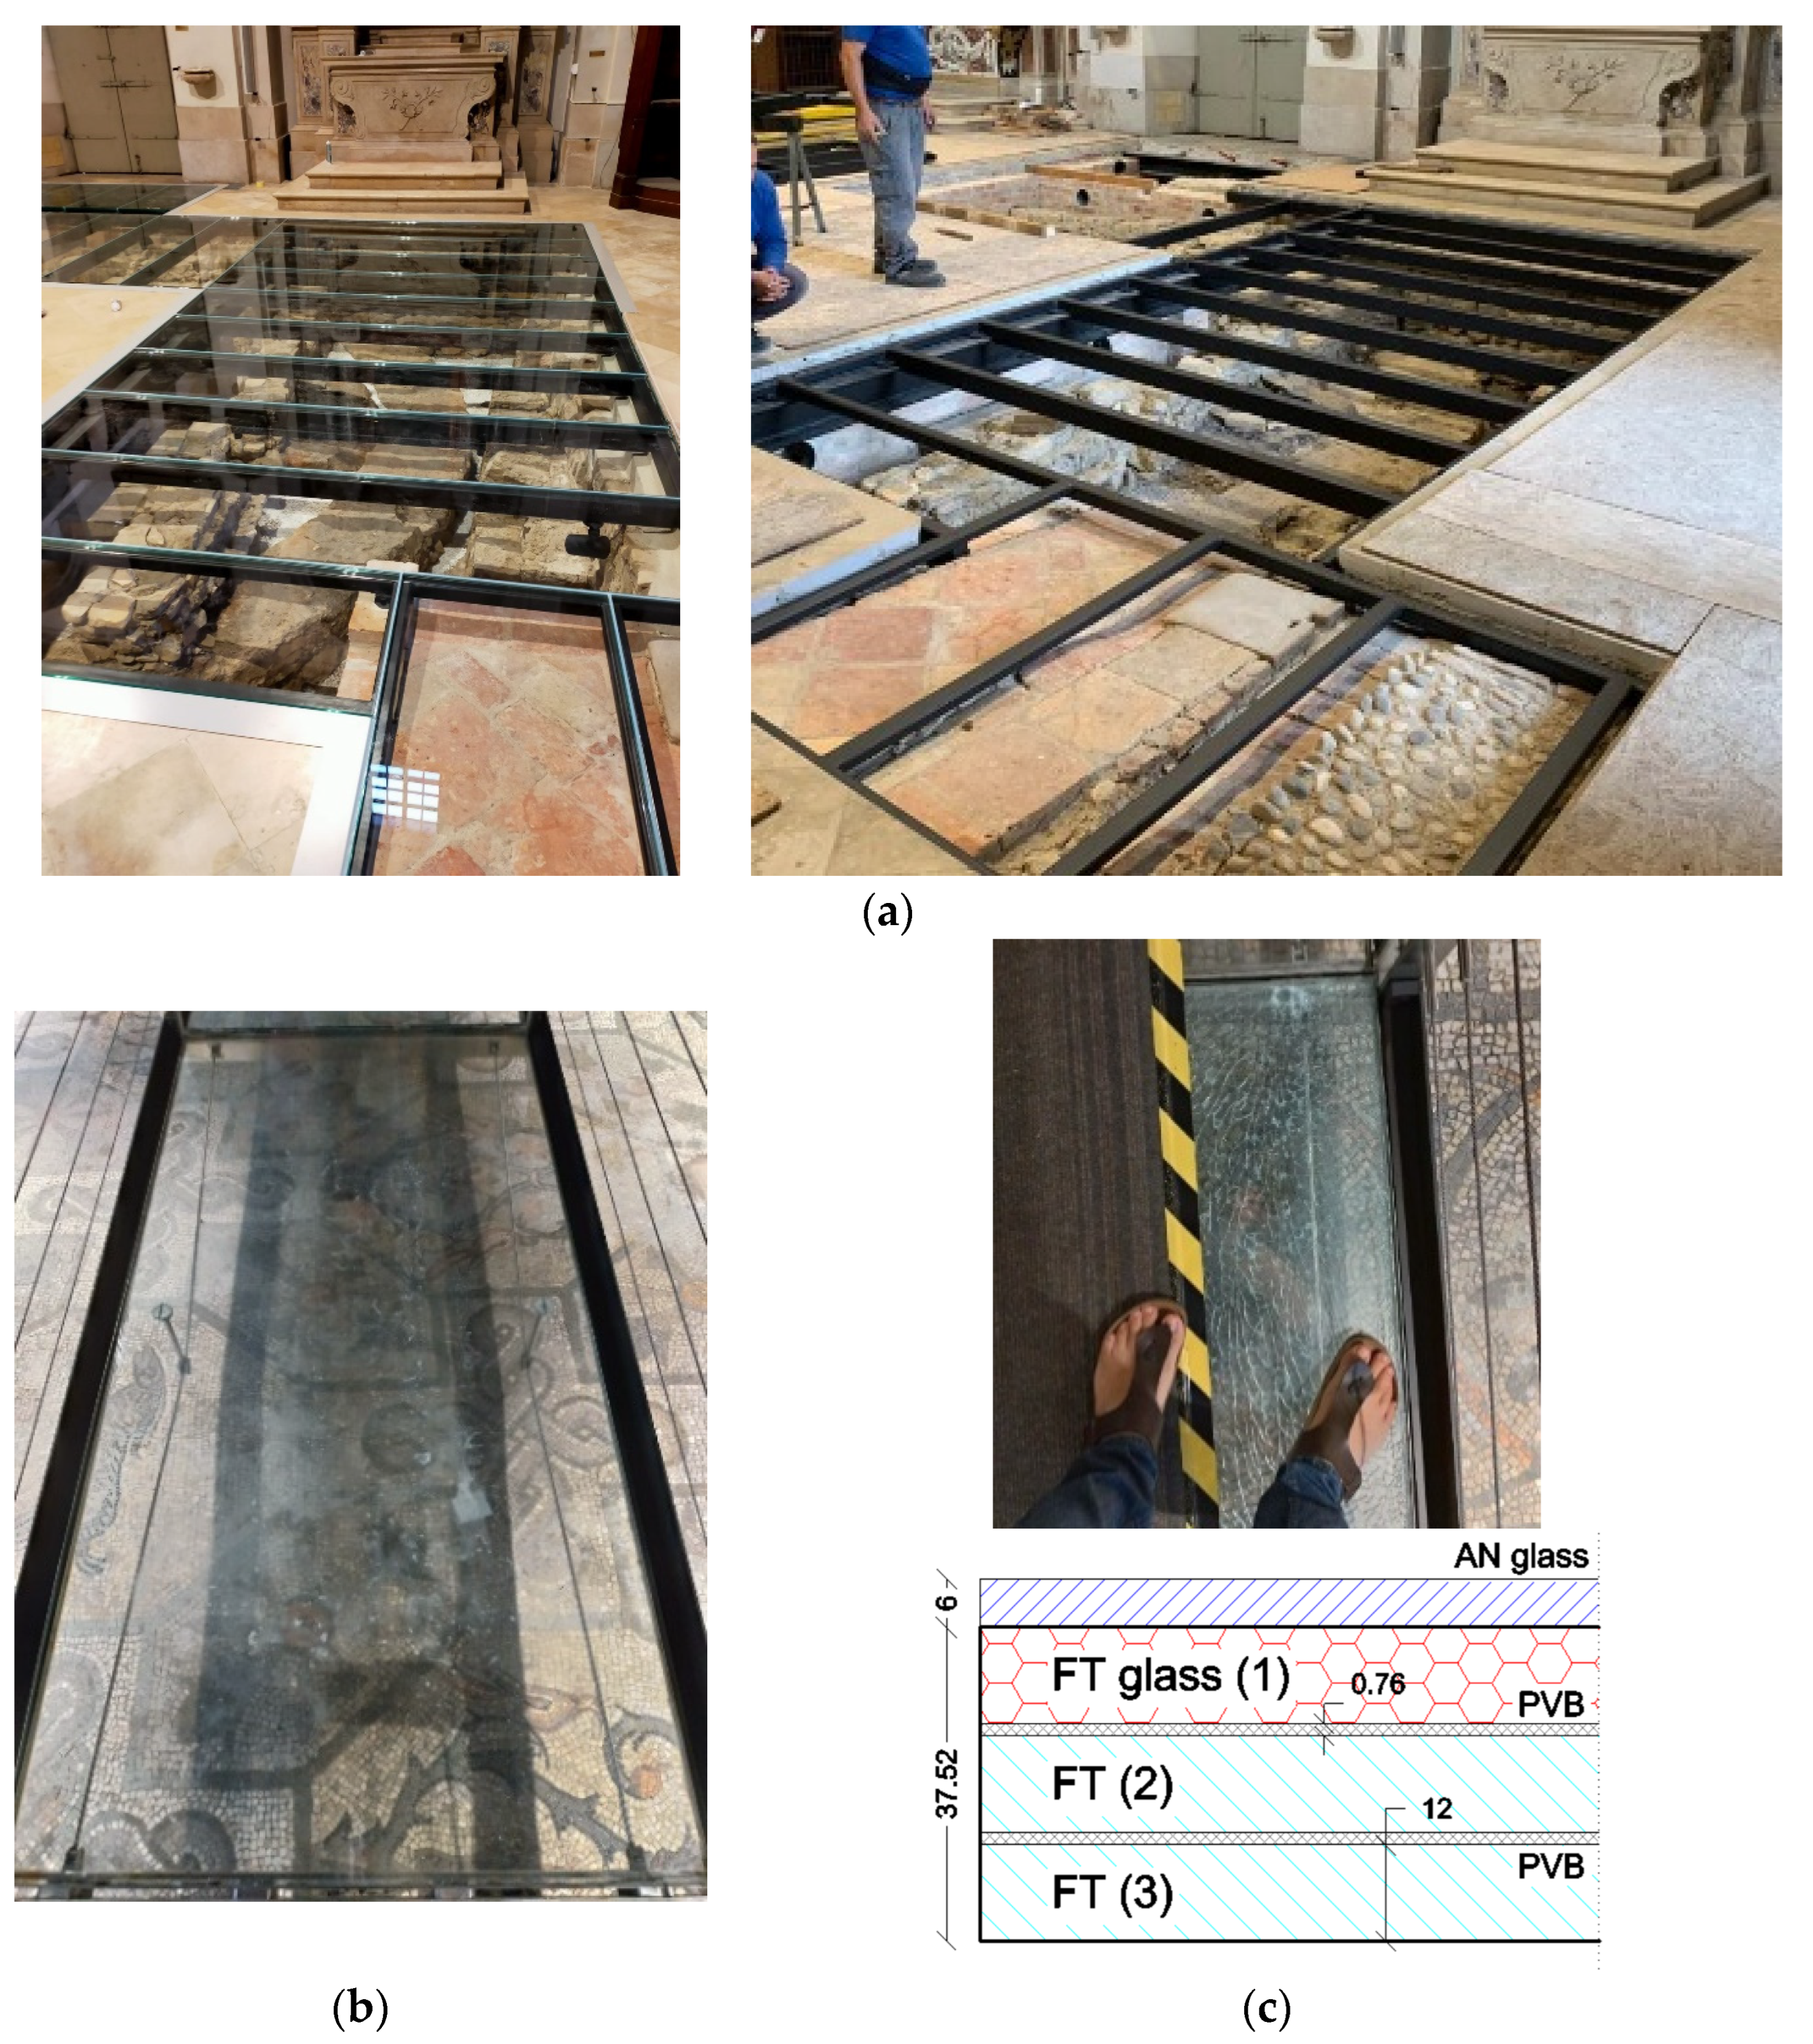
3.1. Geometrical and Mechanical Properties

The procedural steps, as shown in Figure 3 are applied to in-service case-study systems that were accessible for in-filed testing and/or practical interest for the present investigation. All the examined LG slabs are characterized by linearly restrained edges along two sides only (i.e., beam-like setup) and a triple LG section (i.e., three glass layers bonded by PVB). All the samples, moreover, are part of indoor pedestrian systems located in Friuli Venezia Giulia Region (Italy) and installed in the context of two historical churches where they are used to allow visibility of underground Roman age manufacts. Major geometrical details of practical interest for mechanical characterization are summarized in Table 3, while selected photos are collected in Figure 7.
The first examined system, SM#1–LGU, is located in San Giorgio di Nogaro (Udine). The in-field experiments were carried out in December 2020, ≈15 years apart from its original construction, on a reference modular unit characterized by 8/10/8 mm thick, fully tempered (FT) glass layers (0.76 mm PVB bonds). The dimensions of modules were L = 2.80 m in length by B = 0.51 m in width, and LG panels were linearly restrained at the edges by hollow box steel members (60 mm × 100 mm in section, 5 mm in thickness), specifically properly arranged to create a grid for LG modules. To note, the original pedestrian system object of experiments was retrofitted, starting from Spring 2021, and replaced by newly designed LG components with similar geometrical and mechanical properties (Figure 7a).
The second and third examined LG samples are presently located in Aquileia (Udine) and are part of the suspension walkway investigated in [16,17]. Each module is characterized by dimensions of L = 2.65 m in length by B = 1.35 m in width (Figure 7b). To note, an additional sacrificial, protective layer of annealed (AN) glass (6 mm in thickness) was positioned on the top surface of LG panels (Table 2). As for the SM#1–LGU system, the case-study examples in Aquileia were subjected to in-field testing ≈ 15 years apart from its original construction. At the time of the experiments, moreover, the difference of two selected modular systems was represented by the presence of intact glass layers (SM#2–LGU), or by the presence of (accidental) partial fracture for one of the constituent glass layers in the resisting LG section (SM#3–LGF, which was replaced after testing, see Figure 7c).
In terms of the preliminary mechanical characterization of selected systems, some comparative properties are also summarized in Table 3 in terms of mass and slenderness. In particular, the mass ratio RM is given by:
R M = M s t r u c t u r e M o c c u p a n t
while the geometric slenderness is calculated as:
λ = L e f ρ ¯
on the base of the effective bending span Lef (from Table 3) and on the radius of gyration given by:
ρ ¯ = J A
To note, a single occupant (adult volunteer, M = 80 kg) was invited to take part in the experimental measurements on the three different in-service LG slabs. In addition, the bonding contribution of PVB foils was preliminary disregarded.
It is worth noting in Table 2 that RM from Equation (4) has major effects on the assessment of human-structure interaction phenomena. Compared to other constructional typologies, for LG pedestrian solutions, it is typically small [17,19]. A mutual interaction of several aspects should be necessarily taken into account. Such a condition may, in fact, negatively affect—compared to other structural typologies—both the mechanical performance in terms of stress peaks and deflections under ordinary loads, and the corresponding comfort level of pedestrian under human-induced vibrations.
As shown in Table 3, the geometric slenderness from Equation (5) is also strongly affected by typical geometrical features of LG pedestrian systems and differs from other constructional typologies.

3.2. Finite Element Model Updating

The numerical analysis of selected slabs was carried out in ABAQUS [50]. Element features, mesh size, and features and material properties were calibrated to optimize the computational efficiency of simulations, as well as by taking into account past modelling efforts for similar structural systems [16,19]. Linear elastic material laws were taken into account for glass and PVB (Table 1), as well as metal sub-components [24]. The geometrical description of constituent components, as in Figure 8, was based also on visual inspections and technical drawings.
Careful attention in modelling should be paid, case by case, especially for those structural and non-structural details that have a primary role in glass applications. As a basic step towards the frequency assessment with the in-field experimental output, a linear modal frequency analysis procedure was taken into account. Such a modelling choice was adopted to capture the vibration frequency and (especially in case of damage) fit the unknown material properties in terms of degradation features and damage severity, towards the experimentally derived vibration frequencies for the selected samples. For general applications on LG systems, most of the attention should be given to the reproduction of geometrical and mechanical feature of real restraints, given that they have a primary role in vibration and bending performances. To this aim, a preliminary visual inspection for the in-service system object of study could also facilitate detecting possible anomalies or even initial damage (if any).
For the present practical application, Figure 8 shows an example of assembled modules, with evidence of vertical (out-of-plane) displacement contour plots of fundamental modal shape of their first vibration mode.

4. Diagnostic Investigation and Assessment of Experimental Performance Indicators

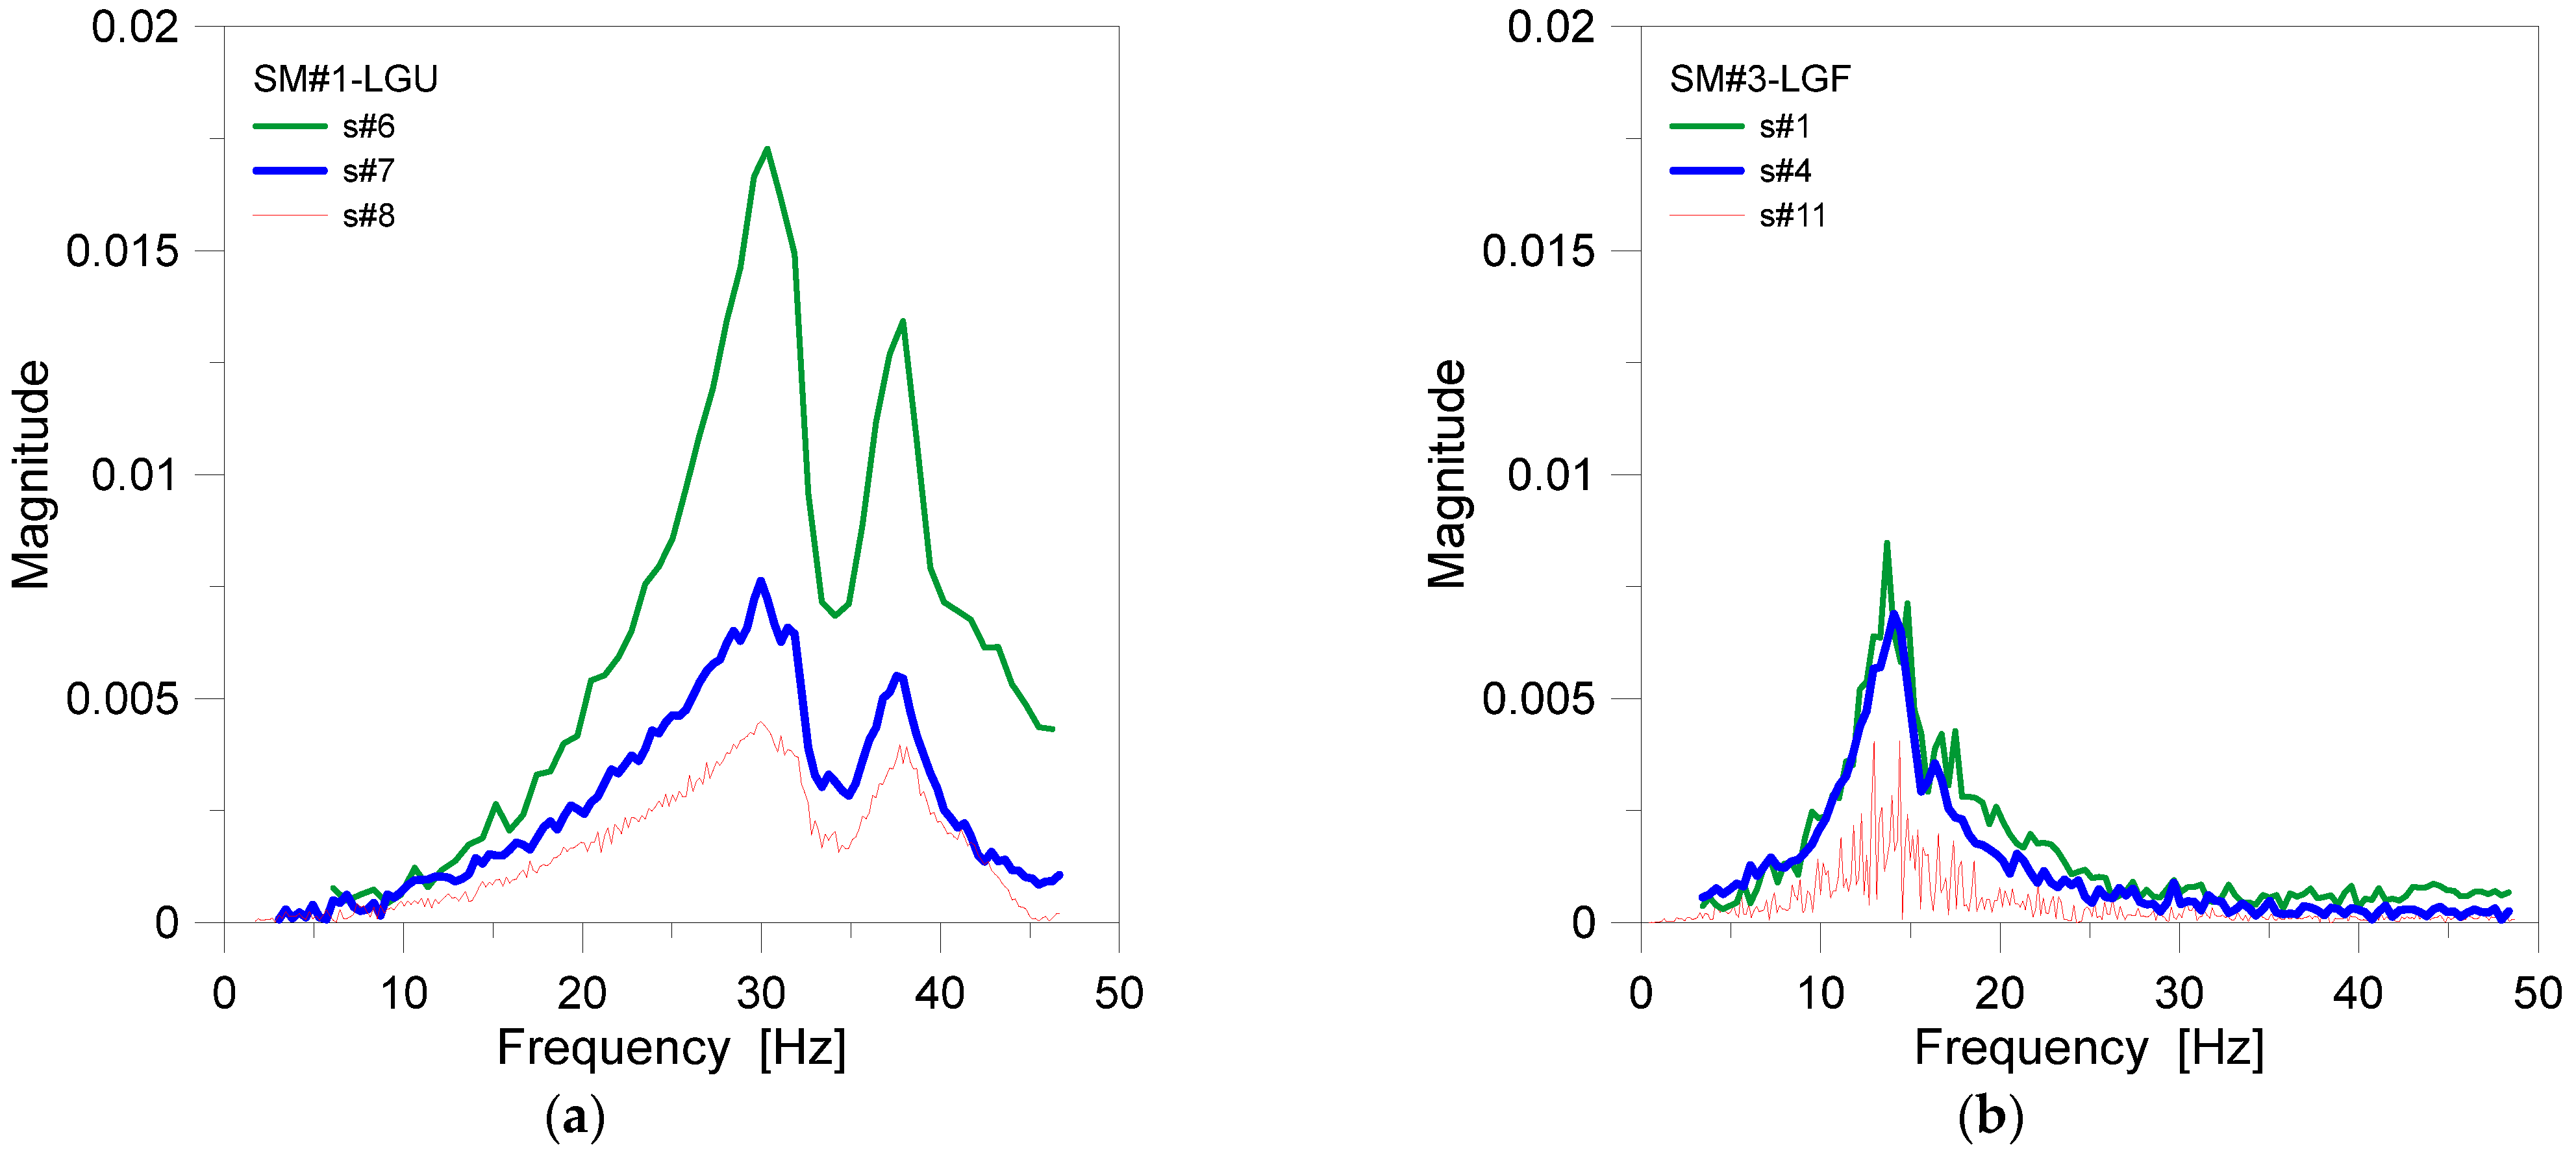
4.1. Vibration Frequency

As previously discussed, the basic assumption of the present application is that for the experiments herein reported, a single triaxial MEMS accelerometer like in [19] was used for all the examined systems. Output-only test data were collected under the effects of normal walks or in-place jumps.
The detailed experimental methods are also discussed in [19]. The diagnostic investigation was based on the experimental analysis from different test repetitions on the selected modules, with a total of nine test trials for the SM#1–LGU system, 14 repetitions for the SM#2–LGU module, and 18 for the SM#3–LGF system. The typical experimental records were collected, for all the case-study systems, in terms of vertical acceleration time histories similar to Figure 9, with the sensor placed in the centre of each slab. To note, case by case, the experimental setup and the detailing of sensor setup should be preliminary addressed to capture relevant data.
Based on experimental evidence like in Figure 9, the results in Figure 10 show selected examples of corresponding FFT signals. At a preliminary stage, a major difference in the vibration response of examined modules can be easily perceived, for example. Compared to existing design standards to prevent severe vibration issues in pedestrian systems, it is possible to see that the measured FFT peaks are associated to vibration frequencies that are significantly higher than the recommended minimum value of 5 Hz [25,34]. Moreover, typical LGs are characterized by intrinsic features that assign them a particular dynamic behaviour compared to other systems [16,17].
For the presently examined LG systems, the fundamental frequency was experimentally quantified in 30 Hz (±0.39) for the SM#1–LGU system. For the SM#2–LGU and SM#3–LGF slabs with similar geometrical and mechanical properties, but different damage severity, it resulted in 15.05 Hz (±0.2) and 13.8 Hz (±0.21), thus up to −8.3% vibration frequency decrease due to glass fracture [19]. Often, no interventions and verifications are required for traditional slabs and floors with a fundamental frequency higher than 5–8 Hz (ISO 10137:2007 [25]). On the other side, it was also shown in [34] that existing reference indicators and comfort assessment procedures cannot be directly applied to LG systems.
In this regard, the availability of intermittent in-field monitoring records for in-service LG structures would support the characterization of their vibration frequency (from “Time 0” of original installation apart) and also facilitate any kind of diagnostic analysis and maintenance plan.

4.2. Damping

FFT signals, as in Figure 11, can be also addressed in terms of diagnostic parameters. In the present study, data were further analysed in the post-processing stage because of the utmost importance for simplified damping estimates [51]. Even under uncertainty, among others, the half-power bandwidth method is the most representative and widely used approach for damping estimation due to its simplicity in implementation. The analysis of available experimental signals in the frequency domain gives, in fact:
ξ = 1 2 Q
with:
Q = f m a x f m , 2 f m , 1
where fmax is the resonant frequency and fm,1, fm,2 are the frequencies at the left-hand and right-hand sides of fmax, respectively. To note, for the presently examined in-service systems, the average damping was quantified in 6.78% for the SM#1–LGU module, 7.25% for SM#2–LGU, and 8.95% for SM#3–LGF.
The above values, whilst not fully exhaustive for diagnostic purposes, still offer the opportunity to capture relevant modifications in time (i.e., under repeated monitoring steps), as well as towards LG systems of literature (if any). According to past literature findings, damping for monolithic glass in the uncracked stage is, in fact, generally very small and can be typically expected in around 1.5% [41], but for LG sections, it can be relatively higher, and there is experimental evidence of damping terms up to 5–6% [52,53] or even higher [54]. For the specific analysis of SM#2–LGU and SM#3–LGF systems, as in the present study, additional damping contributions can be justified from the role of partially soft/flexible restraints, which are interposed to the metal substructure [41]. Moreover, the most important outcome is in the variation of SM#2–LGU-to-SM#3–LGF estimates, which was calculated in a +23.5% for the SM#3–LGF module. In this sense, damping evidence confirms higher contributions for the SM#3–LGF system affected by glass fracture and suggests the definition of possible threshold limits in support of monitoring and diagnostic analyses (especially when damping evidences are integrated to other performance indicators).

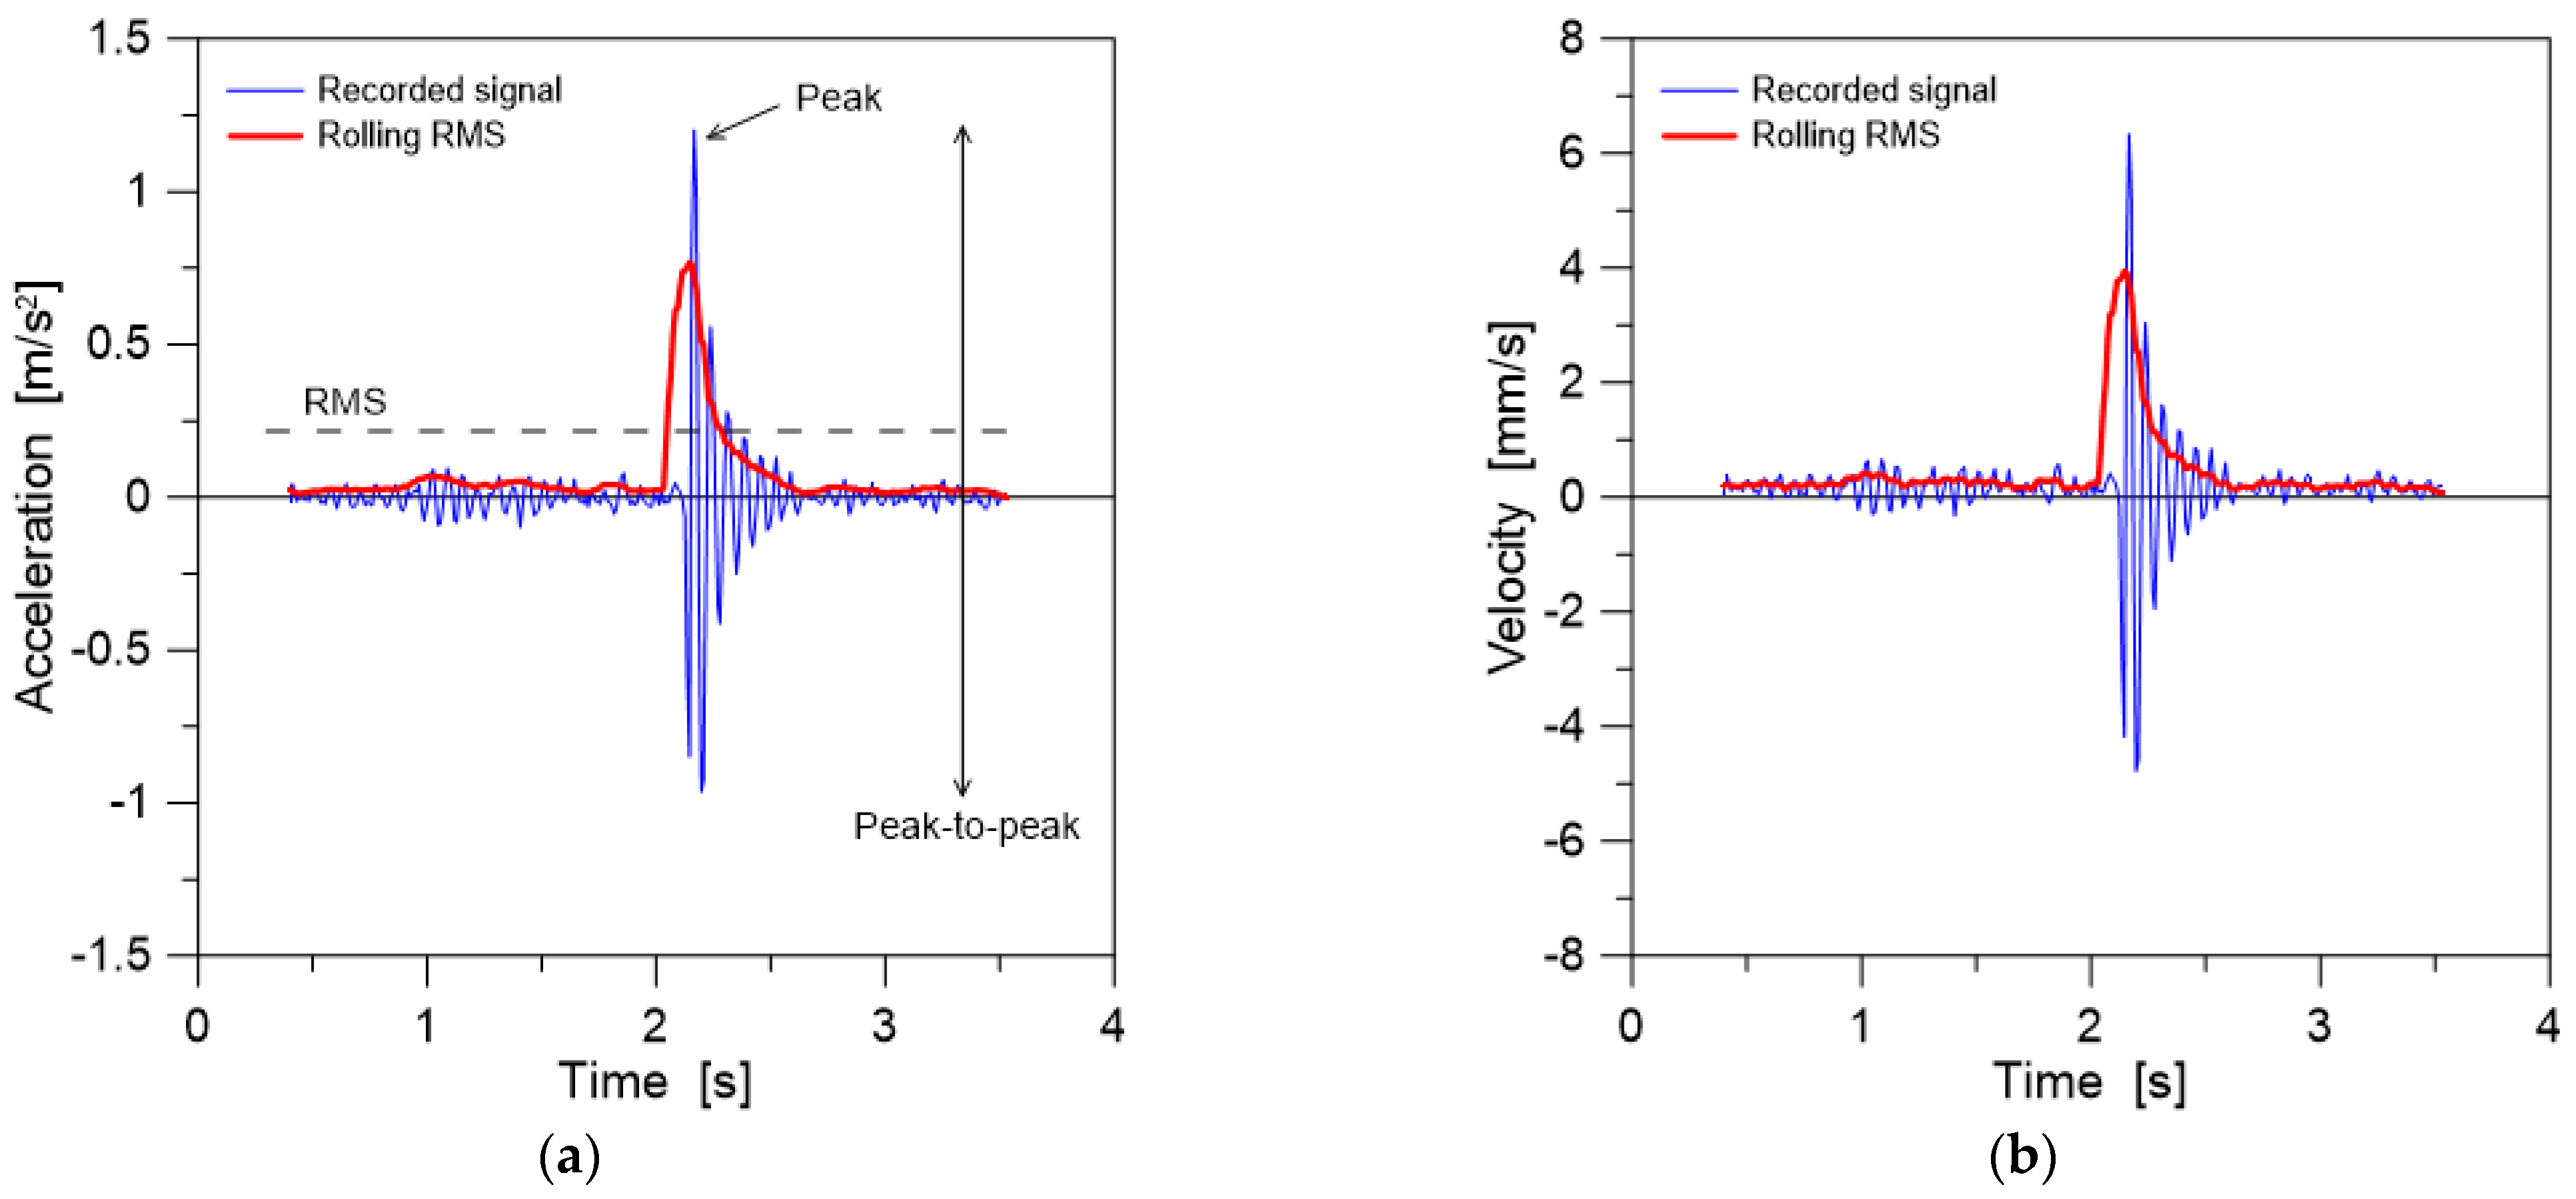
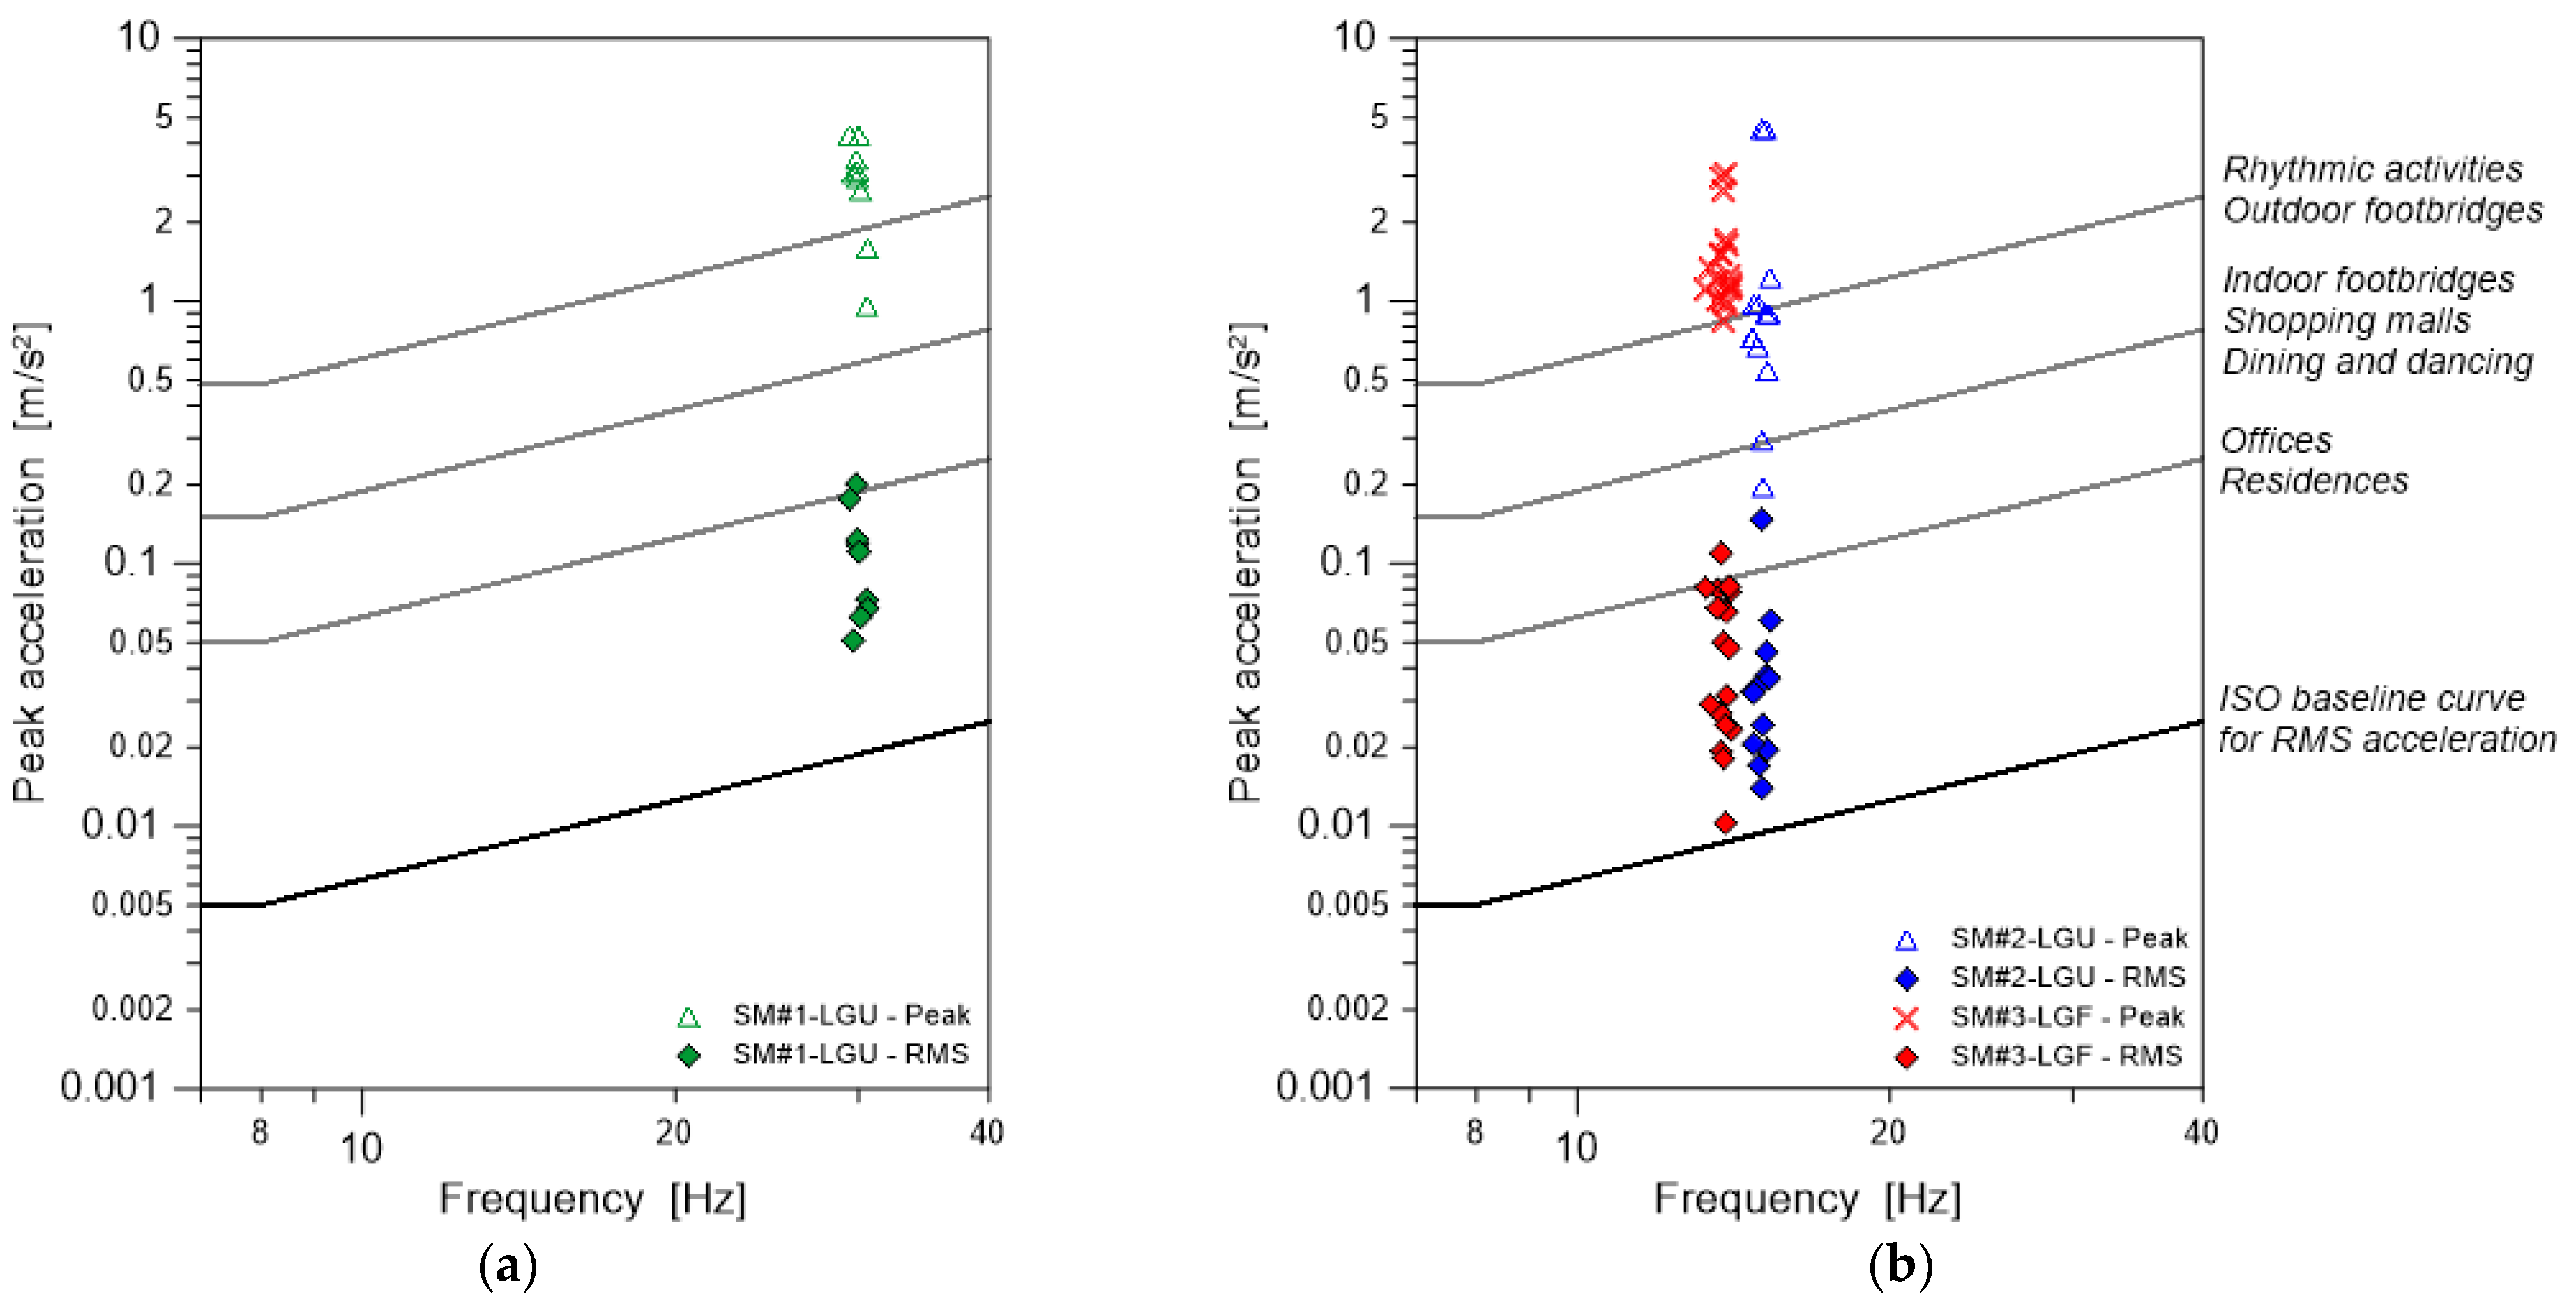
4.3. Vibration Assessment Based on Existing Conventional Approaches

An additional quantitative assessment of structural behaviour and capacity for a given in-service systems can be extrapolated from a comparative analysis and evolution of classical vibration parameters under ordinary loads. The vibration assessment of herein examined LG systems was further carried out in terms of structural safety and comfort, maximum vertical acceleration, peak-to-peak acceleration, RMS acceleration (Equation (9)), or rolling RMS acceleration, respectively (Equation (10)):
a R M S = 1 T 0 T a t 2 d t
a R M S t = 0 n a t 2 n
with T (in seconds) the total duration of each signal and n the number of recorded data in a time interval of 0.5 s.
Finally, the rolling RMS velocity was also taken into account, since it is traditionally representative of robust feedback for floor vibrations:
v R M S t = 0 n v t 2 n
An example can be seen in Figure 11, as obtained from a single footfall of the involved volunteer (SM#3–LGF). To note, multiple design standards are available in support of the vibration serviceability assessment of pedestrian systems, but no specific rules and recommendations are available for glass structures. In the present application, for example, the reference limits were derived from ISO 10137:2007 [25] and compared to available experimental indicators based on post-processed signals.
As far as the acceleration values are considered, typical results take the form as in Figure 12, where data are grouped for SM#1–LGU and SM#2–LGU or SM#3–LGF systems, respectively. Regardless of the constructional details, and even possible damage, it is possible to see that the dynamic response of the three different LG systems under random normal walks is associated to absolute vertical acceleration peaks, which exceed the limit values for “indoor footbridges”. The mean peak was, in fact, measured in 2.921 m/s2 for the SM#1–LGU system, 1.315 m/s2 for SM#2–LGU, and 1.512 m/s2 for SM#3–LGF.
The measured RMS acceleration values from Equation (10) are also compared in Figure 12 for quantitative comparison with the “ISO baseline curve”. Based on [25], the limit RMS acceleration is extrapolated on the base of the corresponding input vibration frequency of the system object of study, as well as its destination of use.
The typical recommended values of threshold baseline Multiplying Factors (MF) are summarized in Table 4 from [25]. Starting from the value of aISO,baseline = 0.005 m/s2 for vibration frequencies up to 8 Hz, Table 3 indicates that the top limit acceleration:
a R M S = M F × a I S O , b a s e l i n e
should not be exceeded, where:
a I S O , b a s e l i n e = a I S O , b a s e l i n e f 1
For the present application example, the aRMS values were first calculated based on experimental signals and Equation (9). The aISO,baseline amplitude was then expressed from Equation (13), based on available experimental frequencies. The “Current” MF was hence quantified as:
M F = a R M S a I S O , b a s e l i n e
As shown in Table 4, the experimental MF values for SM#1–LGU and SM#2–LGU systems are mostly comparable (around six), but, indeed, they exceed the recommended thresholds from [25], for all floor types and destinations. To note, in particular, the highest MF value was calculated especially for the SM#3–LGF system with partial glass fracture and hence higher sensitivity to normal walks (MF = 8.50, +49%). The comparison towards the uncracked SM#2–LGU system (with identical size and geometrical features but intact glass) is a further confirmation of severe MF variation, which could be possibly considered as an additional meaningful parameter for damage detection.
In terms of RMS velocity from Equation (11), based on [55,56], the attention could be focused on limit values and ranges, which are proposed to detect critical serviceability configurations, as a function of the dynamic response of floors and on their destination of use.
For the present application, for example, the average peak of rolling RMS velocity was calculated in 7.11 mm/s for the SM#1–LGU system, 3.61 mm/s for the SM#2–LGU system, and 4.44 mm/s for the SM#3–LGF system. To note, from [55,56], the examined rolling RMS velocity values should be accounted as Class “E” of comfort and may, consequently, result in preferably suitable vibration performances for “industrial or sport” only. The present experimental evidence is, in fact, out of range for the recommended limits in case of other common destinations of use, especially the “residential or office” class.
However, such a comparison and quantitative classification gives a first suggestion for possible monitoring and mitigation interventions only, rather than efficiently supporting a concise diagnostic analysis.

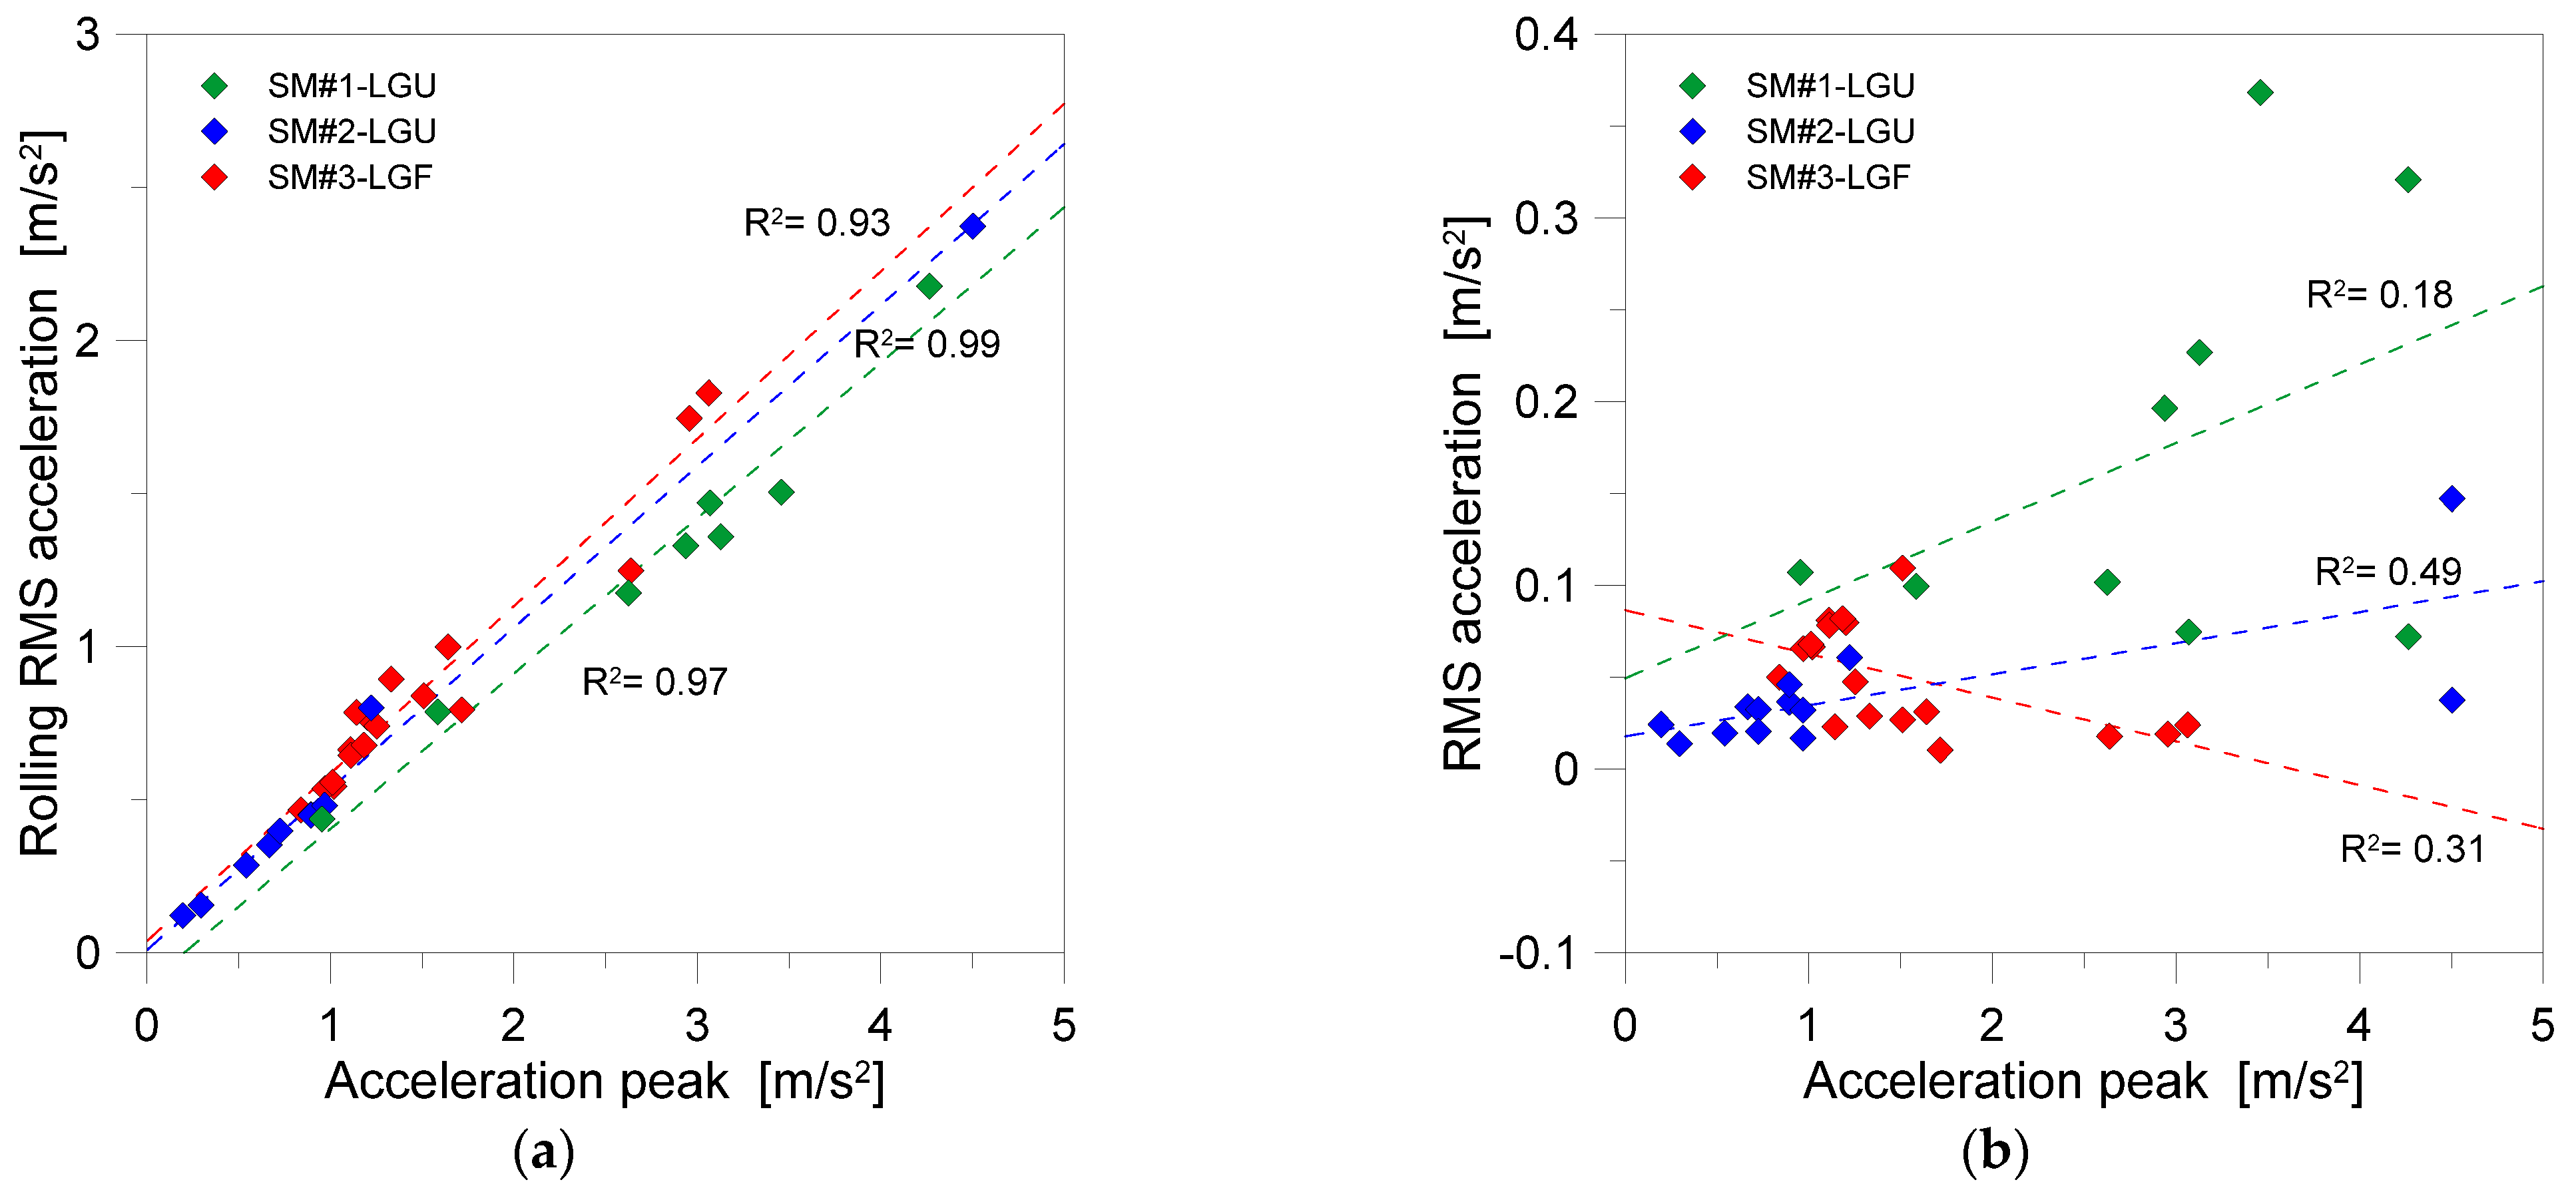
4.4. Direct Structural Assessment Based on In-Field Performance Indicators

OMA techniques are particularly simple to apply in systems under normal operational conditions, so the critical stage is represented by collection of a sufficient number of signals for data interpretation and diagnostic analysis.
In Figure 13a, the vertical acceleration peak is shown as a function of the rolling RMS value, where each dot corresponds to a test configuration. A rather linear correlation for all experiments can also generally be noted, as suggested by the reported R-square correlation coefficient. Moreover, the SM#3–LGF system with glass fracture has the lowest correlation of experimental results (R-square = 0.93), which is relatively low compared to intact systems. While such a comparison should be extended to multiple slab units with different damage scenarios, such a correlation could be a parameter of practical feedback for diagnostic purposes. In addition, a correlation coefficient tending to 1 could represent an optimum for a safety check and integrity assessment. At this stage, moreover, the minimum number of experimental repetitions and configurations required for “robust” feedback is still uncertain to be generalized.
In Figure 13b, the RMS acceleration value is indeed shown as a function of the vertical acceleration peak. Differing from Figure 13a, a major scatter from the linear regression method can be noticed for the SM#3–LGF sample affected by glass fracture, which has a relatively low R-square correlation coefficient but also a substantially different trend of experimental dots compared to the intact SM#1–LGU and SM#2–LGU samples. The potential of such a kind of comparative analysis should be elaborated further, including multiple LG systems and testing configurations. To note, the trend of vibration frequency with acceleration peak can also reveal major structural modifications and damage severity, as well as particular discomfort under ordinary loads, as it was for the example discussed in [16,17].

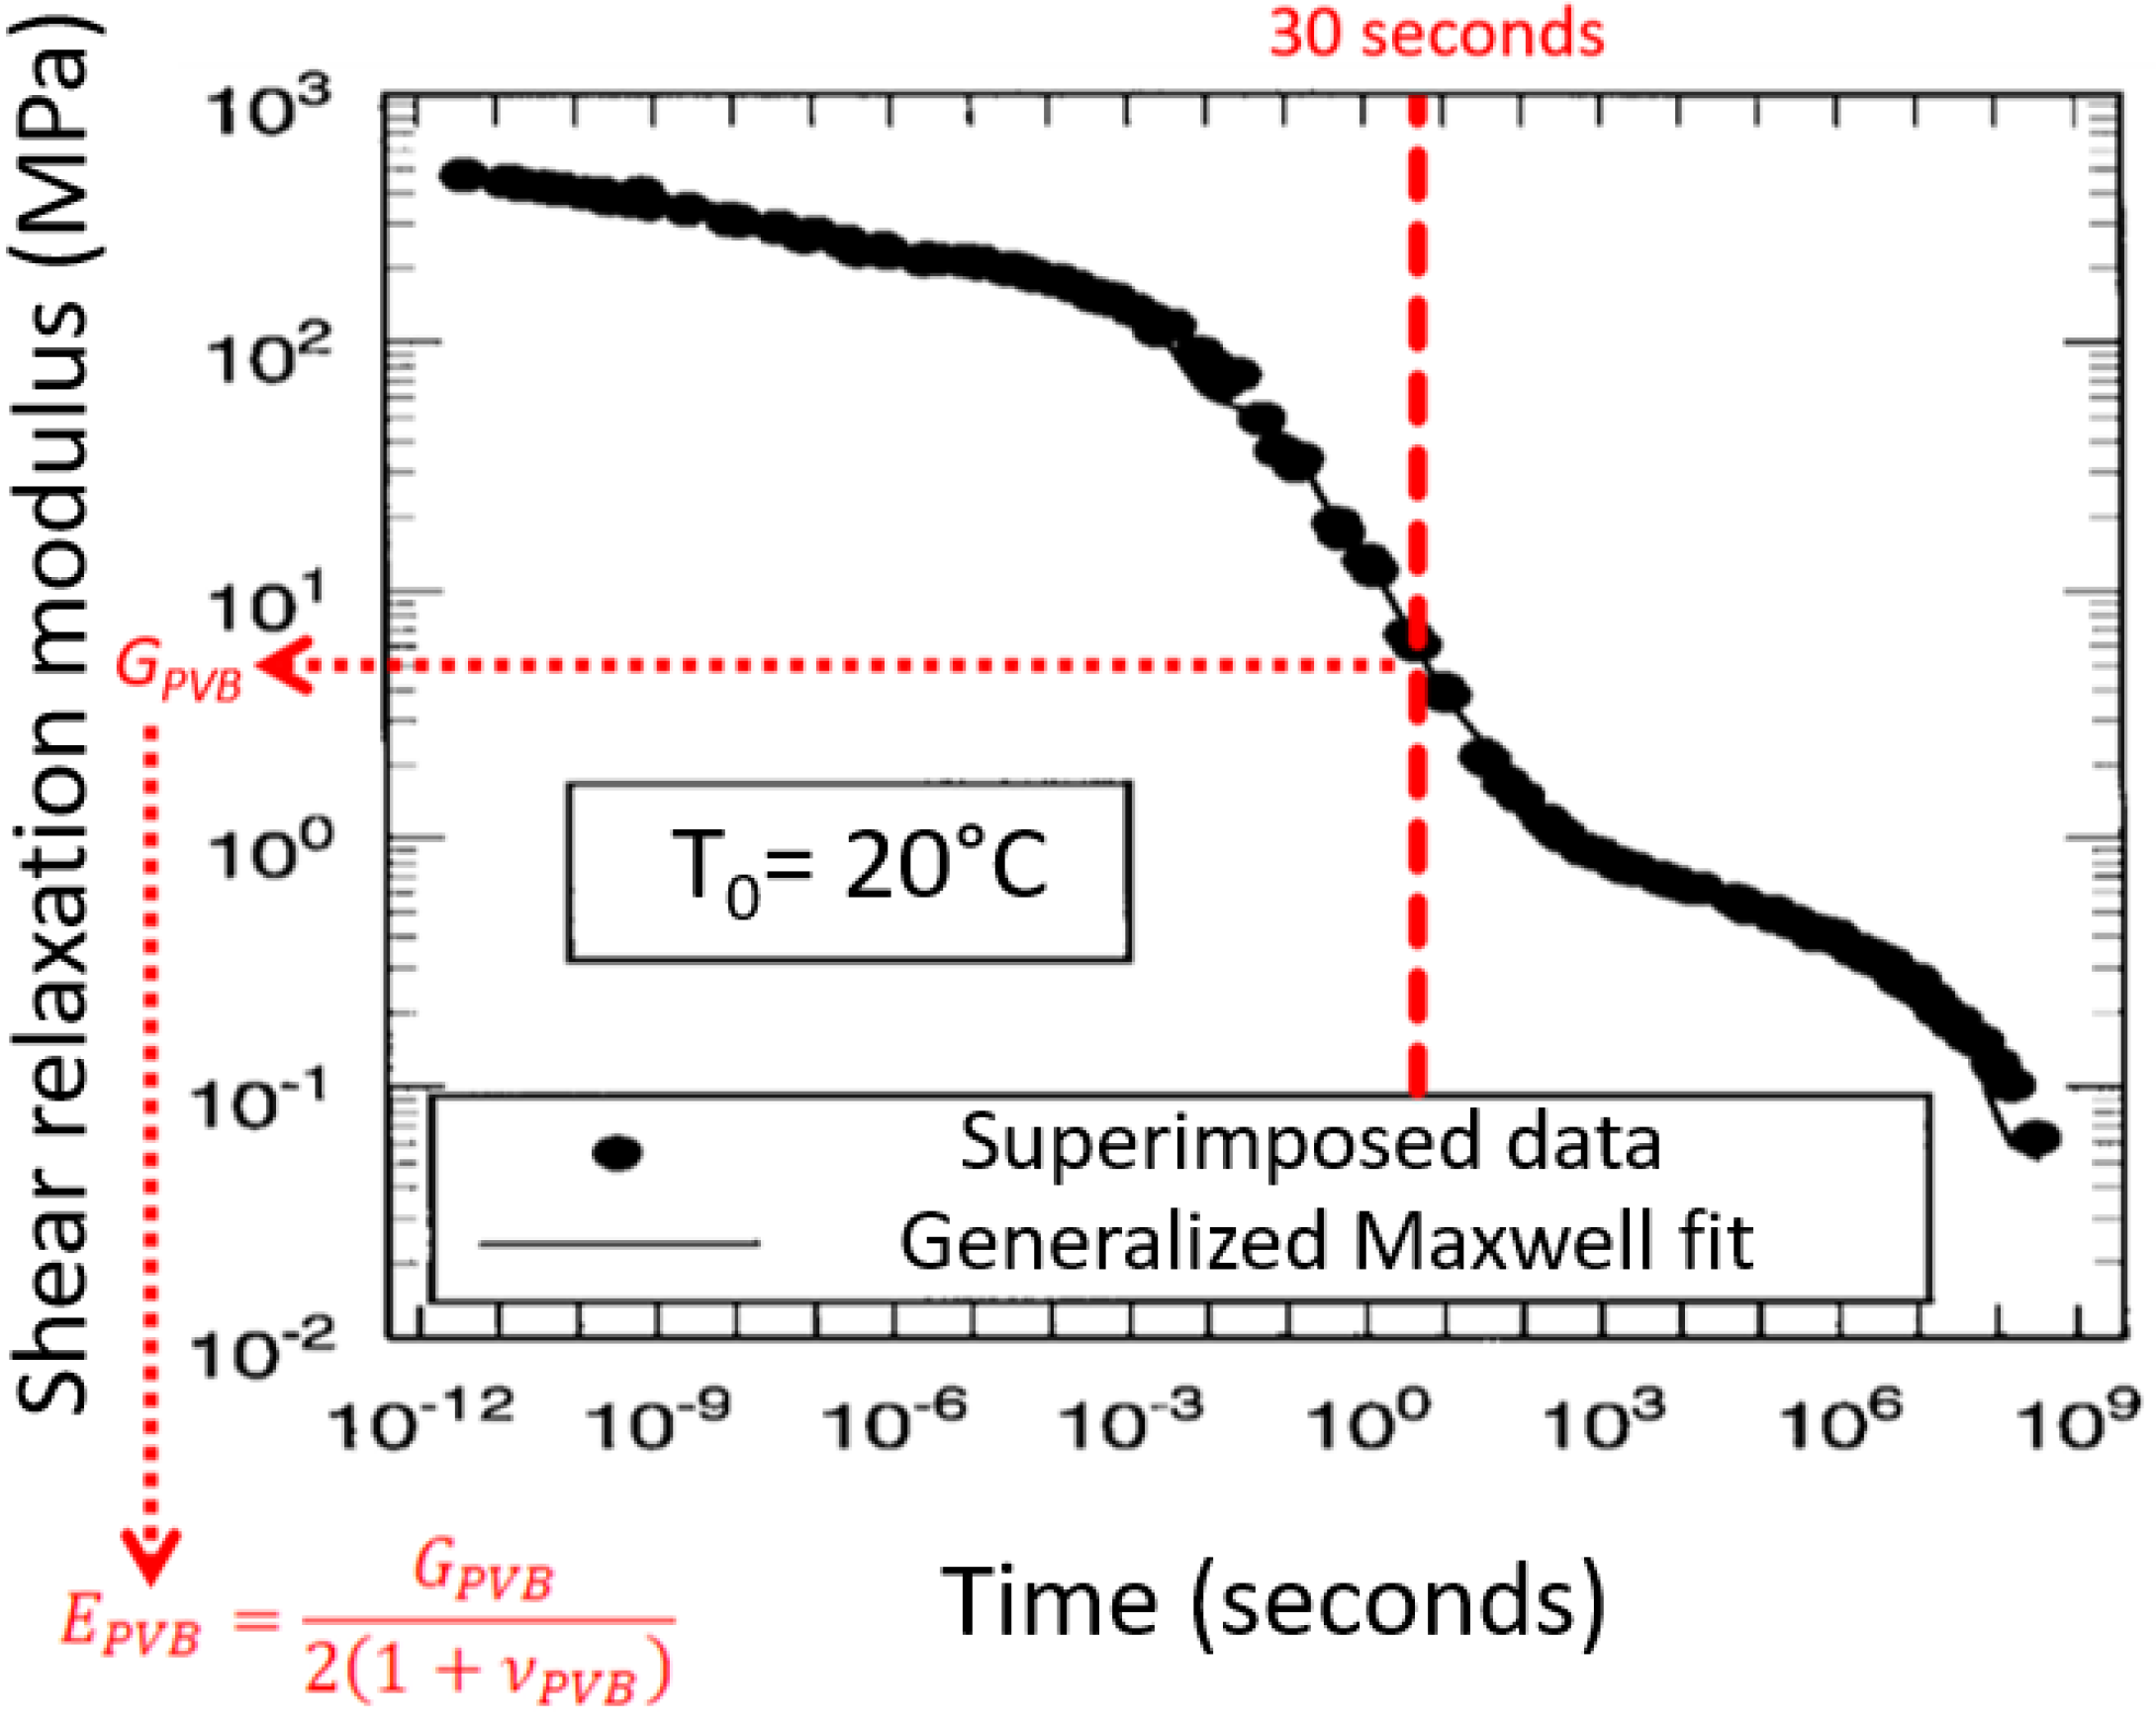
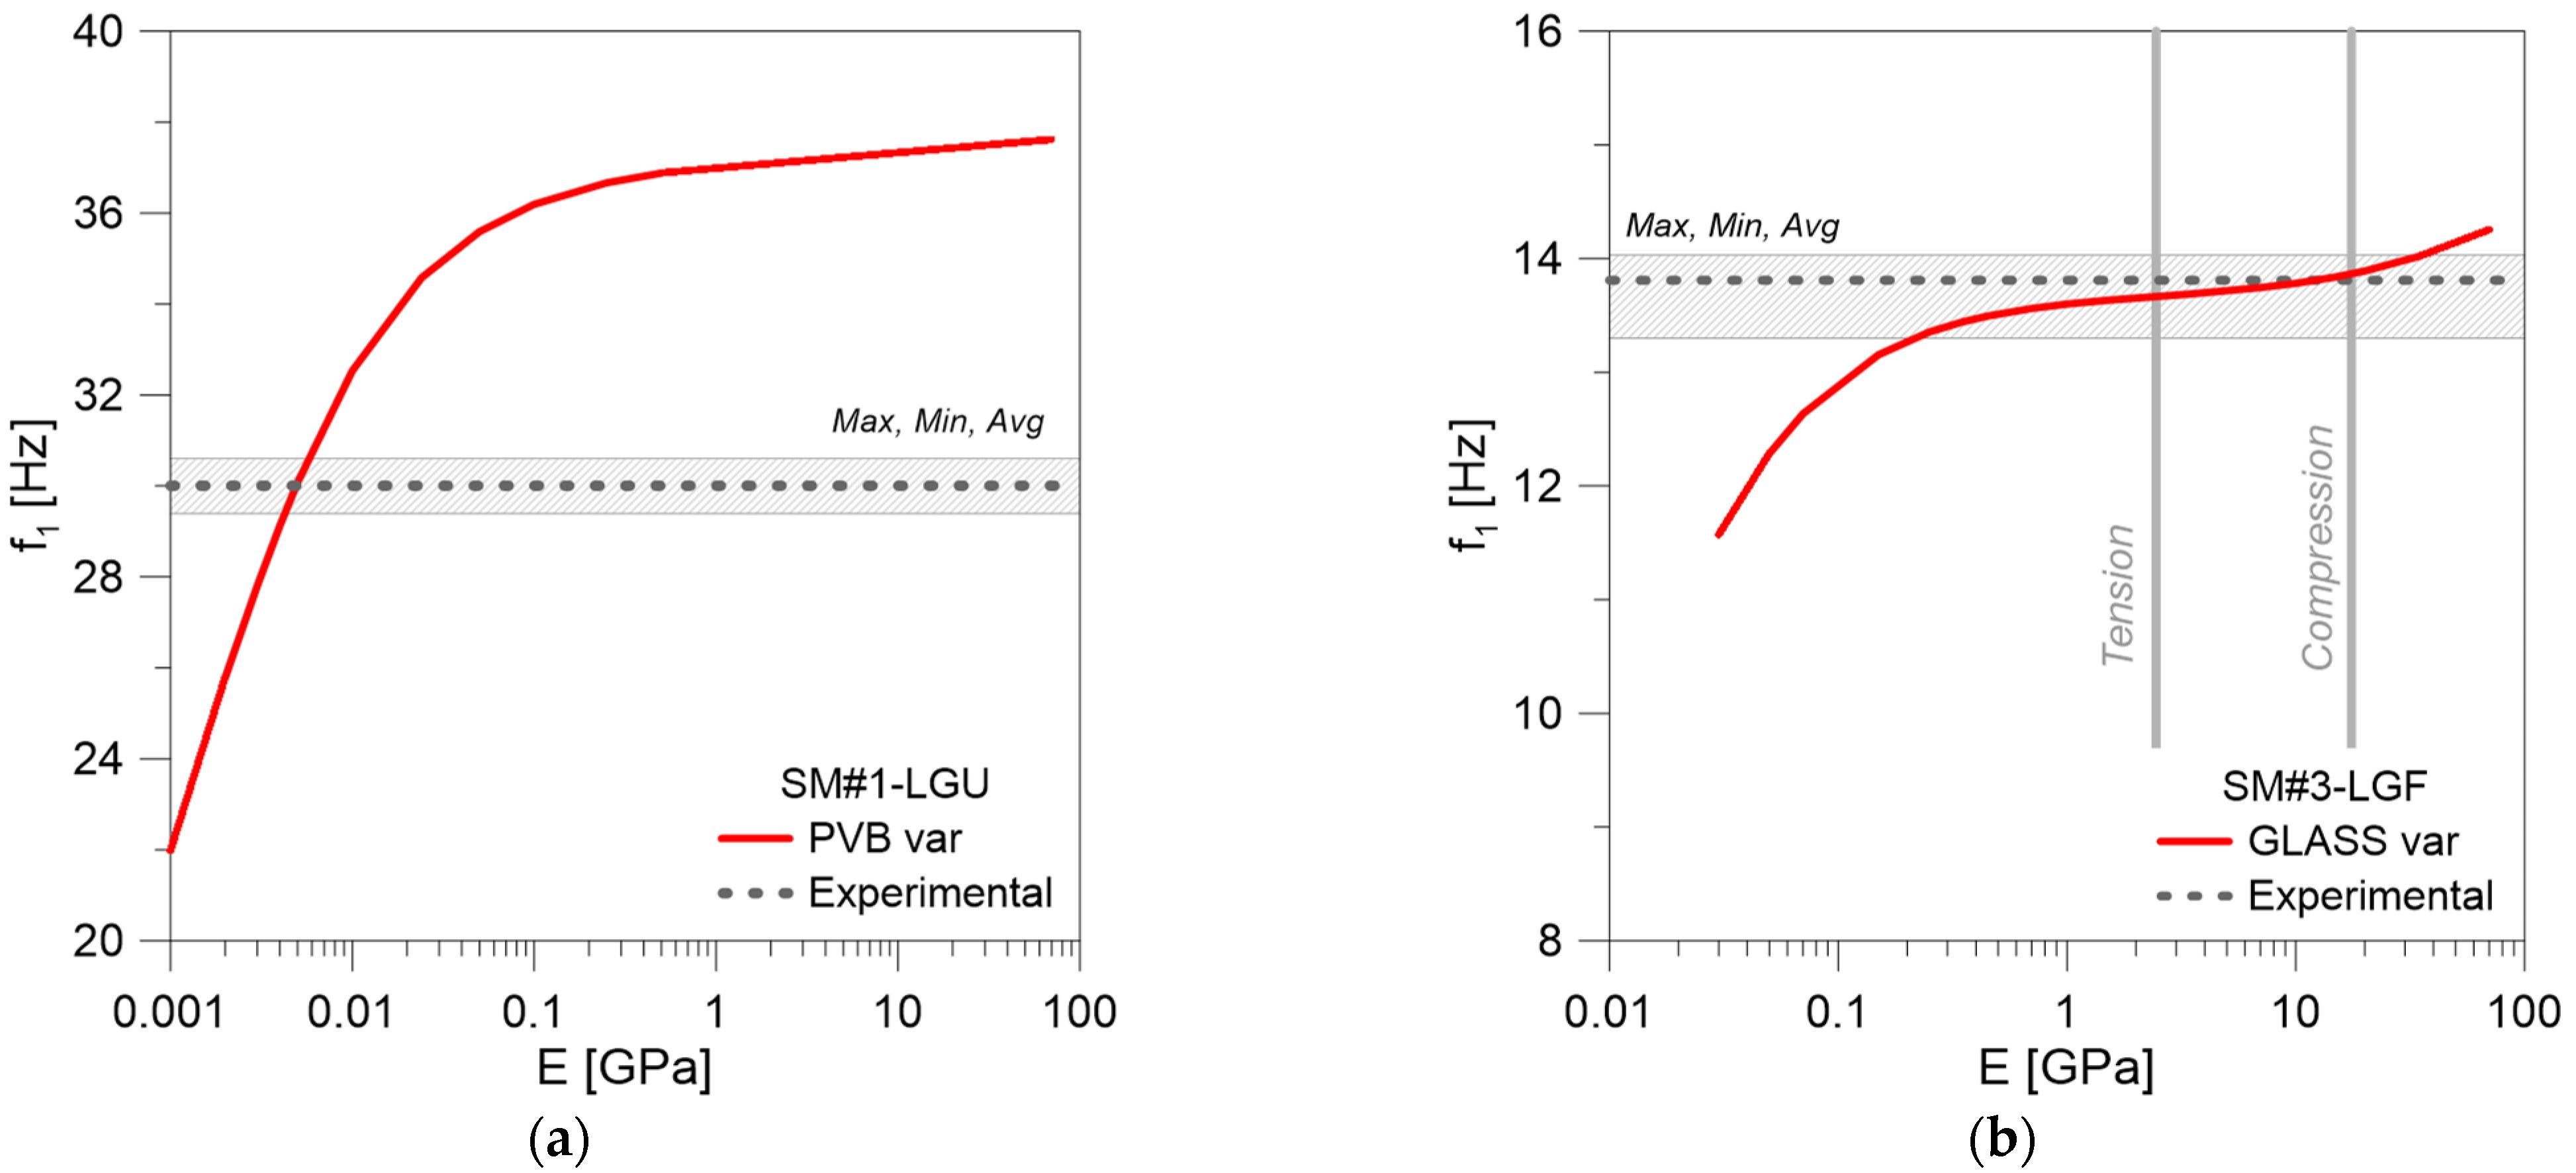
4.5. Material Characterization Based on In-Field Experiments and Finite Element Updating

Apart from in-field experimental measures and derived performance indicators on the side of structural performance diagnostics, a more refined and advanced protocol for safety assessment (as in Figure 3) necessarily requires the use of FE numerical models able to capture the geometrical and mechanical features of the real systems object of study and thus integrate and extend experimental evidence by model updating.
For example, based on FE systems like in Figure 8, one could pose the attention on the inverse characterization of the equivalent shear stiffness for the bonding PVB foils, or, even (in case of glass fracture) on the calibration of an equivalent, reduced Ecrack modulus for the fractured glass layer (as it is for the SM#3–LGF system). Typical comparative results are proposed in Figure 14. To note, the other input material properties were kept fixed in E = 70 GPa for intact glass, ν = 0.23 and ρ = 2500 kg/m3, with νPVB = 0.49 and ρPVB = 1000 kg/m3 for PVB foils (Table 1).
Figure 14a shows the effect of PVB stiffness on the fundamental frequency of the SM#1–LGU module. Compared to the average experimental vibration frequency, it can be seen that the best match is found for EPVB modulus for PVB foils in the order of ≈4–5 MPa. Interestingly, the so-calculated equivalent modulus for PVB is in the same order of magnitude of the study reported in [16,19].
In Figure 14b, curve-fitting based on model updating is proposed for the fractured SM#3–LGF system in which the degradation of PVB foils acts in combination with glass fracture. The parametric FE analysis shows that the best match of experimentally derived frequency is in the order of Ecrack ≈ 15 GPa for the fractured glass layer, and this finding is in close correlation with the compressive fractured glass modulus calibrated in [18]. Further support from FE model updating could derive also from analysis of local effects in vibrational and dynamic terms, such as, for example, deriving from special fixing systems of typical use in LG applications [34].

5. Residual Structural Capacity Assessment

5.1. Quantification of Mechanical Degradation and Load-Bearing Capacity Loss

The final sub-stage of Step 4 in Figure 3 is of utmost importance for safety assessment as it is associated to the final residual capacity quantification. On the other side, such a procedural stage necessarily requires a robust engineering characterization of the LG system object of study (based on in-field testing) as well as an accurate mechanical characterization (based on integration from FE models like in Figure 7). In the present application example, the analysis of stress peaks and deflections in glass components was in fact carried out based on previous experimental–numerical evidence.
More in detail, the FE models, such as in Figure 7, were adapted to quasi-static, non-linear incremental mechanical analysis where the input material properties were kept fix as in the preliminary frequency analysis (and Table 1), but the attention was focused on the quantification of structural behaviours under ordinary design actions. The selected LG pedestrian systems were, in fact, investigated under the effects of self-weight and a distributed accidental vertical load (Qk = 4 kN/m2 its characteristic value). Furthermore, the analysis was carried out for the pedestrian modules as in the “Current” situation and at “Time 0”, that is, with a short-term elastic modulus for PVB (i.e., Figure 5) and ideally intact glass layers.
The so-collected numerical results are summarized in Table 5, where the percentages scatter between the initial design stage, “Time 0”, and the present situation; “Current” structural performances are also reported. In the analysis of performance indicators, moreover, maximum stress peaks are calculated:
  • At the mid-span of short edges in free bending for the SM#1–LGU system.
  • In the region of mechanical pint supports for SM#2–LGU and SM#3–LGF systems.
Table 5. Structural performance analysis for the examined modular units (with single occupant and M = 80 kg), with evidence of “Time 0” and “Current” behaviours.
Vibration Frequency
[Hz]
ULS Stress
[MPa]
SLS Deflection
[mm]
SampleTime 0CurrentΔ [%]Time 0CurrentΔ [%]Time 0CurrentΔ [%]
SM#1–LGU34.630−13.34.315.27+22.21.161.76+51.7
SM#2–LGU21.215.05−28.317.28 (point-fixing)
6.29 (centre)
20.01
7.69
+15.8
+18.2
4.116.10+48.4
SM#3–LGF21.213.8−34.917.28 (point-fixing)
6.29 (centre)
26.55
4.29
+53.64
−31.8
4.116.28+52.8
From Table 5, some useful parameters can be easily derived to quantify the current capacity due to both long-term effects and unfavourable operational conditions. In terms of vibration frequency of the occupied modules, for example, it can be seen that the SM#1–LGU system with minimum geometric slenderness and relatively short bending span is less affected by mechanical degradation of PVB foils compared to the others. In contrary, the SM#3–LGF system affected by the additional fracture of glass shows the maximum frequency decrease.
As far as the principal ULS stress peaks in glass that are taken into account, Table 5 shows a rather balanced variation for SM#1–LGU and SM#2–LGU solutions. Conversely, the partial glass fracture in SM#3–LGF system gives clear evidence of more pronounced stiffness degradation as a direct result of the fractured glass layer in compression. The analysis of SLS deflections, finally, shows comparable modifications for the three examined systems. In this sense, another important aspect to note is that the analysis of deflections only may not be sufficiently exhaustive to capture the actual damage severity for a given LG system.
More robust feedback could be indeed derived from the frequency analysis and from the stress peak analysis in glass, by comparing the single experimental output data with recommended limit values of the literature (i.e., critical frequency range, etc.), or even by comparison of stress peaks in glass with the nominal material strength. Damping predictions from in-field experiments, finally, could be rather simple to measure and compare, as well as meaningful for damage quantification, but necessarily needing multiple comparative data and multiple similar systems for efficient and robust comparative analysis.

5.2. Safety Check against Ordinary Mechanical Loads

As far as the design parameters from [24], other design standards are taken into account. For example, the potential and efficiency of parametric results as in Table 5 can be further exploited in terms of residual capacity towards specific design conditions and limitations by standards. For newly designed LG systems, technical recommendations are, in fact, available to preserve appropriate safety levels and functionality under normal service conditions.
For LG plates with two linearly supported edges, as for the examined modules, it is recommended in [24] at the SLS deflection check that the limit value ulim should not be exceeded, where:
u l i m = m i n 50   mm L m i n 100
with Lmin the minimum edge size (ulim = 5.1 mm for SM#1–LGU and ulim = 13.5 mm for SM#2–LGU and SM#3–LGF).
Regarding the maximum ULS stress values for the verification in glass layers, the comparison is carried out towards the design strength defined as in [24], where it is assumed that:
f g ; d = f g ; d , b + f g ; d , p = k m o d k e d k s f λ g A λ g l f g ; k R M γ M + k e d k v f b : k f g ; k R M ; v γ M ; v
with fg;d,p > 0 for pre-stressed glass and:
k m o d = 0.585 · t L 1 / 16
while the other coefficients and safety factors are defined in [24] to account for a multitude of production and loading/boundary condition features. The resistance verification notoriously requires that the stress effects of a given design action do not exceed the capacity of the system, that is:
σ m a x f g ; d
Further, for safety purposes, the ULS stress analysis is a primary verification check. For the present analysis, the application of Equation (18) to the examined in-service systems in ULS design conditions, with kmod = 0.78 for temporary transient of pedestrians, resulted in strength values in the order of ≈60 MPa at the edges and ≈74 MPa in the centre of LG panels.
The so-derived ULS and SLS performance values are reported in Table 6 for the case-study applications in the form of maximum stress-to-strength ratio (ULS, from Equation (18)) and maximum deformation-to-deflection limit ratio (SLS, from Equation (15)).
From a practical point of view, such an assessment reveals the “real” capacity loss of a given LG system thanks to accurate mechanical calibration and to multiple performance indicators for “Time 0” and “Current” analyses. For the SM#2–LGU system, for example, the “Current” SLS deflection in Table 5 is associated to major safety and comfort, while a less-pronounced modification of performance can be seen in terms of ULS stress peaks. For the SM#3–LGF system with glass fracture, it is possible to see a rather unform safety check for ULS stress and SLS deformation values. It is worth noting that the “Current” stress condition, which is markedly increased in severity compared to SM#2–LGU system, further confirms the severity of the damage.
Overall, it is important to note in Table 6 that the examined systems were still “safe” for occupants, as determined through current performance indicators and technical recommendations of ordinary use and structural design of “new” glass members. However, at the same time, the explored systems also give evidence of marked loss of structural capacity in their “Current” situation, compared to “Time 0”. Such a procedure could be used to derive and quantify a robust and concise damage index of existing LG structural members and thus could represent an efficient performance indicator for monitoring purposes in early damage detection or early retrofit interventions, especially for those in-service LG systems where it is not possible to establish continuous or intermittent in-field experimental monitoring protocols.

6. Summary and Conclusions

A detailed engineering knowledge of current mechanical properties and residual load-bearing capacity levels for in-service laminated glass (LG) structures is of utmost importance in building management, especially for those structural systems that are characterized by direct interaction with occupants (i.e., pedestrian systems, balustrades, etc.). While, in certain conditions, damage can be visually detected (especially major glass cracks), there are several practical situations in which the in-service structure could be potentially unsafe for customers (due, for example, to unfavourable loading conditions or unfavourable ambient conditions facilitating the material degradation) without marked evidence of visual defects. In this sense, a harmonized protocol to (possibly rapidly) efficiently assess the “Current” structural safety level of a LG system compared to its “Time 0” performance, and thus to estimate the residual capacity is crucial for risk minimization and comfort/functionality optimization.
In this perspective paper, the attention was focused on a possible procedural protocol to generally apply to different LG pedestrian systems based on in-field experiments, analysis, and the assessment of experimental evidence and integrated model updating for structural estimates. To this aim, three different case-study systems belonging to two different (indoor) structures constructed in Italy were explored.
In terms of vibration assessment, the practical application study showed that:
  • The estimation of the fundamental vibration frequency is a first relevant but not exhaustive step for quantitative characterization of safety levels in existing glass structures. LG pedestrian systems are often characterized by relatively high fundamental frequency but often have relatively small mass compared to occupants.
  • Fast, intermittent in-field experimental measures based on OMA techniques could allow for the collection of a set of meaningful comparative data for an efficient check of mechanical features and modifications in a given existing structure. However, the experimental testing conditions should be possibly planned to reproduce the “normal” service configurations for the examined systems.
  • For the proposed procedural steps and the methodology application to three different LG systems, the in-field testing highlighted the availability of multiple performance indicators, but also the need of robust engineering knowledge for their interpretation.
  • Similarly, the availability of in-field experimental measures proved to be meaningful, especially when combined to refined Finite Element numerical models able to indirectly quantify the long-term/damage effects, in terms of “Current” state-of-art condition and capacity in comparison to “Time 0” design performances.
On the other side, it was also shown that:
  • Most of the existing conventional methods for vibration serviceability purposes are not specifically adaptable to LG systems.
  • Damping estimates can represent an experimental output of simple calculation but are still often affected by a multitude of various influencing parameters and possibly characterized by a high sensitivity under test repetitions.
In terms of structural checks of “Current” performances, finally, it was shown that:
  • Due to intrinsic material properties and structural design assumptions, long-term phenomena and material degradation can induce severe modifications compared to “Time 0” conditions. After installation, it is hence important to monitor the evolution of basic parameters (and thus the residual capacity) over time.
  • Overall, such a kind of intermittent diagnostic approach can facilitate the early detection of unfavourable configurations and hence promptly prevent maintenance interventions before any kind of severe damage could take place.

Author Contributions

C.B.: conceptualization, methodology, formal analysis, investigation, resources, project administration, writing-original draft preparation, writing-review and editing; S.N., M.F. and C.A.: methodology, investigation, writing-original draft preparation, writing-review and editing. All authors have read and agreed to the published version of the manuscript.

Funding

This research received no external funding.

Data Availability Statement

Data will be shared upon request.

Acknowledgments

Seretti Vetroarchitetture and So.Co.Ba. are acknowledged for facilitating the in-field experimental investigation on case-study systems.

Conflicts of Interest

The authors declare no conflict of interest.

References

  1. Baggio, C.; Bernardini, A.; Colozza, R.; Corazza, L.; Della Bella, M.; Di Pasquale, G.; Dolce, M.; Goretti, A.; Martinelli, A.; Orsini, G.; et al. Field Manual for Post-Earthquake Damage and Safety Assessment and Short Term Countermeasures (AeDES); Report EUR 22868 EN.; Pinto, A.V., Taucer, F., Eds.; Joint Research Centre—Institute for the Protection and Security of the Citizen: Brussels, Belgium, 2007; ISSN 1018-5593. [Google Scholar]
  2. Ministry of Business, Innovation and Employment (MBIE). Field Guide: Rapid Post Disaster Building Usability Assessment—Earthquake, 1st ed.; MBIE: Wellington, New Zealand, 2014; ISBN 978-0-478-41794-4 (Print), 978-0-478-41797-5 (Online).
  3. Harirchian, E.; Lahmer, T.; Buddhiraju, S.; Mohammad, K.; Mosavi, A. Earthquake Safety Assessment of Buildings through Rapid Visual Screening. Buildings 2020, 10, 51. [Google Scholar] [CrossRef] [Green Version]
  4. Stepinac, M.; Kisicek, T.; Renić, T.; Hafner, I.; Bedon, C. Methods for the Assessment of Critical Properties in Existing Masonry Structures under Seismic Loads—The ARES Project. Appl. Sci. 2020, 10, 1576. [Google Scholar] [CrossRef] [Green Version]
  5. Lorenzoni, F.; Casarin, F.; Caldon, M.; Islami, K.; Modena, C. Uncertainty quantification in structural health monitoring: Applications on cultural heritage buildings. Mech. Syst. Signal Process. 2016, 66, 268–281. [Google Scholar] [CrossRef]
  6. Masciotta, M.-G.; Ramos, L.F.; Lourenco, P.B. The importance of structural monitoring as a diagnosis and control tool in the restoration process of heritage structures: A case study in Portugal. J. Cult. Herit. 2017, 27, 36–47. [Google Scholar] [CrossRef] [Green Version]
  7. Russo, S. Simplified procedure for structural integrity’s evaluation of monuments in constrained context: The case of a Buddhist Temple in Bagan (Myanmar). J. Cult. Herit. 2017, 27, 48–59. [Google Scholar] [CrossRef]
  8. Ali, A.; Sandhu, T.Y.; Usman, M. Ambient Vibration Testing of a Pedestrian Bridge Using Low-Cost Accelerometers for SHM Applications. Smart Cities 2019, 2, 20–30. [Google Scholar] [CrossRef] [Green Version]
  9. Bedon, C.; Bergamo, E.; Izzi, M.; Noè, S. Prototyping and validation of MEMS accelerometers for structural health monitoring—The case study of the Pietratagliata cable-stayed bridge. J. Sens. Actuator Netw. 2018, 7, 30. [Google Scholar] [CrossRef] [Green Version]
  10. Luleci, F.; Li, L.; Chi, J.; Reiners, D.; Cruz-Neira, C.; Necati Catbas, F. Structural Health Monitoring of a Foot Bridge in Virtual Reality Environment. Procedia Struct. Integr. 2022, 37, 65–72. [Google Scholar] [CrossRef]
  11. Payawal, J.M.G.; Kim, D.-K. Image-Based Structural Health Monitoring: A Systematic Review. Appl. Sci. 2023, 13, 968. [Google Scholar] [CrossRef]
  12. Guzman-Acevedo, G.M.; Vazquez-Becerra, G.E.; Millan-Almaraz, J.R.; Rodriguez-Lozoya, H.E.; Reyes-Salazar, A.; Gaxiola-Camacho, J.R.; Martinez-Felix, C.A. GPS, Accelerometer, and Smartphone Fused Smart Sensor for SHM on Real-Scale Bridges. Adv. Civ. Eng. 2019, 2019, 6429430. [Google Scholar] [CrossRef]
  13. Buffarini, G.; Clemente, P.; Giovinazzi, S.; Ormando, C.; Scafati, T. Structural assessment of the pedestrian bridge accessing Civita di Bagnoregio, Italy. J. Civ. Struct. Health Monit. 2022, 1–18. [Google Scholar] [CrossRef]
  14. Norouzzadeh Tochaei, E.; Fang, Z.; Taylor, T.; Babanajad, S.; Ansari, F. Structural monitoring and remaining fatigue life estimation of typical welded crack details in the Manhattan Bridge. Eng. Struct. 2021, 231, 111760. [Google Scholar] [CrossRef]
  15. Clemente, P. Monitoring and evaluation of bridges: Lessons from the Polcevera Viaduct collapse in Italy. J. Civ. Struct. Health Monit. 2020, 10, 177–182. [Google Scholar] [CrossRef]
  16. Bedon, C. Diagnostic analysis and dynamic identification of a glass suspension footbridge via on-site vibration experiments and FE numerical modelling. Compos. Struct. 2019, 216, 366–378. [Google Scholar] [CrossRef]
  17. Bedon, C. Experimental investigation on vibration sensitivity of an indoor glass footbridge to walking conditions. J. Build. Eng. 2020, 29, 101195. [Google Scholar] [CrossRef]
  18. Kozłowski, M. Experimental and numerical assessment of structural behaviour of glass balustrade subjected to soft body impact. Compos. Struct. 2019, 229, 111380. [Google Scholar] [CrossRef]
  19. Bedon, C.; Noè, S. Post-Breakage Vibration Frequency Analysis of In-Service Pedestrian Laminated Glass Modular Units. Vibration 2021, 4, 836–852. [Google Scholar] [CrossRef]
  20. El-Sisi, A.; Newberry, M.; Knight, J.; Salim, H.; Nawar, M. Static and high strain rate behavior of aged virgin PVB. J. Polym. Res. 2022, 29, 39. [Google Scholar] [CrossRef]
  21. Huang, Z.; Xie, M.; Du, J.Z.Y.M.; Song, H.-K. Rapid evaluation of safety-state in hidden-frame supported glass curtain walls using remote vibration measurements. J. Build. Eng. 2018, 19, 91–97. [Google Scholar] [CrossRef]
  22. Bedon, C.; Noè, S. Rapid Safety Assessment and Experimental Derivation of Damage Indexes for In-Service Glass Slabs. In Proceedings of the Challenging Glass Conference Proceedings, Ghent, Belgium, 23–24 June 2022; Volume 8. [Google Scholar] [CrossRef]
  23. EN 572–2:2004; Glass in Buildings—Basic Soda Lime Silicate Glass Products. CEN: Brussels, Belgium, 2004.
  24. CNR-DT 210/2013; Istruzioni Per la Progettazione, L’esecuzione ed il Controllo di Costruzioni con Elementi Strutturali di Vetro. National Research Council of Italy (CNR): Rome, Italy, 2013. (In Italian)
  25. ISO 10137:2007; Bases for Design of Structures -Serviceability of Buildings and Walkways against Vibrations. International Organisation for Standardization (ISO): Geneve, Switzerland, 2007.
  26. Dimarogonas, A.D. Vibration of cracked structures: A state of the art review. Eng. Fract. Mech. 1996, 55, 831–857. [Google Scholar] [CrossRef]
  27. Limongelli, M.P.; Manoach, E.; Quqa, S.; Giordano, P.F.; Bhowmik, B.; Pakrashi, V.; Cigada, A. Vibration Response-Based Damage Detection. In Structural Health Monitoring Damage Detection Systems for Aerospace; Springer Aerospace Technology: Cham, Switzerland, 2021. [Google Scholar]
  28. Dogangun, A.; Acar, R.; Sezen, H.; Livaoglu, R. Investigation of dynamic response of masonry minaret structures. Bull. Earthq. Eng. 2008, 6, 505–517. [Google Scholar] [CrossRef]
  29. Gentile, C.; Saisi, A. Ambient vibration testing of historic masonry towers for structural identification and damage assessment. Constr. Build. Mater. 2007, 21, 1311–1321. [Google Scholar] [CrossRef]
  30. Ubertini, F.; Gentile, C.; Materazzi, A.L. Automated modal identification in operational conditions and its application to bridges. Eng. Struct. 2013, 46, 264–278. [Google Scholar] [CrossRef]
  31. Zhu, X.; Cao, M.; Ostachowicz, W.; Xu, W. Damage Identification in Bridges by Processing Dynamic Responses to Moving Loads: Features and Evaluation. Sensors 2019, 19, 463. [Google Scholar] [CrossRef] [Green Version]
  32. Gauron, O.; Boivin, Y.; Ambroise, S.; Saidou Sanda, A.; Bernier, C.; Paultre, P.; Proulx, J.; Roberge, M.; Roth, S.-N. Forced-vibration tests and numerical modeling of the Daniel-Johnson multiple-Arch Dam. J. Perform. Constr. Facil. 2018, 32, 04017137. [Google Scholar] [CrossRef]
  33. Pereira, S.; Magalhães, F.; Cunha, Á.; Moutinho, C.; Pacheco, J. Modal identification of concrete dams under natural excitation. J. Civ. Struct. Health Monit. 2021, 11, 465–484. [Google Scholar] [CrossRef]
  34. Bedon, C.; Fasan, M. Reliability of field experiments, analytical methods and pedestrian’s perception scales for the vibration serviceability assessment of an in-service glass walkway. Appl. Sci. 2019, 9, 1936. [Google Scholar] [CrossRef] [Green Version]
  35. Bedon, C.; Mattei, S. Facial Expression-Based Experimental Analysis of Human Reactions and Psychological Comfort on Glass Structures in Buildings. Buildings 2021, 11, 204. [Google Scholar] [CrossRef]
  36. Bedon, C. Issues on the Vibration Analysis of In-Service Laminated Glass Structures: Analytical, Experimental and Numerical Investigations on Delaminated Beams. Appl. Sci. 2019, 9, 3928. [Google Scholar] [CrossRef] [Green Version]
  37. Zemanova, A.; Zeman, J.; Janda, T.; Schmidt, J.; Sejnoha, M. On modal analysis of laminated glass: Usability of simplified methods and Enhanced Effective Thickness. Compos. Part B Eng. 2018, 151, 92–105. [Google Scholar] [CrossRef] [Green Version]
  38. Galuppi, L.; Royer-Carfagni, G. Effective thickness of laminated glass beams: New expression via a variational approach. Eng. Struct. 2012, 38, 53–67. [Google Scholar] [CrossRef]
  39. Andreozzi, L.; Briccoli Bati, S.; Fagone, M.; Ranocchiai, G.; Zulli, F. Weathering action on thermo-viscoelastic properties of polymer interlayers for laminated glass. Constr. Build. Mater. 2015, 98, 757–766. [Google Scholar] [CrossRef]
  40. Bennison, S.J.; Jagota, A.; Smith, C.A. Fracture of Glass/Poly(vinyl butyral) (Butacite®) Laminates in Biaxial Flexure. J. Am. Ceram. Soc. 1999, 82, 1761–1770. [Google Scholar] [CrossRef]
  41. Bedon, C.; Fasan, M.; Amadio, C. Vibration analysis and dynamic characterization of structural glass element with different restraints based on operational modal analysis. Buildings 2019, 9, 13. [Google Scholar] [CrossRef] [Green Version]
  42. Levin, R.I.; Lieven, N.A.J. Dynamic finite element model updating using simulated annealing and genetic algorithms. Mech. Syst. Signal Process. 1998, 12, 91–120. [Google Scholar] [CrossRef] [Green Version]
  43. Chisari, C.; Bedon, C.; Amadio, C. Dynamic and static identification of base-isolated bridges using Genetic Algorithms. Eng. Struct. 2015, 102, 80–92. [Google Scholar] [CrossRef]
  44. Standoli, G.; Salachoris, G.P.; Masciotta, M.G.; Clementi, F. Modal-based FE model updating via genetic algorithms: Exploiting artificial intelligence to build realistic numerical models of historical structures. Constr. Build. Mater. 2021, 303, 124393. [Google Scholar] [CrossRef]
  45. Sung, H.; Chang, S.; Cho, M. Efficient Model Updating Method for System Identification Using a Convolutional Neural Network. AIAA J. 2021, 59, 3480–3489. [Google Scholar] [CrossRef]
  46. Teughels, A.; De Roeck, G. Damage detection and parameter identification by finite element model updating. Arch. Comput. Methods Eng. 2005, 12, 123–164. [Google Scholar] [CrossRef]
  47. Zapico, J.L.; González, M.P. Numerical simulation of a method for seismic damage identification in buildings. Eng. Struct. 2005, 28, 255–263. [Google Scholar] [CrossRef]
  48. Busca, G.; Cappellini, A.; Manzoni, S.; Tarabini, M.; Vanali, M. Quantification of changes in modal parameters due to the presence of passive people on a slender structure. J. Sound Vib. 2014, 333, 5641–5652. [Google Scholar] [CrossRef]
  49. Cao, M.S.; Sha, G.G.; Gao, Y.F.; Ostachowicz, W. Structural damage identification using damping: A compendium of uses and features. Smart Mater. Struct. 2016, 26, 043001. [Google Scholar] [CrossRef] [Green Version]
  50. Simulia, D.S. ABAQUS Computer Software; Dassault Systémes: Providence, RI, USA, 2021. [Google Scholar]
  51. Clough, R.W.; Penzien, J. Dynamics of Structures; McGraw-Hill: New York, NY, USA, 1993; ISBN 0-07-011394-7. [Google Scholar]
  52. Larcher, M.; Manara, G. Influence of Air Damping on Structures Especially Glass; JRC 57330 Technical Note; European Commission, Joint Research Centre—Institute for the Protection and Security of the Citizen: Ispra, Italy, 2010. [Google Scholar]
  53. Ramos, A.; Pelayo, F.; Lamela, M.J.; Canteli, A.F.; Huerta, C.; Acios, A.P. Evaluation of damping properties of structural glass panes under impact loading. In COST Action TU0905 Mid-term Conference on Structural Glass; CRC Press: Boca Raton, FL, USA, 2013; ISBN 978-1-138-00044-5. [Google Scholar]
  54. Lenci, S.; Consolini, L.; Clementi, F. On the experimental determination of dynamical properties of laminated glass. Ann. Solid Struct. Mech. 2015, 7, 27–43. [Google Scholar] [CrossRef]
  55. Feldmann, M.; Heinemeyer, C.; Butz, C.; Caetano, E.; Cunha, A.; Galanti, F.; Goldack, A.; Hechler, O.; Hicks, S.; Keil, A.; et al. Design of Floor Structures for Human Induced Vibrations; EUR 24084 EN; Publications Office of the European Union: Luxembourg, 2009; p. JRC55118.
  56. Sedlacek, G.; Heinemeyer, C.; Butz, C.; Völling, B.; Waarts, P.; Duin, F.; Hicks, S.; Devine, P.; Demarco, T. Generalisation of Criteria for Floor Vibrations for Industrial, Office, Residential and Public Building and Gymnastic Halls; Report number: EUR-21972-EN; European Commission: Luxembourg, 2006.
Figure 1. Examples of damage in (a) masonry or (b) concrete structures (figures reproduced with permission from Unsplash).
Buildings 13 00754 g001
Figure 2. Examples of (a,b) glass pedestrian systems and (c) LG fracture (figures reproduced with permission from Unsplash).
Buildings 13 00754 g002
Figure 3. Proposed procedural steps for safety and residual capacity assessment of existing, in-service LG pedestrian systems.
Buildings 13 00754 g003
Figure 4. Application of Operational Modal Analysis to in-service LG pedestrian systems: (a) example of delamination in LG (figure reproduced from [36] under the terms and conditions of CC-BY license agreement); (b) overview of past experimental study with multiple MEMS sensors (figure reproduced from [19] under the terms and conditions of CC-BY license agreement); and (c) schematic representation of in-field assessment based on single MEMS setup.
Buildings 13 00754 g004
Figure 5. Example of practical derivation of equivalent shear relaxation modulus for PVB interlayer based on experimental master-curve (original figure adapted from [40] under permission from John Wiley and Sons©, Copyright license number 5327091377077, June 2022).
Buildings 13 00754 g005
Figure 6. Example of accident in a 100 m high bridge in China due to wind loading: (a) initial configuration for the intact bridge and (b) post-accident configuration.
Buildings 13 00754 g006
Figure 7. Overview of selected modular units for the examined LG pedestrian systems: (a) SM#1–LGU layout (pictures taken during retrofit interventions in Spring 2021, Courtesy of Seretti Vetroarchitetture); (b) top view of SM#2–LGU modular unit (reproduced from [19] under the terms and conditions of CC-BY license); and (c) schematic representation of glass fracture detail for SM#3–LGF panel.
Buildings 13 00754 g007
Figure 8. Qualitative comparison of fundamental modal shapes (out-of-scale) based on linear modal frequency response analysis of (a) SM#1–LGU module and (b) SM#2–LGU or SM#3–LGF modules (ABAQUS).
Buildings 13 00754 g008
Figure 9. Example of in-field acquisition (selection) of acceleration records (vertical component) un-der (a) linear walking path or (b) on-site jump.
Buildings 13 00754 g009
Figure 10. Frequency domain response of the examined systems: example of selected experimental signals for the (a) SM#1–LGU and (b) SM#3–LGF modules.
Buildings 13 00754 g010
Figure 11. Qualitative example of typical (a) acceleration and (b) velocity experimental signal due to a single footfall of the involved volunteer.
Buildings 13 00754 g011
Figure 12. Reference ISO 10137:2007 [25] acceleration curves for RMS and peak acceleration on floors. Application of recommended limits to the presently examined (a) SM#1–LGU and (b) SM#2–LGU, SM#3–LGF systems.
Buildings 13 00754 g012
Figure 13. Correlation analysis of experimental performance indicators for the examined slab units: (a) rolling RMS acceleration as a function of the vertical acceleration peak; and (b) RMS acceleration as a function of the vertical acceleration peak.
Buildings 13 00754 g013
Figure 14. Material characterization based on FE model updating: (a) derivation of equivalent interlayer stiffness for SM#1–LGU system; and (b) equivalent modulus for fractured glass layer (SM#3–LGF system).
Buildings 13 00754 g014
Table 1. Summary of typical mechanical properties for constituent LG materials. * = depending on time loading, temperature, humidity, etc.
MaterialElastic Modulus
[MPa]
Poisson’ Ratio
[-]
Density
[kg/m3]
Behaviour
Glass70,0000.232500Brittle elastic in tension
PVB (interlayer)Variable *0.451000Viscoelastic
Table 2. Reference wavenumbers βn for monolithic beams with simply supported ideal end restraints and bending span Lef.
Mode Order n
123
π/Lef2π/Lef3π/Lef
Table 3. Summary of geometrical features for the examined LG pedestrian systems (beam-like simply supported setup).
SpecimenDimensions
[m]
Span
[m]
Total Thickness
[mm]
Cross-SectionMass
[kg]
RM
Equation (4)
λ
Equation (5)
SM#1–LGU0.51 × 2.800.5127.528/10/8 + 0.76 PVB931.1668
SM#2–LGU1.35 × 2.652.6537.52 + 612/12/12 + 0.76 PVB + AN cover3204245
SM#3–LGF1.35 × 2.652.6537.52 + 612/12/12 + 0.76 PVB + AN cover3204245
Table 4. Reference limit multiplying factors (MF) and experimentally derived MF values (Equation (14)) for continuous and intermittent vibrations, based on ISO 10137:2007 [25] (*) from Equation (9) and experimental signals; (**) from Equation (13) and ISO baseline curve.
FloorTimeRecommended MF LimitExperimentally Calculated MF
(Average)
from Equation (14)
Critical working areaDay & Night10.109 */0.02 ** = 5.47 for SM#1–LGU
0.040 */0.007 ** = 5.71 for SM#2–LGU
0.051 */0.006 ** = 8.50 for SM#3–LGF
ResidentialDay2 to 4
Night1.4
Quite office, Open planDay & Night2
General officeDay & Night4
WorkshopDay & Night8
Table 6. Safety check for ULS stress and SLS deformation accounting for in-field experimentally derived degradation phenomena for the examined LG modular units.
ULS Stress RatioSLS Deflection Ratio
SampleTime 0CurrentSAFE
(≤1)
Time 0CurrentSAFE
(≤1)
SM#1–LGU0.0710.087Yes0.220.35Yes
SM#2–LGU0.290.34Yes0.310.45Yes
SM#3–LGF0.290.45Yes0.310.47Yes
Disclaimer/Publisher’s Note: The statements, opinions and data contained in all publications are solely those of the individual author(s) and contributor(s) and not of MDPI and/or the editor(s). MDPI and/or the editor(s) disclaim responsibility for any injury to people or property resulting from any ideas, methods, instructions or products referred to in the content.

