Article

A Quasi-2D Exploration of Mixed-Mode Fracture Propagation in Concrete Semi-Circular Chevron-Notched Disks

1
Engineering Construction Management Centre, China Nuclear Engineering Consulting Co., Ltd., Beijing 100048, China
2
School of Civil Engineering, The University of Queensland, St Lucia, QLD 4072, Australia
*
Author to whom correspondence should be addressed.
Buildings 2023, 13(10), 2633; https://doi.org/10.3390/buildings13102633
Submission received: 24 June 2023 / Revised: 23 August 2023 / Accepted: 29 September 2023 / Published: 19 October 2023
(This article belongs to the Special Issue Research on the Crack Control of Concrete)

Abstract

:
Most semi-circular bend (SCB) tests on concrete have been conducted with a pre-crack with a straight-through tip, thereby undermining the determination of the tensile fracture toughness (KIc). Therefore, the present study involved mixed-mode (tensile–shearing) fracture propagation in concrete semi-circular chevron-notched disks (i.e., with a sharp notch tip) using SCB tests and the FRANC2D numerical simulation software. The inclined notch angle (β) was varied from 0° to 70° while the other settings remained fixed, and the crack mouth opening displacement (CMOD) of the notch was measured constantly. The stress distribution was analyzed using finite-element simulations, and the experimental results showed that this testing method was robust. The maximum failure load and the fracture propagation angle increased with β, and wing fracture was observed. With FRANC2D simulating these SCB tests successfully, it was found that the tensile stress concentration around the notch tip moved toward the upper face of the notch, and the compressive stress concentration formed on the notch tip. The tensile mode was generated as the CMOD kept increasing for β = 0–30°, whereas the mixed mode became more evident as the CMOD kept decreasing for β = 45–70°. The fracture process zone was found for β = 0–30° but not for β = 45–70°. This mixed-mode fracture is predicted better by the criterion of extended maximum tangential strain than by other criteria, and there is a linear relationship between CMOD and KIc, as examined previously for pavement and concrete materials.

1. Introduction

Brittle materials such as glass, rock, and concrete are essential construction materials in civil engineering. Because their mechanical properties raise concerns about the safety of designs in structural and geotechnical engineering, such materials have long been investigated. Initially, because of the success of applying linear elastic theory to ductile materials, the stress–strain constitutive relationship of brittle materials was treated as a linear elastic without deeply investigating the heterogeneity induced by pre-existing fractures and cracks. Compared to ductile materials, the mechanical properties of brittle materials were less well-known and understood in terms of irreversible strain resulting from material fracturing [1]. From a microscale perspective, crack propagation in rock and concrete is a process of atomic decohesion caused by mechanical instability [2]. Because of cyclic loading or environmental conditions, material cracks can be generated during manufacturing and construction. Cracked concrete and rock have posed dangers to and shortened the life spans of many civil infrastructures, so more research is justified to accurately characterize the mechanical performance of such materials under fracturing conditions.
The first to investigate brittle materials at the macroscale was Griffith [3], who developed the theory of energy decohesion in fracture mechanics based on the strain energy release rate during crack propagation. In 1939, Weibull introduced the statistical distribution of initial defects and gave a failure model as a function of stress and volume [4]. Since then, various models of quasi-brittle materials have been established based on initial micro-defects [2]. Meanwhile, Barenblatt [5] and Dugdale [6] devoted their efforts to integrating cohesive forces in the crack tip region within the limitations of the elastic theory. Because the stress conditions near the cracking area vary significantly after crack initiation, cracking patterns are crucial for analyzing fracturing in concrete and rock. According to the theory of linear elastic fracture mechanics, the cracking process begins if the critical stress intensity factor (SIF)—well known as the fracture toughness (Kc)—is reached (KKc). The SIF (K) can be quantified based on the fracture mode near the cracking region, the crack inclination angle, and the crack geometry. Figure 1A shows that crack propagation varies with crack geometry (e.g., elliptical or with zero opening width) and orientation (differing inclination angle). Also, based on the stress conditions around the crack and the crack surface displacement [4,7,8]. There are three fundamental fracture modes: tensile (mode I), shearing (mode II), and tearing (mode III). As shown schematically in Figure 1B, mode I is a tensile mode that involves the two cracking faces separating along the y–axis perpendicular to the xz plane, mode II is a shearing mode that involves the two cracking faces in the xz plane sliding in parallel along the x–axis, and mode III is a tearing mode that involves the two cracking faces in the xz plane sliding along the z–axis.
Several theories have been established to elucidate the fracturing behavior, including the maximum strain energy release rate criterion (G criterion), the minimum strain energy density criterion (S criterion), the maximum principal stress/strain criterion, the maximum tangential stress (MTS) criterion, and other empirical criteria [4,7]. Compared to principal-stress-based criteria that are applicable only to mode I, energy-based criteria are more suitable for mode II because they can consider shear-stress–strain behavior rather than just principal stress [9]. However, Bocca, et al. [10] noted that neither the G criterion nor the S criterion could be applied straightforwardly for a mixed mode (tensile–shearing). Therefore, Sih [11] and Shen and Stephansson [12] established the modified G criterion, also known as the F criterion, which is a general form of the G criterion considering both modes I and II. Subsequently, to explain mixed-mode fracturing, Lim and Lee [13] developed the generalized MTS (GMTS) criterion based on the F criterion, thereby characterizing Kc mathematically for modes I and II (KIc and KIIc) and enabling Kc to be quantified for mixed-mode fracturing.
Much research effort has gone into studying concrete fracturing behavior thoroughly under mode-I loading conditions [14]. However, in practice, cracked structures sometimes experience mixed-mode loading combining modes I and II [15]. Also, Shi [16] noted that most fracture problems in concrete are mixed-mode ones involving modes I and II. Therefore, many semi-circular bend (SCB) tests have been conducted under mixed-mode loading conditions by applying a straight-through notch to a pre-cracked concrete specimen [14,17,18,19,20]. However, the cracked chevron notched Brazilian disk (CCNBD) test from rock mechanics shows that a sharp cracking tip contributes to more accurately quantified fracturing behavior than does a straight-through notch because the cracking-tip bluntness of the latter undermines the determination of Kc [14]. Nevertheless, despite some previous studies of concrete having tested semi-circular chevron-notched disks (SCCNDs), SCCND concrete specimens have rarely been investigated under mixed-mode loading conditions. Therefore, the present study used experimental and numerical methods to explore mixed-mode (tensile–shearing) concrete crack propagation in SCCND specimens with different chevron notch angles. The study had five aims: (i) assess whether the present experiment is reliable and robust for testing concrete; (ii) study how the crack initiation angle varies with the chevron notch angle; (iii) investigate the crack mouth opening displacement (CMOD) under mixed-mode fracturing; (iv) analyze fracturing behavior with Kc determined by the GMTS criterion; (v) model the crack propagation in an SCCND concrete specimen via numerical simulation. The expectation is that via this series of analyses, the present experimental and numerical work will advance the understanding of mixed-mode (tensile–shearing) crack propagation in concrete SCCND specimens with a chevron notch with a sharp cracking tip so that the concrete fracturing tests can be improved accordingly in any newly updated testing standards in consideration of chevron notch instead of the straight-through notch.

2. Experimental and Numerical Methods

2.1. Specification of Concrete SCCND

All the specimens were prepared according to ISRM (International Society for Rock Mechanics) standards. Following the instructions provided by BASF Ltd. of New Zealand, the concrete samples were fabricated by mixing 20 kg per bag of MasterEmaco N 102 Cl mortar with 3.8–4.0 L of water. Each sample was loaded into a CCNBD mold and then removed after initial concrete curing for four days; note that molding is always better than cutting for generating the chevron notch because the concrete aggregates around the chevron notch lead to poor cutting performance. After curing for 28 days, Young’s elastic modulus (E) and the compressive strength reached 10 GPa and 25 MPa, respectively, with a Poisson’s ratio (v) of 0.2 [21]. Each CCNBD specimen was split precisely into two equivalent SCCND specimens using a diamond saw.
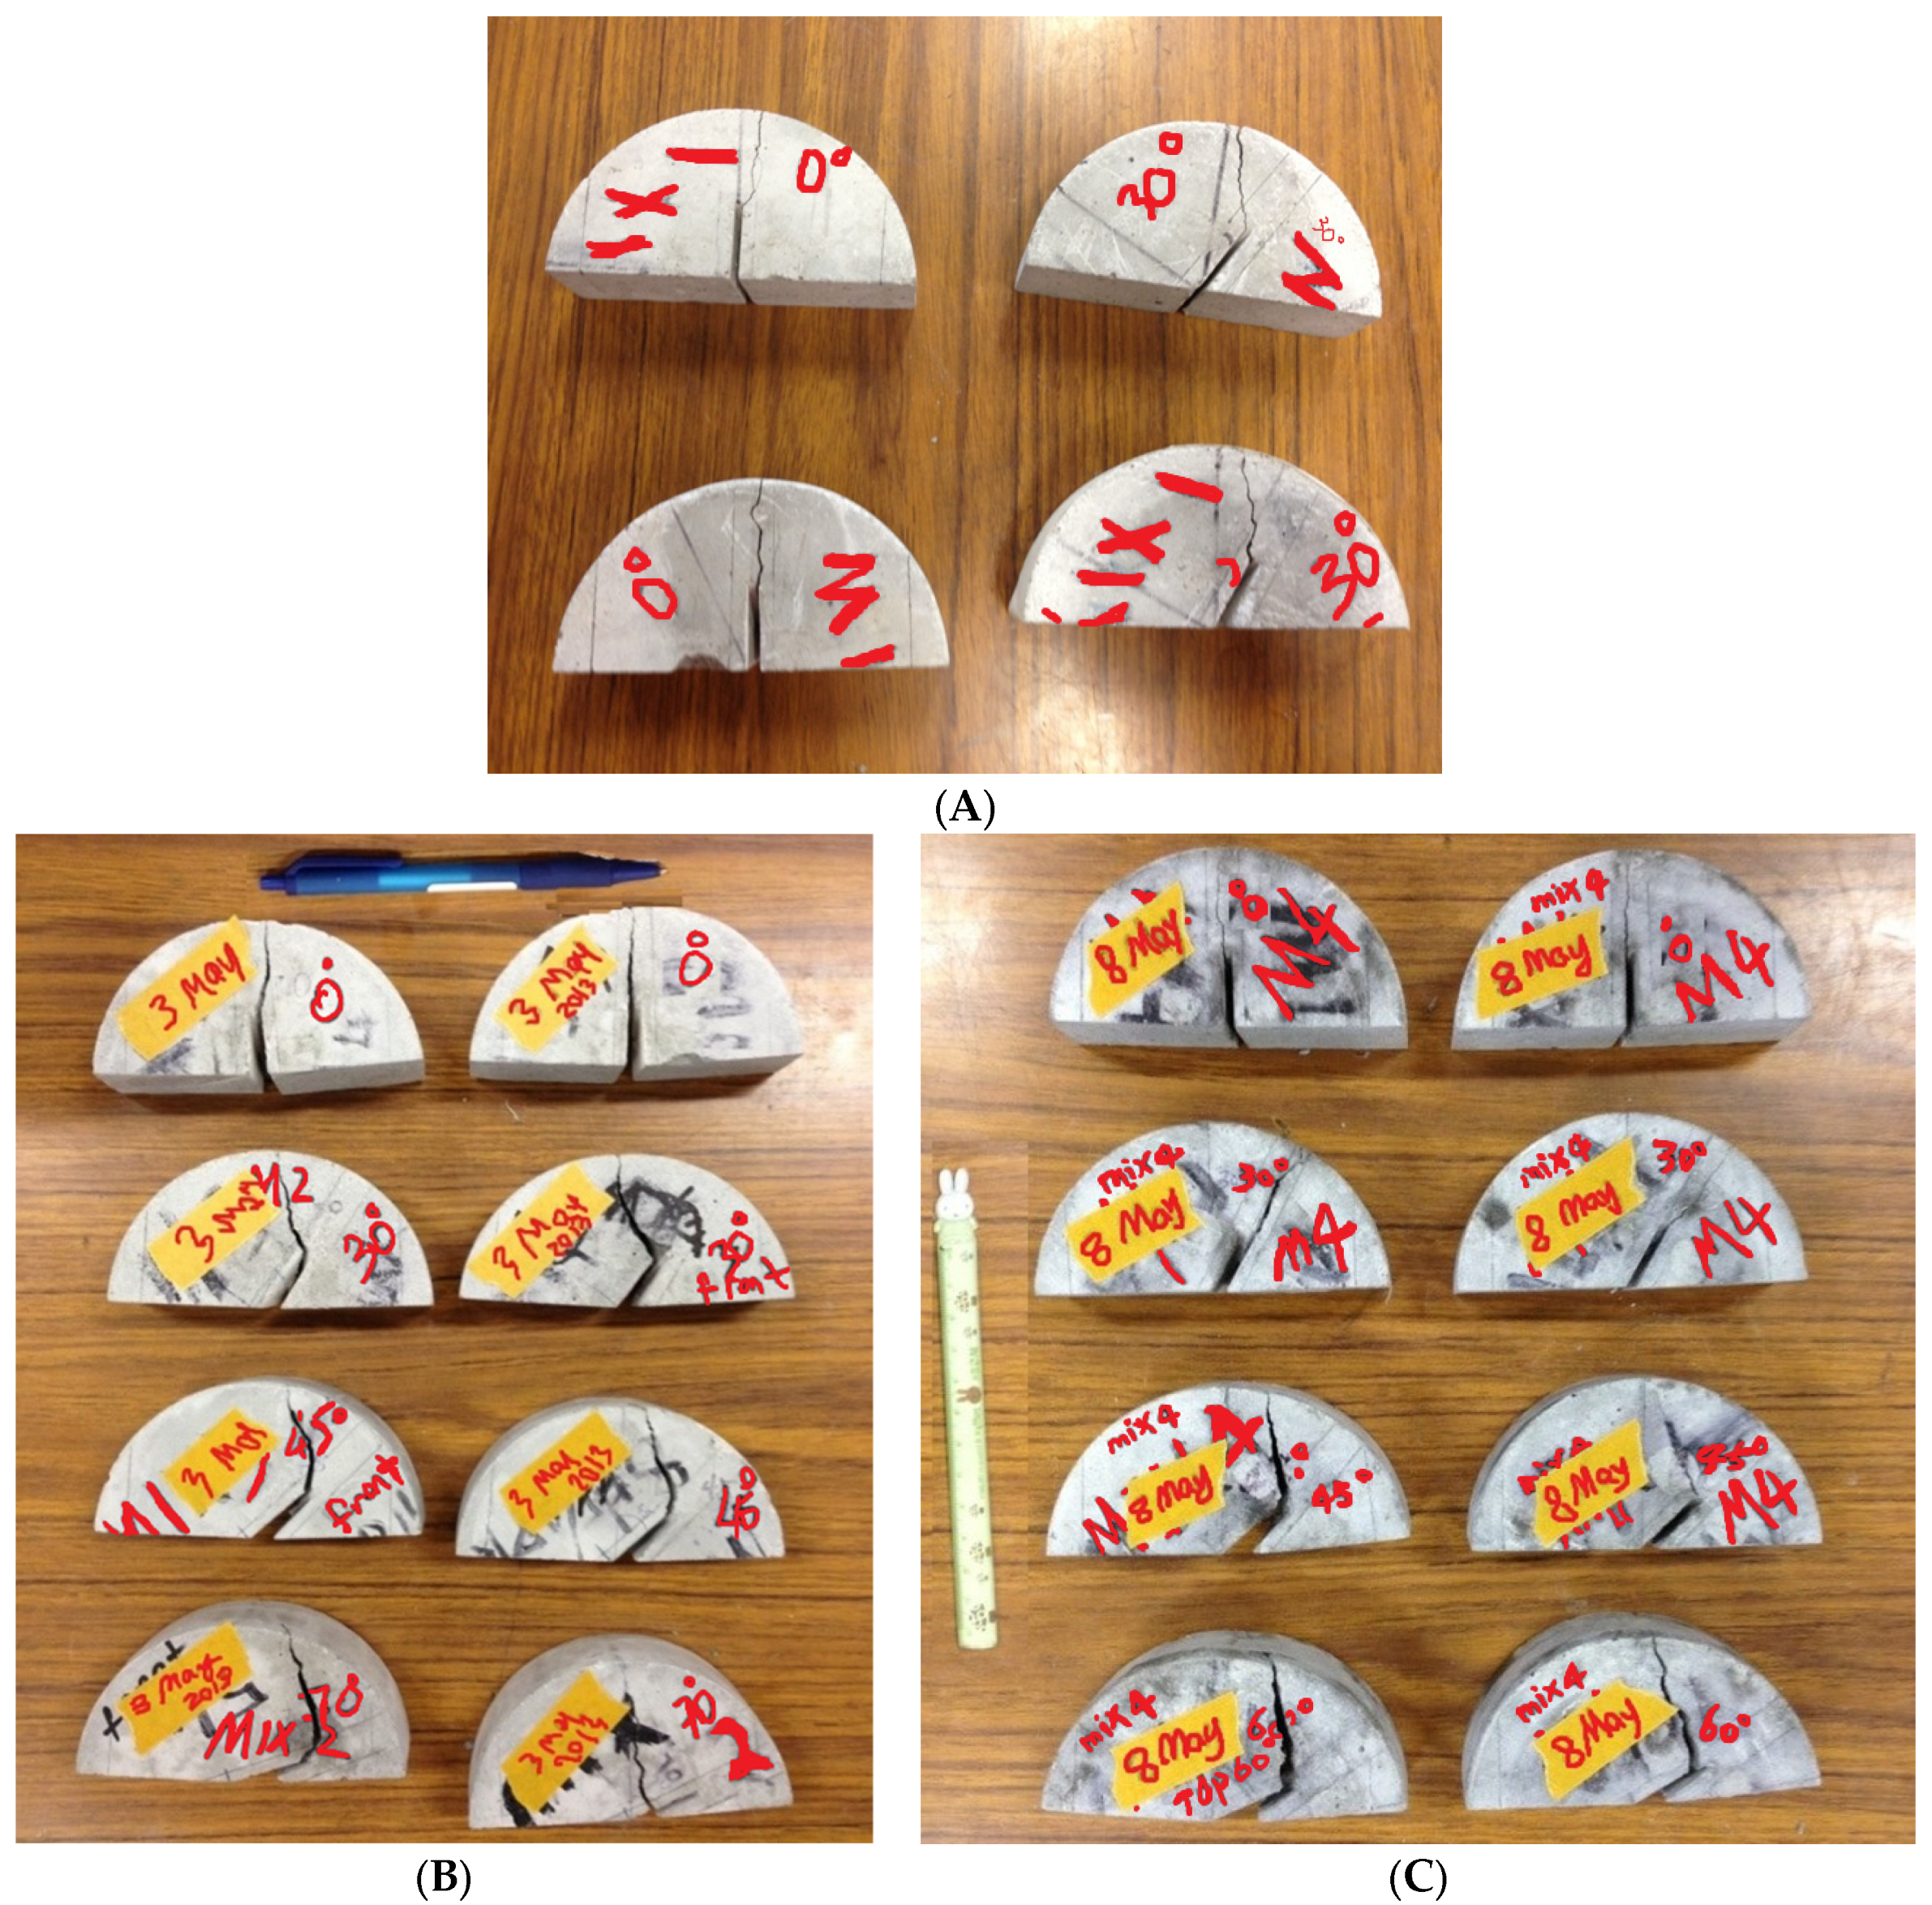
An SCCND specimen with a chevron notch therein is illustrated in Figure 2A. Its radius (R) was 51.5 mm, its thickness (B) was 30 mm, the chevron notch thickness (T) was 2 mm, the chevron notch angle (β) was 0°, 30°, 45°, 60°, or 70°, the inner chevron notch length (a0) was 12.5 mm, the outer chevron notch length (a1) was 23 mm, the chevron notch length (a) was between a0 and a1, and the manufacturing standard deviation (STD = ±1 mm) was determined using a caliper. As shown in Figure 2B–D, there were three testing groups: group 1 had β = 0° and 30°, group 2 had β = 0°, 30°, 45°, and 70°, and group 3 had β = 0°, 30°, 45°, and 60°. Because each CCNBD specimen provided two SCCND specimens, each SCB test could be repeated twice for each value of β.

2.2. SCB Tests for Concrete SCCND

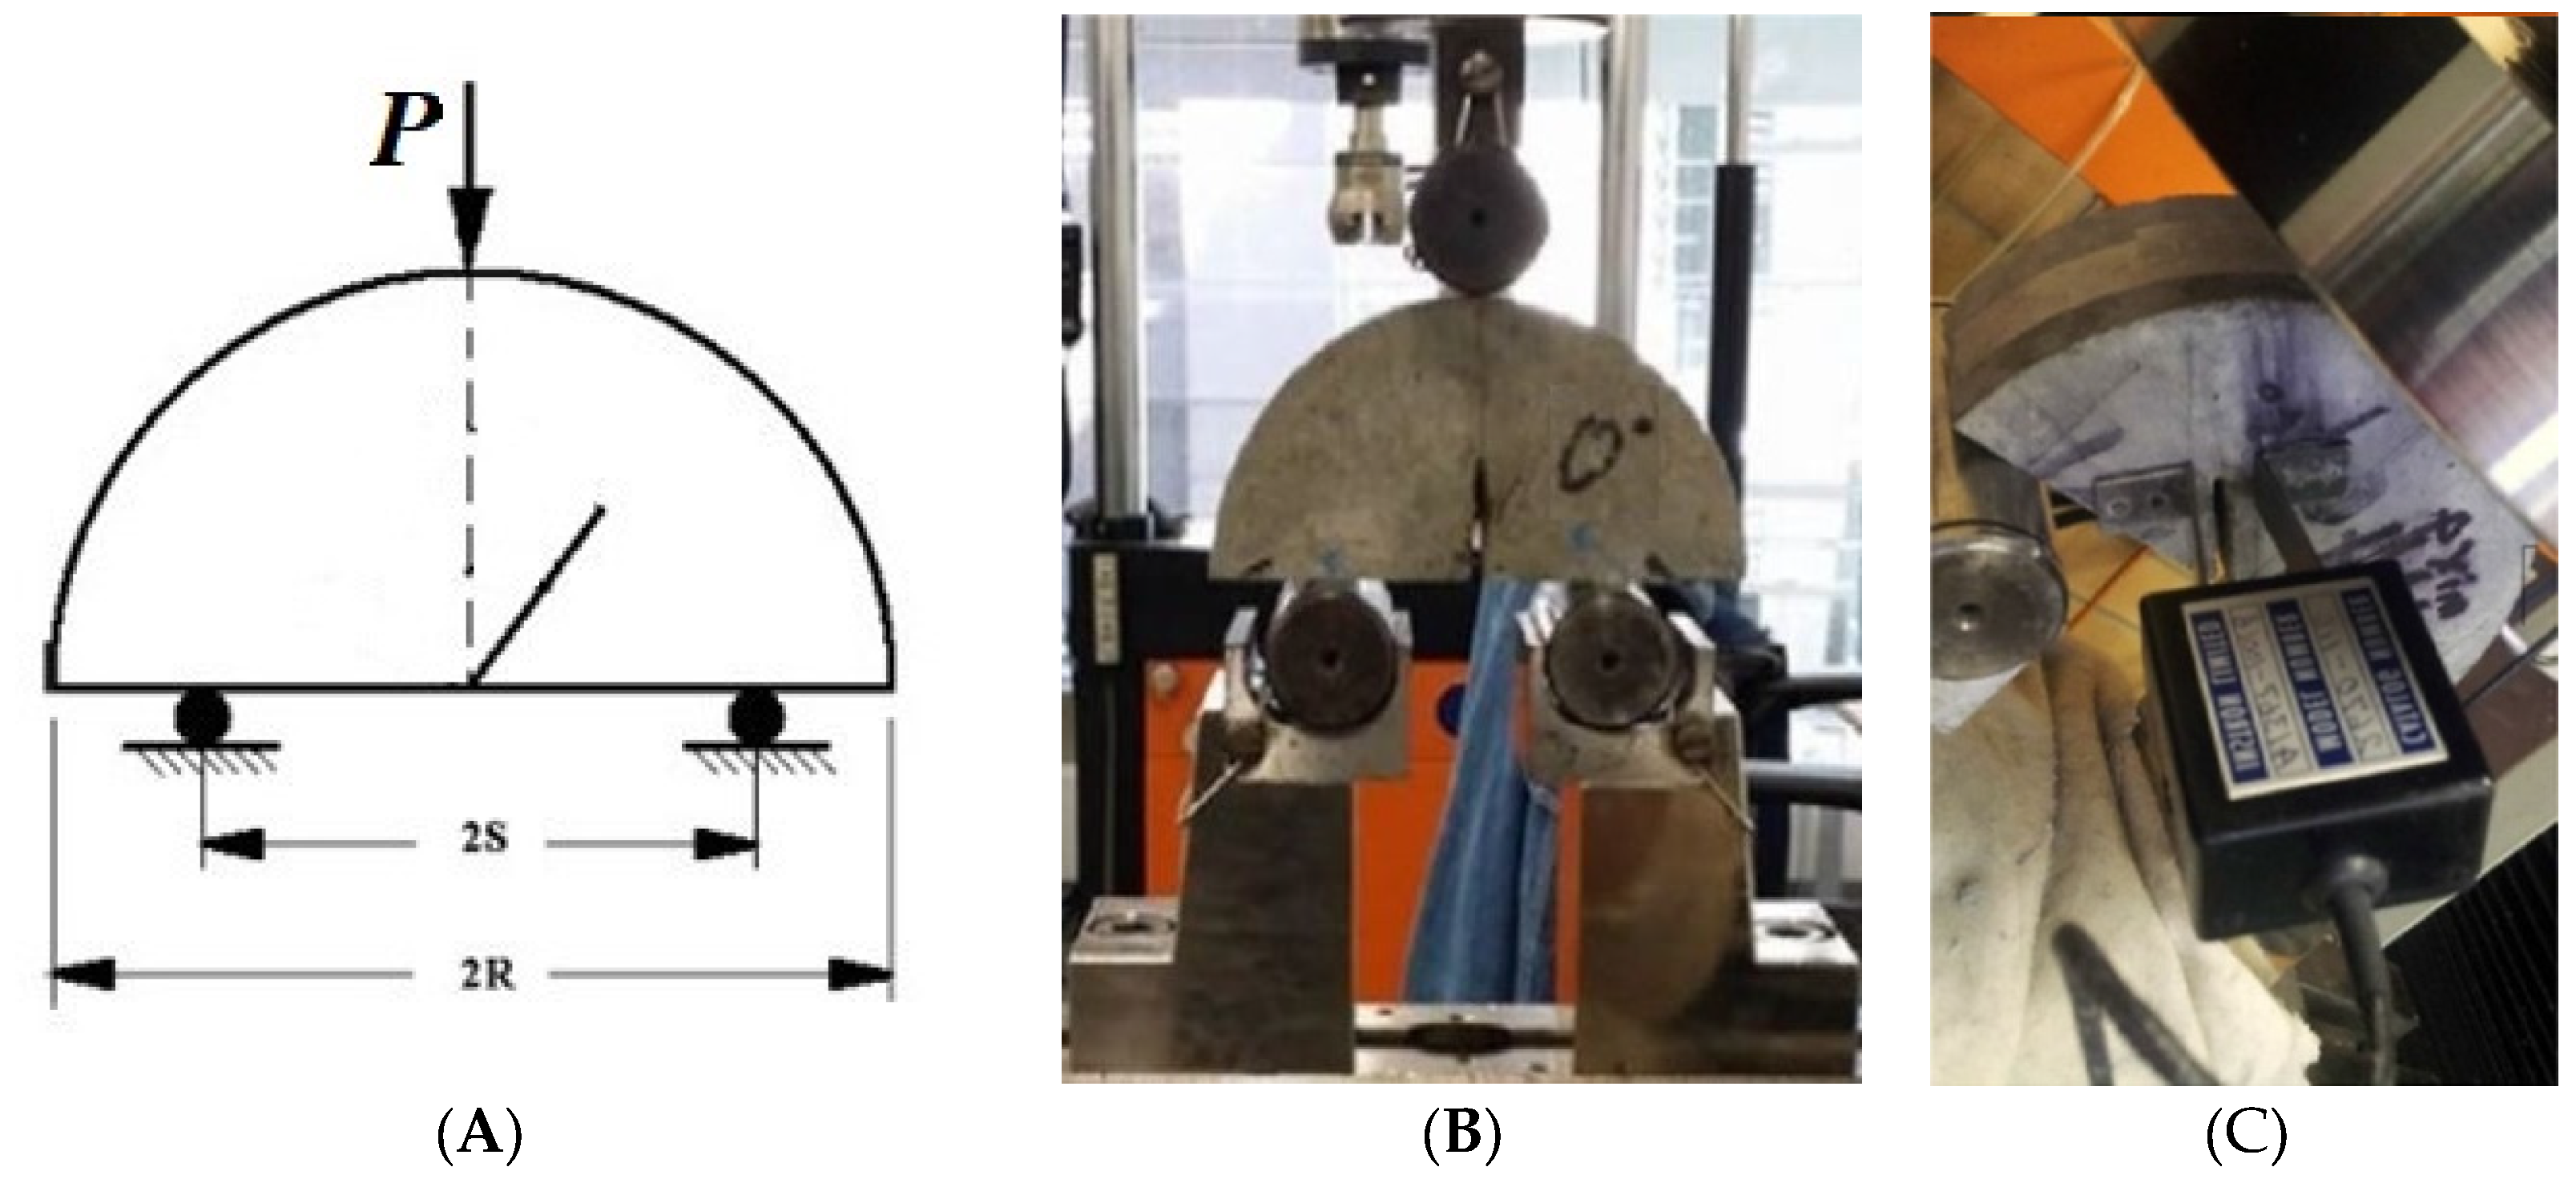
The SCB test is shown schematically in Figure 3A. It is a three-point bending test with two symmetrical rollers supporting an SCCND specimen when applying a compressive top load P. The ISRM standards suggest that the span between the two rollers (2S) should be such that 0.5 < S/R < 0.8 [22], and they recommend S/R = 0.6 for rock SCCND tests (S = 30 mm) and S/R = 0.8 for concrete ones (S = 41.5 mm). Figure 3B shows a universal loading machine (Instron model 4505) with a three-point bend loading frame (i.e., flexural bend fixture). This machine was equipped with a 100-kN load cell, and the hydraulic servo-control testing system was controlled by the Bluehill 3 software. The vertical displacement was measured using a flexural bend fixture with a 100-mm length scale installed in the Instron loading frame. This loading frame applied the top load P along the SCCND central axis by a top roller. Note that mislocating this roller could lead to eccentric loading, so according to ISRM standards, the test specimen should be covered with strips of adhesive paper for better contact with the top roller [22]; alternatively, a potentially better solution is a loading plate, as shown in Figure 3C. The loading condition was controlled in the range of 0.06–0.1 kN (depending on the practical situation) to achieve a displacement rate of 0.025 mm/min, which was computer-controlled by the software Bluehill 3 of Instron model 4505. This loading setting ensured the quasi-static loading conditions and avoided any possible loading-induced mechanical impact by setting an irrationally fixed loading rate. Meanwhile, the two bottom rollers allowed the two segments of a cracked SCCND to rotate around them during a fracturing process.
Figure 3C shows the CMOD measurement in the case of the alternative top-loading method. The CMOD was measured using a crack opening displacement (COD) transducer (Instron model 2670-116) that had a clip gauge attached to the surfaces of the two segments of an SCCND by a binding agent (Loctite 454 instant adhesive). The gap of the clip gauge was initially set to 10 mm and then expanded with subsequent fracturing; thus, the transducer constantly detected the displacement of the clip gauge, which was equal to the CMOD. Also, to investigate the relationship between the chevron-notch angle and the subsequent fracturing angle, all cracking angles were measured using a protractor. Each SCCND specimen was tested following the testing procedure recommended in the ISRM standards [22]. Each test continued until a loading-induced failure occurred, and the failure load (Pmax), vertical displacement, and CMOD were recorded continually using a computerized data logger to quantify the fracturing behavior.

2.3. Numerical Simulation of SCB Tests

As mentioned above, an SCB test provides three designated variables at the testing scale but cannot detect the stress distribution in an SCCND specimen. Therefore, numerical simulations based on the finite-element method (FEM) were carried out to replicate the present SCB tests under the same testing conditions while also studying the stress distribution in the concrete SCCND. Initially developed by Wawrzynek and Ingraffea [23] at Cornell University, the FRANC2D (Fracture Analysis Code 2D) software was used to conduct these numerical simulations. FRANC2D integrates FEM analysis with fracture mechanics to provide versatile functionalities, including automatic mesh generation, a topological database for local re-meshing [24], elastic analysis with stress singularity [24], computer graphics, and finite-element post-processing [23]. Therefore, academics working on solid and rock mechanics have used FRANC2D extensively over the past two decades to model mixed-mode (tensile–shearing) fracturing [14,25,26,27].
In the FRANC2D numerical models, the quasi-2D SCB tests were treated as a plane stress problem, as shown in Figure 4. Consequently, the specimen geometry simulated by FRANC2D was the same 2D geometry as that in the actual SCB tests regarding the specimen radius (R), the half-span of the flexural bend fixture (S), the chevron notch length (a), the chevron notch thickness (T), and the chevron notch angle (β), and the specimen with this geometry was assumed to be a continuous, isotropic, and homogeneous elastic specimen. The SCCND material properties were set as E = 10 GPa and v = 0.2 to replicate the aforementioned concrete [21]. Each simulated specimen was meshed using the CASCA automatic mesh generator before the three-point loading simulation (see Figure 4); the mesh resolution at the semi-circular top boundary and the straight-edged bottom boundary was ca. 50 elements, while there were ca. 30 elements around the chevron notch in each simulated SCCND, based on the previous simulating experience using FRANC2D for similar concrete specimens [14]. In Figure 4, the segments on either side of the chevron notch are designated as the “upper face” (left) and the “lower face” (right), and the top end of the chevron notch is the cracking “tip” where the fracture is initiated.
In each FRANC2D simulation, kinematic constraints were applied simultaneously to the SCCND specimen at its top, bottom left, and bottom right to fix it in the x and y directions. The three-point bending load in an SCB test was simulated as a uniformly distributed load within an infinitesimal length in the actual 3D space, which could be seen as a point-wised load in a quasi-2D plane. Also, the maximum top load along the central axis and on the two symmetrical supports under the specimen was the failure load obtained from the actual SCB test. The loading conditions were modelled under the quasi-static loading conditions, replicating the practical SCB tests mentioned above. For β = 0° and 30°, the cohesive fracture model was applied because of the occurrence of only the tensile mode (type I). For the other values of β at which the tensile–shearing mixed mode (types I and II) occurred, automatic noncohesive fracture propagation was implemented in the FRANC2D program to model the fracture propagation accurately.
Before fracture was initiated, contour plots of the tensile and shear stresses were produced to show the stress distributions in the 2D specimens simulated by FRANC2D. In addition, the normal and shear stress distributions on the upper and lower faces were plotted along position lines using “line plot” in the “post-process” option of FRANC2D. After the simulations, the simulation outputs for the fracture propagation were compared with snapshots of the actual fracture propagations in the SCB tests. These model outcomes could be used to analyze the fracture initiation and propagation, the stress distribution in the SCCND specimen, and the fracturing behavior under mixed-mode loading (β = 0–70°). Therefore, FRANC2D is a useful and powerful software for fracture analysis to aid the standard and modified SCB tests for brittle materials, including glass, rock, and concrete.

2.4. Methods for Fracture Analysis

To analyze the fracture propagation for various values of β in the range of 0–70°, the GMTS criterion was selected to determine K for the mixed mode (types I and II). Then, K could be given separately as the tensile SIF (KI) for mode I and the shear SIF (KII) for mode II [28,29]. For compatibility with the geometry of an SCCND specimen, Kuruppu and Chong [30] modified the GMTS criterion based on the ISRM standards to obtain
K I = P max π a 2 R B Y I ( β , S R , a R )
K I I = P max π a 2 R B Y I I ( β , S R , a R ) ,
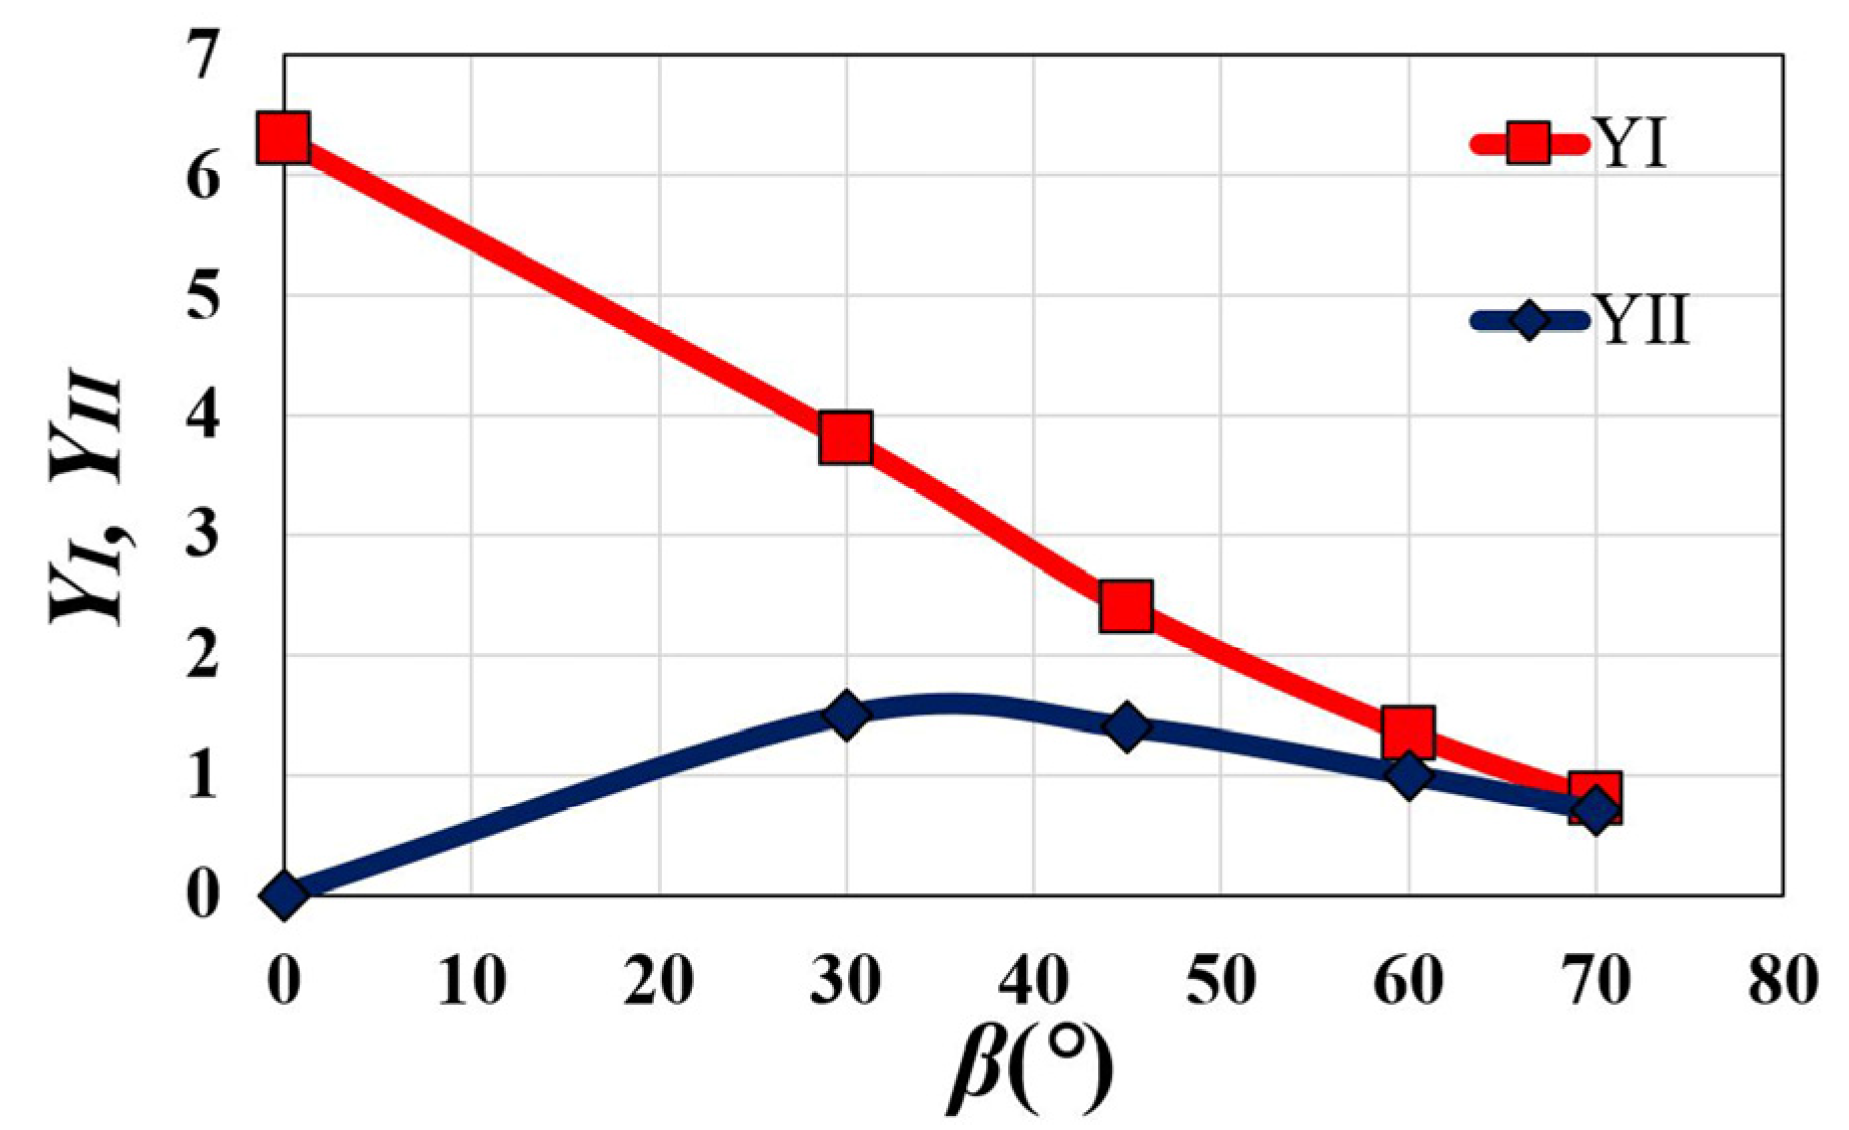
where YI and YII are the nondimensional SIFs for modes I and II, respectively, depending on β, S/R, and a/R, and the variables are as follows: Pmax is the failure load applied along the central axis of the SCCND specimen; a is the length of the chevron notch in the specimen; S is the half-span of the symmetric supports (i.e., flexural bend fixture) under the specimen; R is the specimen radius; B is the specimen thickness. The relationships between these nondimensional SIFs (YI and YII) and the three parameters β, S/R, and a/R have been given by Ayatollahi and Aliha [31]. In Figure 5, YI and YII were determined using interpolation between the settings of a/R = 0.4 and 0.5 for the same S/R = 0.8 from the comprehensive datasets for YI and YII provided by Ayatollahi and Aliha [31] and Luo, et al. [21], who numerically explored a series of SCB test settings in ranges including those of the present concrete SCCND specimens (i.e., β = 0–70°, S/R = 41.5 mm ÷ 51.5 mm = 0.8, and a/R = 23 mm ÷ 51.5 mm = 0.45).
The critical SIF (Kc) of a brittle material—usually called the fracture toughness—is also characterized by the energy per unit area required to create new crack surfaces, thereby propagating a crack through the material, and it has been identified as the fundamental parameter for understanding the behavior of fractures [32]. Kc reflects the ability of a material to absorb energy, and it is usually determined under impact loading conditions in the presence of a chevron notch, such as in CCNBD and SCB tests. Mixed-mode (tensile–shearing) fracturing can be provided by varying β within the range of 0–90° [33] and the ratios a/R and S/R [28]. In the present work, the mode-I fracture toughness KIc is given as
K I c = P max π a 2 R B Y I c ,
Y I c = 1.297 + 9.516 S R ( 0.47 + 16.457 S R ) a R + ( 1.071 + 34.401 S R ) ( a R ) 2 ,
where YIc is the nondimensional SIF derived under plane stress conditions in a series of FEM analyses by Kuruppu, et al. [22].
Furthermore, based on the weight-function method developed by Adamson, et al. [34], Mubaraki and Sallam [35] gave the relationship between the CMOD and KI as
CMOD · E R a = k · K I + b ,
where the variables are as follows: E′ is the generalized Young’s elastic modulus of a brittle material, which is equal to E for plane stress and E/(1 − v2) for plane strain, where v is the Poisson’s ratio of the material; R is the radius of the SCCND specimen; a is the length of the chevron notch; k and b are fitting parameters. Whether this linear relationship is valid for a concrete SCCND specimen was also investigated with the experimental measurement of the CMOD and the calculated KI.

3. Results and Discussion

3.1. Maximum Failure Load

The values of Pmax on the concrete SCCND specimens were obtained from the SCB tests by following the aforementioned experimental method; they are summarized in Table 1, and the mean values and standard deviations (STD) of Pmax are plotted in Figure 6. As can be seen, the Pmax STD changes little with β, thereby showing the reliability and robustness of the present SCB tests. In contrast, Pmax clearly increases with increasing β, and the reason for this could be that higher shear stress occurs with higher β (45–70°). An example that could explain this situation is that the normal stress (tensile and compressive) applied on the chevron notch tip may effectively serve as shear stress along the original plane of the chevron notch between the upper and lower faces. Meanwhile, almost no shear stress acts on the chevron notch for β = 0–30° because now the normal stress serves mainly as tensile stress along the original plane of the chevron notch between the upper and lower faces. Consequently, there is a lower value of Pmax for β = 0–30° compared to that for β = 45–70°. The inconsistency of Pmax > 1.11 kN for β = 60° while Pmax < 0.98 kN for β = 70° might have one or more causes, including human operating error, the eccentricity of the top loading point, local heterogeneity in the concrete specimens (the embedded fine and coarse aggregates), the mechanical tests being quasi-2D (actually 3D with a thickness B = 30 mm). On the other hand, it might additionally be attributed to Pmax almost approaching its maximum value when β reaches ca. 60–70°; meanwhile, the sensitivity of β variation was already within the testing and measuring precision.

3.2. Chevron-Notch and Fracturing Angles

After the SCB tests, the three testing groups of the prepared SCCND specimens in Figure 2B–D were cracked, as shown in Figure 7A–C, respectively. As well as the prefabricated chevron notch angles (β), the fracture propagation angles (θ) were also measured using a protractor and are summarized in Table 2.
To show better the relationship between β and θ, the mean value and STD of the measured values of θ are plotted against β in Figure 8. From these experimental results, it is apparent that θ depends strongly on β given the monotonically increasing relationship between the mean values of β and θ shown in Figure 8. For β ≤ 30°, the tensile-stress-induced fracture propagated at the tip of the chevron notch only and also perpendicular to the two faces of the SCCND specimen. For β > 30°, the original location of fracture propagation tended to move to the upper face of the chevron notch instead of its tip. In addition, the fracture propagation deviated from the original notch angle of β, and the fracture then propagated to the central loading point by following a curvilinear trajectory (see the demonstrations in Figure 1A and the actual instances in Figure 7B,C). Because these fracturing patterns look like a wing attached to the tip of the chevron notch, they are called wing fractures. This type of fracture is caused by both tensile and shear stress and, therefore, is identified as a mixed-mode (tensile–shearing) fracture. Moreover, note that based on the criterion of maximum tangential stress, the pure shearing mode (type II) loading condition could be generated if β ≥ 70.53° [29], but this mode was beyond the scope of the present study because of selecting β from the range of 0–70°.
Besides, it is clear to see that the STDs of β = 30° and β = 70° are over 20°, which is relatively significant to undermine the reliability of SCB tests. However, it is worth noting that SCB tests on concrete and rock samples always encounter any possible human operating error, the eccentricity of the top loading point, and local heterogeneity in the concrete specimens (the embedded fine and coarse aggregates). Such uncertainties could potentially cause such significant STDs, quantifying their maximum imprecision. In addition, the ranges of θ were provided because each CCNBD can provide two SCCND, as previously mentioned.

3.3. Stress Distributions in SCCND by FRANC2D

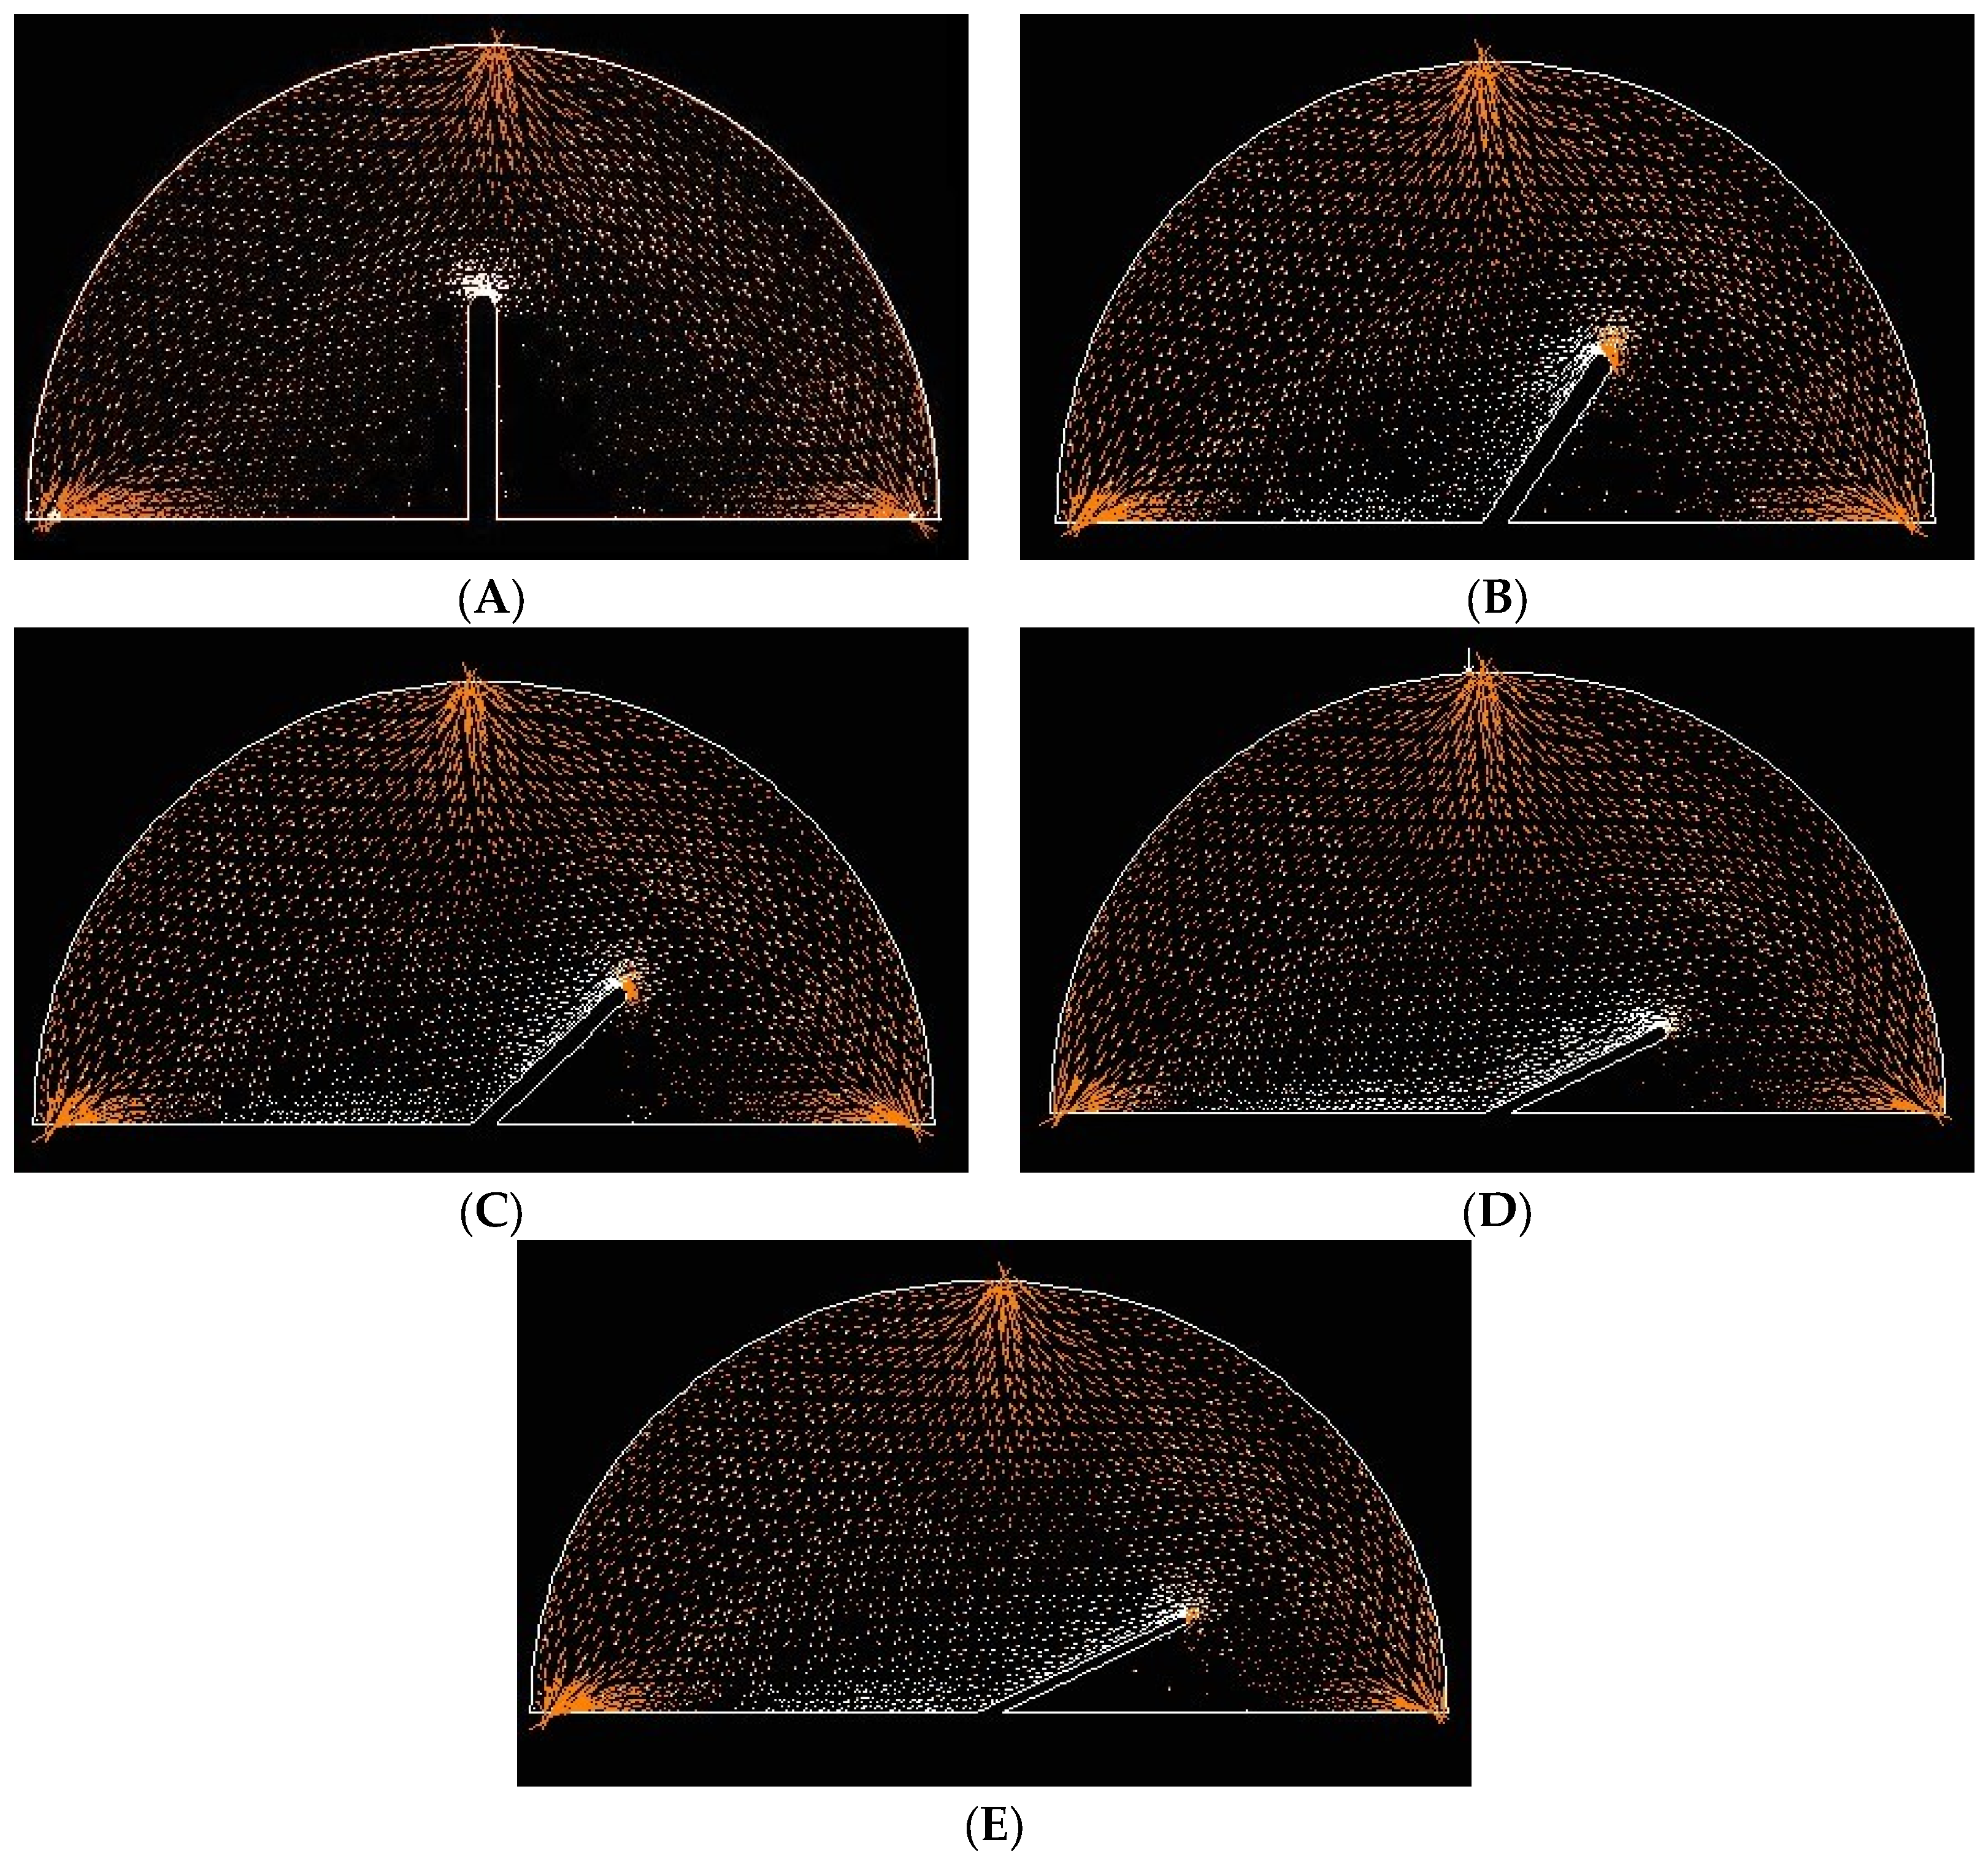
In addition to the mechanical SCB tests, numerical simulations of these tests were carried out using FRANC2D to show the stress distributions in the concrete SCCND specimens. This was done because the mechanical tests were incapable of delivering such outcomes. As can be seen from Figure 9, a common feature among all the simulated stress distributions was that there were similar stress concentrations of compression (highlighted in orange) in the regions adjacent to the three loading points of the SCB tests. In addition, the stress distributions close to those three regions were more prone to compression, whereas those farther away were more tensile (highlighted in white).
Despite those similar stress distributions for four different β angles, the most significant variations and distinctions in stress distributions were found around the prefabricated chevron notch. Figure 9A shows that for β = 0°, the tensile stress concentration developed near the chevron notch tip and was distributed around the tip region. When moving away from the tip region, this phenomenon suddenly disappeared along the two faces of the pre-existing notch. Figure 9B–E shows that for β > 30°, the distributions of tensile stress tended to move toward the upper face of the chevron notch with increasing β. In addition, the tensile stress concentrations were more likely to appear on the left side of the notch tip, while the compressive stress was concentrated on the right side.
In summary, these simulated stress distributions show that except for β = 0° resulting in the pure tensile mode (type I), no pure tensile or shear stress distribution was generated, leading to a mixed-mode fracturing process including types I and II. Therefore, both tensile and shear stress were effective for β = 30–70° and contributed to the tensile–shearing mixed-mode fracturing propagation in those concrete SCCND specimens. The mechanical SCB tests in previous literature mainly reported and discussed this observation without the assistance of FEM fracturing simulation. Here, investigating the SCB tests with numerical tools can bring more insights at the local scale of the SCCND specimen.
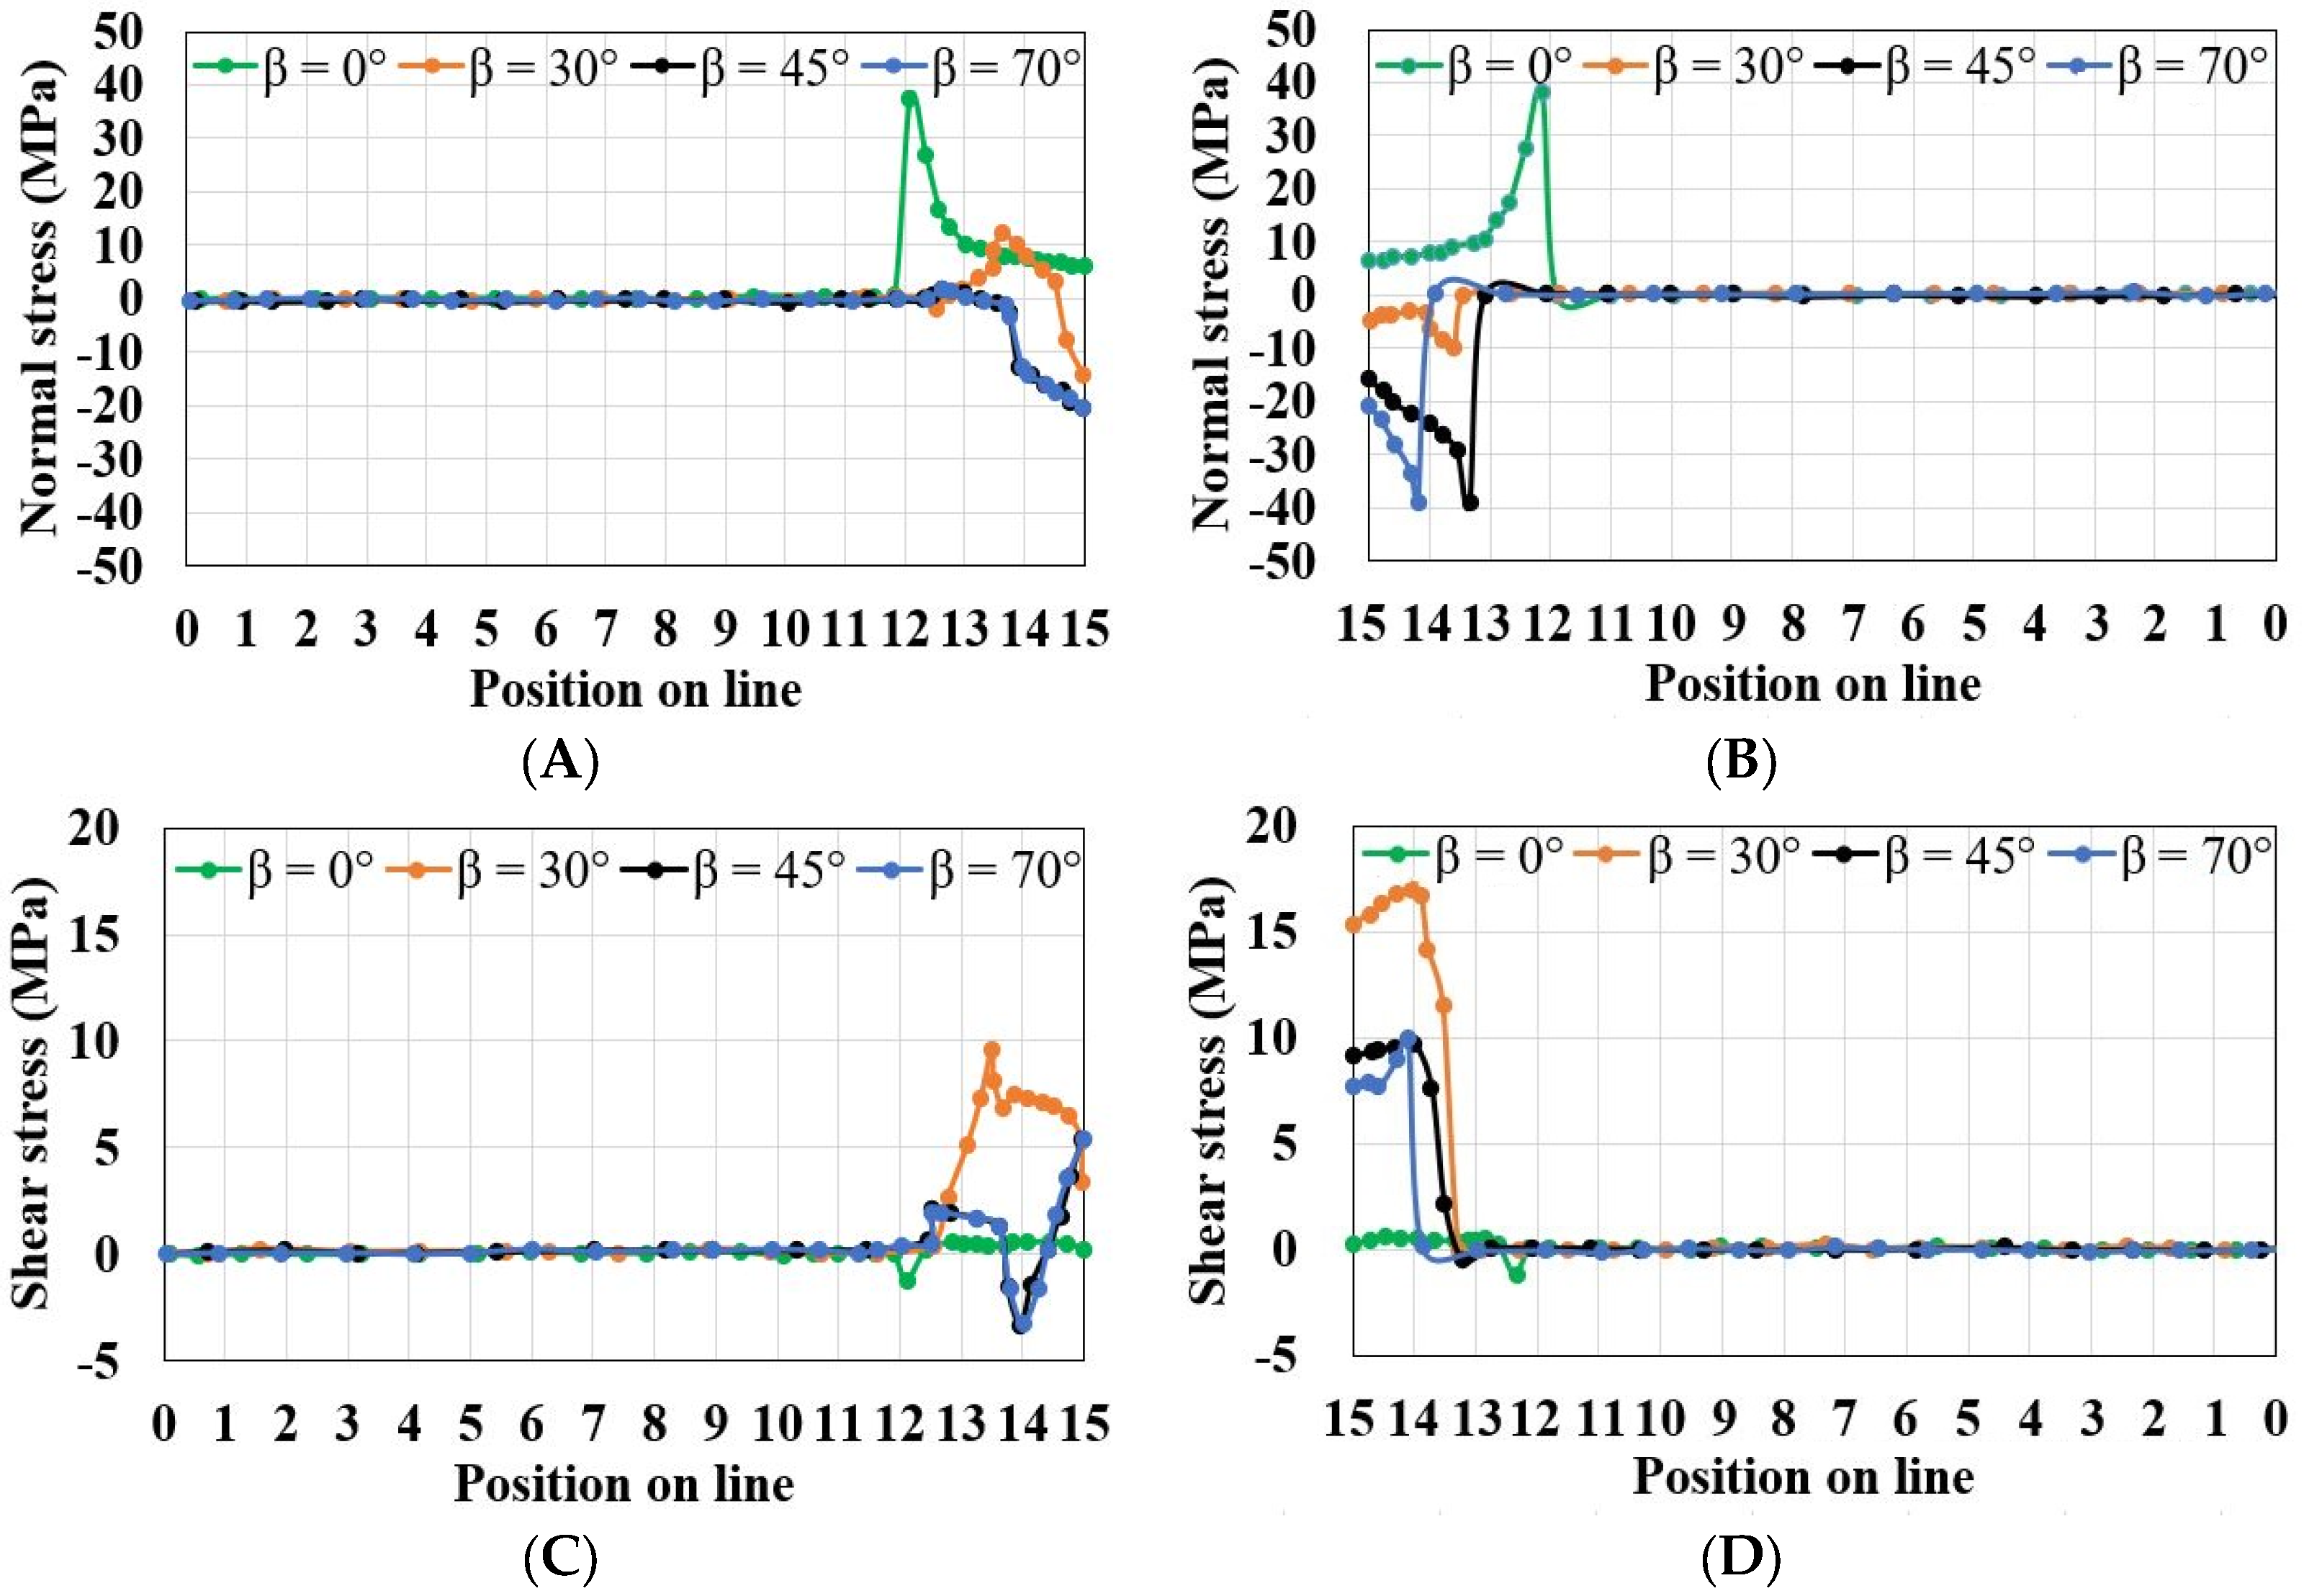
Nevertheless, this series of analyses of the stress distributions only provided the normal stress (tensile and compression) distributions qualitatively. Hence, it remains to analyze the stress distributions on the upper and lower faces of the chevron notch quantitatively in terms of both normal and shear stresses. With this motivation, the “line plot” post-processing option of FRANC2D was used to produce the normal and shear stress distributions around the notch. There were ca. 30 elements around the chevron notch, so the total number of positions was set as 15 for each side.
The quantitative analysis of the normal stress distribution for the chevron notch’s upper and lower face is shown in Figure 10A,B, respectively. Figure 10 shows that the wing fracture started at the notch tip because of the fracture formed by tensile stress concentration. For β = 0°, the normal stress was tensile at the notch’s upper and lower faces, and the maximum tensile stress (38.5 MPa) was near the tip region. For β = 30°, the normal stress was tensile at the upper face but compressive at the lower face. For β > 30°, the normal stress was slightly tensile when approaching the notch tip on the upper face and then became compressive for both faces near the notch tip. The highest tensile stresses (1–3 MPa) for all β angles were close to the notch tip in the directions perpendicular to the upper face of a fracturing plane. The highest compressive stress (39 MPa) was around the notch’s tip in the direction normal to the lower face.
The quantitative analysis of the shear stress distribution for the chevron notch’s upper and lower face is shown in Figure 10C,D, respectively. As can be seen, the minimum shear stress was around zero for β = 0° because minimum shear stress contributes to the fracture propagation during such a tensile fracturing process. In contrast, the maximum shear stress reached 15 MPa for β = 30° because the stress mode started to change from the pure tensile mode to the tensile–shearing mixed mode. For β > 30°, the shear stress direction varied near the notch’s tip to form the mixed-mode loading condition around the tip, which was more prone to the shearing mode.
With increasing β, the fracturing mode changed from pure tensile to mixed mode, which was contributed more by shear stress than tensile stress. When β reached 70°, tensile stress contributed insignificantly to fracture initiation, and instead, shear stress was dominant for fracture propagation. This finding agrees with the conclusion from Ayatollahi and Aliha [29] that the pure shearing mode (type II) loading condition can be generated if β ≥ 70.53° based on the criterion of maximum tangential stress.

3.4. Fracturing in SCCND Simulated by FRANC2D

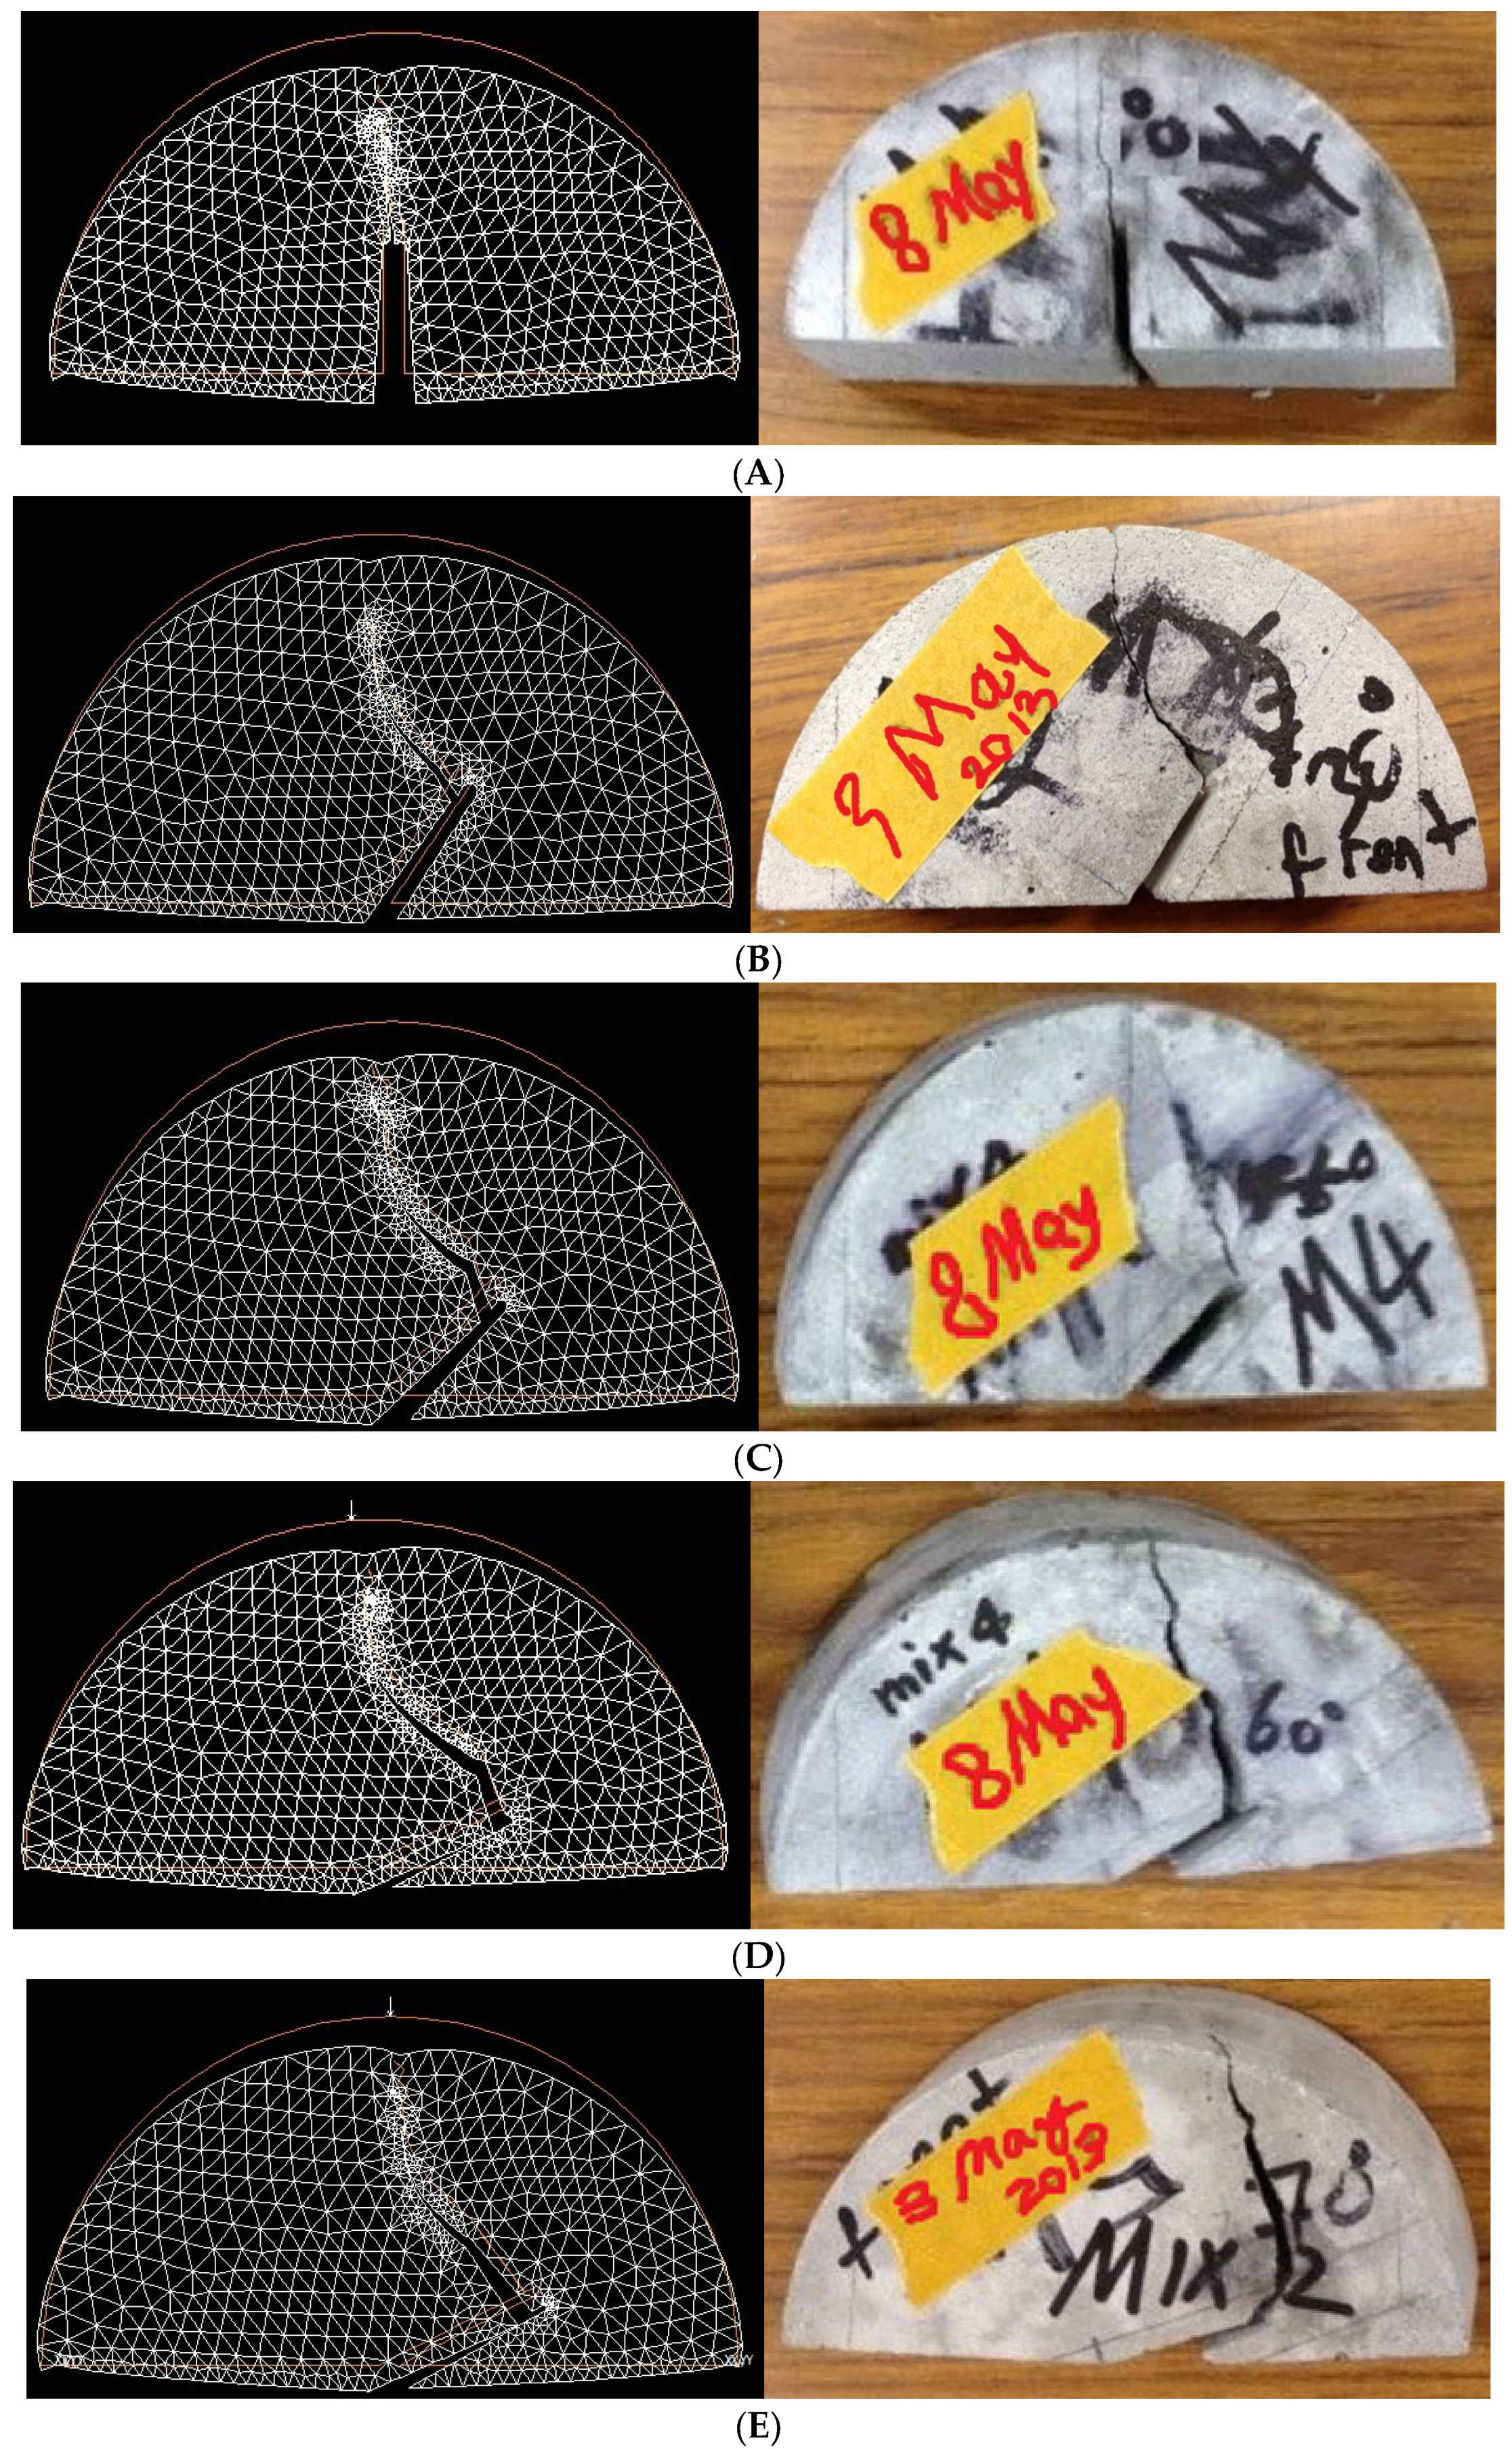
Fracture-propagation simulations were conducted after the stress-distribution analysis to study how θ varied with β. Note that the automatic re-meshing technique in FRANC2D enabled the simulation of the fracturing process. When a fracture began in the elements near the notch tip, those elements were deleted to allow the fracture to propagate, and a trial mesh was then generated to connect the new fracture to the existing mesh. With due appreciation of this technique, the fracture propagations simulated numerically by FRANC2D for β = 0–70° are compared in Figure 11 with those from the SCB tests.
Figure 11A–E show good agreements between the simulation and experimental fractures despite minor geometric differences, and all fracturing directions were toward the top loading point. In addition, with increasing β, the wing fractures formed more obviously, and the fracture-initiating point moved from the tip center toward the upper face nearby the tip. This phenomenon agrees with the analysis of stress distributions regarding the tensile stress concentrations moving toward the upper face because the stress-induced fracture always propagates in a direction perpendicular to the local principal tensile stress.
Furthermore, θ depended strongly on β. The θβ comparison in Table 3 shows that θ increased from 2° to 107° with β increasing from 0° to 70°. The values of θ given by the numerical simulations and the SCB tests agree well for β = 0–30° with a maximum difference of 1°, but they differ more for β = 45–70° with differences of 10–20°. This divergence might have one or more causes, including (i) human operating error, (ii) eccentricity of the top loading point, (iii) local heterogeneity in the concrete specimens (the embedded fine and coarse aggregates), (iv) the mechanical tests being quasi-2D (actually 3D with a thickness B = 30 mm) but the numerical simulations being fully 2D, and (v) meshing issues, but identifying any specific reason was beyond the present scope and could be an academic pursuit for concrete SCB tests in the future.

3.5. CMOD Determined by SCB Tests

The CMOD values measured by the COD transducer are plotted in Figure 12 against the load measurement given by the universal loading machine; the load–CMOD sketching was ended before the load reached the relevant value of Pmax, as given in Table 1. Figure 12 shows that positive CMOD (fracture opening) due to the local principal tensile stress was detected for β = 0–30°. In contrast, negative CMOD (fracture closing) due to the local tensile and shear stresses (mixed mode in types I and II) was detected for β = 30–70°. The angle β = 30° is a critical inclination angle for the prefabricated chevron notch, at which the positive CMOD turned negative, indicating that the pre-existing notch changed from opening to closing. This opening and closing behavior is also confirmed well by the geometric variation of the notches shown in Figure 11.
Also, the load–CMOD curves in Figure 12 can be used in analyzing the fracture-induced plastic deformation of the concrete SCCND specimens. According to Erarslan [14], there is a fracture process zone (FPZ) in front of the chevron notch if there is an apparent plastic deformation in the load–CMOD curve before failure. From Brazilian circular disk (BCD) tests on concrete CCNBD specimens for β = 0–30°, Erarslan [14] concluded that this FPZ occurred only at the notch tip, but it did not occur before the failure point in SCB tests on concrete SCCND specimen for all β angles. Meanwhile, in the present work, Figure 12 shows clearly that this FPZ existed at the notch tip in the SCB tests on the concrete SCCND specimens for β = 0–30°, which is consistent with the BCD tests on concrete CCNBD specimens carried out by Erarslan [14].

3.6. SIF and Fracture Toughness

With the values of Pmax given in Table 1, the tensile and shearing SIFs (KI and KII) were determined as given in Table 4 and Table 5 based on the dimensionless SIFs (YI and YII) in Figure 5. To illustrate better how KI and KII vary with β, the mean values of KI and KII are plotted in Figure 13A,B, respectively. KI and KII have minor variations in their STD, demonstrating the reliability and robustness of the SCB tests carried out in this study. Because KI and KII were calculated based on YI and YII in Figure 5, KI decreased monotonically from 0.26 MPa∙m0.5 to 0.07 MPa∙m0.5 with β increasing from 0° to 70°, while KII increased from zero at 0° to a maximum of 0.10 MPa∙m0.5 at 45–60° and then decreased to 0.06 MPa∙m0.5 at 70°. These experimental outcomes agree with the numerical investigation by Erarslan [14], who stated that KI is always higher than KII for all β angles. Moreover, it is believed that the high STD of 0.127 MPa∙m0.5 for β = 0° should be due to possible human operating error, the eccentricity of the top loading point, and local heterogeneity in the concrete specimens (the embedded fine and coarse aggregates).
The fracture toughness of the tensile mode (KIc) as calculated by Equations (4) and (5) was 0.375 MPa∙m0.5 for these concrete SCB tests. However, the determination of KIIc was not straightforward because previous studies have challenged the MTS criterion, which overestimated KIIc for the tensile–shearing mixed-mode loading conditions [14,18,36]. Based on the MTS criterion, KIIc could be given by the maximum fracture toughness of the pure shearing mode, i.e., KII,c = ( 3 / 2 ) KIc, if KI = 0 [37]. Regarding the aforementioned stress analysis, it can be seen that diametric compressive loading along the chevron notch would create the mixed-mode (types I and II) fracturing without apparent shearing mode (type II) fracturing, even though the notch would be subjected to compressive–shear loading. However, the MTS and G criteria were derived for a crack under monotonic tension, so earlier criteria for the mixed mode usually fail to predict KIIc obtained experimentally from the SCB tests [29,38,39].
To determine KIIc, the curves of dimensionless KII/KIc versus KI/KIc are shown in Figure 14A, where the MTS, G, GMTS, and extended maximum tangential strain (EMTSN) criteria are compared. As can be seen, the GMTS and EMTSN criteria mostly agree with the experimental results in Figure 14A, unlike the other two criteria, and the EMTSN criterion gives the best prediction. With this finding, it was possible to determine a value for KIIc of ca. 0.075 MPa∙m0.5 (0.2KIc). However, although many SCB tests have been conducted previously on other brittle materials, such as rock and glass, there have been few SCB tests on concrete SCCND specimens in a similar experimental setup (sharp tip of notch). A similar value of KIIc = 0.25KIc in concrete SCB tests was found by Mirsayar, et al. [18], who successfully applied the EMTSN criterion to determine KIIc, although the mortar used and the values of a/R and S/R were not precisely the same as those used in the present work. Nonetheless, by far, the GMTS and EMTSN criteria have been validated as effective mixed-mode fracture criteria to characterize KIIc for marble and concrete [14,18,21,36]. Hence, they are capable of predicting shearing-mode fractures.
However, those criteria are applicable mostly for homogeneous brittle materials such as glass, rock, and concrete without reinforcement. Razmi and Mirsayar [40] and Karimzadeh, et al. [41] used SCB tests to investigate mixed-mode (types I and II) fractures in concrete SCCND specimens reinforced with fibers. Karimzadeh, et al. [41] also concluded that the GMTS criterion outperforms other mixed-mode fracture criteria, but it underestimated KIIc according to their dimensionless KII/KIcKI/KIc diagram. This underestimation of KIIc might have been due to adding fiber reinforcement to plain concrete, thereby enhancing the mechanical performance, including Young’s elastic modulus and fracture toughness.
On the other hand, the relationship between CMOD and KI was also explored, according to Adamson, et al. [34]. Based on the CMOD–KI relationship established by Mubaraki and Sallam [35] in Equation (3), Figure 14B shows a perfect linear regression fitting (R2 = 0.999) between the two variables with the same physical dimensions, with a slope of 9.604 and an intercept of −2.395. This finding also agrees with the linear relationship between CMOD and KI for pavement material (containing asphalt) reported by Mubaraki and Sallam [35]. Because it was examined for pavement material in the previous study and plain concrete in the present work, this linear relationship might be universal for most brittle materials; nevertheless, more types of brittle materials should be examined by SCB tests in the future to conclude that rigorously.

3.7. Limitations and Prospects

The limitations and prospects of this study can be summarized as follows. First, a few significant STDs were encountered due to possible human operating error, the eccentricity of the top loading point, local heterogeneity in the concrete specimens (the embedded fine and coarse aggregates), and unperfect quasi-2D tests (de facto., 3D tests with a thickness B = 30 mm) compared to the actual 2D plain applicable in analytical analysis and numerical simulations [14]. Second, the uncertainty analysis regarding those issues is worth further pursuing with quantitative analysis, as comprehensively examining various SCB test settings in former studies [31]. Third, as this study narrowed down the research focus merely on mixed-mode fracturing (types I and II) for SCB tests on chevron notch disks having sharp tips instead of a straight-through notch, many other influencing factors, such as the effects of aggregate size [42], cyclic loading [43], another mixed-model fracturing (types I and III) [44], etc., have not been sufficiently considered at the initial stage of this study and should, therefore, be further investigated in the future works. Last, the other numerical method, the discrete element method (DEM) [45], can be additionally involved in future numerical modelling mixed-mode fracturing behavior to explore the dependence of different numerical methods.

4. Summary and Concluding Remarks

In practice, cracked concrete structures sometimes experience mixed-mode loading combining tensile and shearing modes (types I and II). Motivated by this, many SCB tests have been carried out under this mixed-mode loading condition to study concrete fracturing behavior. Many earlier studies were focused on either tensile (type I) loading or this mixed-mode loading condition by using a straight-through notch in pre-cracked concrete specimens. However, despite the success of using a chevron notch with a sharp cracking tip in rock SCB tests, concrete SCB tests have rarely been conducted with such sharp cracking tips. Also, the bluntness of the pre-existing notch tip could undermine the determination of the fracture toughness of the tensile mode (KIc).
Therefore, the present study investigated mixed-mode (types I and II) fracture propagation in many concrete specimens in SCCNDs both experimentally using SCB tests and numerically using FRANC2D simulations. In total, ten CCNBD specimens with five different chevron notch angles (0–70°) were prefabricated using concrete CCNBD molds, and each circular specimen was split equally into two SCCND specimens with the same inclined angle of the chevron notch (β). Because the present work was focused mainly on mixed-mode fracturing rather than other influential factors, various β angles were manufactured from 0° to 70°, while the other SCB settings remained the same. The SCB tests were carried out using a three-point loading frame, and the CMOD of the notch was measured constantly using a COD transducer. However, because those tests were incapable of detecting the stress distributions in the SCCND specimens, FEM numerical simulations were performed using FRANC2D to replicate them for both comparison and stress-distribution analysis. The following conclusions are drawn based on the results from the SCB tests and FRACN2D simulations.
  • Concrete SCB tests with SCCND specimens with a sharp notch tip are reliable and robust for studying mixed-mode (types I and II) fracture propagation in concrete because of their reliable results and relatively small standard deviations of all testing variables.
  • The maximum failure load (Pmax) increases with increasing inclination angle (β).
  • The fracture propagation angle (θ) also increases with increasing β, and the phenomenon of wing fractures can be observed.
  • As powerful software for linear elastic fracture mechanics, FRANC2D can successfully simulate SCB tests with the same loading conditions in terms of fracture propagation in SCCND specimens.
  • Despite the fact that the compressive normal stress concentrations in the SCCND specimen are adjacent to the three loading points, most variations of the normal stress distributions occur around the prefabricated chevron notch.
  • With increasing β, the tensile stress concentration around the notch tip moves toward the upper face of the notch, and the compressive stress concentration forms at the notch tip to turn the tensile loading mode into the shearing one.
  • The stress distributions along the upper and lower faces of the chevron notch can be produced by FRANC2D for quantitative analysis, and this stress analysis also verifies the previous findings about stress-distribution variations.
  • The tensile mode (type I) can be generated when β = 0–30° because the CMOD increases, indicating the crack opening under tensile loading. In contrast, the mixed mode (types I and II) becomes more evident for β = 45–70°, with the CMOD decreasing, indicating the crack closing under both tensile and shearing loading conditions.
  • The FPZ can be found for β = 0–30° but not for β = 45–70°, which basically agrees with the CCNBD tests simulated in a previous numerical study.
  • The tensile SIF decreases monotonically with increasing β, whereas the shear SIF increases from zero for β = 0° to a peak value for β = 45–60° and then decreases when β is increased to 70°.
  • Four fracture criteria—MTS, G, GMTS, and EMTSN—were examined against the experimental results. The GMTS and EMTSN criteria outperform the MTS and G ones. In particular, compared with the experimental results, the newly developed EMTSN criterion characterizes most precisely the critical fracture toughness of both tensile and shearing (KIc and KIIc).
  • There is a linear relationship between CMOD and KI for concrete SCB tests. However, because it has been examined for both asphalt and concrete, it deserves further investigation for other brittle materials.
In summary, this study investigates concrete SCB tests with a chevron notch (sharp tip) that was initially designed for Brazilian disk tests of rock samples. Based on the testing result, the modified test has been validated as a robust method when applying this type of notch instead of the standard straight-through notch. Numerical fracturing simulations could successfully replicate the fracturing behavior generated by mechanical tests. GMTS and EMTSN criteria have been verified as the two most reliable fracture criteria for concrete material compared to others. In addition, a linear relationship (CMOD-KI) previously discovered for asphalt SCB tests has been confirmed for concrete SCCND specimens. This work brings more physical insights into mixed-mode fracturing propagation in concrete material.

Author Contributions

Conceptualization, X.L.; Data curation, X.L. and G.Y.; Formal analysis, X.L. and G.Y.; Investigation, X.L.; Methodology, X.L.; Validation, X.L. and G.Y.; Writing—original draft, X.L.; Writing—review & editing, X.L. and G.Y. All authors have read and agreed to the published version of the manuscript.

Funding

This research received no external funding.

Data Availability Statement

The raw data supporting the conclusions of this article will be made available by the authors without undue reservation.

Acknowledgments

This work was supported by the School of Civil Engineering, University of Queensland. In addition, the first author would like to acknowledge the support from Nazife Erarslan. Finally, the first author is also very grateful to Shane Walker and Graham Rule for their assistance at the Material Testing Laboratory, University of Queensland. This work was once presented at the 4th International Congress on Technology Engineering & Science (4th ICONTES) on 5 August 2017 in Kuala Lumpur, Malaysia, and a provisional conference abstract has been collected in the proceedings of the 4th ICONTES (http://procedia.org/cpi/ICONTES-4-2110846).

Conflicts of Interest

The authors declare no conflict of interest.

References

  1. Walton, W. Brittle Materials. Nature 1958, 181, 1577–1579. [Google Scholar] [CrossRef]
  2. Lemaitre, J.; Desmorat, R. Failure of Brittle and Quasi-Brittle Materials. In Engineering Damage Mechanics; Springer: Berlin/Heidelberg, Germany, 2005; pp. 321–371. [Google Scholar]
  3. Griffith, A.A., VI. The phenomena of rupture and flow in solids. Philos. Trans. R. Soc. Lond. Contain. Pap. Math. Phys. Character 1921, 221, 163–198. [Google Scholar]
  4. Whittaker, B.N.; Singh, R.N.; Sun, G. Rock Fracture Mechanics. Principles, Design and Applications; Elsevier: Amsterdam, The Netherlands, 1992. [Google Scholar]
  5. Barenblatt, G. Equilibrium cracks formed during brittle fracture rectilinear cracks in plane plates. J. Appl. Math. Mech. 1959, 23, 1009–1029. [Google Scholar] [CrossRef]
  6. Dugdale, D.S. Yielding of steel sheets containing slits. J. Mech. Phys. Solids 1960, 8, 100–104. [Google Scholar] [CrossRef]
  7. Lawn, B.R. Fracture of brittle solids. In Cambridge Solid State Science Series; Cambridge University Press: Cambridge, UK, 1993. [Google Scholar]
  8. Lim, I.; Johnston, I.; Choi, S. Stress intensity factors for semi-circular specimens under three-point bending. Eng. Fract. Mech. 1993, 44, 363–382. [Google Scholar] [CrossRef]
  9. Shah, S.P.; Swartz, S.E.; Ouyang, C. Fracture Mechanics of Concrete: Applications of Fracture Mechanics to Concrete, Rock and Other Quasi-Brittle Materials; John Wiley & Sons: Hoboken, NJ, USA, 1995. [Google Scholar]
  10. Bocca, P.; Carpinteri, A.; Valente, S. Mixed mode fracture of concrete. Int. J. Solids Struct. 1991, 27, 1139–1153. [Google Scholar] [CrossRef]
  11. Sih, G.C. Strain-energy-density factor applied to mixed mode crack problems. Int. J. Fract. 1974, 10, 305–321. [Google Scholar] [CrossRef]
  12. Shen, B.; Stephansson, O. Cyclic loading characteristics of joints and rock bridges in a jointed rock specimen. In Proceedings of the International Symposium on Rock Joints, Loen, Norway, 4–6 June 1990; pp. 725–729. [Google Scholar]
  13. Lim, W.K.; Lee, C.S. Evaluation of stress intensity factors for a crack normal to bimaterial interface using isoparametric finite elements. Eng. Fract. Mech. 1995, 52, 65–70. [Google Scholar]
  14. Erarslan, N. Analysing mixed mode (I–II) fracturing of concrete discs including chevron and straight-through notch cracks. Int. J. Solids Struct. 2019, 167, 79–92. [Google Scholar] [CrossRef]
  15. Ayatollahi, M.; Aliha, M.; Saghafi, H. An improved semi-circular bend specimen for investigating mixed mode brittle fracture. Eng. Fract. Mech. 2011, 78, 110–123. [Google Scholar] [CrossRef]
  16. Shi, Z. Crack Analysis in Structural Concrete: Theory and Applications; Butterworth-Heinemann: Oxford, UK, 2009. [Google Scholar]
  17. Bažant, Z.P.; Oh, B.H. Crack band theory for fracture of concrete. Matériaux Constr. 1983, 16, 155–177. [Google Scholar] [CrossRef]
  18. Mirsayar, M.; Razmi, A.; Berto, F. Tangential strain-based criteria for mixed-mode I/II fracture toughness of cement concrete. Fatigue Fract. Eng. Mater. Struct. 2018, 41, 129–137. [Google Scholar] [CrossRef]
  19. Aliha, M.; Mahdavi, E.; Ayatollahi, M. Statistical analysis of rock fracture toughness data obtained from different chevron notched and straight cracked mode I specimens. Rock Mech. Rock Eng. 2018, 51, 2095–2114. [Google Scholar] [CrossRef]
  20. Xu, Y.; Dai, F.; Zhao, T.; Xu, N.-W.; Liu, Y. Fracture toughness determination of cracked chevron notched Brazilian disc rock specimen via Griffith energy criterion incorporating realistic fracture profiles. Rock Mech. Rock Eng. 2016, 49, 3083–3093. [Google Scholar] [CrossRef]
  21. Luo, L.; Erarslan, N.; Mu, Z. Mixed-Mode Fracturing of Concrete—Numerical and Experimental Study using SCCD Specimens. In Recent Advances in Material, Analysis, Monitoring, and Evaluation in Foundation and Bridge Engineering; ASCE Library: Reston, VA, USA, 2014; pp. 25–37. [Google Scholar]
  22. Kuruppu, M.D.; Obara, Y.; Ayatollahi, M.R.; Chong, K.; Funatsu, T. ISRM-suggested method for determining the mode I static fracture toughness using semi-circular bend specimen. Rock Mech. Rock Eng. 2014, 47, 267–274. [Google Scholar] [CrossRef]
  23. Wawrzynek, P.A.; Ingraffea, A. Interactive finite element analysis of fracture processes: An integrated approach. Theor. Appl. Fract. Mech. 1987, 8, 137–150. [Google Scholar] [CrossRef]
  24. Henshell, R.; Shaw, K. Crack tip finite elements are unnecessary. Int. J. Numer. Methods Eng. 1975, 9, 495–507. [Google Scholar] [CrossRef]
  25. Gómez, F.; Elices, M. A fracture criterion for blunted V-notched samples. Int. J. Fract. 2004, 127, 239–264. [Google Scholar] [CrossRef]
  26. Chen, D.; Ozaki, S. Investigation of failure criteria for a sharp notch. Int. J. Fract. 2008, 152, 63–74. [Google Scholar] [CrossRef]
  27. Erarslan, N.; Williams, D. Mixed-mode fracturing of rocks under static and cyclic loading. Rock Mech. Rock Eng. 2013, 46, 1035–1052. [Google Scholar] [CrossRef]
  28. Ayatollahi, M.R.; Aliha, M.R.M.; Hassani, M.M. Mixed mode brittle fracture in PMMA—An experimental study using SCB specimens. Mater. Sci. Eng. A 2006, 417, 348–356. [Google Scholar] [CrossRef]
  29. Ayatollahi, M.R.; Aliha, M.R.M. On determination of mode II fracture toughness using semi-circular bend specimen. Int. J. Solids Struct. 2006, 43, 5217–5227. [Google Scholar] [CrossRef]
  30. Kuruppu, M.D.; Chong, K.P. Fracture toughness testing of brittle materials using semi-circular bend (SCB) specimen. Eng. Fract. Mech. 2012, 91, 133–150. [Google Scholar] [CrossRef]
  31. Ayatollahi, M.R.; Aliha, M.R.M. Wide range data for crack tip parameters in two disc-type specimens under mixed mode loading. Comput. Mater. Sci. 2007, 38, 660–670. [Google Scholar] [CrossRef]
  32. Chang, S.-H.; Lee, C.-I.; Jeon, S. Measurement of rock fracture toughness under modes I and II and mixed-mode conditions by using disc-type specimens. Eng. Geol. 2002, 66, 79–97. [Google Scholar] [CrossRef]
  33. Lanaro, F.; Sato, T.; Stephansson, O. Microcrack modelling of Brazilian tensile tests with the boundary element method. Int. J. Rock Mech. Min. Sci. 2009, 46, 450–461. [Google Scholar] [CrossRef]
  34. Adamson, R.; Dempsey, J.; Mulmule, S. Fracture analysis of semi-circular and semi-circular-bend geometries. Int. J. Fract. 1996, 77, 213–222. [Google Scholar] [CrossRef]
  35. Mubaraki, M.; Sallam, H. Reliability study on fracture and fatigue behavior of pavement materials using SCB specimen. Int. J. Pavement Eng. 2020, 21, 1563–1575. [Google Scholar] [CrossRef]
  36. Aliha, M.; Ayatollahi, M.R. Mixed mode I/II brittle fracture evaluation of marble using SCB specimen. Procedia Eng. 2011, 10, 311–318. [Google Scholar] [CrossRef]
  37. Erdogan, F.; Sih, G. On the crack extension in plates under plane loading and transverse shear. J. Basic Eng. 1963, 85, 519–525. [Google Scholar] [CrossRef]
  38. Backers, T. Fracture Toughness Determination and Micromechanics of Rock under Mode I and Mode II Loading; GeoForschungsZentrum: Potsdam, Germany, 2005. [Google Scholar]
  39. Rao, Q.; Sun, Z.; Stephansson, O.; Li, C.; Stillborg, B. Shear fracture (Mode II) of brittle rock. Int. J. Rock Mech. Min. Sci. 2003, 40, 355–375. [Google Scholar] [CrossRef]
  40. Razmi, A.; Mirsayar, M. On the mixed mode I/II fracture properties of jute fiber-reinforced concrete. Constr. Build. Mater. 2017, 148, 512–520. [Google Scholar] [CrossRef]
  41. Karimzadeh, H.; Razmi, A.; Imaninasab, R.; Esminejad, A. The influence of natural and synthetic fibers on mixed mode I/II fracture behavior of cement concrete materials. Can. J. Civ. Eng. 2019, 46, 1081–1089. [Google Scholar] [CrossRef]
  42. Golewski, G.L. Effect of Coarse Aggregate Grading on Mechanical Parameters and Fracture Toughness of Limestone Concrete. Infrastructures 2023, 8, 117. [Google Scholar] [CrossRef]
  43. Alrayes, O.; Könke, C.; Hamdia, K.M. A Numerical Study of Crack Mixed Mode Model in Concrete Material Subjected to Cyclic Loading. Materials 2023, 16, 1916. [Google Scholar] [CrossRef] [PubMed]
  44. Sreenath, S.; Mohan, K.S.R.; Murali, G. Fracture Toughness of Reactive Powder Fibrous Concrete Composites under Pure and Mixed Modes (I/III). Buildings 2022, 12, 599. [Google Scholar] [CrossRef]
  45. Zhu, R.; Gao, H.; Zhan, Y.; Wu, Z.-X. Construction of Discrete Element Constitutive Relationship and Simulation of Fracture Performance of Quasi-Brittle Materials. Materials 2022, 15, 1964. [Google Scholar] [CrossRef]
Figure 1. Influential factors for stress intensity factor (SIF): (A) examples of crack geometry and orientation; (B) three fundamental fracture modes.
Buildings 13 02633 g001
Figure 2. Concrete semi-circular chevron-notched disk (SCCND) specimens with various chevron notch angles (β): (A) schematic of SCCND specimen and chevron notch therein; (B) testing group 1 (β = 0°, 30°); (C) testing group 2 (β = 0°, 30°, 45°, 70°); (D) testing group 3 (β = 0°, 30°, 45°, 60°).
Buildings 13 02633 g002
Figure 3. Semi-circular bend (SCB) test: (A) schematic; (B) photograph of a three-point bend loading frame (i.e., flexural bend fixture); (C) measurement of crack mouth opening displacement (CMOD).
Buildings 13 02633 g003
Figure 4. Simulation setup of SCB test in FRANC2D (left) and mesh geometry by CASCA (right).
Buildings 13 02633 g004
Figure 5. Variations of YI and YII with β = 0–70° for S/R = 0.8 and a/R = 0.45; YI and YII were calculated using interpolation between the settings of a/R = 0.4 and 0.5 for the same S/R = 0.8 from the comprehensive datasets for YI and YII provided by Ayatollahi and Aliha [31].
Buildings 13 02633 g005
Figure 6. Variations of mean value and standard deviation of Pmax with β.
Buildings 13 02633 g006
Figure 7. Tested SCCNDs: (A) testing group 1; (B) testing group 2; (C) testing group 3.
Buildings 13 02633 g007
Figure 8. Variations of mean value and standard deviation of θ with β.
Buildings 13 02633 g008
Figure 9. Numerically simulated stress distributions before fracture initiation: (A) β = 0°; (B) β = 30°; (C) β = 45°; (D) β = 60°; (E) β = 70° (white = tensile stress; orange = compressive stress).
Buildings 13 02633 g009
Figure 10. Normal and shear stress distributions around the chevron notch for various values of β: (A) normal stress on the upper face; (B) normal stress on the lower face; (C) shear stress on the upper face; (D) shear stress on the lower face (position value equals element number) (the angle β = 60° is not considered due to very close to β = 70°, and there is no significant difference in this regard).
Buildings 13 02633 g010
Figure 11. Fracture propagation simulated numerically by FRANC2D (left) compared with that in SCB tests (right) for various values of β: (A) β = 0°; (B) β = 30°; (C) β = 45°; (D) β = 60°; (E) β = 70°.
Buildings 13 02633 g011
Figure 12. Determination of CMOD in concrete SCCND specimens from SCB tests (the negative value indicates chevron notch closing and the positive value indicates its opening, and the angle β = 60° is not considered due to very close to β = 70°, and there is insignificant difference in this regard).
Buildings 13 02633 g012
Figure 13. Values of (A) KI and (B) KII for various values of β.
Buildings 13 02633 g013
Figure 14. Fracture analysis: (A) KI/KIc versus KII/KIc to determine KIIc = 0.3KIc under GMTS and EMTSN criteria in comparison with conventional criteria, including both MTS and G criteria; (B) relationship between CMOD and SIF for concrete SCCND specimens.
Buildings 13 02633 g014
Table 1. Maximum failure load (Pmax) on concrete SCCND specimens manufactured by splitting each CCNBD specimen equally into first and second half CCNBD specimens.
βPmax [kN]Group 1Group 2Group 3MeanSTD
First half CCNBD0.6870.2110.5290.4830.232
Second half CCNBD0.7670.1410.563
30°First half CCNBD0.6630.5200.1930.5710.182
Second half CCNBD0.7460.6700.632
45°First half CCNBD0.7400.8880.8670.098
Second half CCNBD0.8301.010
60°First half CCNBD1.0111.1120.101
Second half CCNBD1.213
70°First half CCNBD1.1850.9830.203
Second half CCNBD0.780
Table 2. Values of β and θ for all three testing groups.
βFracture Propagation Angle (θ)
Group 1Group 2Group 3MeanSTD
0–10°0–5°2–5°
30°30–45°55–68°5–15°36°22°
45°38–57°55–65°54°10°
60°78–80°79°
70°44–96°80–96°79°21°
Table 3. Comparison of simulated and measured values of θ for selected values of β.
β30°45°60°70°
θ (FRANC2D)56°85°95°107°
θ (Experiment)55°65°80°96°
Table 4. Values of tensile SIF (KI); two SCCND specimens with the same settings were manufactured by splitting each CCNBD specimen equally into first and second half CCNBD specimens.
β K I [ MPa · m ]Group 1Group 2Group 3MeanSTD
First half CCNBD0.3760.1160.2900.2650.127
Second half CCNBD0.4200.0770.308
30°First half CCNBD0.2310.1810.0670.1990.063
Second half CCNBD0.2600.2330.220
45°First half CCNBD0.1510.1810.1770.020
Second half CCNBD0.1700.206
60°First half CCNBD0.1190.1310.012
Second half CCNBD0.142
70°First half CCNBD0.0820.0680.014
Second half CCNBD0.054
Table 5. Values of shearing SIF (KII); two SCCND specimens with the same settings were manufactured by splitting each CCNBD specimen equally into first and second half CCNBD specimens.
β K I I [ MPa · m ]Group 1Group 2Group 3MeanSTD
First half CCNBD0.0000.0000.0000.000.00
Second half CCNBD0.0000.0000.000
30°First half CCNBD0.0860.0680.0250.0740.024
Second half CCNBD0.0970.0870.082
45°First half CCNBD0.0840.1000.0980.011
Second half CCNBD0.0940.114
60°First half CCNBD0.0880.0970.009
Second half CCNBD0.105
70°First half CCNBD0.0720.0600.012
Second half CCNBD0.047
Disclaimer/Publisher’s Note: The statements, opinions and data contained in all publications are solely those of the individual author(s) and contributor(s) and not of MDPI and/or the editor(s). MDPI and/or the editor(s) disclaim responsibility for any injury to people or property resulting from any ideas, methods, instructions or products referred to in the content.