Article

Experimental Investigation on Interfacial Defect Detection for SCCS with Different Contact NDT Technical

by
Fernando Antonio da Silva Fernandes
1,2,*,
Joseph Salem Barbar
3,
Dayriane do Socorro de Oliveira Costa
4 and
João Adriano Rossignolo
2
1
Department of Biosystems Engineering, University of São Paulo, USP, Av. Duque de Caxias Norte, 225, Pirassununga, SP, Brazil
2
Department of Engineering, Federal University of Pará—Campus Salinópolis, Rua Raimundo Santana Cruz, S/N, Bairro São Tomé, Salinópolis, PA, Brazil
3
Faculty of Civil Engineering, Federal University of Uberlândia. Av. João Naves de Ávila, 2121, Uberlândia, MG, Brazil
4
Department of Engineering, Federal University of Rio de Janeiro, Rio de Janeiro, RJ, Brazil
*
Author to whom correspondence should be addressed.
Buildings 2023, 13(10), 2549; https://doi.org/10.3390/buildings13102549
Submission received: 31 August 2023 / Revised: 15 September 2023 / Accepted: 22 September 2023 / Published: 9 October 2023
(This article belongs to the Special Issue Advanced Studies in Concrete Materials)

Abstract

:
Knowledge about air-incorporating additives in concrete can favor civil construction with structures that are lighter and more economical. This study investigated the production of concretes with the addition of 1 to 3% of air-entraining additive via the Micro-CT imaging technique. From the microtomography obtained, it was possible to obtain two-dimensional and three-dimensional images of the analyzed samples. The analysis of these images, using FEI Avizo 9.0 image processing software, allowed for obtaining the volumes of concrete, mortar, voids, and porosities of concrete mortars, in addition to the quantities, shapes, and dimensions of pores (voids) present in the samples. The air contents of the concrete with incorporated air were higher than the reference concrete, directly proportional to the additive contents used, and very close to the mixes with the same additive contents. Both the standard and modified mixes showed an increase in air content as the additive content increased. The specific mass of the concretes decreased as the additive content increased in the standard and modified concretes. As for consistency, the air-incorporated concretes showed greater slumps compared to the reference concrete and increased as the additive content increased, demonstrating the action of the air-incorporating additive in improving workability.

1. Introduction

In the last century, the construction of tall buildings has been increasingly common throughout the world [1]. This increases the demand for concrete, making it the most consumed material in the world [2,3], with production of approximately 10 billion cubic meters [4]. According to its density, concrete can be classified as conventional, heavy, and light [5]. Conventional Reinforced concrete (RC) and steel–concrete composite structures (SCCSs) [1] can be produced and have their technological properties improved using the addition of additives in their composition that incorporate new properties into conventional concrete, which aim to provide performances suitable in particular application situations, with emphasis on lightweight concrete mixtures [6,7].
Lightweight concrete is widely used in the construction industry [5] and is categorized as lightweight aggregates, aerated, and foamed concrete. Lightweight concrete can be produced by adding lighter materials to the mixture to replace conventional materials such as glass foams [6,8], bamboo fibers [9], waste PET bottles [10], glass bottles [11], or the addition of air-entraining admixtures (AEAs), which are used in order to create macro pores that reduce the pressure of ice formation in the binding matrix. Air-entraining additives were discovered in the 1930s in New York City after concrete collapsed, and air-entraining agents are primarily used to ensure a quality air void system that protects concrete from frost damage. AEAs also affect many additional fresh and hardened concrete properties [12,13]. Foamed concrete (FC) receives randomly distributed air bubbles in the cement paste [14]. It has a low density (400~1850 Kg/m3) [15,16], thermal conductivity (0.06~0.66 W/mK), and low compressive strength (1~30 MPa) [17]. The air-entrained admixtures produce a high number of small stable air bubbles, separated from one another and uniformly distributed in the range of a few micrometers (μm). The entrained air bubbles increase the porosity of the concrete and affect specific properties such as workability and permeability [18]. Other desirable properties in concrete, such as resistance, dimensional stability, and durability, are equally influenced by the proportion of the concrete paste as they are by the microstructure; these, in turn, depend on the dimensions, quantity, and distribution of these bubbles [19]. The reduction in density in this type of concrete reduces structural stresses, making this concrete widely used [6,20,21]. In Brazil, lightweight concrete is widely used in the construction of monolithic panels for sealing buildings, mainly in social action projects, due to its low cost [16].
The durability of concrete is strongly influenced by the distribution of pores [16,22], which can indicate and define the durability of the concrete [23,24]. Concrete porosity can be reduced when carbonates begin to occupy a larger volume than hydroxides. The density of the material is favored by the formation of carbonates within the structure [22]. The continuity of the pores in the cement paste hardened at any stage during the cement hydration process will determine the concrete’s permeability coefficient [25]. Identifying porosity (the shape, quantity, distribution, and connectivity of pores) in concrete allows for evaluating the influence of the air-entrained additive on its microstructure and consequently identifying its properties, such as strength and durability [22,26]. Concentrations of very close or interconnected air bubbles reduce the compressive strength, facilitate the entry of aggressive agents, and cause premature corrosion of reinforcement in lightweight concrete with air entrainment [27,28]. Identifying the microstructure of concrete allows for the development of additions, mix proportions, and execution techniques, aimed at minimizing internal stresses, shrinkage, and consequent undesired cracks [22,29]. As a result of the comprehensive influence of cyclic loading, periodical temperature, unscientific pouring process, and severe corrosive service environment, inter-facial imperfections including bond-slip and debonding defects occur, leading to the deterioration of service-ability and durability [1]. Non-destructive Testing (NDT) can be used to check and inspect concrete, for example, CT, IE, and UT (NDT) [1,30,31], which identify the presence of cracks and other defects and can be applied to mass production at an acceptable cost. Therefore, corresponding NDT testing techniques are needed.
Investigating the structure of concrete using images has always played an important role [32]. Computerized microtomography (Micro-CT) constitutes an X-ray inspection technique, currently employed for gaining knowledge and evaluating the concrete microstructure [3,32]. This technique allows for the acquisition of three-dimensional images with resolutions in the order of microns, along with the inspection and assessment of the internal morphology of concrete samples [16,33]. In this way, it is possible to evaluate the shape, quantity, and distribution of air bubbles entrained in the concrete by means of admixtures [3,34].
This investigation used the Micro-CT imaging technique to identify the technological properties and microstructure of concrete produced with the addition of an air entrainer with the aim of producing lightweight concrete for use in building construction.

2. Materials and Methods

The experimental program contemplated the production of concretes with varying degrees of entrained air by means of air-entrained admixtures. The materials used in the production of concrete are easily found in all regions of the country and constitute High Early Strength Portland Cement (CPV-ARI) (ABNT NBR NM 23:2000) [35] purchased at the local trade in the city of Uberlândia-MG-Brazil (18°55′8″ S, 48°16′37″ W). Water was provided by the concessionaire. Fine aggregate (sand) was extracted from the Rio Grande bed near the city of Volta Grande-MG-Brazil (21°46′15″ S, 42°32′20″ W). Coarse aggregate (Gravel Basalt N°1) was supplied by the company FCA VLI in São Sebastiao, Araguari—MG-Brazil (8°38′56″ S, 48°11′13″ W). An Additive Air incorporator based on synthetic resins (RHEOMIX 104—BASF) was acquired from the company NTC Brasil Piracicaba—SP (22°43′30″ S, 47°38′56″ W). Table 1 shows the materials used with their respective characteristics and properties.
Initially, a referential concrete mix without air-entraining admixtures was produced using dosing from the experimental dosing method of the Brazilian Portland Cement Association (ABCP) [36], adapted from the American Concrete Institute (ACI) [36]. Table 2 shows the parameters used in the dosage of the referential concrete and the resulting density ratio.
From the referential concrete (0), air-entrained concretes were dosed and produced with the addition of 1%, 3%, and 7% of the admixture over the bulk cement [37]. In this study, these concretes were designated as standards and denominated as I, II, and III, respectively. After the production of the standard concrete mixes and the entrained air content measured in its fresh state through the pressure method, concrete mixes were dosed and produced, which were designated as modified IM, IIM, and IIIM. The modified concretes were dosed and produced through the removal of large and small aggregates from the standard concretes, proportionally to their entrained air content. The quantity of water used in the concretes with admixtures included the liquid portion of the admixture without considering the solid portion. All the concretes were produced in a stationary concrete mixer using the same procedures [9], sequence, and mixing time. Table 3 shows the densities of the produced concretes.
After the finalization of each concrete mix, still in its fresh state, the entrained air content was determined by the pressure method, density, and consistency through the slump test [38]. Following this, cylindrical specimens of each concrete were molded with the dimensions of 10 cm × 20 cm (diameter × height) [39]. After being released from the mold, the specimens were cured by immersion in a hydrated lime solution (calcium hydroxide) at temperatures between 19 °C and 29 °C for a period of 90 days [38]. From these specimens, samples were taken with dimensions of 2.40 cm × 5.00 cm (diameter × height) by means of a diamond core drill, which went on to be used in the microstructure analysis of the different concrete mixes. A sample of each different concrete mix was used, where the cylindrical volume analyzed was 16 mm × 20 mm (diameter × height). The preparation of the samples constituted, after extraction, drying in a ventilated oven at temperatures between 50 °C and 60 °C for a period of 14 days in order to stabilize their internal humidity, and thereafter, were placed into plastic packaging until the moment of testing.
For sizing, quantification, and distribution analyses of the air bubbles entrained in the studied concrete, computerized microtomography (Micro-CT) X-ray technology was employed. The equipment used was the Xradia Versa XRM-510 from Zeiss (Figure 1).
From the obtained microtomography, it was possible to produce two-dimensional and three-dimensional images of the analyzed samples. The analysis of these images, by means of the image processing software FEI Avizo 9.0, allowed for the obtainment of the volumes of concrete, mortar, air voids, and porosity of the concrete mortars, in addition to the quantities, shapes, and dimensions of pores (voids) present in the samples. Table 4 shows the parameters used in the acquisition of microtomography.

3. Results

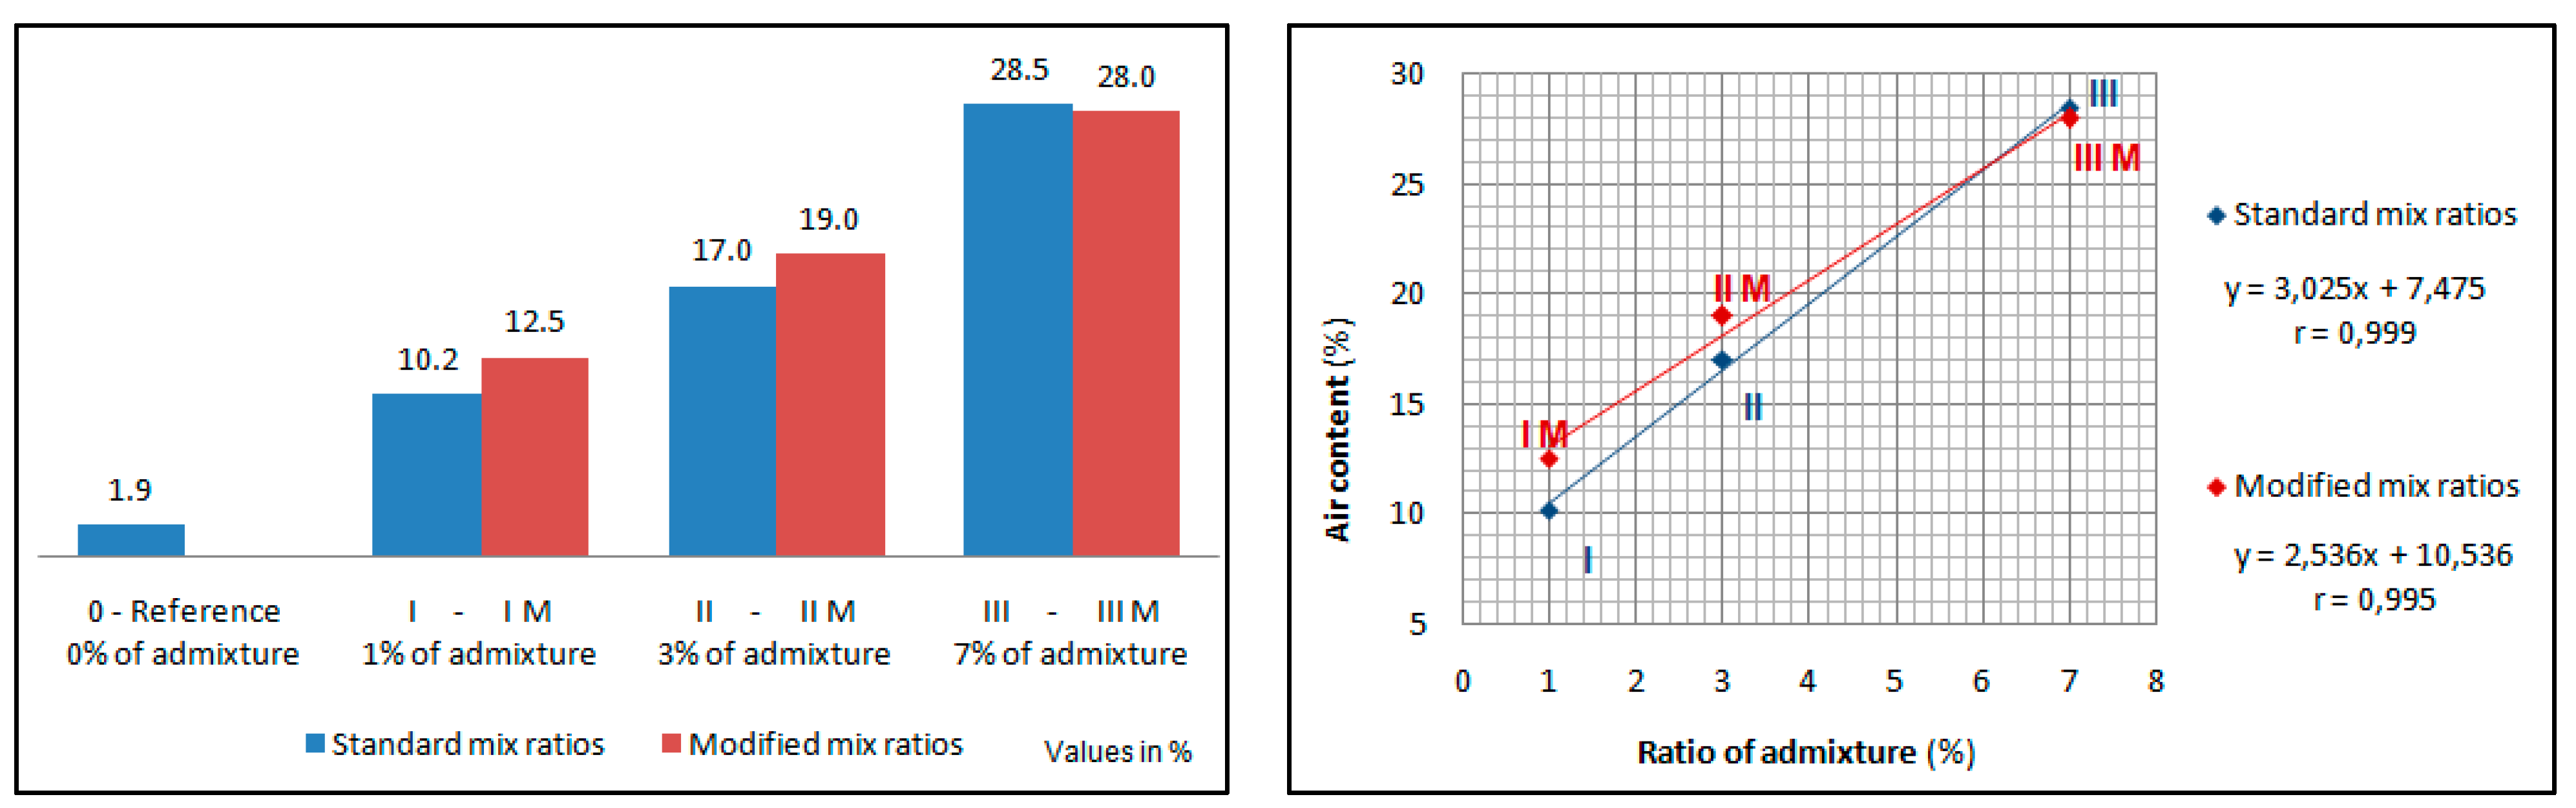
3.1. Influence of the Air Content Entrained into the Properties of Fresh Concrete
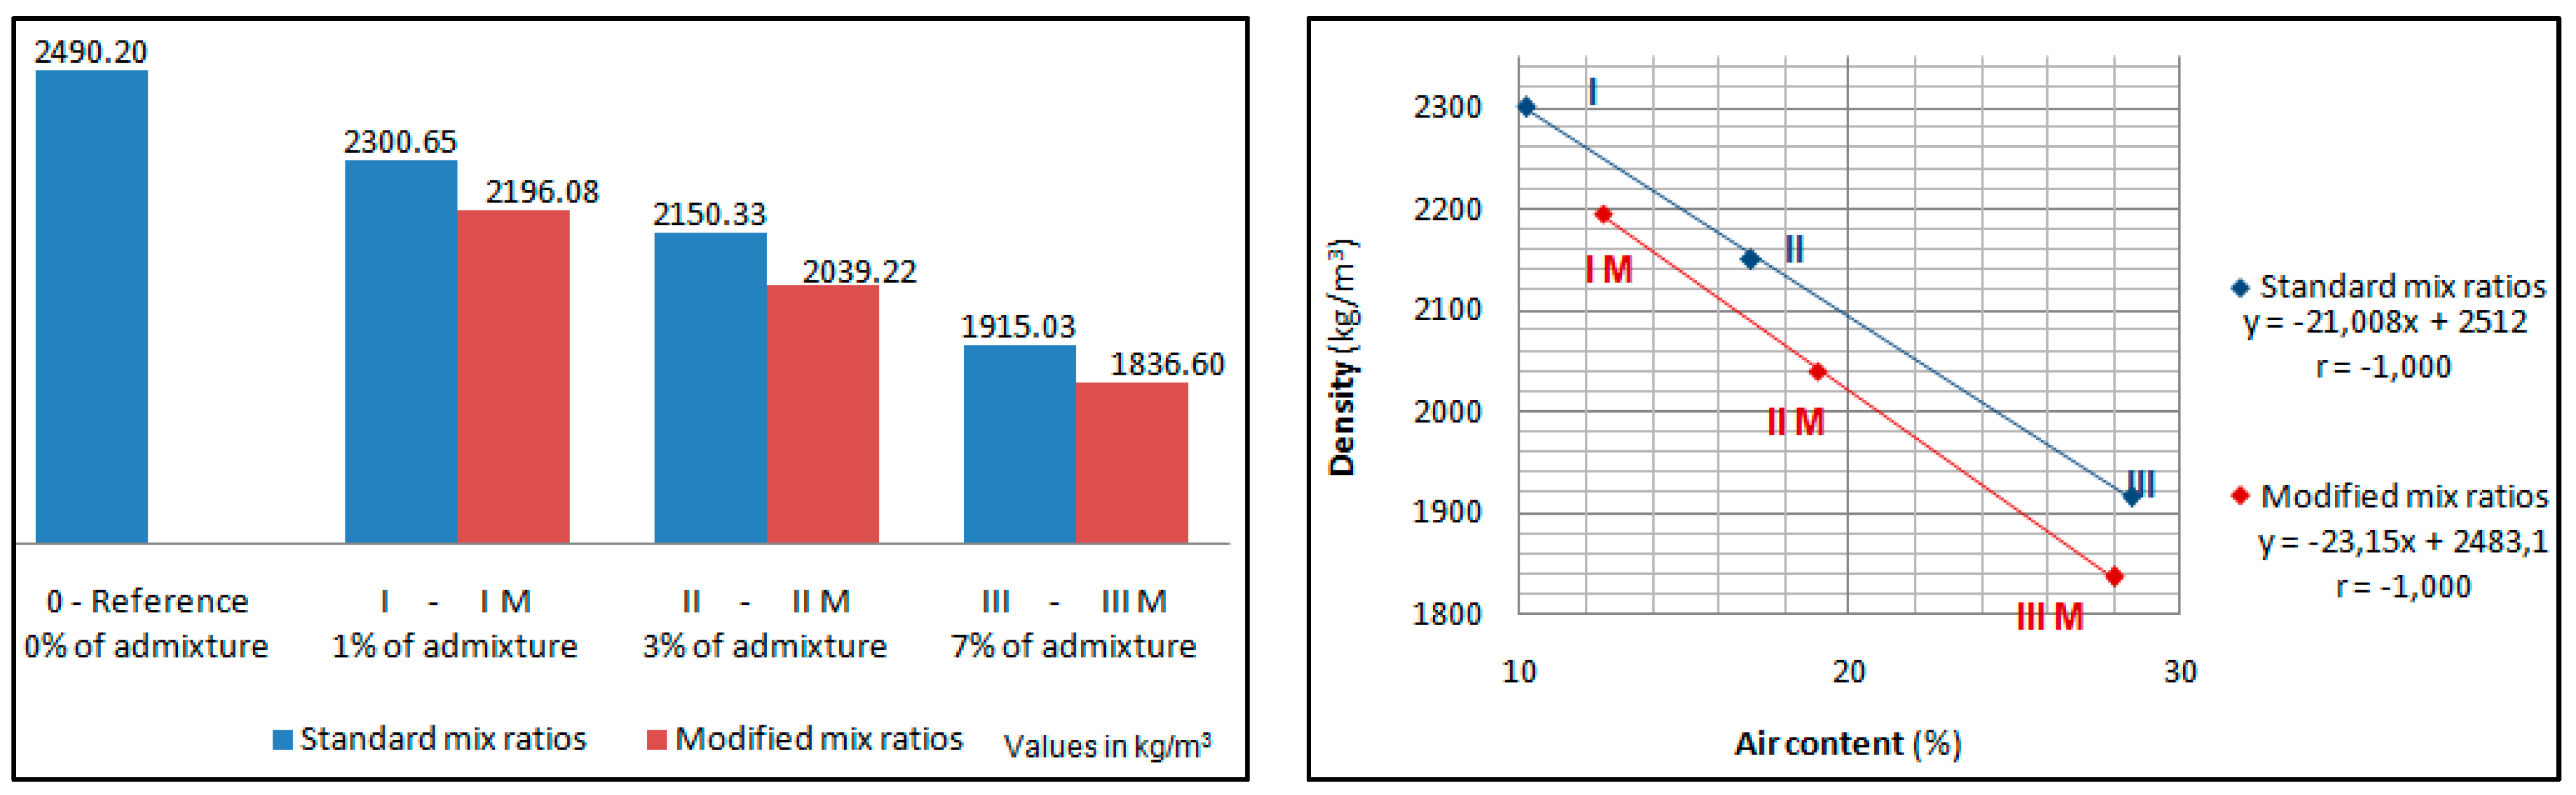
The results obtained in the air content tests by the pressure method and density and consistency by the slump test performed in fresh-state concretes are shown in Table 5.
The results presented (Table 5) on the influence of the addition of the air-entraining additive on the concrete samples investigated show that the amount of air formed within the structure is directly related to the percentage added from the additive addition. The greater the amount of additive, the greater the amount of air and, consequently, the greater the number of voids [19,37]. Concrete mixing is largely responsible for the air introduced [40,41,42], although it can also be introduced by air dissolved in mixing water or air within the cement and aggregate [43].
Figure 2 illustrates the average content of the air entrainer added to each sample tested in this study.

3.1.1. Density

According to the results illustrated in Figure 3, there is a common trend for density behavior. The density behaves inversely proportional to the amount of air-entraining additive added. Density values range from 1836.60 kg/m3 to 2300.65 kg/m3. The greater the addition of air entrainer to the mixture, the lower the density [21]. This fact may be a consequence of the increase in voids (pores), which must have favored the mortar’s ability to absorb and lose water from the mixture [19,44].

3.1.2. Consistency (Slump Test)

The air incorporated into the concrete favored consistency (Slump) increased along with the addition of the additive, which shows that air-entraining additives favor workability, a very important characteristic because it favors the pumpability of the concrete [4]. The modified concrete mixes, with lower aggregate ratios, present higher slumps in relation to standard concretes. In all concrete mixes with entrained air, the slump was directly proportional to their air content. The slump results and the correlation with the air content can be seen in Figure 4. This investigation presented contrasting results to those found in the work “Impact analysis of air-entraining and superplasticizing admixtures on concrete compressive strength” [44], where the authors found a reduction in the consistency of up to 17%. The difference in results may be related to the type and manufacturer.

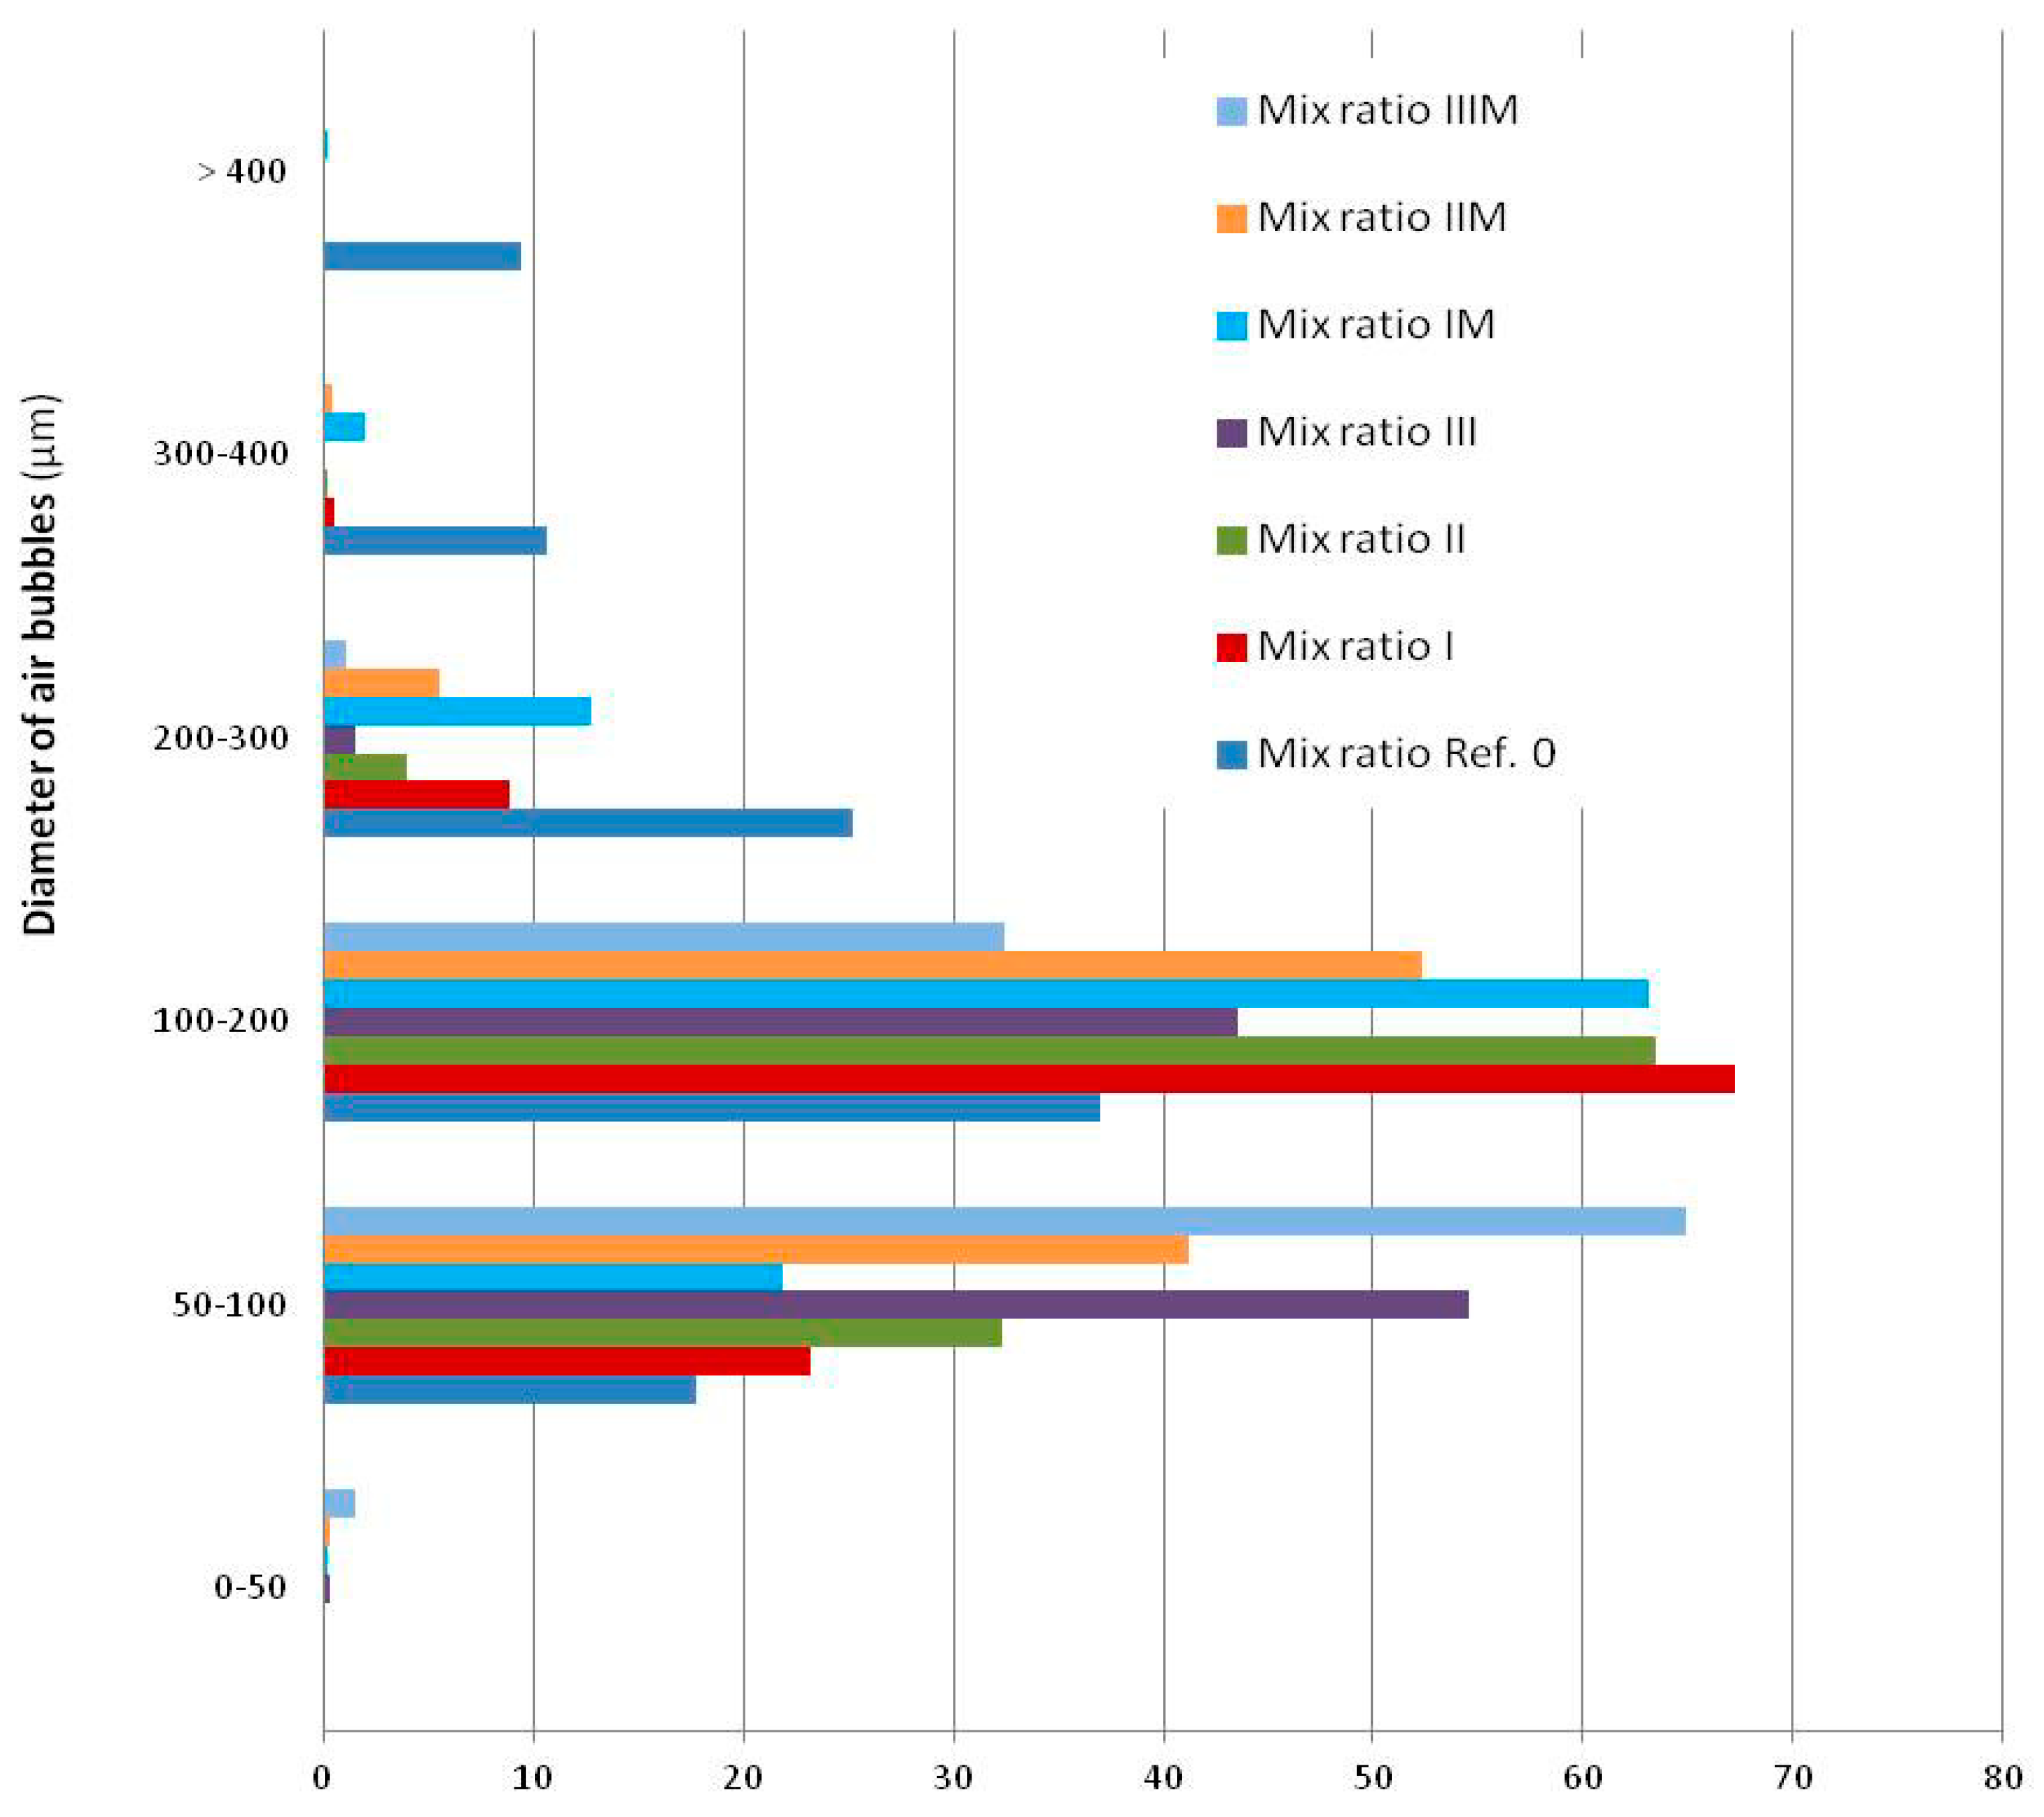
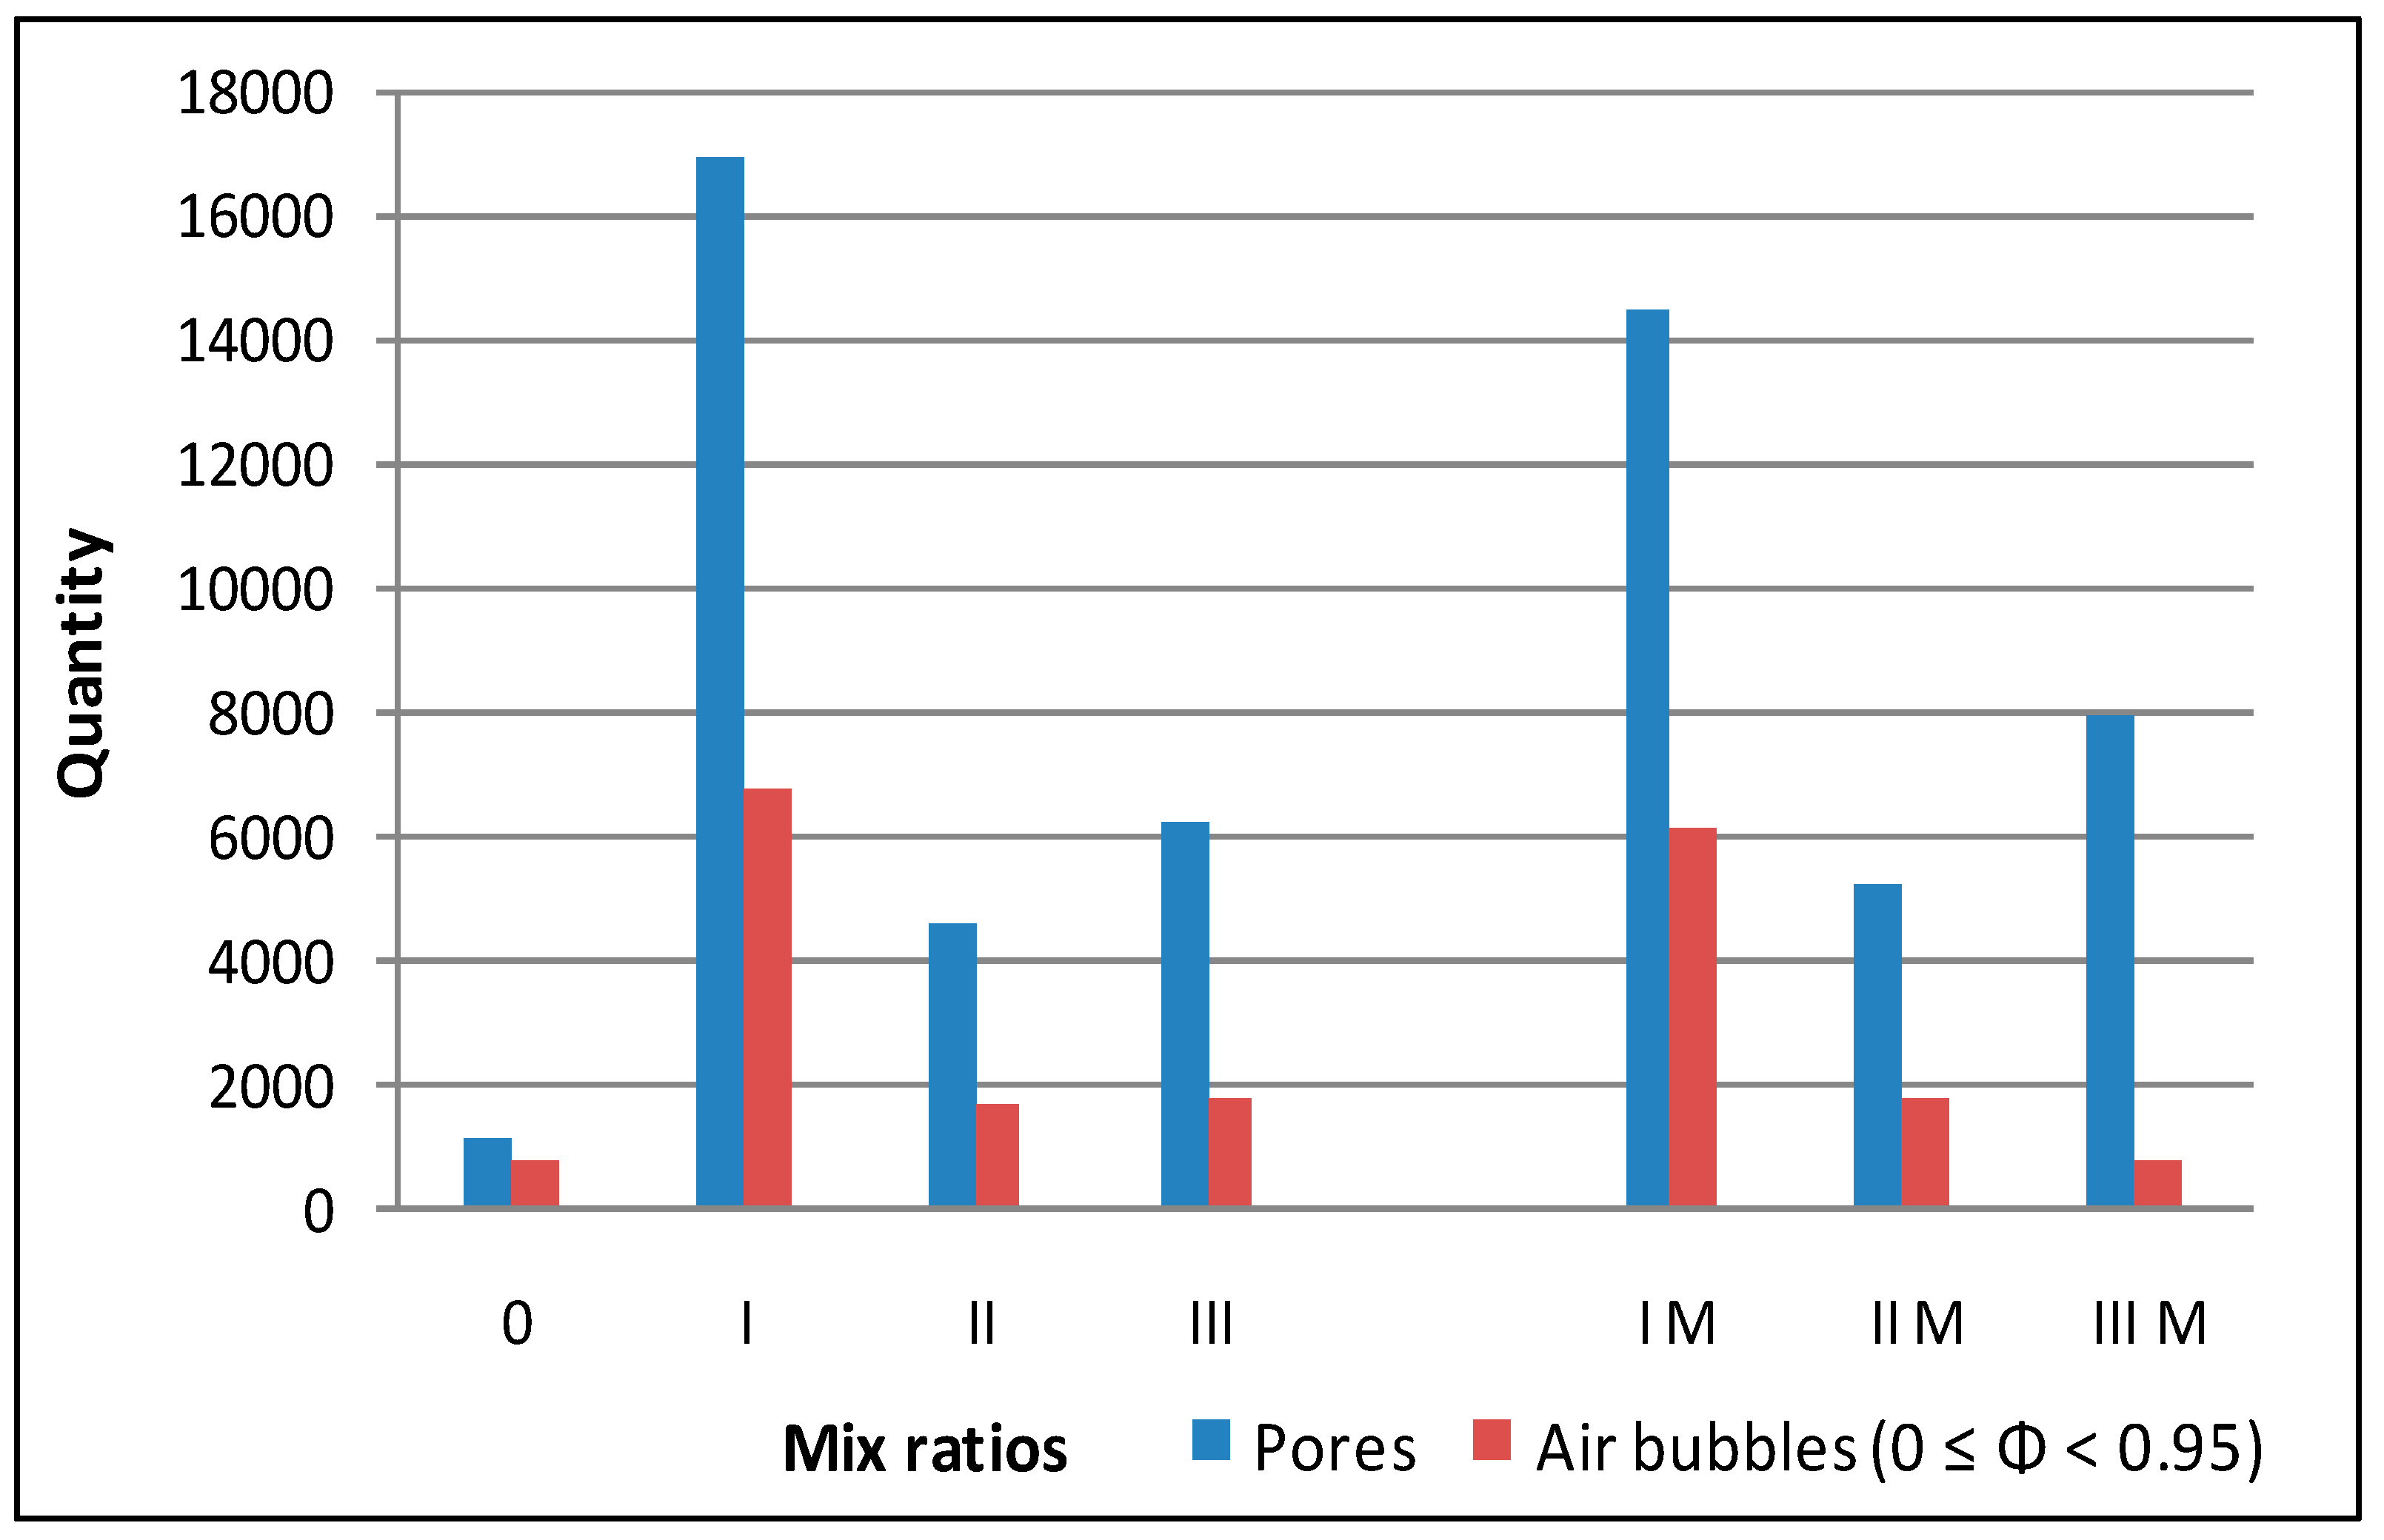
3.2. Microstructural Analysis—Micro-CT

The images obtained by X-ray computerized microtomography and Micro-CT (Figure 5) of the investigated samples illustrate the geometry of the pores and structure of the mortars, which helped to better understand the phenomenon that occurred and the results obtained [3,16]. The investigation using micro-CT was carried out because it can achieve a high level of precision [45].
Upon observing the images (Figure 5), the presence of larger diameter pores can be seen in the samples that received the additive compared to the reference trace. It is also possible to observe that the voids have different geometries. The samples that received less of the air entrainer (I and I M) presented a greater number of pores in relation to the other samples investigated [45]. Concrete mixes with an intermediate air content (II and II M) have fewer pores compared to the reference concrete.
The number of pores present in the samples is shown in Table 6.
All the concrete mixes present higher pore concentrations with equivalent diameters between 50 and 400 μm. The concrete mixes with lower entrained air content (I and I M) present higher pore concentrations with equivalent diameters between 50 and 300 μm. In the ratios with higher air content (III and III M), there was a higher incidence of pores with an equivalent diameter greater than 400 μm, whereas, with mix ratio III M, the ratio of pores with equivalent diameters between 400 and 800 μm was considerably higher. In a general sense, there existed a trend of the occurrence of pores with larger equivalent diameters in concrete mixes with higher air content. Such a fact is likely due to the coalescence of pores, which is seen in all concrete with entrained air (Figure 6). This coalescence of the pores occurs in different regions of the mortar without indicating any tendency of the quantity or size of the pores that coalesce [37]. There was no observed connectivity between isolated or coalesced pores [46]. Table 7 shows the quantities and dimensions of the pores present in the sample, and Figure 7 demonstrates the concentrations and dimensions of the pores in the concrete mixes.
In terms of the shapes of entrained pores, the sphericity values indicate a large quantity of non-spherical pores (Φ < 0.95) in all concretes. However, the number of pores considered spherical (0.95 ≤ Φ ≤ 1.00) was greater in comparison to the number of pores with inferior sphericities, with the exception of ratios III and III M, which present a higher quantity of pores with sphericity between 0 and 0.70. The majority of pores considered spherical (0.95 ≤ Φ ≤ 1) do not reflect the proportion of the air void volumes. The highest volume of voids is due to non-spherical pores (Φ < 0.95). Table 8 shows the sphericities of the pores, volumes, and proportions in relation to the total pore volume of each analyzed sample, while Figure 8 shows the concentrations and sphericity of the pores in the concrete mixes.
The high concentration of pores with equivalent diameters between 50 and 500 μm and sphericities between 0.95 and 1 indicates that the air entrained by the admixture occurs by means of spherical bubbles (MARTIN, 2005; MEHTA and MONTEIRO, 2014; ARAUJO et al., 2014). The majority of these entrained air bubbles (pores with sphericities 0.95 ≤ Φ ≤ 1.00) present diameters of up to 200 μm, with the highest concentration between 100 and 200 μm, thus confirming the results from the first stage of this study. However, exceptions were found in concrete mixes III and IIIM, which presented higher concentrations of bubbles with diameters of between 50 and 100 μm. Table 9 shows the quantities and diameters of the entrained air bubbles (0.95 ≤ Φ ≤ 1.00) and Figure 9 shows the concentration of these bubbles in the concrete mixes analyzed.
The higher the air content of the concrete mixes, the higher the incidence of pores of irregular shapes, that is, shapes that are further from the spherical type (0 ≤ Φ < 0.95). These possibly result from the coalescence of pores, which implies there is a decrease in the concentration of spherical pores (0.95 ≤ Φ ≤ 1.00). For lower air contents, there is a higher incidence of pores considered spherical (air bubbles). There exists proportionality between the total amount of pores and the amount of pores considered spherical (bubbles) (Figure 10). Although there exists this proportionality in quantities, the volumes relevant to non-spherical pores (Φ < 0.95) increase considerably in relation to the volumes of spherical pores (0.95 ≤ Φ ≤ 1) to the degree that the air content increases in the concrete mix (Table 10).

4. Conclusions

The obtained results and analyses performed in this study lead to the following conclusions:
  • The air content of concrete with entrained air was directly proportional to the admixture ratios used.
  • The density and consistency of the concrete with entrained air in the fresh state were directly proportional to the air entrained in the concrete.
  • Computerized X-ray microtomography, Micro-CT, allowed for the three-dimensional microstructural analysis of the concrete and opened the possibility for the precise dimensioning and quantification of all pores, as well as the distribution and relationship that exists between these in the structure of the different concrete analyzed.
  • The entraining of air in the concretes by means of admixtures is provided through spherical pores.
  • The increase in air content in the concrete caused an increase in the equivalent diameters of the pores and a reduction in the occurrence of spherical pores due to the coalescence caused by the air-entraining admixtures.

Author Contributions

F.A.d.S.F., J.S.B. and D.d.S.d.O.C.; formal analysis, F.A.d.S.F., J.S.B. and J.A.R.; investigation, F.A.d.S.F., D.d.S.d.O.C. and J.A.R.; methodology, F.A.d.S.F., J.S.B., D.d.S.d.O.C. and J.A.R.; resources, F.A.d.S.F., D.d.S.d.O.C. and J.A.R.; writing—original draft preparation, F.A.d.S.F., J.S.B., D.d.S.d.O.C. and J.A.R.; writing—review and editing, F.A.d.S.F., D.d.S.d.O.C. and J.A.R.; visualization, F.A.d.S.F., J.S.B., D.d.S.d.O.C. and J.A.R. All authors have read and agreed to the published version of the manuscript.

Funding

This research received no external funding.

Data Availability Statement

Data are available upon request.

Acknowledgments

This work was supported for publication by PROPESP/UFPA (PAPQ).

Conflicts of Interest

The authors declare no conflict of interest.

References

  1. Chen, H.; Nie, X.; Gan, S.; Zhao, Y.; Qiu, H. Interfacial Imperfection Detection for Steel-Concrete Composite Structures Using NDT Techniques: A State-of-the-Art Review. Eng. Struct. 2021, 245, 112778. [Google Scholar] [CrossRef]
  2. Getachew, E.M.; Yifru, B.W.; Taffese, W.Z.; Yehualaw, M.D. Enhancing Mortar Properties through Thermoactivated Recycled Concrete Cement. Buildings 2023, 13, 2209. [Google Scholar] [CrossRef]
  3. Hosseinnezhad, H.; Sürmelioğlu, S.; Çakır, Ö.A.; Ramyar, K. A Novel Method for Characterization of Recycled Concrete Aggregates: Computerized Microtomography. J. Build. Eng. 2023, 76, 107321. [Google Scholar] [CrossRef]
  4. da Silva Fernandes, F.A.; Arcaro, S.; Tochtrop Junior, E.F.; Valdés Serra, J.C.; Bergmann, C.P. Glass Foams Produced from Soda-Lime Glass Waste and Rice Husk Ash Applied as Partial Substitutes for Concrete Aggregates. Process Saf. Environ. Prot. 2019, 128, 77–84. [Google Scholar] [CrossRef]
  5. Mohamad, A.; Khadraoui, F.; Chateigner, D.; Boutouil, M. Influence of Porous Structure of Non-Autoclaved Bio-Based Foamed Concrete on Mechanical Strength. Buildings 2023, 13, 2261. [Google Scholar] [CrossRef]
  6. da Silva Fernandes, F.A.; de Oliveira Costa, D.D.S.; Rossignolo, J.A. Influence of Sintering on Thermal, Mechanical and Technological Properties of Glass Foams Produced from Agro-Industrial Residues. Materials 2022, 15, 6669. [Google Scholar] [CrossRef]
  7. Vieira, A.P.; Toledo Filho, R.D.; Tavares, L.M.; Cordeiro, G.C. Effect of Particle Size, Porous Structure and Content of Rice Husk Ash on the Hydration Process and Compressive Strength Evolution of Concrete. Constr. Build. Mater. 2020, 236, 117553. [Google Scholar] [CrossRef]
  8. da Silva Fernandes, F.A.; de Oliveira Costa, D.D.S.; Martin, C.A.G.; Rossignolo, J.A. Vitreous Foam with Thermal Insulating Property Produced with the Addition of Waste Glass Powder and Rice Husk Ash. Sustainability 2023, 15, 796. [Google Scholar] [CrossRef]
  9. Ferreira, G.M.; Cavalcante, H.P.; Teixeira, M.B.; da Silva Fernandes, F.A. Characterization of the Mechanical Properties of Concrete with Addition of Bamboo Fiber—Porto Nacional/TO. Int. J. Adv. Eng. Res. Sci. 2019, 6, 209–216. [Google Scholar] [CrossRef]
  10. Pereira, A.P.; Ferreira, G.M.; Teixeira, M.B.; da Silva Fernandes, F.A. Production of Non-Structural Concrete with Addition of Polyethylene Terephthalate Fiber (PET) in Porto Nacional—TO. Int. J. Adv. Eng. Res. Sci. 2019, 6, 372–378. [Google Scholar] [CrossRef]
  11. Stochero, N.P.; de Souza Chami, J.O.R.; Souza, M.T.; de Moraes, E.G.; de Oliveira, A.P.N. Green Glass Foams from Wastes Designed for Thermal Insulation. Waste Biomass Valorization 2021, 12, 1609–1620. [Google Scholar] [CrossRef]
  12. Tunstall, L.E.; Ley, M.T.; Scherer, G.W. Air Entraining Admixtures: Mechanisms, Evaluations, and Interactions. Cem. Concr. Res. 2021, 150, 106557. [Google Scholar] [CrossRef]
  13. Dolch, W.L. Air-Entraining Admixtures. In Concrete Admixtures Handbook; Elsevier: Amsterdam, The Netherlands, 1996; pp. 518–557. [Google Scholar]
  14. Abd Elrahman, M.; Sikora, P.; Chung, S.-Y.; Stephan, D. The Performance of Ultra-Lightweight Foamed Concrete Incorporating Nanosilica. Arch. Civ. Mech. Eng. 2021, 21, 79. [Google Scholar] [CrossRef]
  15. Akçaözoğlu, S.; Atiş, C.D.; Akçaözoğlu, K. An Investigation on the Use of Shredded Waste PET Bottles as Aggregate in Lightweight Concrete. Waste Manag. 2010, 30, 285–290. [Google Scholar] [CrossRef] [PubMed]
  16. Chung, S.Y.; Elrahman, M.A.; Stephan, D.; Kamm, P.H. Investigation of Characteristics and Responses of Insulating Cement Paste Specimens with Aer Solids Using X-ray Micro-Computed Tomography. Constr. Build. Mater. 2016, 118, 204–215. [Google Scholar] [CrossRef]
  17. Amran, Y.H.M.; Farzadnia, N.; Abang Ali, A.A. Properties and Applications of Foamed Concrete; a Review. Constr. Build. Mater. 2015, 101, 990–1005. [Google Scholar] [CrossRef]
  18. Wu, H.; Liu, Z.; Sun, B.; Yin, J. Experimental Investigation on Freeze–Thaw Durability of Portland Cement Pervious Concrete (PCPC). Constr. Build. Mater. 2016, 117, 63–71. [Google Scholar] [CrossRef]
  19. Choi, P.; Yeon, J.H.; Yun, K.-K. Air-Void Structure, Strength, and Permeability of Wet-Mix Shotcrete before and after Shotcreting Operation: The Influences of Silica Fume and Air-Entraining Agent. Cem. Concr. Compos. 2016, 70, 69–77. [Google Scholar] [CrossRef]
  20. Franus, M.; Panek, R.; Madej, J.; Franus, W. The Properties of Fly Ash Derived Lightweight Aggregates Obtained Using Microwave Radiation. Constr. Build. Mater. 2019, 227, 116677. [Google Scholar] [CrossRef]
  21. Lai, M.H.; Binhowimal, S.A.M.; Griffith, A.M.; Hanzic, L.; Chen, Z.; Wang, Q.; Ho, J.C.M. Shrinkage, Cementitious Paste Volume, and Wet Packing Density of Concrete. Struct. Concr. 2022, 23, 488–504. [Google Scholar] [CrossRef]
  22. Medvedev, V.; Pustovgar, A. A Review of Concrete Carbonation and Approaches to Its Research under Irradiation. Buildings 2023, 13, 1998. [Google Scholar] [CrossRef]
  23. Zannerni, G.M.; Fattah, K.P.; Al-Tamimi, A.K. Ambient-Cured Geopolymer Concrete with Single Alkali Activator. Sustain. Mater. Technol. 2020, 23, e00131. [Google Scholar] [CrossRef]
  24. Abbas, S.; Hussain, I.; Aslam, F.; Ahmed, A.; Gillani, S.A.A.; Shabbir, A.; Deifalla, A.F. Potential of Alkali–Silica Reactivity of Unexplored Local Aggregates as per ASTM C1260. Materials 2022, 15, 6627. [Google Scholar] [CrossRef] [PubMed]
  25. Zunino, F.; Lopez, M. A Methodology for Assessing the Chemical and Physical Potential of Industrially Sourced Rice Husk Ash on Strength Development and Early-Age Hydration of Cement Paste. Constr. Build. Mater. 2017, 149, 869–881. [Google Scholar] [CrossRef]
  26. Wang, L.; Huang, Y.; Zhao, F.; Huo, T.; Chen, E.; Tang, S. Comparison between the Influence of Finely Ground Phosphorous Slag and Fly Ash on Frost Resistance, Pore Structures and Fractal Features of Hydraulic Concrete. Fractal Fract. 2022, 6, 598. [Google Scholar] [CrossRef]
  27. Liu, D.; Yu, F.; Zhong, L.; Zhang, T.; Xu, Y.; Qin, Y.; Ma, J.; Wang, W. Armor-Structured Interconnected-Porous Membranes for Corrosion-Resistant and Highly Permeable Waste Ammonium Resource Recycling. Environ. Sci. Technol. 2022, 56, 6658–6667. [Google Scholar] [CrossRef]
  28. Gorospe, K.; Booya, E.; Ghaednia, H.; Das, S. Effect of Various Glass Aggregates on the Shrinkage and Expansion of Cement Mortar. Constr. Build. Mater. 2019, 210, 301–311. [Google Scholar] [CrossRef]
  29. Shcherban’, E.M.; Stel’makh, S.A.; Beskopylny, A.N.; Mailyan, L.R.; Meskhi, B.; Shilov, A.A.; Chernil’nik, A.; Özkılıç, Y.O.; Aksoylu, C. Normal-Weight Concrete with Improved Stress–Strain Characteristics Reinforced with Dispersed Coconut Fibers. Appl. Sci. 2022, 12, 11734. [Google Scholar] [CrossRef]
  30. Jolly, M.; Prabhakar, A.; Sturzu, B.; Hollstein, K.; Singh, R.; Thomas, S.; Foote, P.; Shaw, A. Review of Non-Destructive Testing (NDT) Techniques and Their Applicability to Thick Walled Composites. Procedia CIRP 2015, 38, 129–136. [Google Scholar] [CrossRef]
  31. 3 Bola Pra Frente.
  32. Bonse, U.; Busch, F. X-ray Computed Microtomography (ΜCT) Using Synchrotron Radiation (SR). Prog. Biophys. Mol. Biol. 1996, 65, 133–169. [Google Scholar] [CrossRef]
  33. Lu, H.; Peterson, K.; Chernoloz, O. Measurement of Entrained Air-Void Parameters in Portland Cement Concrete Using Micro X-ray Computed Tomography. Int. J. Pavement Eng. 2018, 19, 109–121. [Google Scholar] [CrossRef]
  34. Thomas, C.; de Brito, J.; Cimentada, A.; Sainz-Aja, J.A. Macro- and Micro-Properties of Multi-Recycled Aggregate Concrete. J. Clean. Prod. 2020, 245, 118843. [Google Scholar] [CrossRef]
  35. C150/C150M-15; Standard Specification for Portland Cement. ASTM International: West Conshohocken, PA, USA, 2015; pp. 1–9.
  36. Prusty, J.K.; Patro, S.K.; Basarkar, S.S. Concrete Using Agro-Waste as Fine Aggregate for Sustainable Built Environment—A Review. Int. J. Sustain. Built Environ. 2016, 5, 312–333. [Google Scholar] [CrossRef]
  37. Kontić, A.; Vasconcelos, G.; Briceño Melendez, C.; Azenha, M.; Sokolović, N. Influence of Air Entrainers on the Properties of Hydrated Lime Mortars. SSRN Electron. J. 2023, 403, 132968. [Google Scholar] [CrossRef]
  38. Siddique, R.; de Schutter, G.; Noumowe, A. Effect of Used-Foundry Sand on the Mechanical Properties of Concrete. Constr. Build. Mater. 2009, 23, 976–980. [Google Scholar] [CrossRef]
  39. Ferreira, C.R.; Tavares, S.S.; Ferreira, B.H.M.; Fernandes, A.M.; Fonseca, S.J.G.; Oliveira, C.A.D.S.; Teixeira, R.L.P.; Gouveia, L.L.D.A. Comparative Study About Mechanical Properties of Strutural Standard Concrete and Concrete with Addition of Vegetable Fibers. Mater. Res. 2017, 20, 102–107. [Google Scholar] [CrossRef]
  40. Bruere, G.M. Air Entrainment in Cement and Silica Pastes. ACI J. Proc. 1955, 51, 905–919. [Google Scholar] [CrossRef]
  41. Bruere, G.M. Air-Entraining Actions of Anionic Surfactants in Portland Cement Pastes. J. Appl. Chem. Biotechnol. 2007, 21, 61–64. [Google Scholar] [CrossRef]
  42. Du, L.; Folliard, K.J. Mechanisms of Air Entrainment in Concrete. Cem. Concr. Res. 2005, 35, 1463–1471. [Google Scholar] [CrossRef]
  43. Backstrom, J.E.; Burrows, R.W.; Mielenz, R.C.; Wolkodoff, V.E. Origin, Evolution, and Effects of the Air Void System in Concrete. Part 3—Influence of Water-Cement Ratio and Compaction. ACI J. Proc. 1958, 55, 359–375. [Google Scholar] [CrossRef]
  44. Nowak-Michta, A. Impact Analysis of Air-Entraining and Superplasticizing Admixtures on Concrete Compressive Strength. Procedia Struct. Integr. 2019, 23, 77–82. [Google Scholar] [CrossRef]
  45. Skarżyński, Ł.; Tejchman, J. Experimental Investigations of Damage Evolution in Concrete during Bending by Continuous Micro-CT Scanning. Mater. Charact. 2019, 154, 40–52. [Google Scholar] [CrossRef]
  46. Chung, S.-Y.; Kim, J.-S.; Stephan, D.; Han, T.-S. Overview of the Use of Micro-Computed Tomography (Micro-CT) to Investigate the Relation between the Material Characteristics and Properties of Cement-Based Materials. Constr. Build. Mater. 2019, 229, 116843. [Google Scholar] [CrossRef]
Figure 1. The Micro-CT equipment: External view (a), internal view (b), and position of the sample (c).
Buildings 13 02549 g001
Figure 2. Admixture ratio x air content: Standard and modified mix ratios.
Buildings 13 02549 g002
Figure 3. Air content x density: Standard and modified ratios.
Buildings 13 02549 g003
Figure 4. Air content x Slump: Standard and modified mix ratios.
Buildings 13 02549 g004
Figure 5. Visualization of the concrete samples (a), volume of mortar without large aggregates with discretization of the pores (b), pores (c), and volume of the mortar (d): Reference ratios (0), standards (I, II, and III), and modified (I M, II M, and III M).
Buildings 13 02549 g005
Figure 6. Samples of analyzed concrete mixes (a) and respective cross-sections (b) and longitudinal section (c,d): Reference ratio (0), standards (I, II, and III) and modified (I M, II M, and III M).
Buildings 13 02549 g006
Figure 7. Concentration and equivalent diameters of the pores present in the concrete samples.
Buildings 13 02549 g007
Figure 8. Concentrations and sphericities of pores present in the concrete samples.
Buildings 13 02549 g008
Figure 9. Concentrations and diameters of air bubbles (0 ≤ Φ < 0.95) present in the concrete samples.
Buildings 13 02549 g009
Figure 10. Comparison between quantities of pores and bubbles (0 ≤ Φ < 0.95) present in the concrete samples.
Buildings 13 02549 g010
Table 1. Materials used in the production of concrete.
Air-Entrained Admixture
CompositionAppearanceDensity
(g/cm3)
Dosage
(%)
Synthetic resinsRed colored liquid1.01 to 1.050.05 to 1.0
Portland Cement—CPV—High early strength
Density (g/m3)Specific surface
(m2/kg)
Mechanical resistance
(MPa—28 days)
Start and end of
setting time (min)
3.12545.0050.00130–220
Large aggregate—Basalt crushed stone
Density (g/cm3)Unit mass (kg/m3)Absorption
(%)
Maximum diameter characteristic(mm)Fineness
module
2.841635.100.8019.006.75
Fine aggregates—Natural quartz sand
Density (g/cm3)Maximum diameter characteristic
(mm)
Fineness module
2.652.402.07
Table 2. Parameters used in the dosage of the referential concrete.
ParameterValue
(Unit)
Concrete dosage strength—fck40.00 MPa
Standard deviation—Sd4.00 MPa
Desired consistency in fresh state—slump50 ± 10 mm
Water to cement relationship—w/c0.42
Minimum strength of cement (7 days)—fck34.00 MPa
Water consumption—Cwater195.00 l/m3
Cement consumption—Cc454.72 kg/m3
Maximum diameter of large aggregate—Dmax19.00 mm
Sand fineness modulus—FMs2.07
Dry aggregate volume per m3 of concrete—Vb0.743
Compacted unit mass of large aggregate—One1635.10 kg/m3
Cement density—ρc3120.00 kg/m3
Gravel density—ρg2840.00 kg/m3
Sand density—ρs2650.00 kg/m3
Water density—γwater1000.00 kg/m3
Consumption of gravel—Cg1214.88 kg/m3
Consumption of fine aggregate—Ca605.29 kg/m3
Mix ratio of bulk concrete—cement:sand:gravel:w/c1–1.31:2.62:0.42
Table 3. Mix ratios of the produced concrete (0, I, II, III, I M, II M, and III M).
RatioCementSandGravelW/CAdmixture
01.001.312.620.420.00
I1.001.312.620.420.01
II1.001.312.620.420.03
III1.001.312.620.420.07
M1.001.082.170.420.01
II M1.000.901.800.420.03
III M1.000.511.020.420.07
Table 4. Parameters used in the acquisition of microtomography of the different concrete mixes.
RatioCement
Volume analyzed—diameter × height16 × 20 mm
Acquisition time00 h 45 m
Objective lens0.39X
Conditions of the source120 kV–10 W
Resolution—voxel size20 μm
Nº of projections1000
Exposition time2 s
Resol. Detector1024 × 1024 px
Field of vision—FOV21 × 21 mm
Transmission23%
FilterWithout filter
Transmission for ratio 0 was 23%, for ratio III was 26%, and for the remainder was 30%.
Table 5. Results obtained from the tests performed on fresh concrete.
ConcreteTests
Mix RatioAdmixture
(%)
Air content
(%)
Density
(kg/m3)
Slump Test
(mm)
001.92490.2036
I110.22300.6540
II317.02150.33133
III728.51915.03133
I M112.52196.0849
II M319.02039.22150
III M728.01836.60>200
Table 6. Quantity of pores that exist in the concrete samples.
Sample/Mix RatioQuantity of Pores
Reference01640
StandardsI16,970
II4535
III6176
ModifiedI M14,560
II M5216
III M7922
Table 7. Quantities and dimensions of the pores present in the concrete samples.
MIX
RATIO
Equivalent Diameter * (EqDiameter) of the Pores (μm)
0
to
50
50
to
100
100
to
200
200
to
300
300
to
400
400
to
500
500
to
600
600
to
700
700
to
800
800
to
900
900
to
1000
>
1000
Ref.-00205.00435.00234.00112.0055.0051.0021.008.008.005.006.00
I52648.009160.003224.001116.00421.00207.0087.0055.0022.0013.0012.00
II0852.002135.00560.00236.00163.00161.00108.0085.0062.0051.00122.00
III51605.002307.00436.00294.00343.00370.00290.00212.00132.0079.00103.00
I M102415.008063.002741.00803.00293.00124.0054.0030.009.006.0012.00
II M61329.002315.00565.00229.00186.00134.00128.0090.0067.0048.00119.00
III M111150.00936.00512.001204.001453.001193.00778.00426.00178.0049.0032.00
* EqDiameter of the pore is the diameter of a sphere of equal volume to the pore.
Table 8. Quantities, sphericities, and volume of the pores present in the concrete samples.
MIX RATIOSPHERICITY * (Φ)QUANTITYVOLUME (cm3)% TOTAL VOL **
MIX RATIO 0-Reference0.95 to 1693.000.00932.45
0.9 to 0.95134.000.00415.10
0.8 to 0.9139.000.00311.54
0.7 to 0.8114.000.00517.17
0.6 to 0.730.000.0013.99
0.5 to 0.619.000.00310.38
0 to 0.511.000.0039.38
Total1140.000.027100.00
MIX RATIO I0.95 to 16738.000.0128.27
0.9 to 0.952485.000.0095.96
0.8 to 0.94255.000.02415.82
0.7 to 0.82188.000.02818.66
0.6 to 0.7912.000.03321.78
0.5 to 0.6322.000.03120.38
0 to 0.570.000.0149.13
Total16,970.000.150100.00
MIX RATIO II0.95 to 11675.000.0020.82
0.9 to 0.95645.000.0020.67
0.8 to 0.9902.000.0062.28
0.7 to 0.8535.000.0134.78
0.6 to 0.7335.000.02910.70
0.5 to 0.6250.000.06524.00
0 to 0.5193.000.15456.74
Total4535.000.271100.00
MIX RATIO III0.95 to 11752.000.0010.41
0.9 to 0.95843.000.0010.30
0.8 to 0.91106.000.0030.86
0.7 to 0.8571.000.0041.30
0.6 to 0.7454.000.0144.29
0.5 to 0.6502.000.04413.33
0 to 0.5948.000.2617951
Total6176.000.328100.00
MIX RATIO IM0.95 to 16150.000.01513.51
0.9 to 0.952297.000.0108.77
0.8 to 0.93861.000.02622.68
0.7 to 0.81661.000.02925.41
0.6 to 0.7480.000.02118.65
0.5 to 0.698.000.0097.70
0 to 0.513.000.0043.29
Total14,560.000.114100.00
MIX RATIO IIM0.95 to 11774.000.0020.85
0.9 to 0.95736.000.0020.54
0.8 to 0.91105.000.0041.41
0.7 to 0.8668.000.0093.25
0.6 to 0.7320.000.0175.91
0.5 to 0.6256.000.04315.17
0 to 0.5357.000.20672.86
Total5216.000.282100.00
MIX RATIO IIIM0.95 to 1732.000.0000.08
0.9 to 0.95474.000.0000.08
0.8 to 0.9728.000.0010.25
0.7 to 0.8522.000.0050.88
0.6 to 0.7775.000.0173.23
0.5 to 0.61369.000.06011.61
0 to 0.53322.000.43683.88
Total7922.000.519100.00
* Sphericity Φ measures the distance from the spherical shape: Φ = 1 for spherical pore and Φ < 1 for any other shape. ** Total volume of the sample pores.
Table 9. Quantities and diameters of entrained air bubbles (0.95 ≤ Φ ≤ 1) present in the concrete samples.
MIX RATIODiameters of Bubbles (μm)TOTAL
0
to
50
50
to
100
100
to
200
200
to
300
300
to
400
>400
Ref.-001232561757465693
I5156645335983516738
II0542106367401675
III595576427101752
I M1013413880783121156150
II M673292898821774
III M11475238800732
Table 10. Volumes and concentrations of spherical (0.95 ≤ Φ ≤ 1) and non-spherical pores (Φ < 0.95) that exist in the concrete samples.
MIX RATIOAir Content
(%)
Volume of Pores(cm3)
Non Spherical
(Φ < 0.95)
%Spherical
(0.95 ≤ Φ ≤ 1)
% TOTAL
Ref.-01.90.01867.60.00932.40.027
I10.20.13891.70.012830.150
II17.00.26999.20.0020.80.271
III28.50.32799.60.0010.40.328
I M12.50.09986.50.01513.50.114
II M19.00.28099.10.0020.90.282
III M28.00.51999.90.0000.10.519
Disclaimer/Publisher’s Note: The statements, opinions and data contained in all publications are solely those of the individual author(s) and contributor(s) and not of MDPI and/or the editor(s). MDPI and/or the editor(s) disclaim responsibility for any injury to people or property resulting from any ideas, methods, instructions or products referred to in the content.

