


Estimating Space-Cooling Energy Consumption and Indoor PM2.5 Exposure across Hong Kong Using a City-Representative Housing Stock Model

Abstract
:1. Introduction
1.1. Space-Cooling Energy Consumption in Homes
1.2. Population Exposure to Domestic Indoor PM2.5
1.3. Objective
2. Methods
2.1. Housing Data
2.2. Environmental Data
2.3. Model Development
2.3.1. Dwellings
2.3.2. Occupancy
2.3.3. Cooling and Ventilation
2.3.4. PM2.5 Transport
2.4. Simulation and Data Collation
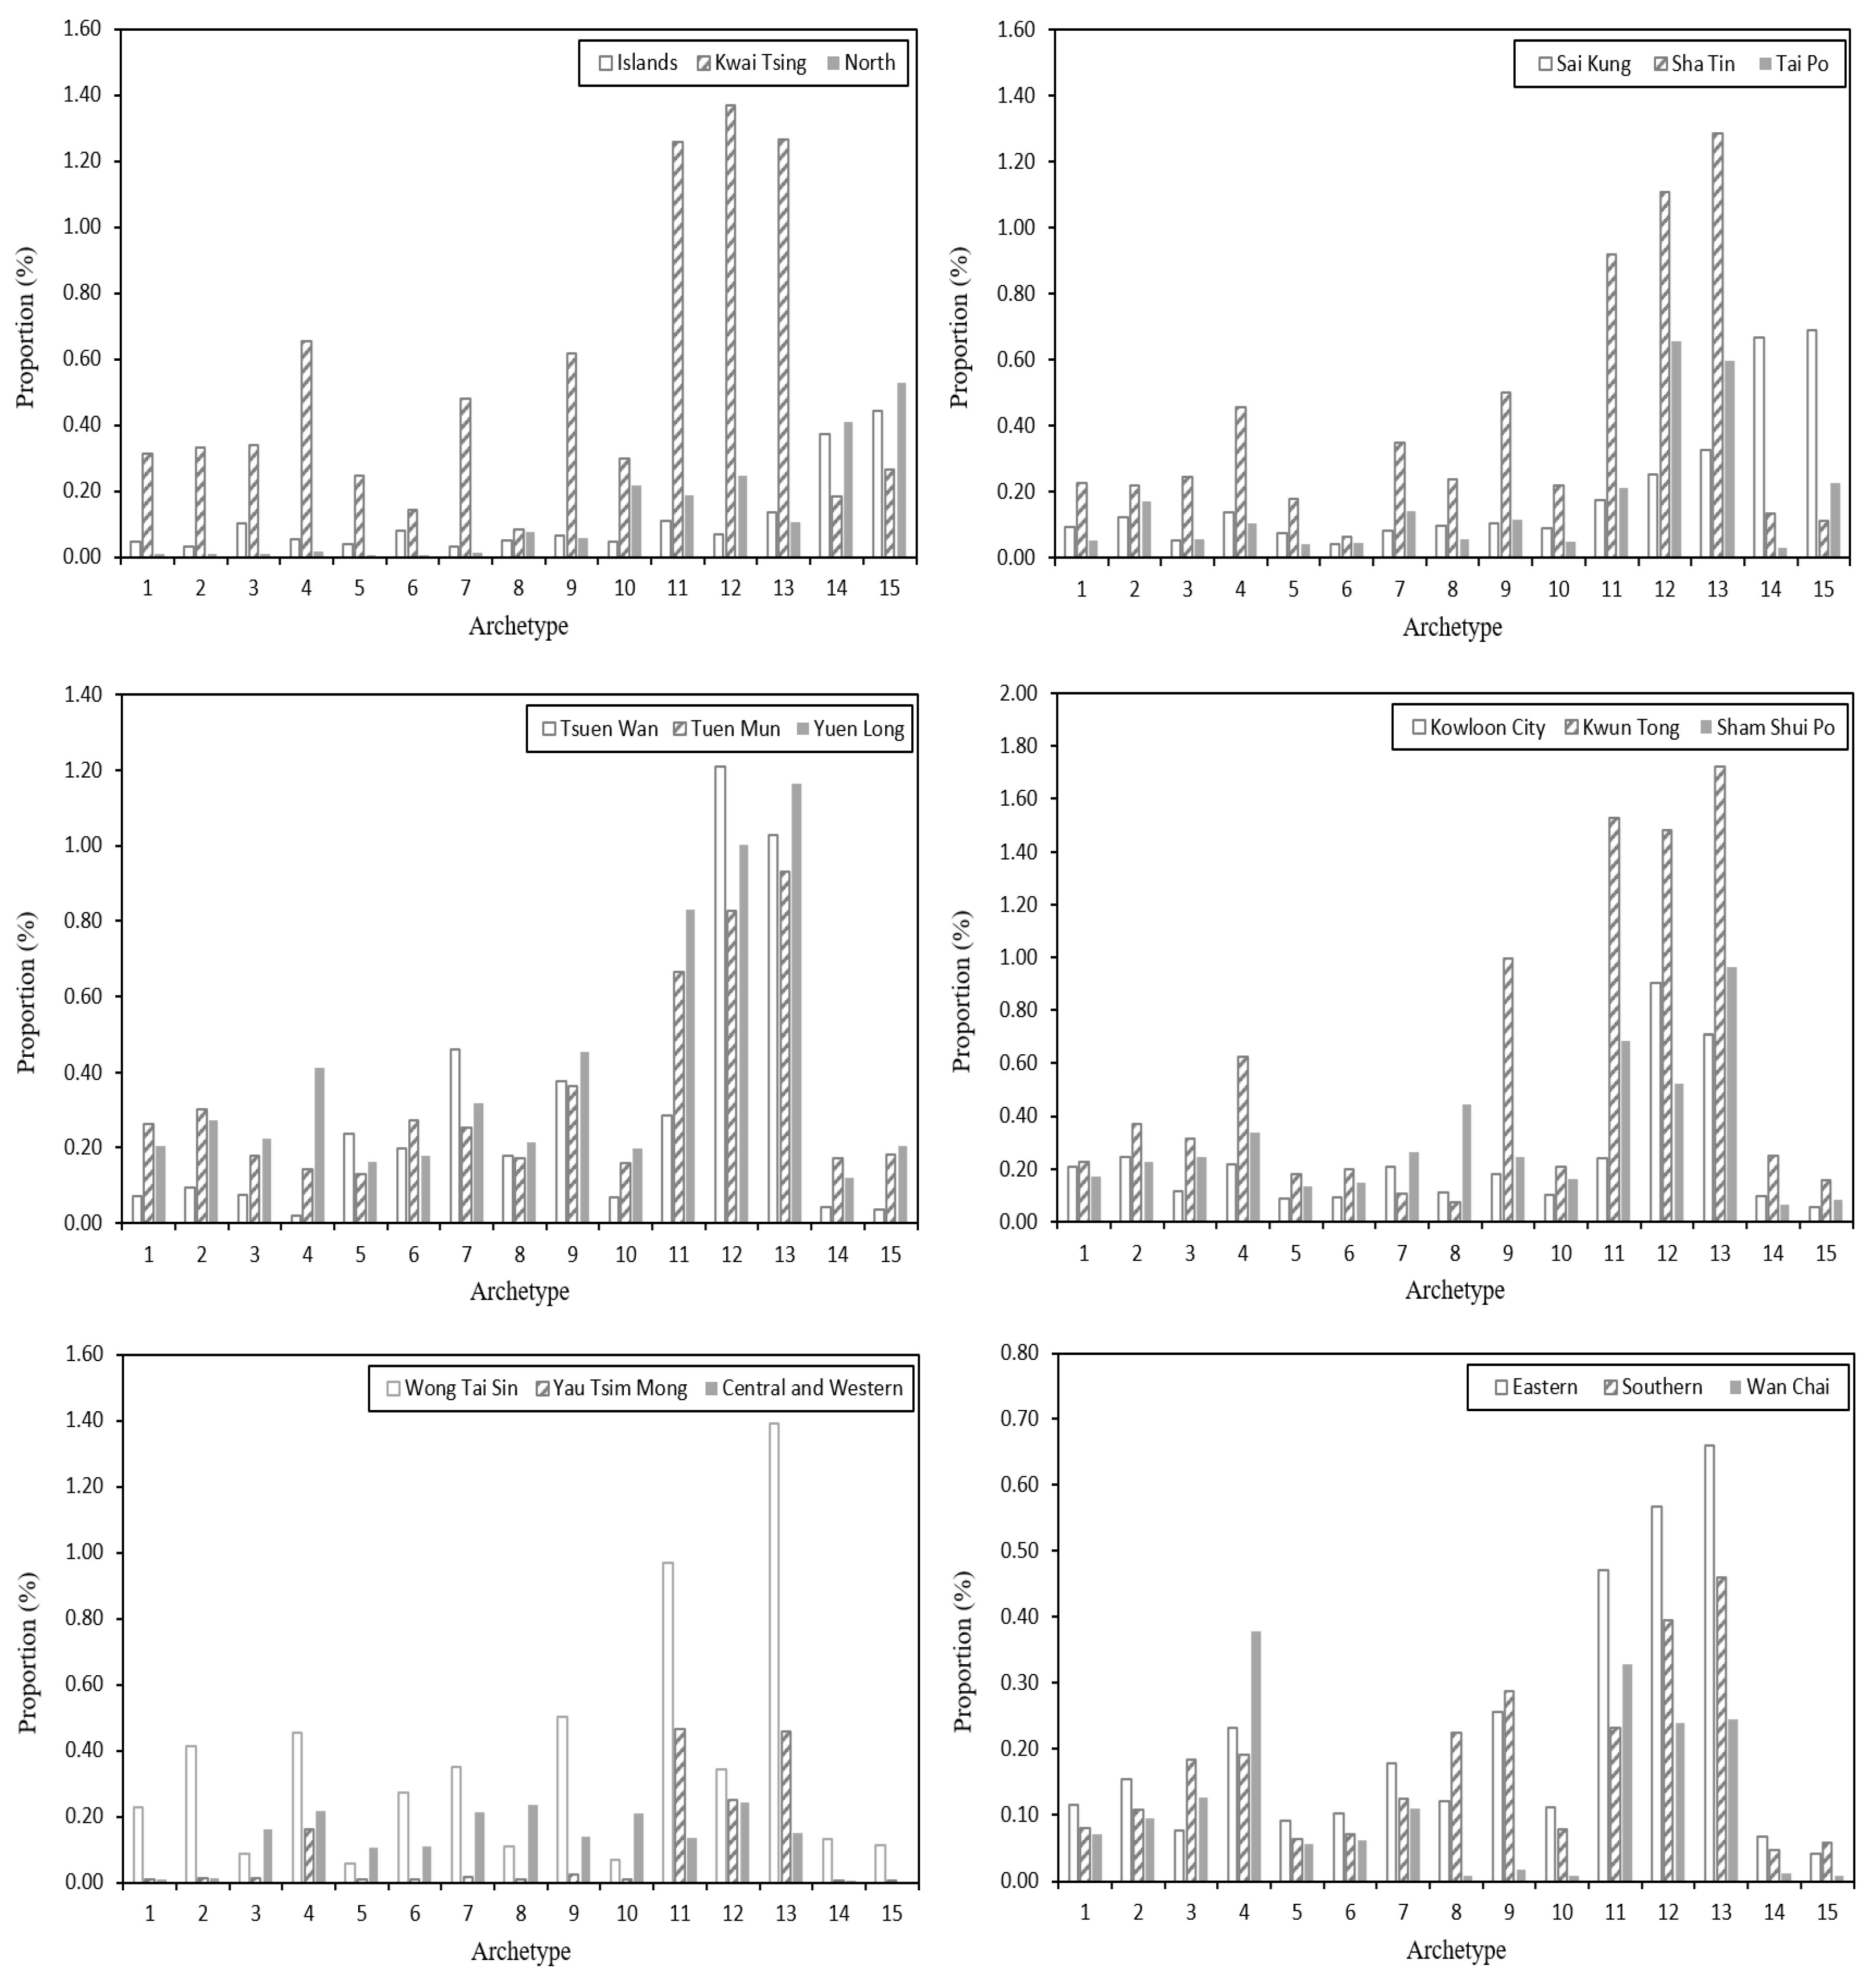
- 15 archetypes (31 variants including flats on the ground, middle, and top floors);
- 4 orientations (North, West, South, and East);
- 18 locations (weather and outdoor pollution data for 18 districts);
- 5 types of overshadowing (compact high-rise, compact low-rise, open high-rise, open low-rise, and sparsely built);
- 2 types of terrain (urban and rural);
- 2 occupancy groups (two pensioners and a family of three);
- 3 types of fabric retrofits (external wall insulation, low-e windows, and airtightening).
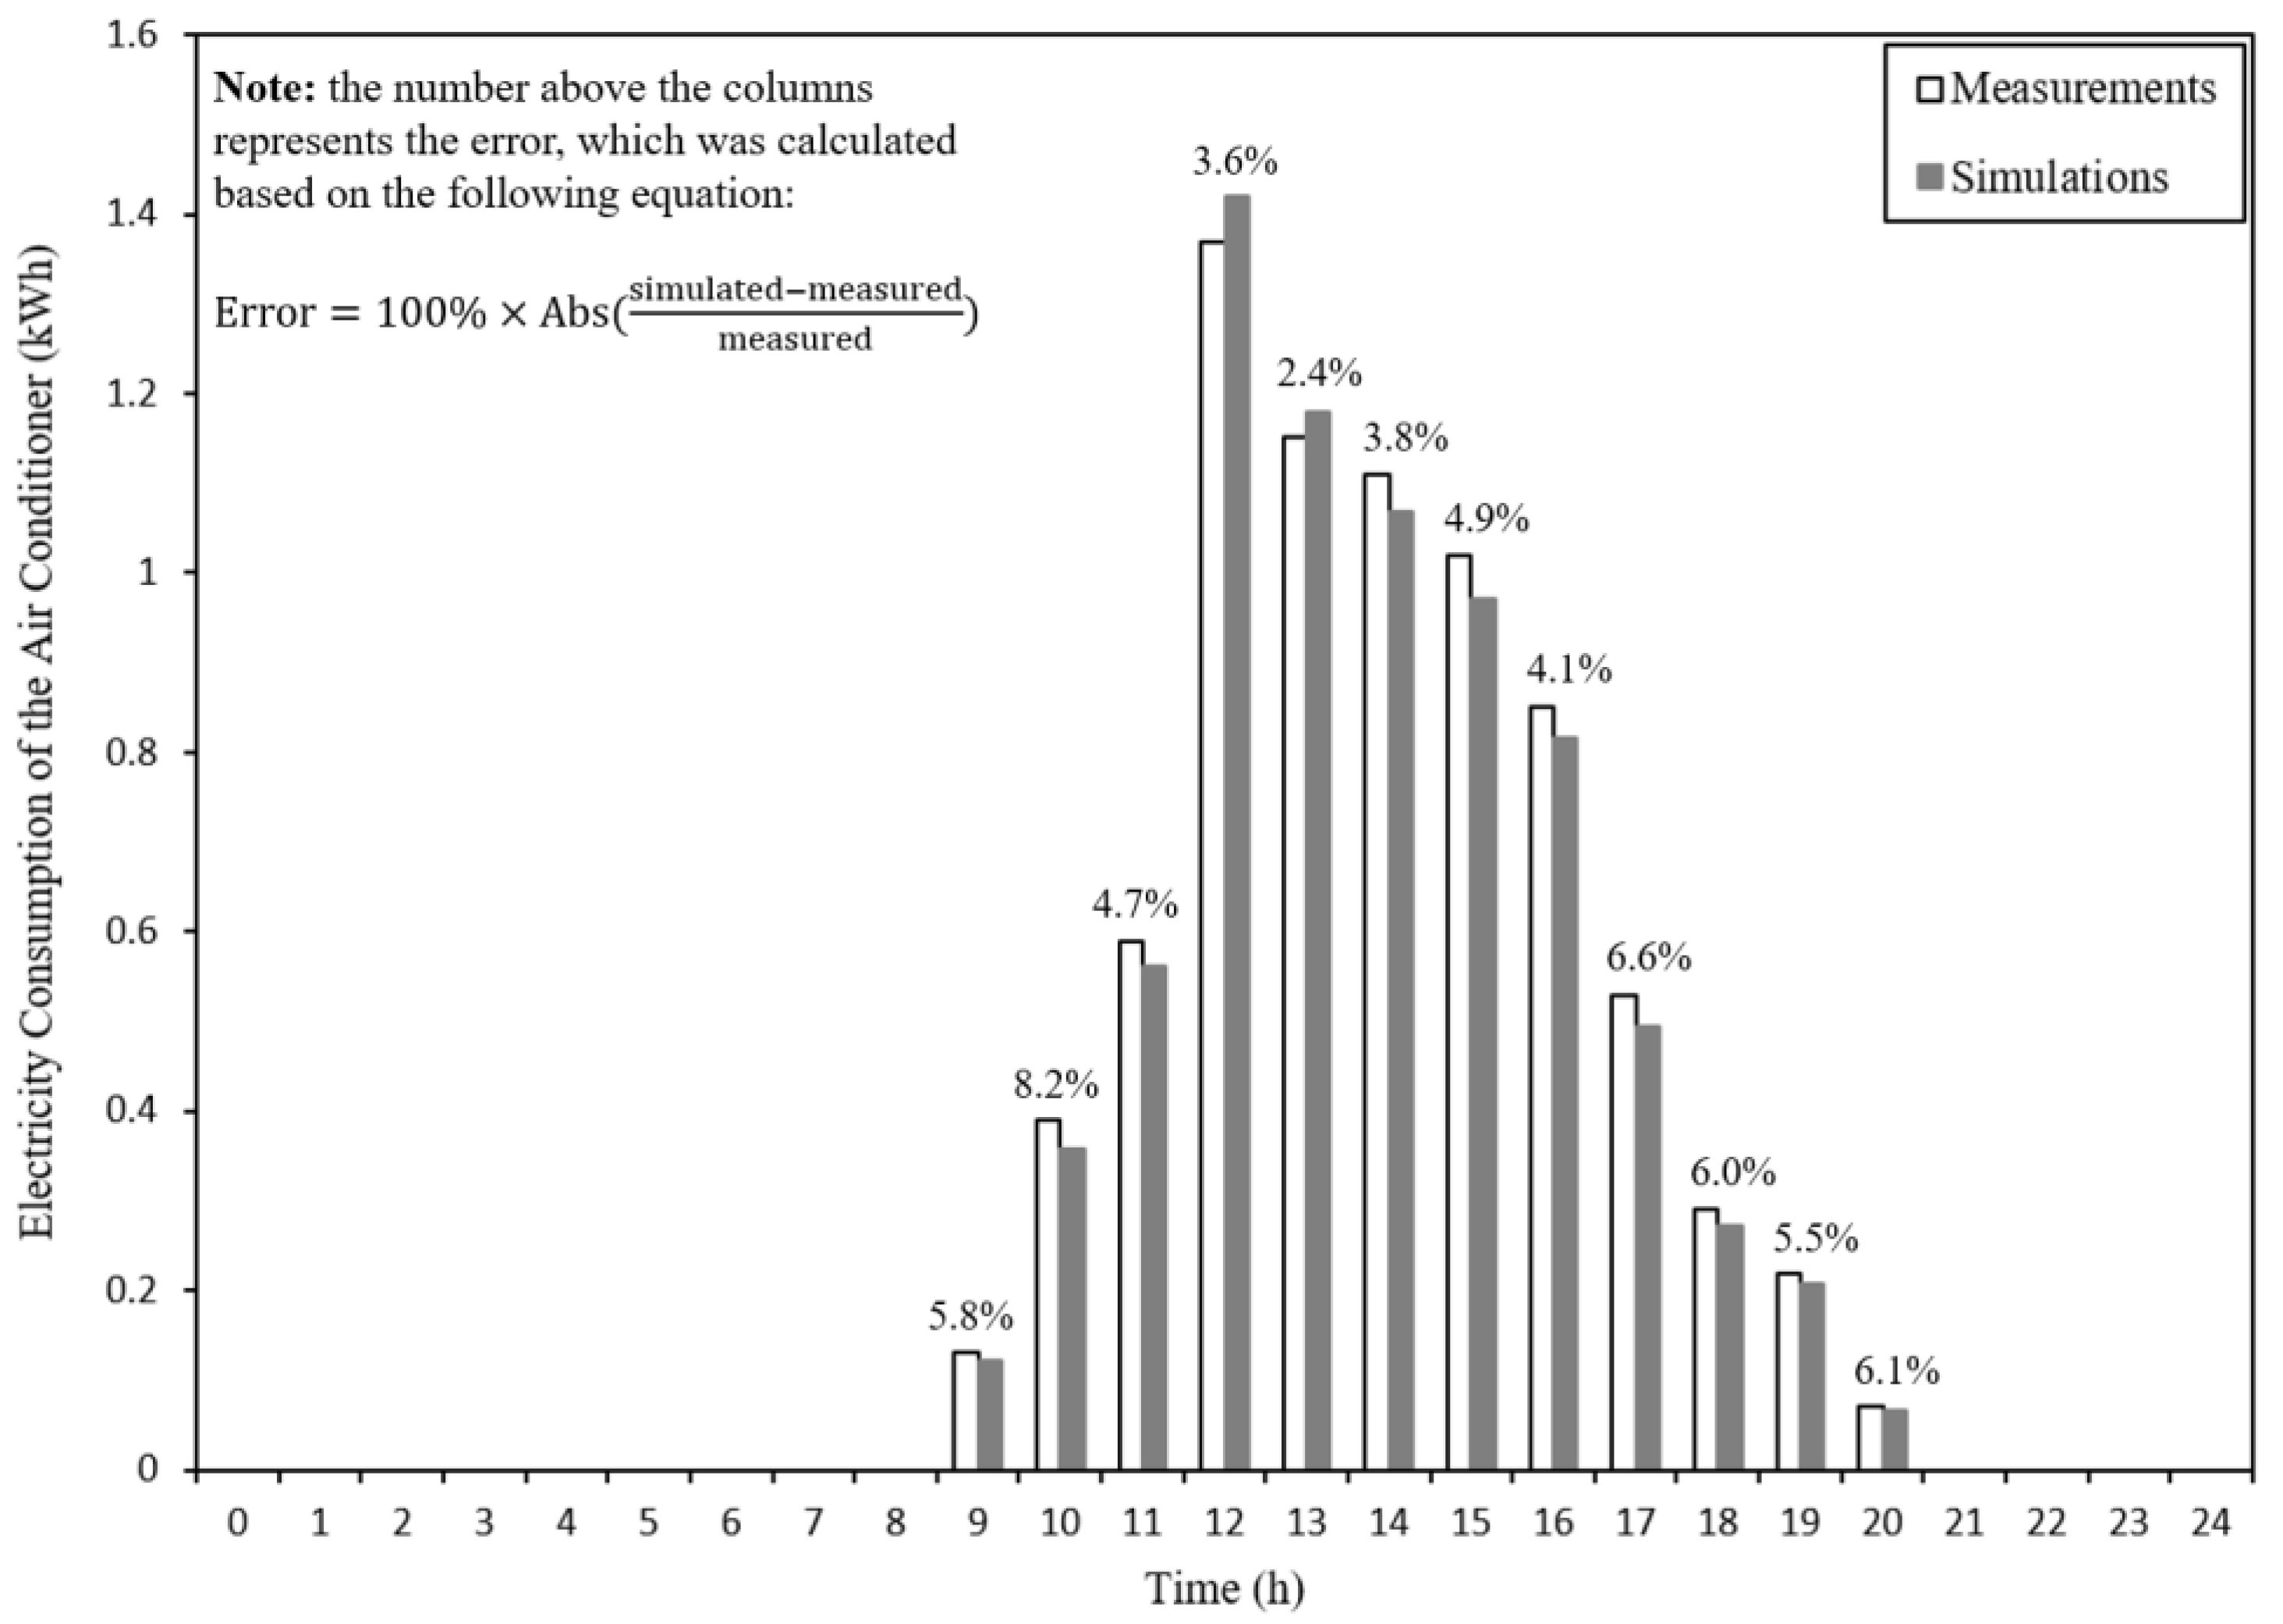
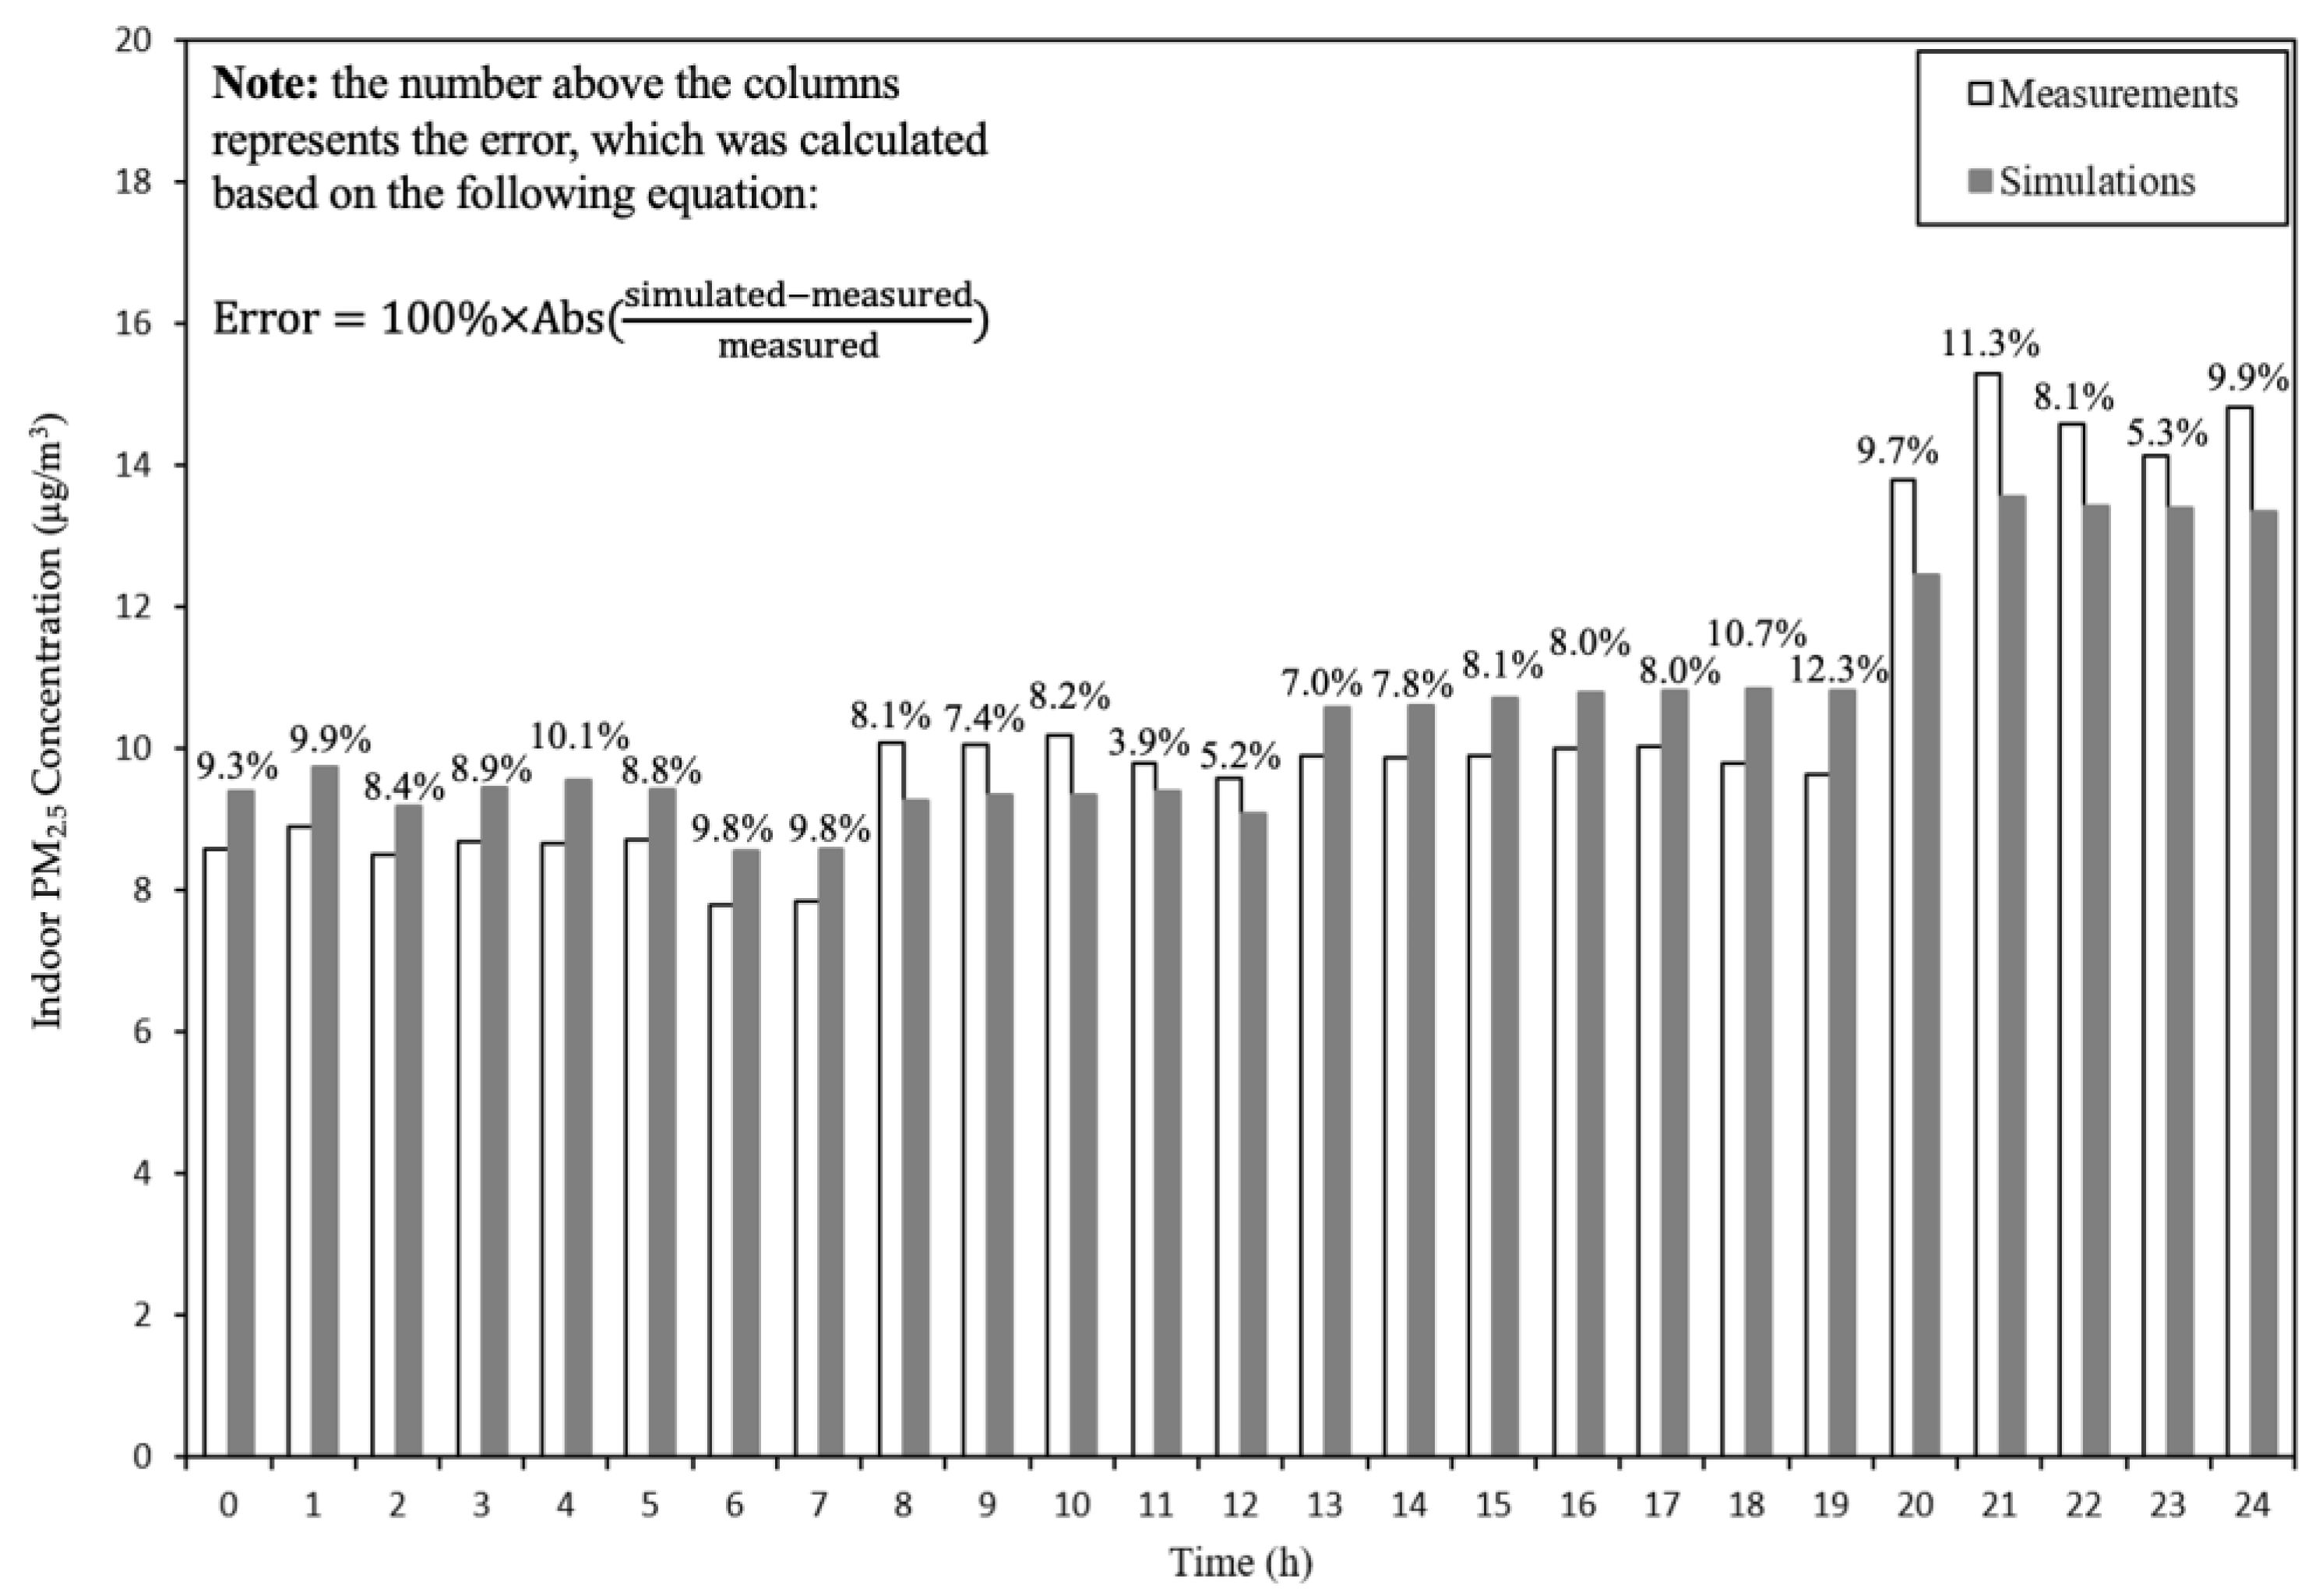
2.5. Model Validation
3. Results
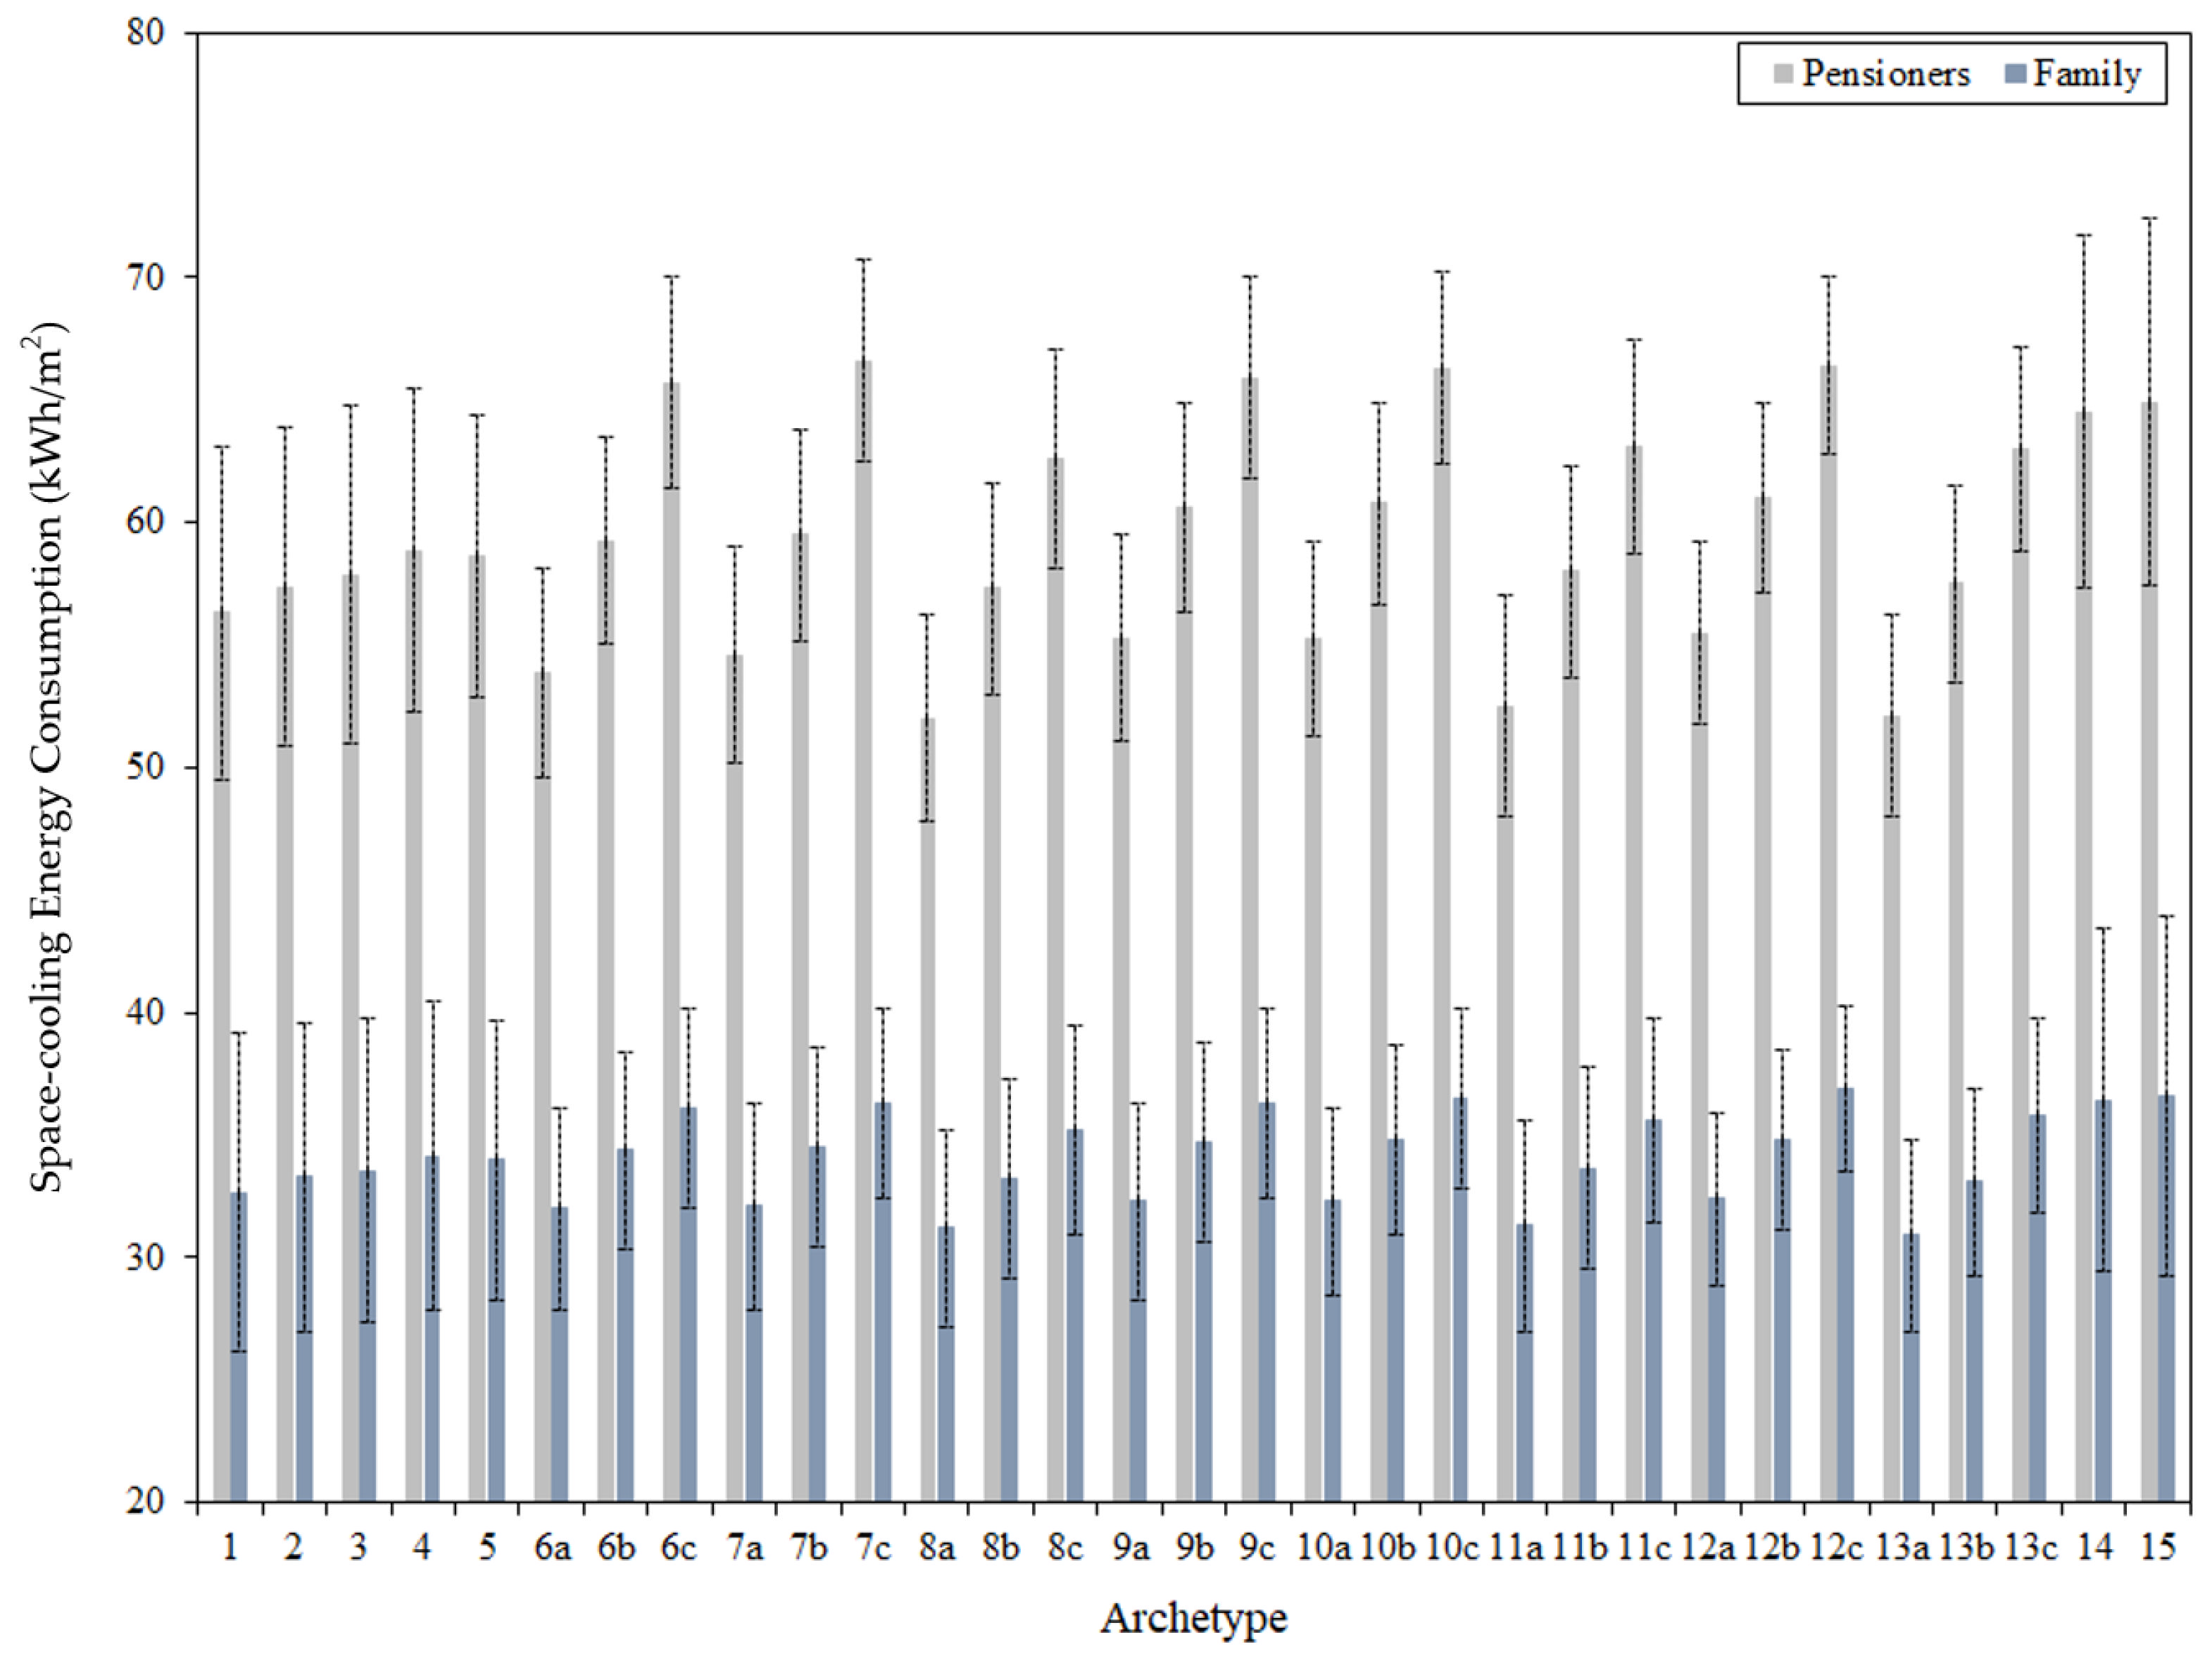
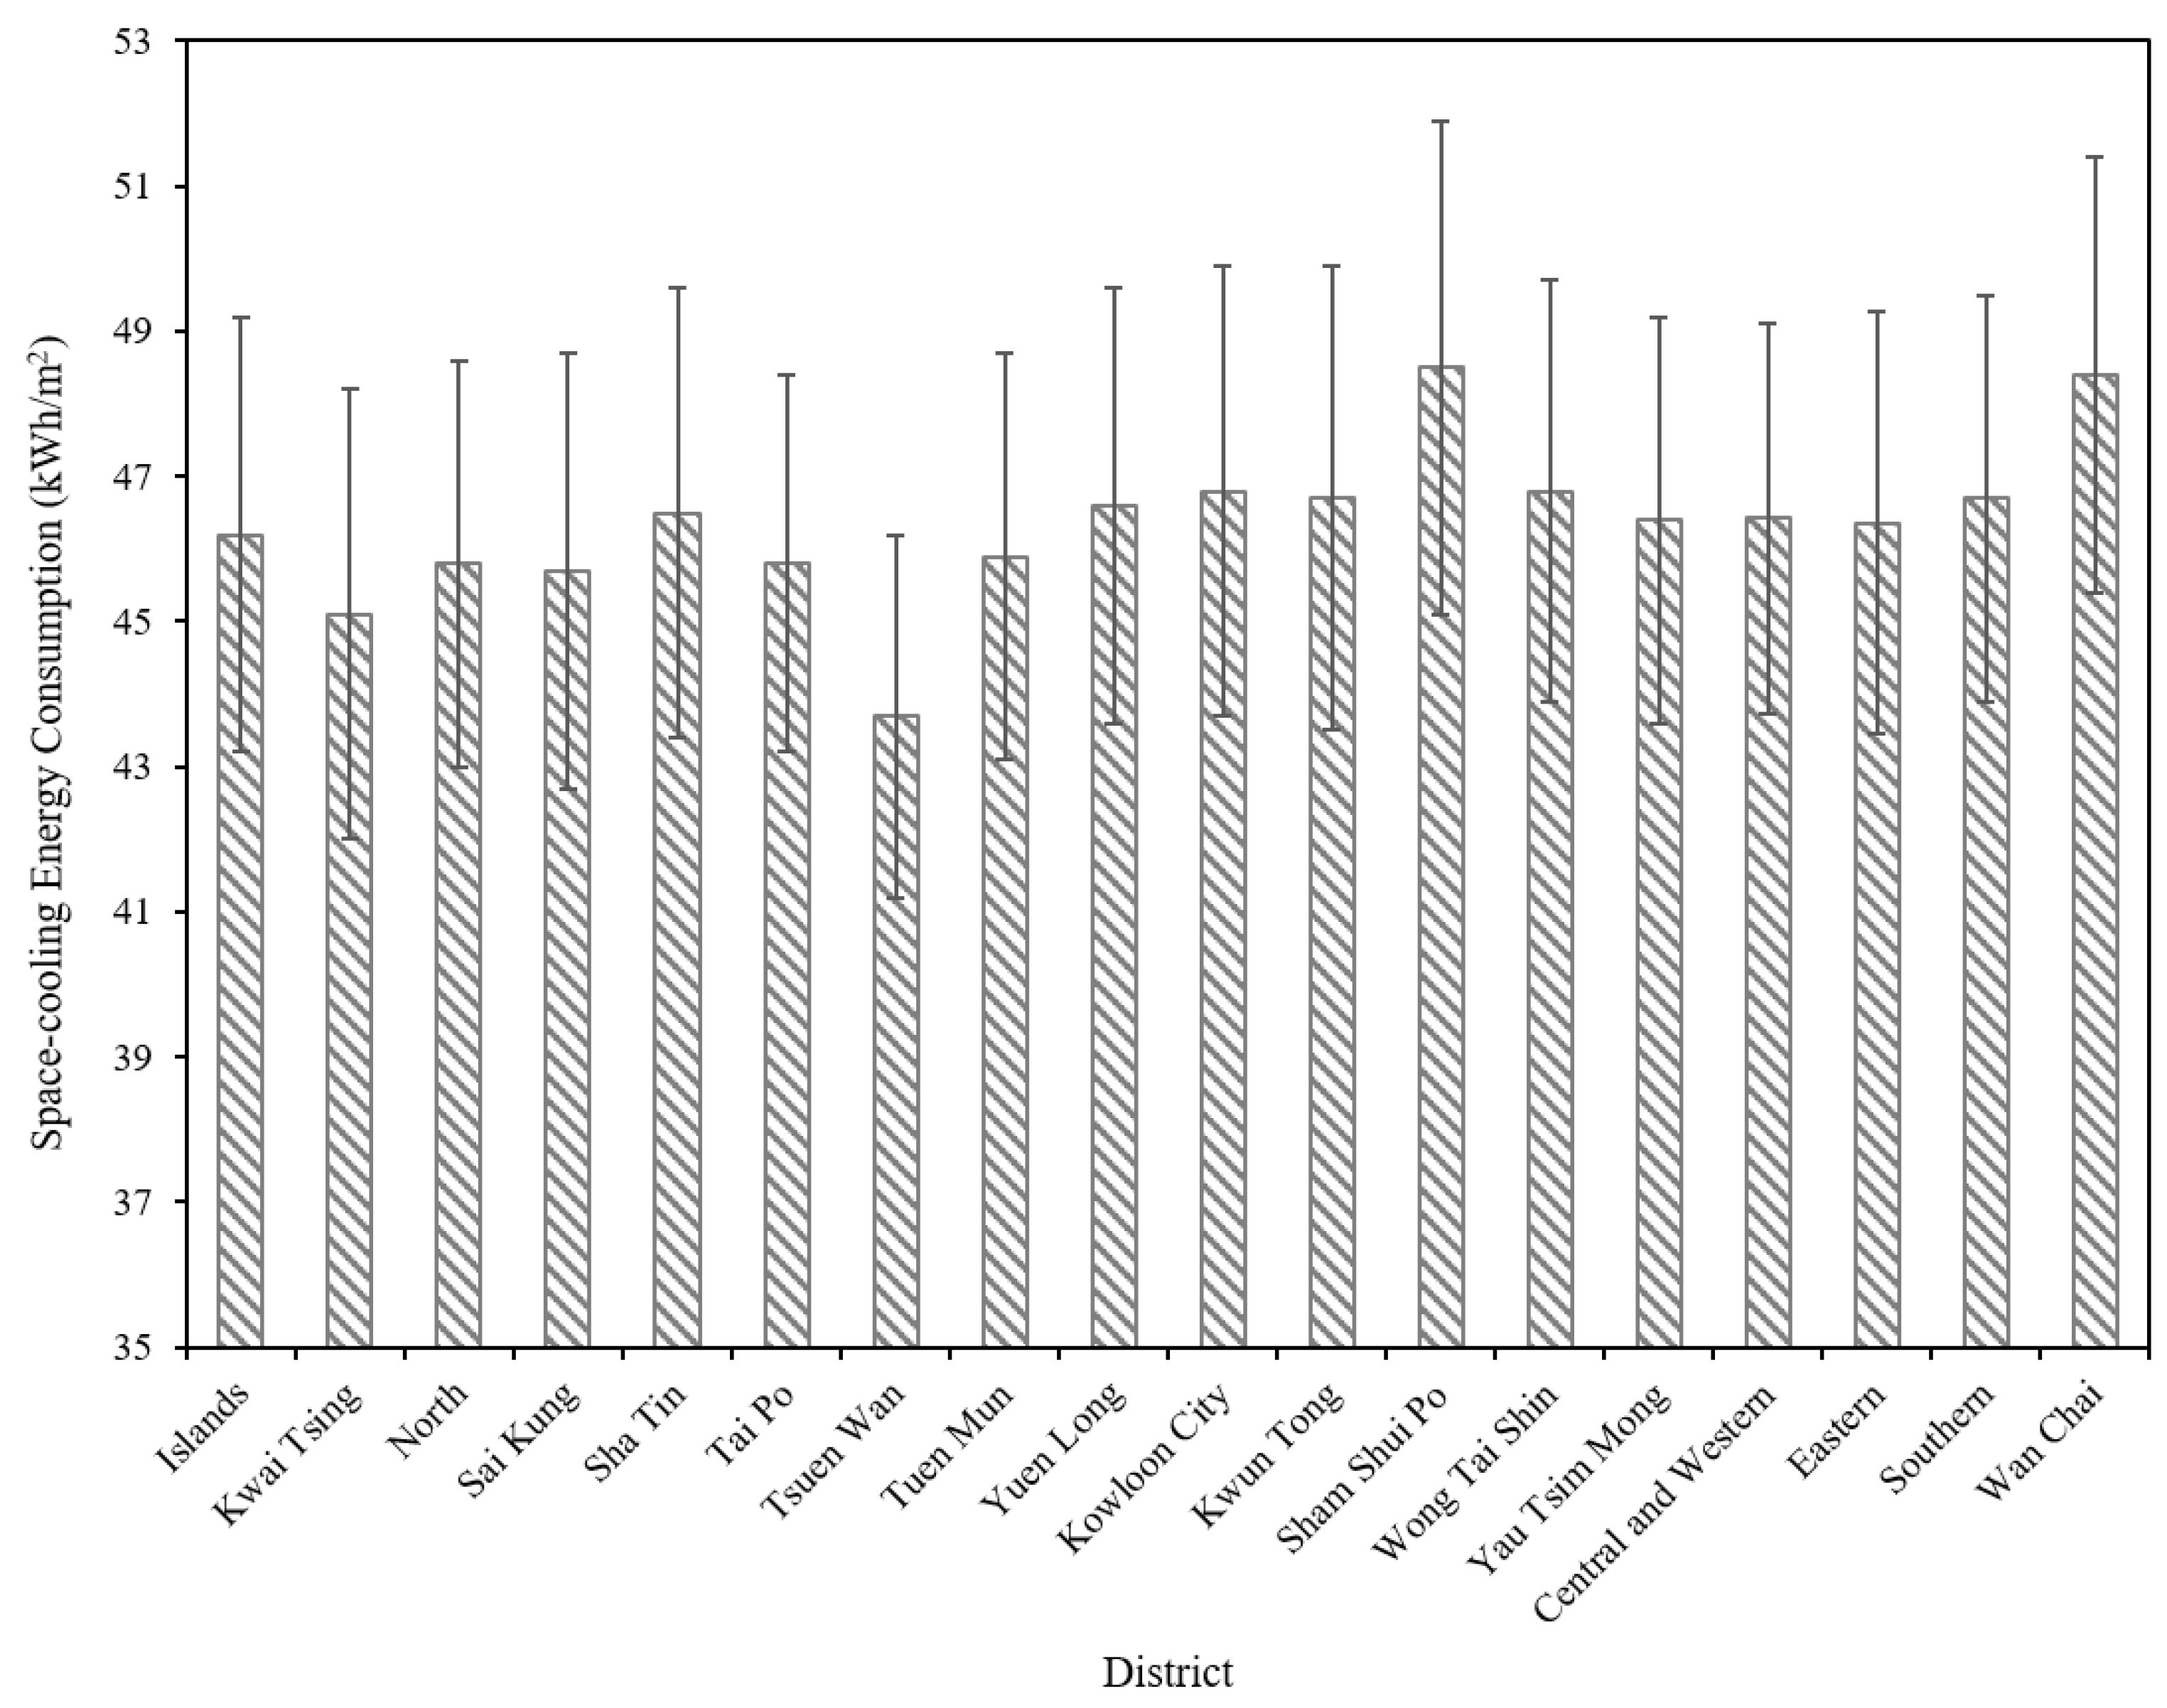
3.1. Space-Cooling Energy Use across the Housing Stock
3.2. Indoor PM2.5 Exposure across the Housing Stock
4. Discussion
4.1. The Housing Stock Model
4.2. Model Outcomes
4.3. Limitations and Further Research
5. Conclusions
- Modern village houses and top-floor flats in high-rise residential buildings, on average, used 19% more space-cooling energy than other dwelling archetypes. Dwellings in Sham Shui Po and Wan Chai were seen to have the greatest energy demand for space cooling, while those in Tsuen Wan had the lowest. High-rise flats with the ability to cross-ventilate, on average, used 7.2% less space-cooling energy than the non-cross-ventilation counterparts;
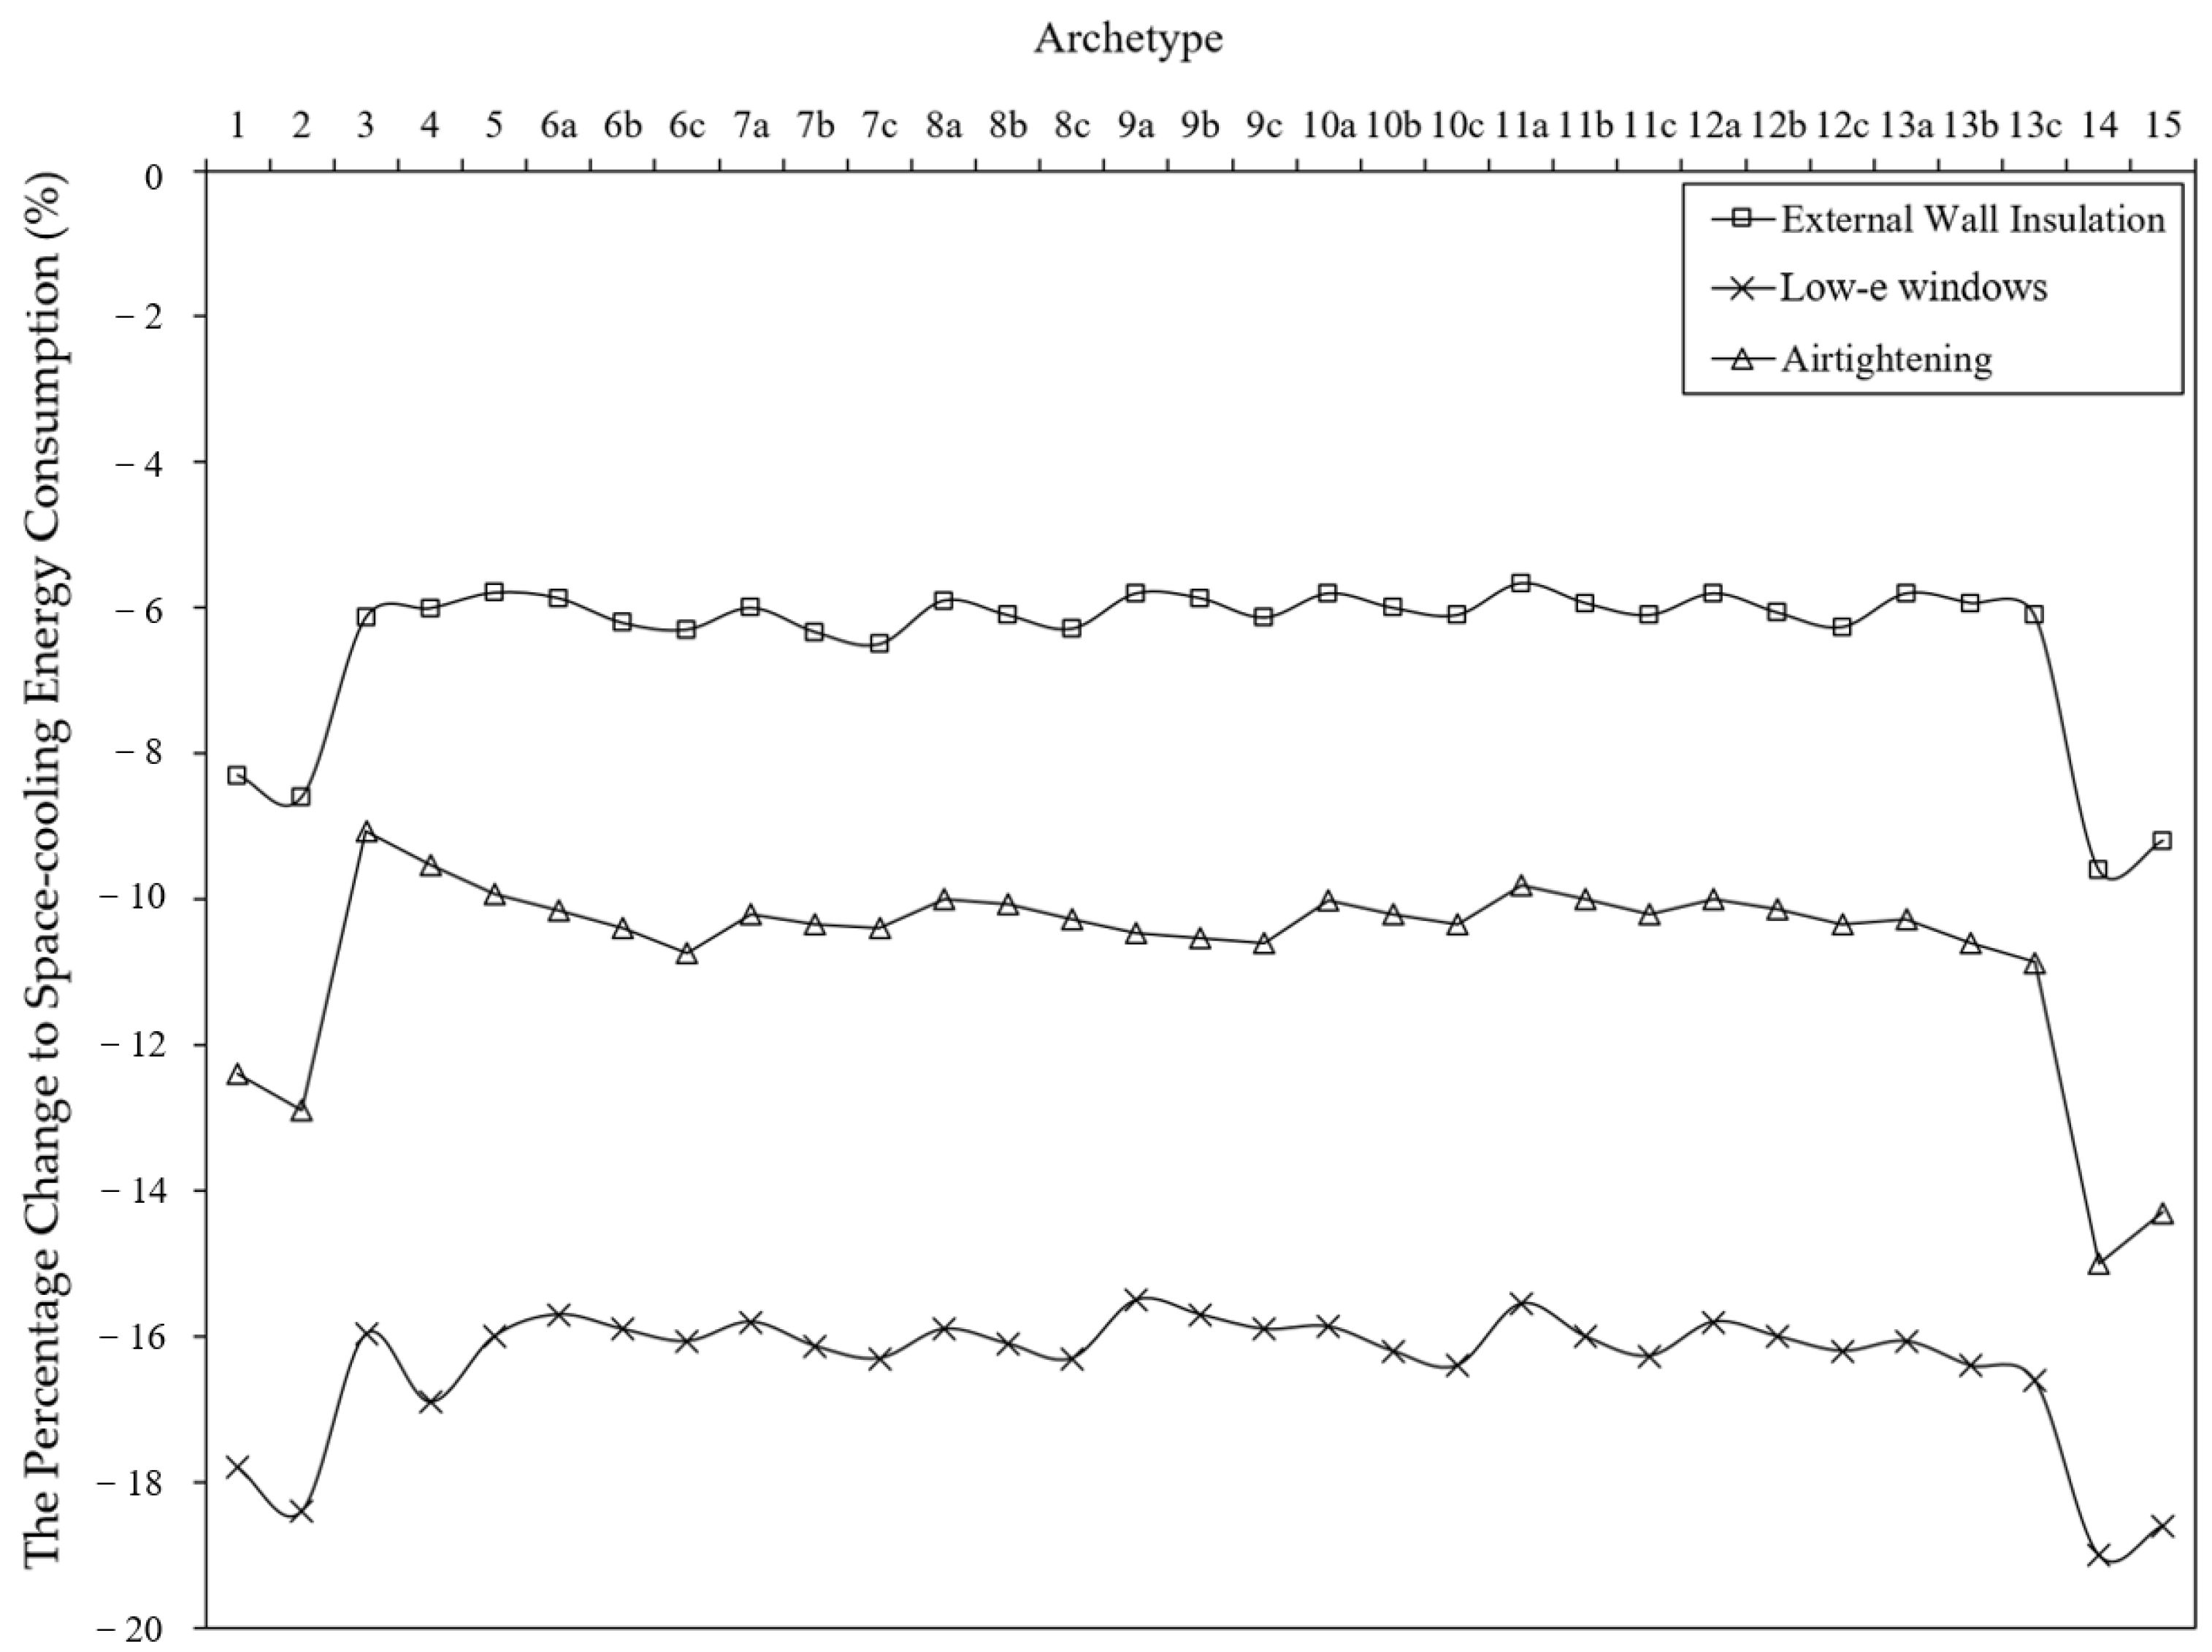
- There were considerable energy benefits to be had from the modelled energy efficiency retrofits, including external wall insulation, airtightening, and low-e windows. The reduction in the space-cooling energy consumption caused by individual retrofits shows, in some cases, a significant difference between different archetypes, highlighting the importance of considering the modifying effect of archetypes when investigating the energy benefits of home energy efficiency retrofits;
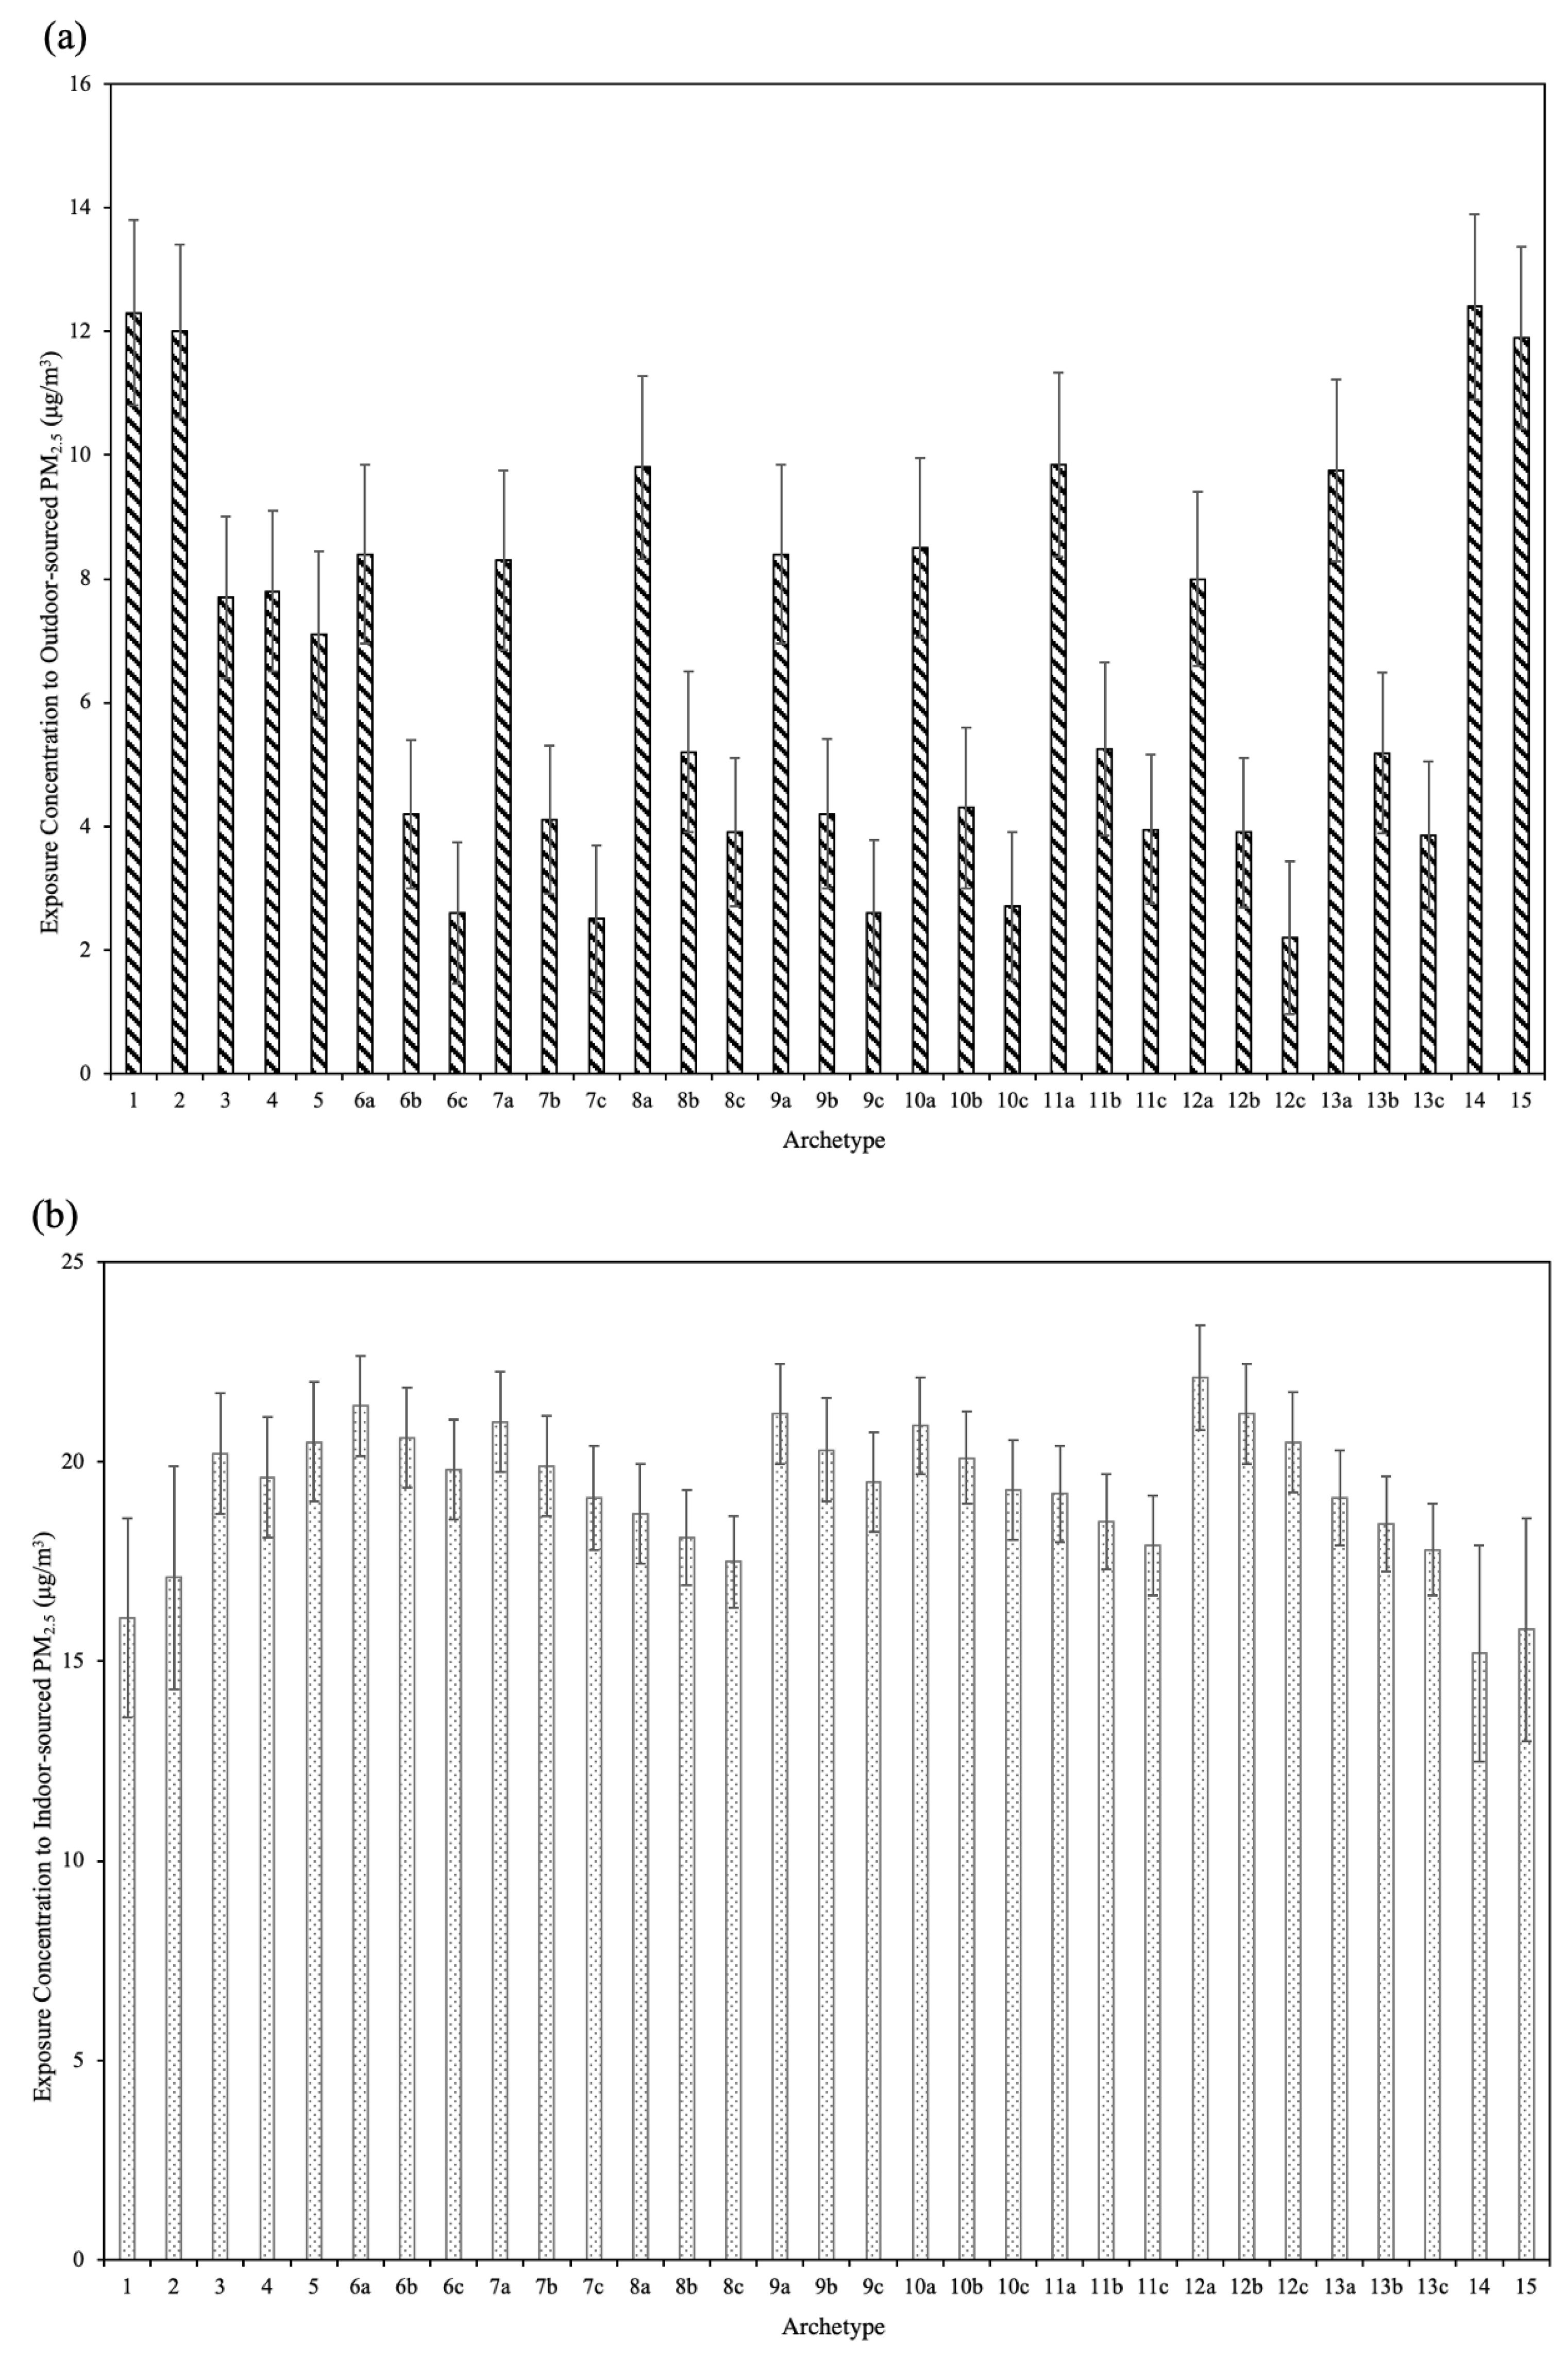
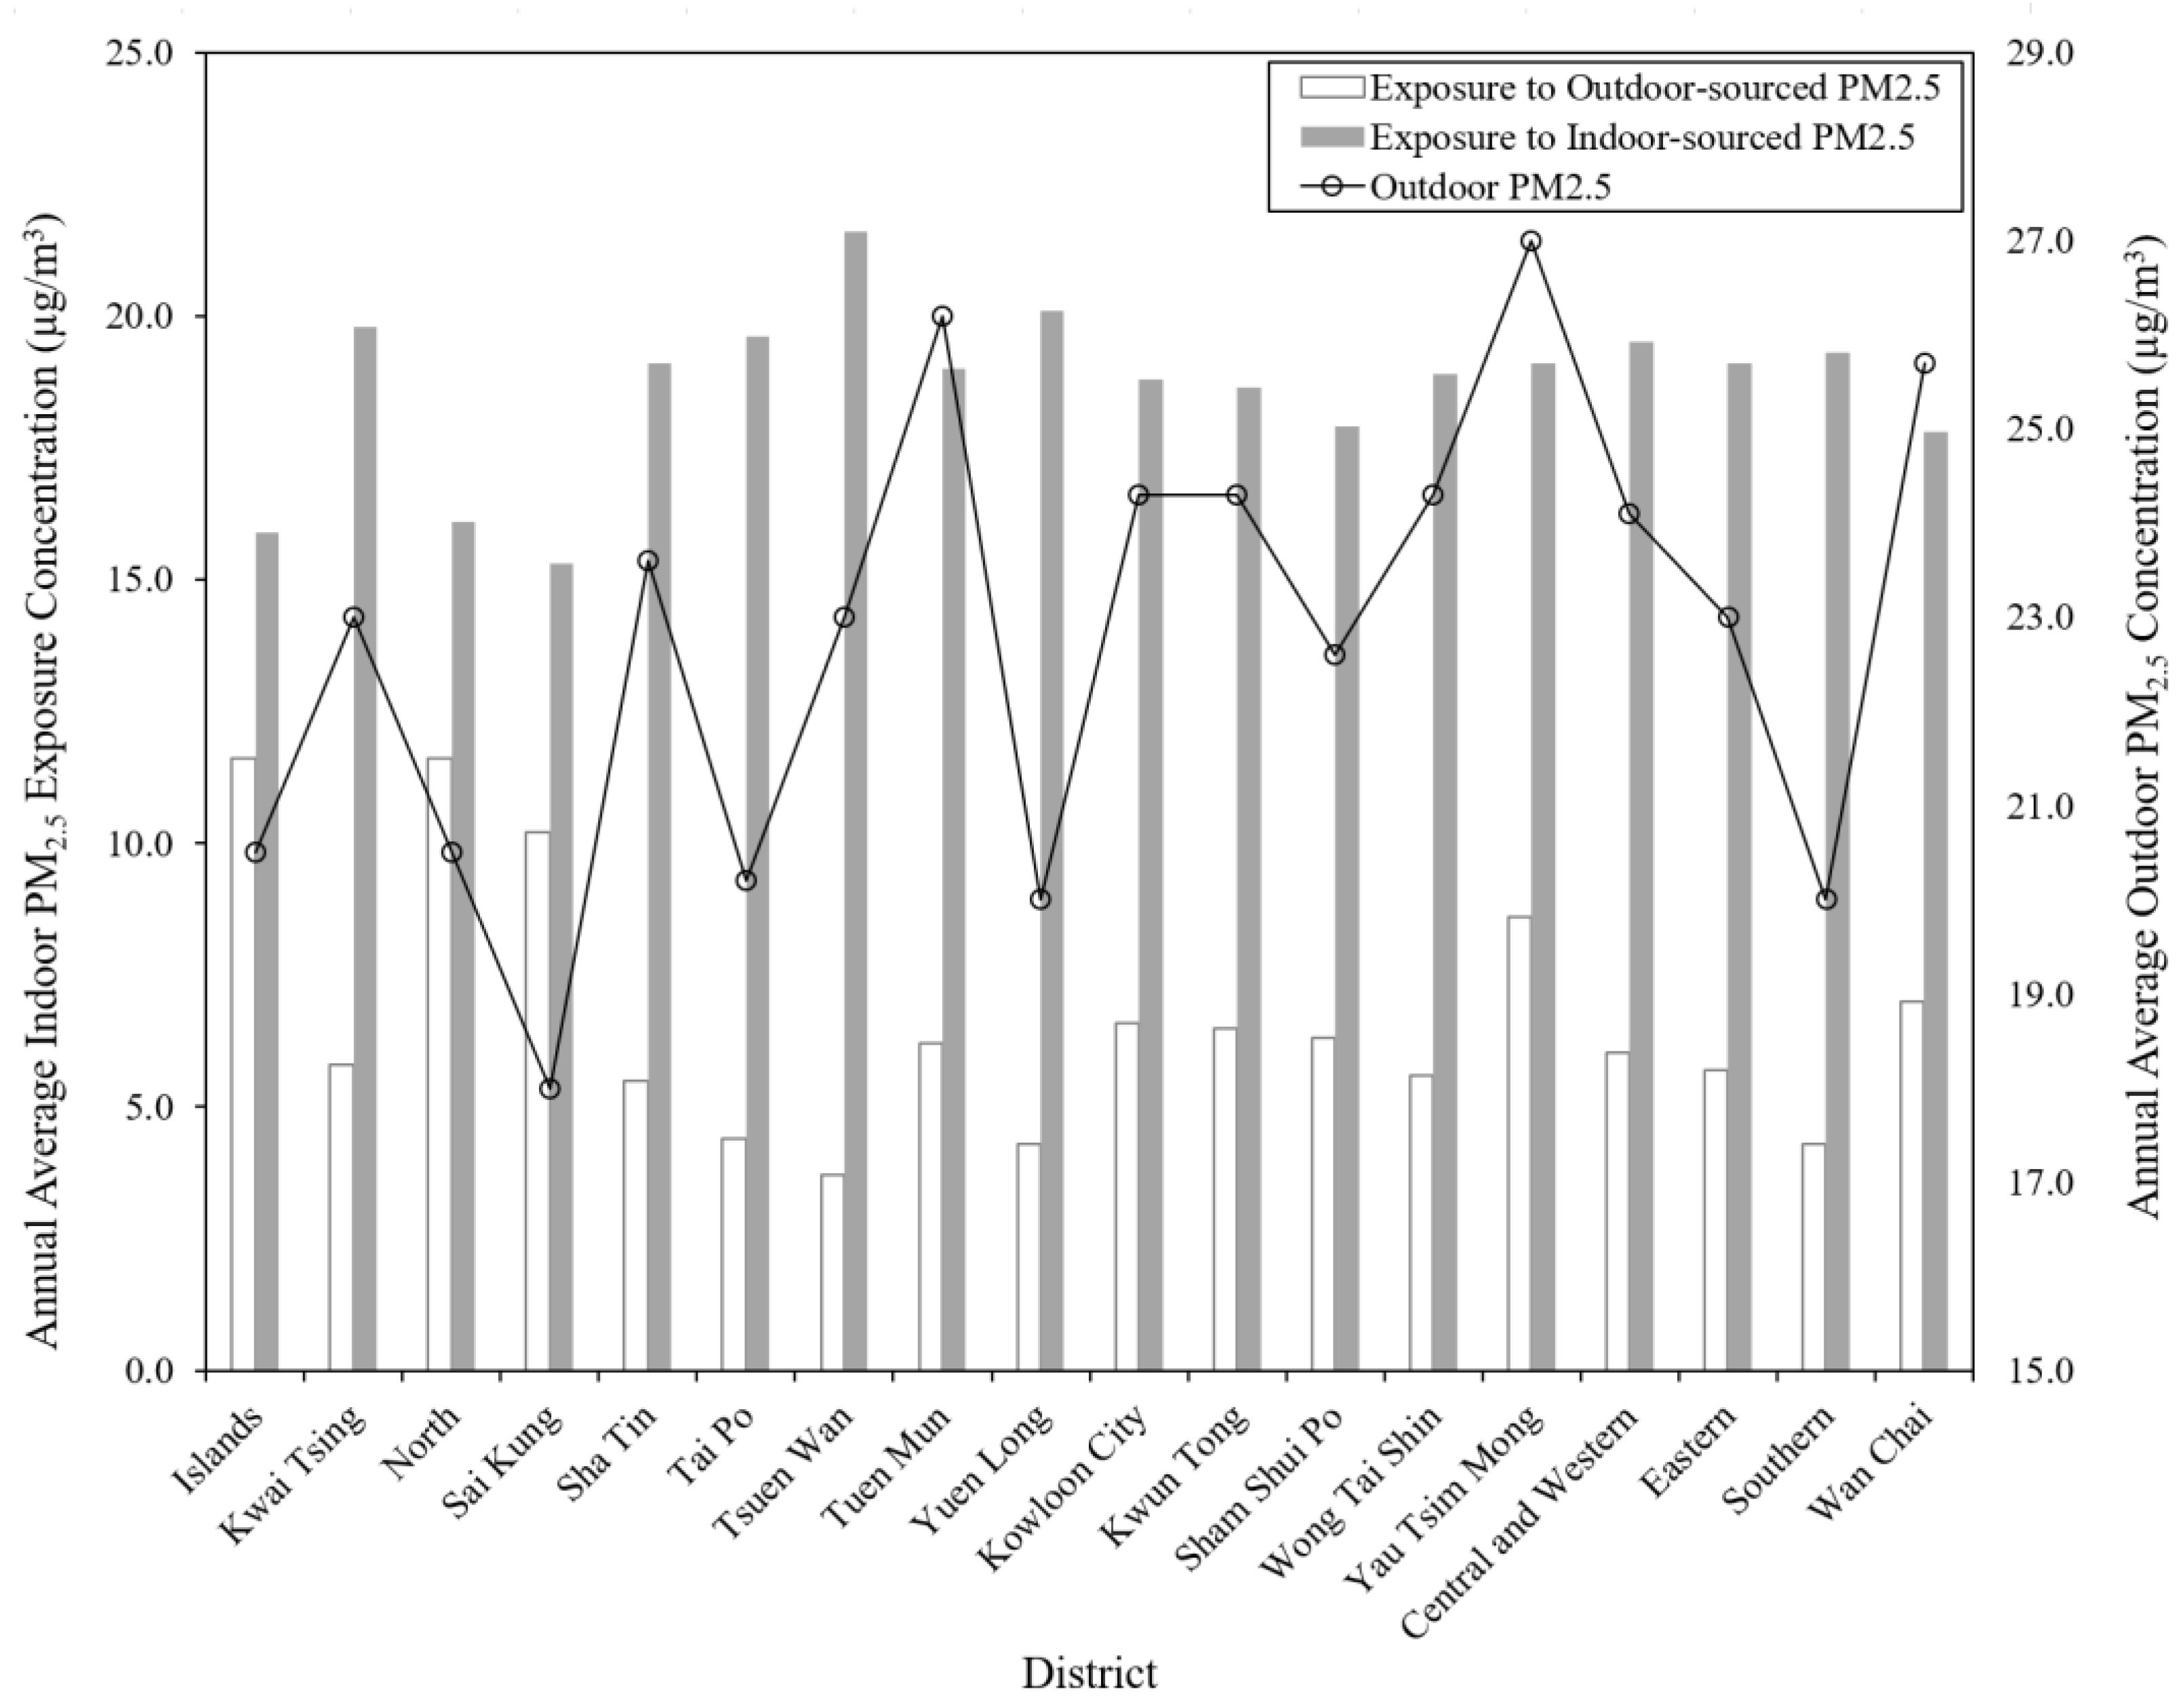
- Exposure to indoor PM2.5 was found to vary according to the geographical location, with lower exposure to outdoor-sourced PM2.5 for dwellings in urban areas due to airtight low- and high-rise flats being the dominant dwelling archetypes, and higher exposure to outdoor-sourced PM2.5 for dwellings in rural areas due to the predominance of leaky modern village houses. This variation was in contrast to the profile of outdoor PM2.5 concentrations, which showed that outdoor PM2.5 concentrations were higher in urban areas than in rural areas. The inverse effect was found for exposure to indoor-sourced PM2.5, with dwellings in urban areas exhibiting greater exposure than those in rural areas;
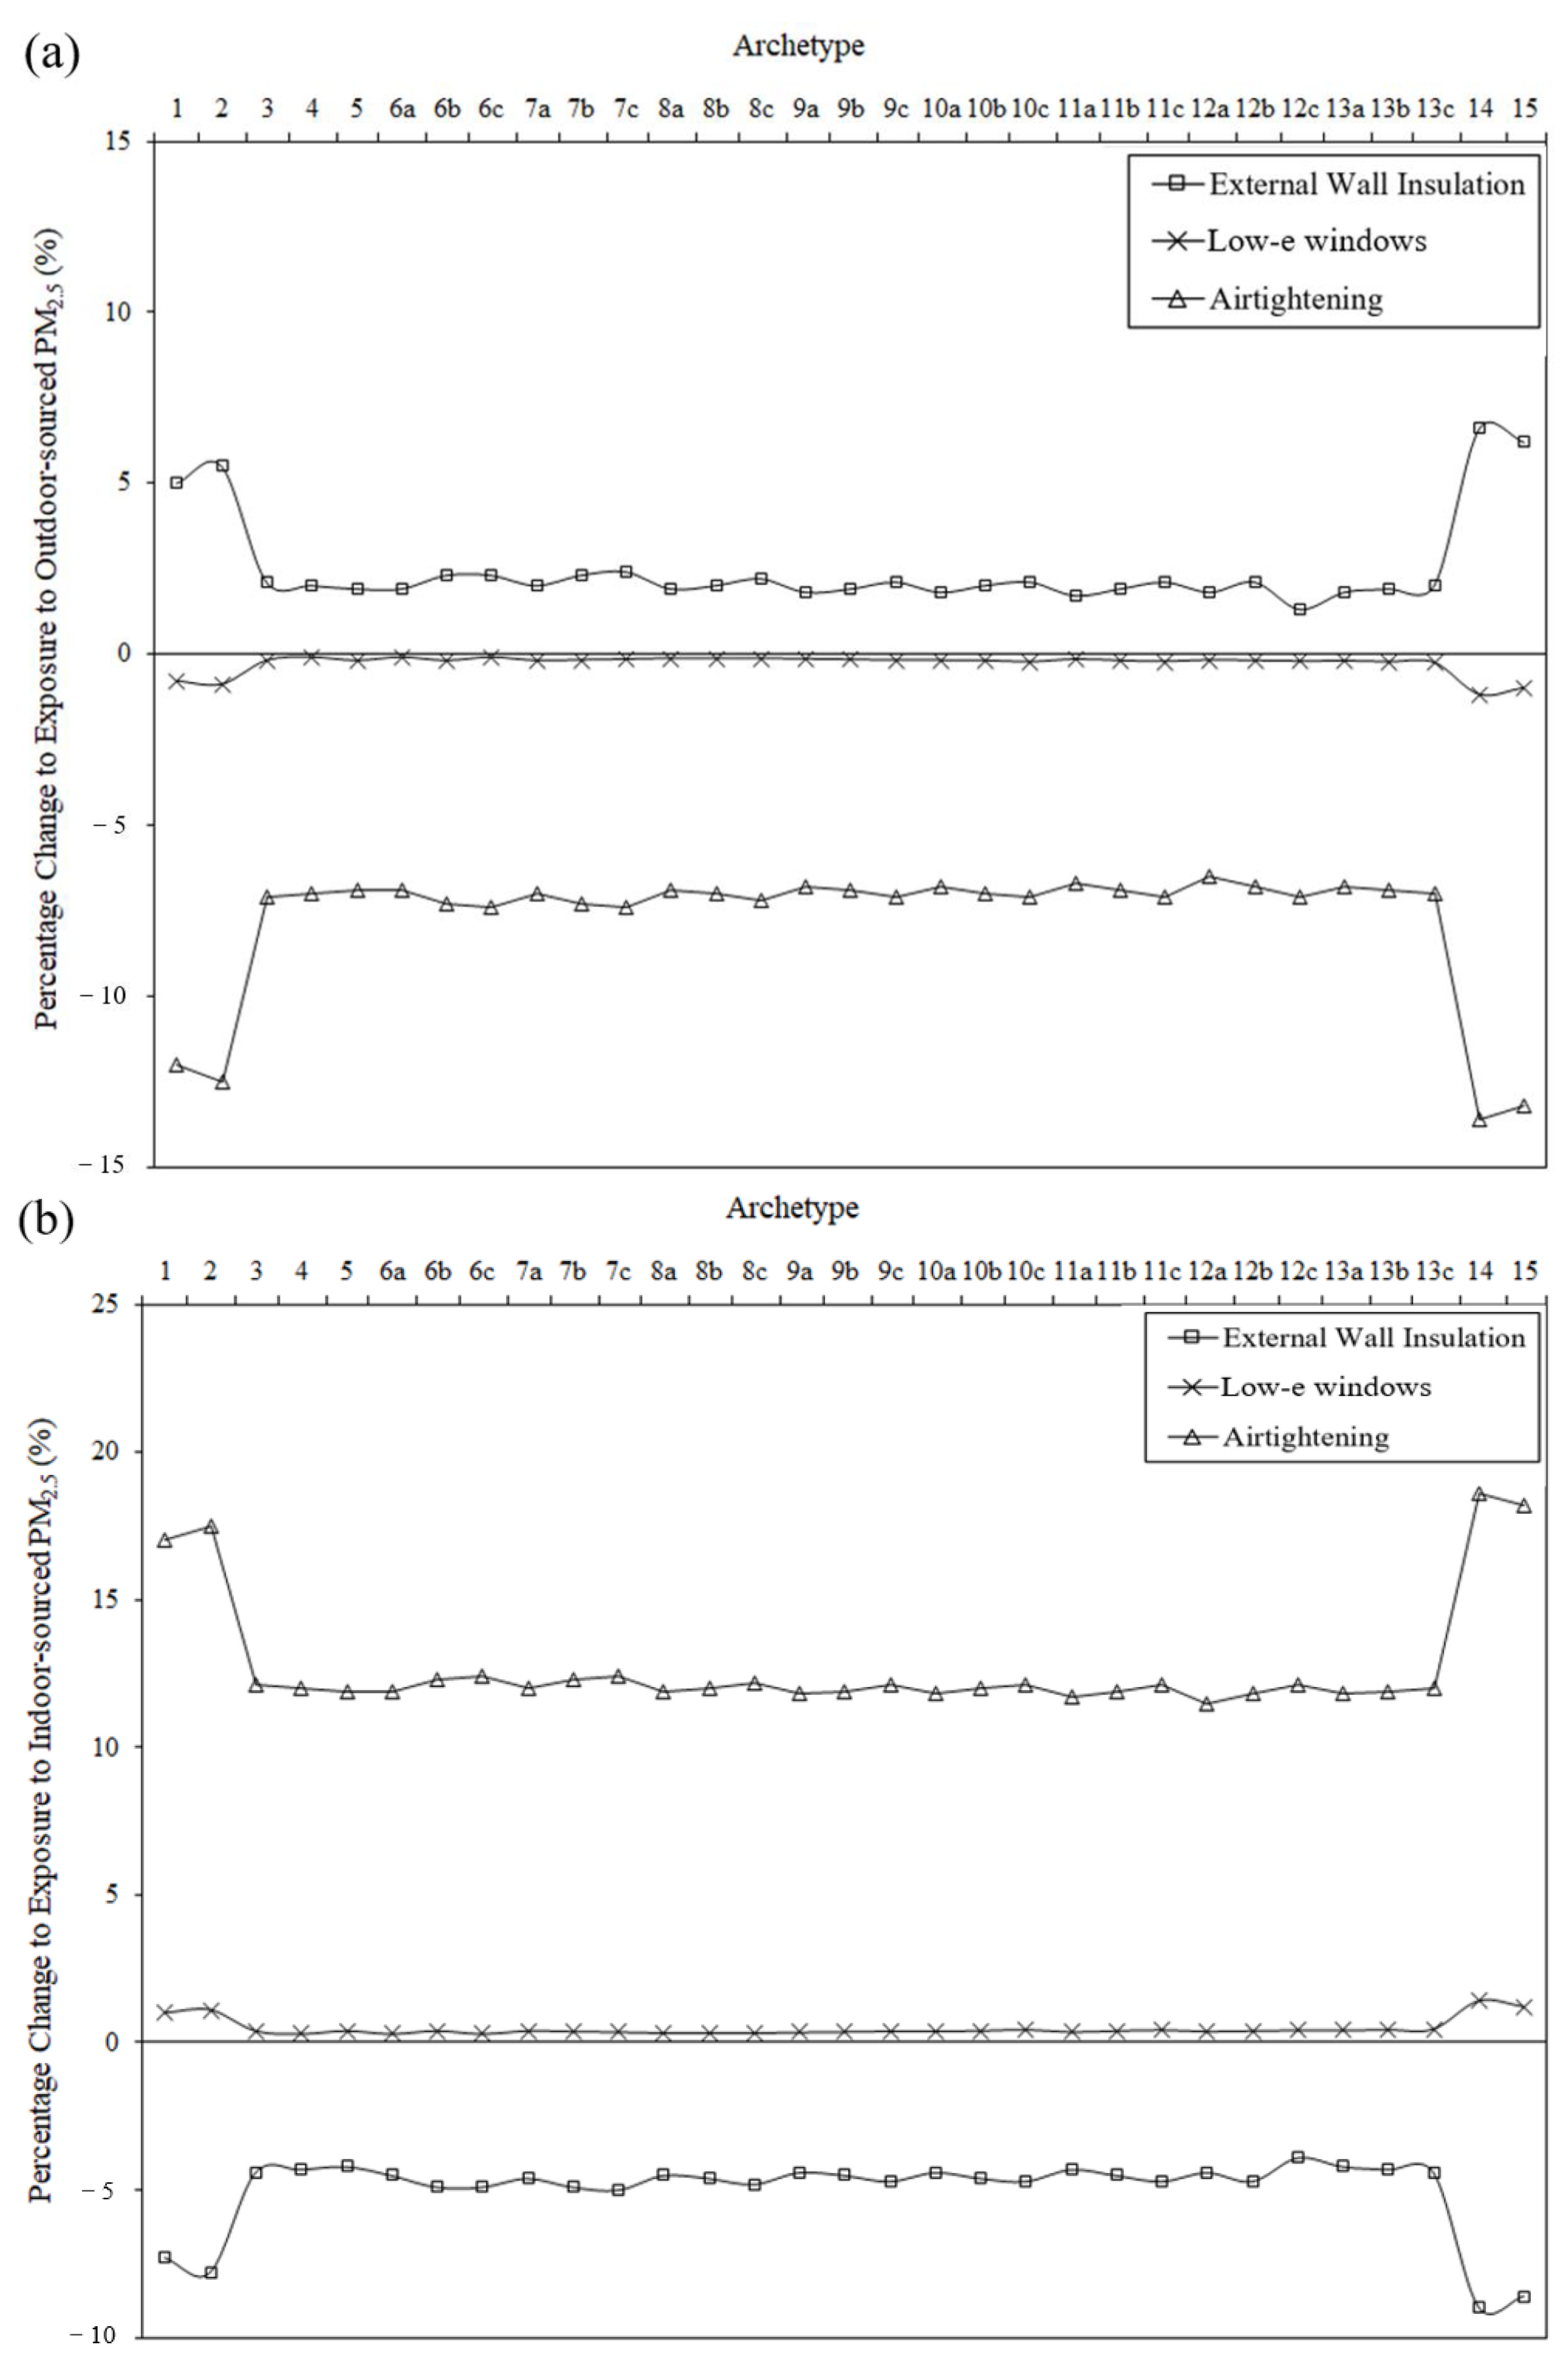
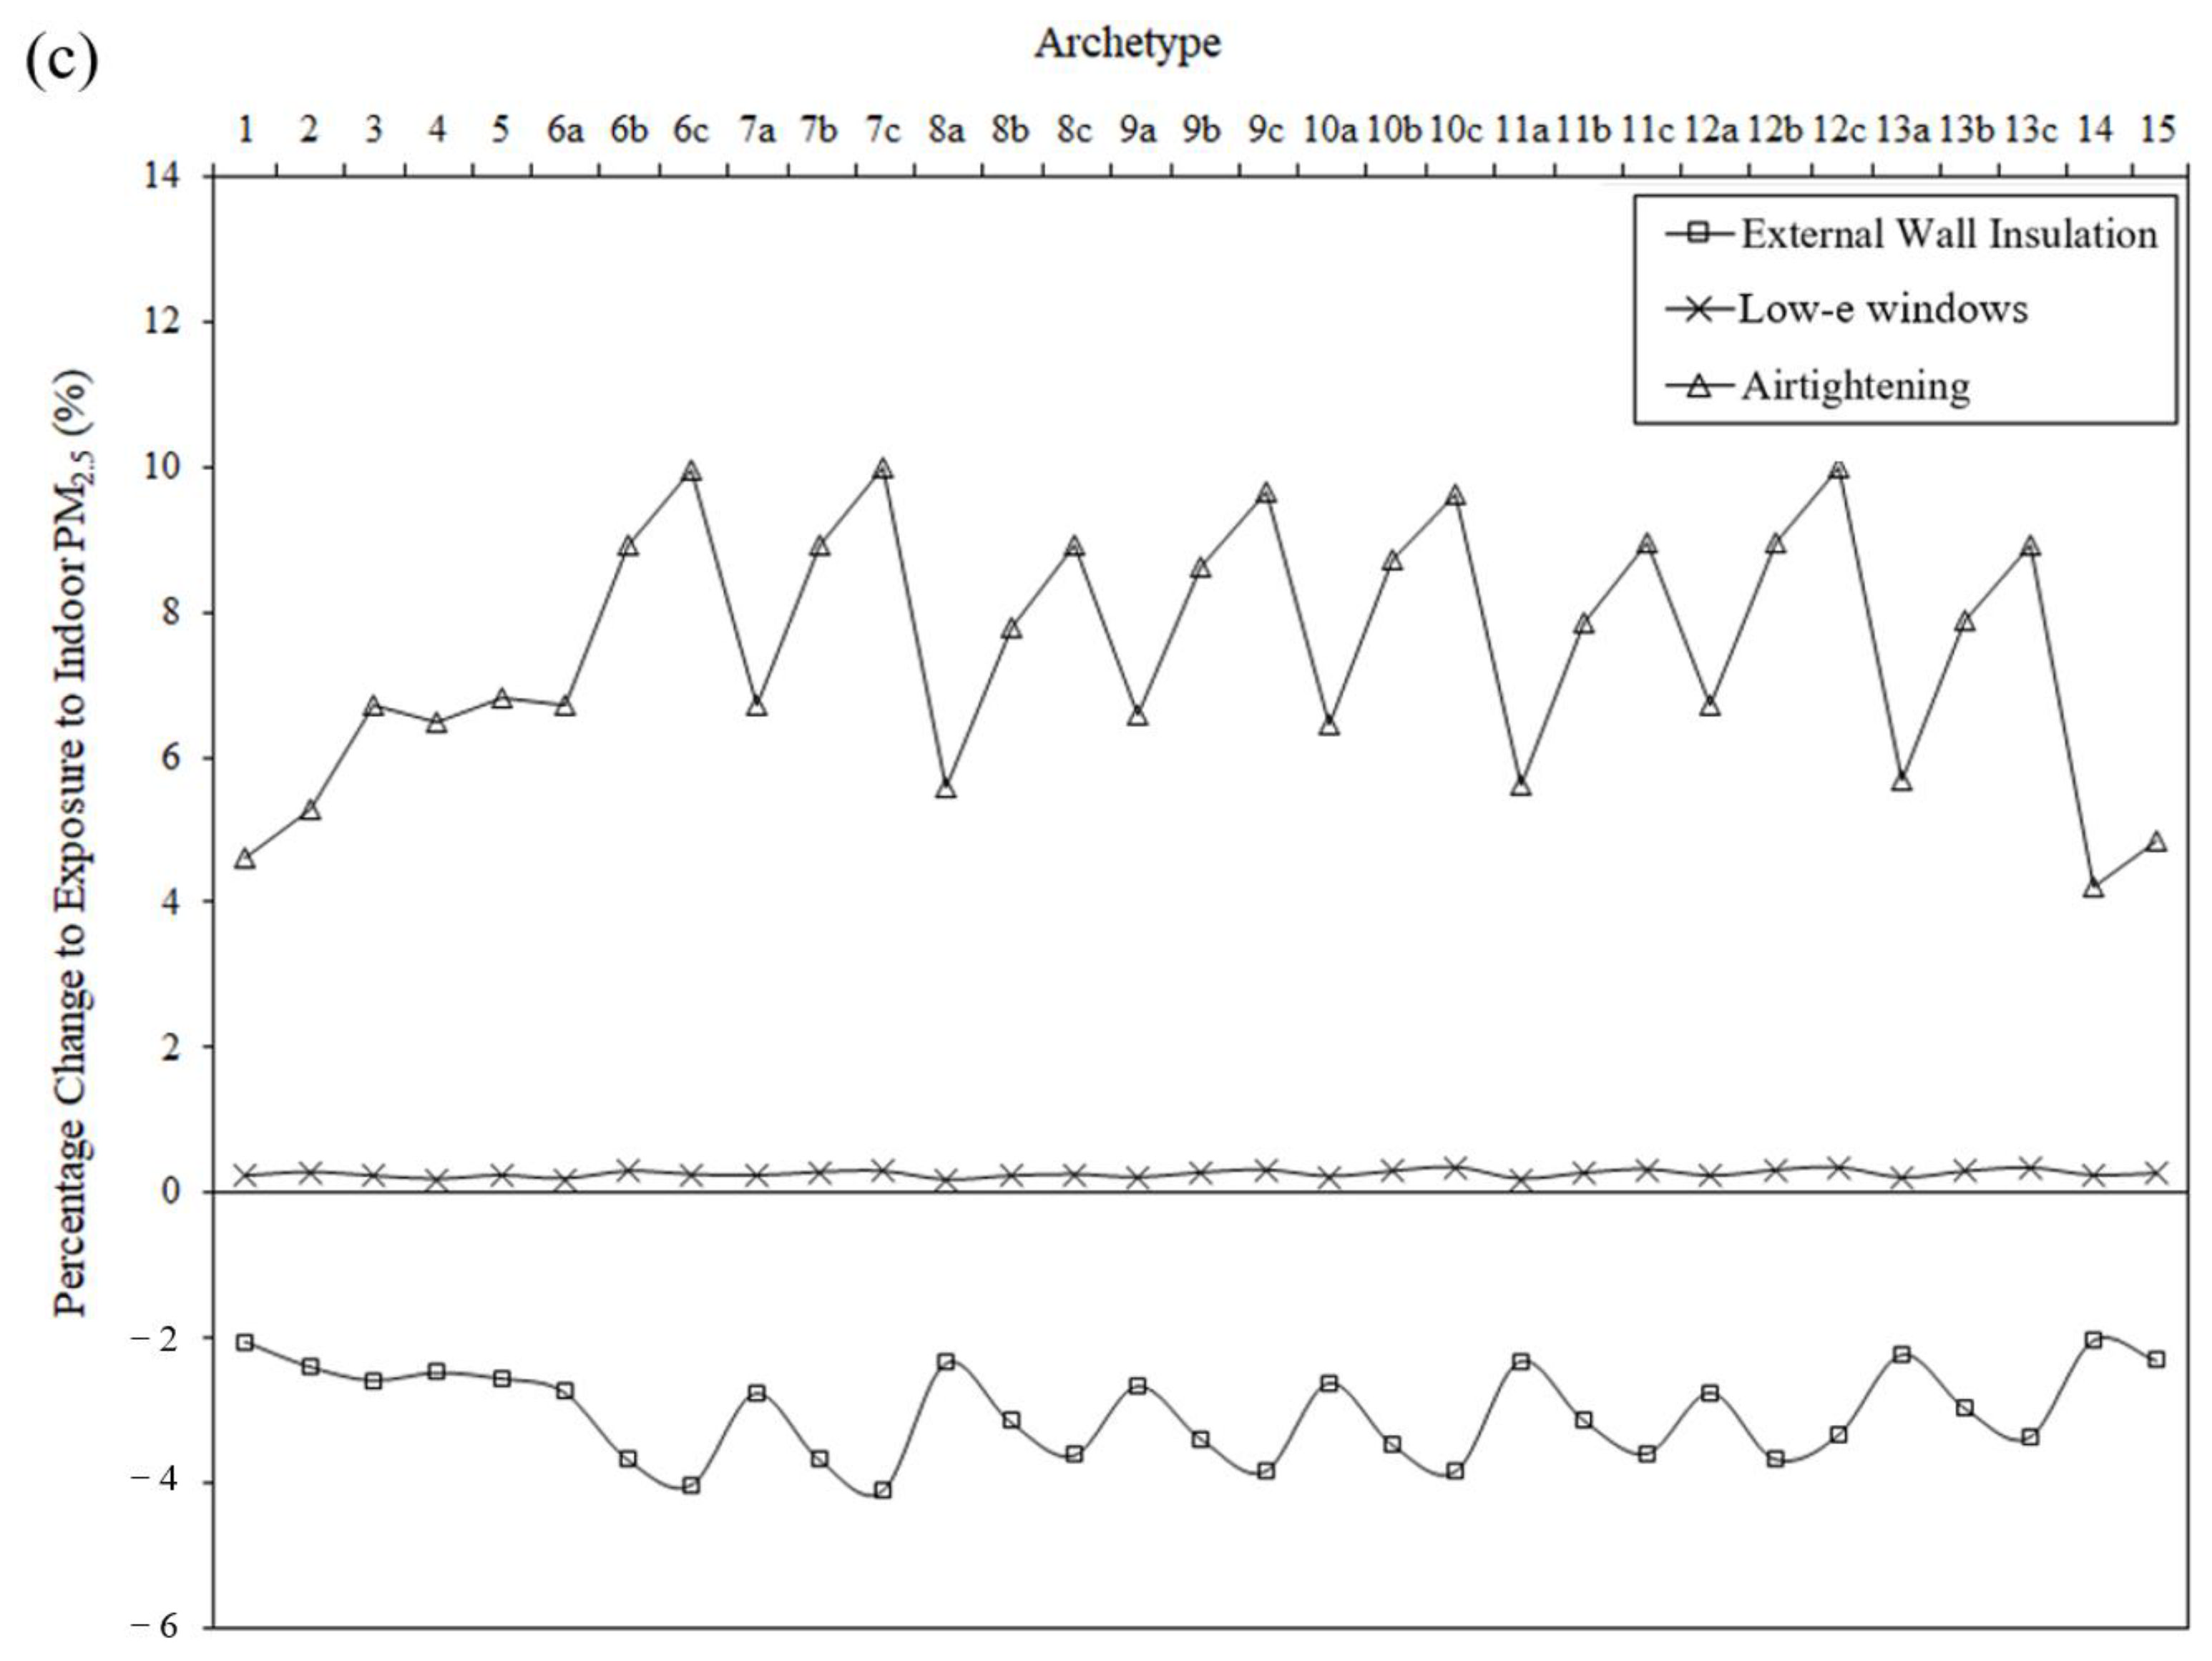
- The modelled energy efficiency retrofits had a greater impact on exposure from indoor or outdoor sources for tenements and modern village houses than on exposure from indoor or outdoor sources for flats. When combining exposure to indoor PM2.5 from different sources, the housing stock saw 7.9% and 0.2% average increases in exposure from airtightening and low-e windows, respectively, and an average decrease of 3.5% in exposure from external wall insulation.
Author Contributions
Funding
Data Availability Statement
Acknowledgments
Conflicts of Interest
Appendix A

| Archetype | Example Building | Floor Plan |
|---|---|---|
| 1 |  | 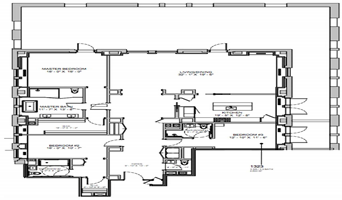 |
| 2 | 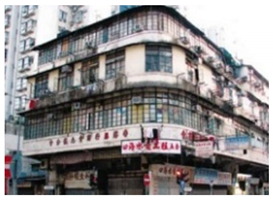 |  |
| 3 | 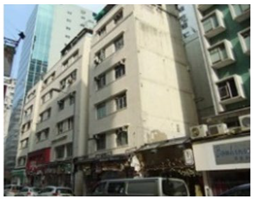 | 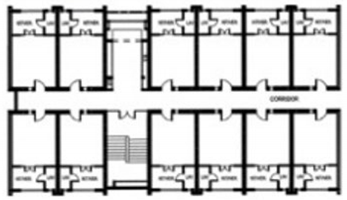 |
| 4 |  |  |
| 5 | 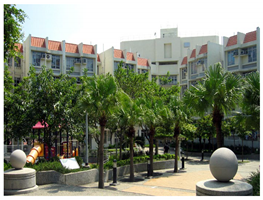 | 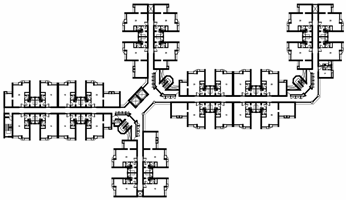 |
| 6 | 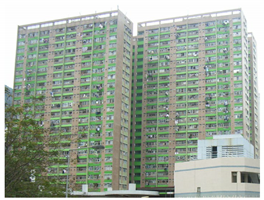 | 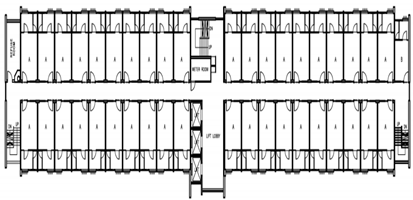 |
| 7 | 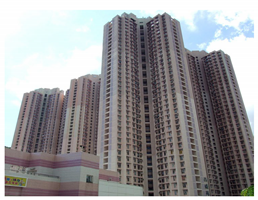 | 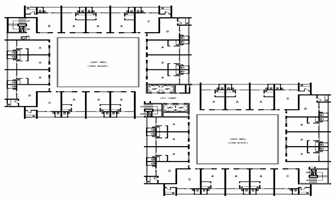 |
| 8 | 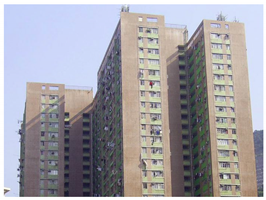 | 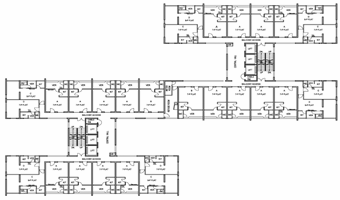 |
| 9 |  | 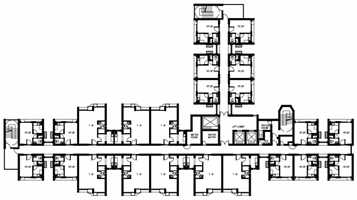 |
| 10 | 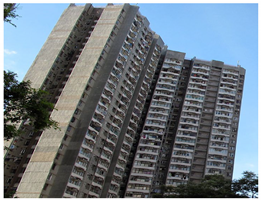 | 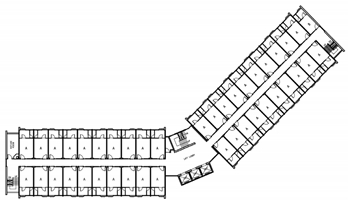 |
| 11 | 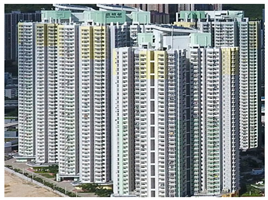 | 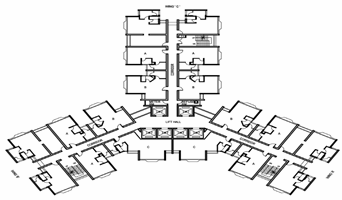 |
| 12 | 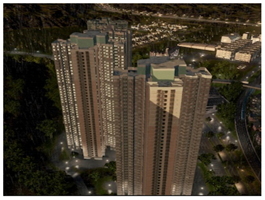 |  |
| 13 | 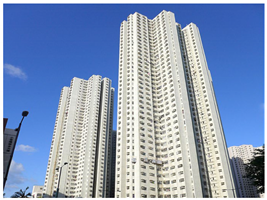 |  |
| 14 | 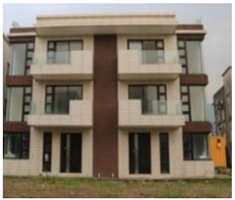 |  |
| 15 |  | 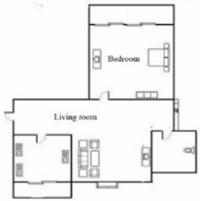 |
Appendix B
Appendix C
- The cross-ventilation path between the primary window-opening and secondary window-opening should be composed of no more than two straight lines (i.e., one turn only);
- The angle of the turn should not be greater than 90°;
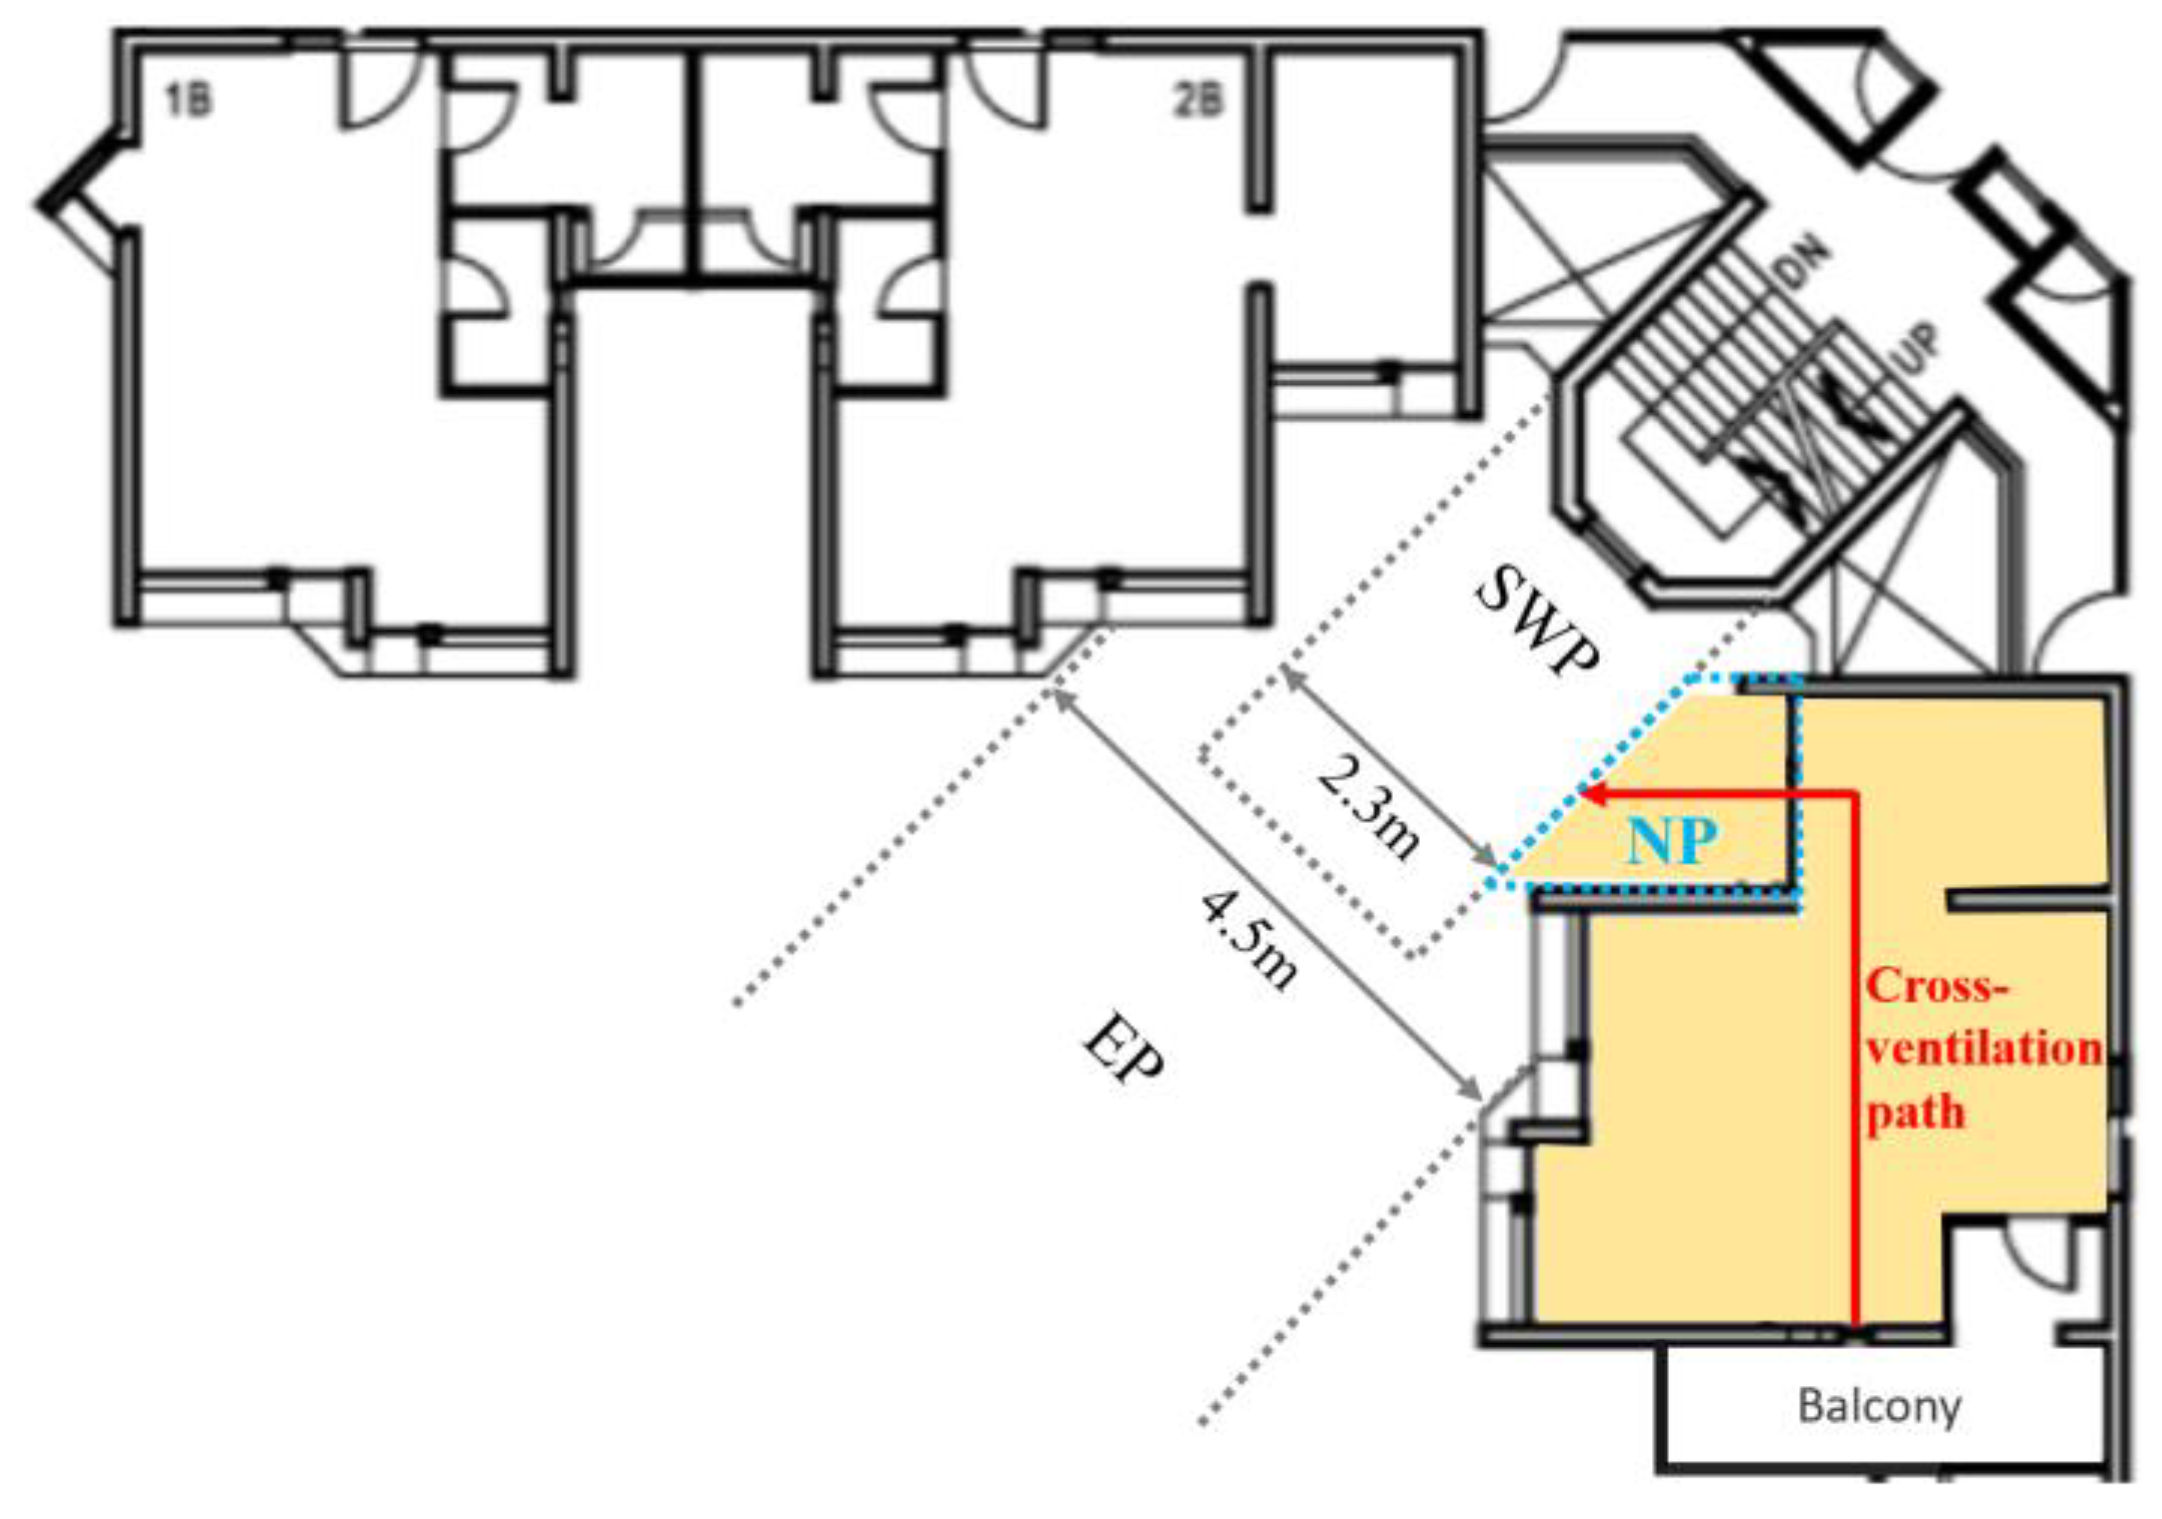
- The length of the cross-ventilation path should be less than 12 m. For buildings with concave surfaces, the External Plane (EP) (Figure A2) with a width greater than 4.5 m has similar flow characteristics to the free airstream. A Secondary Window Plane (SWP) with a width of 2.3 m occurs when the width of the EP is less than 4.5 m. A window located in the SWP is considered as the acceptable secondary window-opening. If the window is located outside the SWP, then the ventilated area should be extended by a Notional Plane (NP) (with a width equal to that of the secondary window opening), which connects the secondary window-opening and the SWP. The depth of the NP is added to the length of the cross-ventilation path;
- The primary and secondary window-opening should be located apart with a reasonable distance. To assess this, a rectangle bounding the ventilated space is divided into two equal pieces through the longer side. The two windows should be located in different pieces of the rectangle.
| Archetype | Requirements Met | Schematics | Remarks |
|---|---|---|---|
| 1 | (1), (2), (3), (4) | 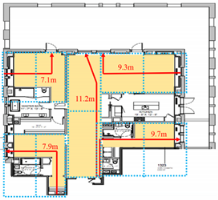 | Each room (including the living room and bedrooms) meets all the geometrical requirements, and therefore, has a good ability to cross-ventilate. |
| 2 | None |  | Each room has no significant secondary window opening and is, therefore, not likely to have adequate cross ventilation. |
| 3 | None | 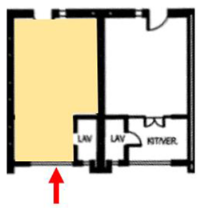 | Each flat has no significant secondary window opening and is, therefore, not likely to have adequate cross ventilation. |
| 4 | None | 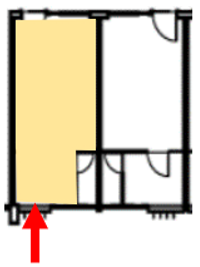 | Each flat has no significant secondary window opening and is, therefore, not likely to have adequate cross ventilation. |
| 5 | None | 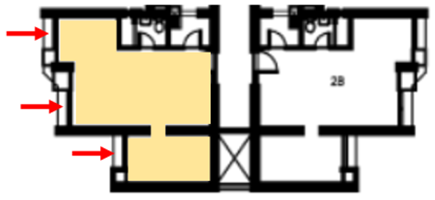 | Each flat has no significant secondary window opening and is, therefore, not likely to have adequate cross ventilation. |
| 6 | None | 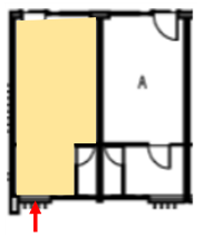 | Each flat has no significant secondary window opening and is, therefore, not likely to have adequate cross ventilation. |
| 7 | None | 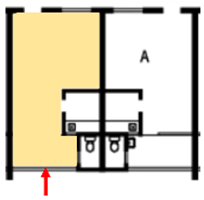 | Each flat has no significant secondary window opening and is, therefore, not likely to have adequate cross ventilation. |
| 8 | (1), (2), (3), (4) |  | The ventilated space (including the living room and bedrooms) of individual flats meets all the geometrical requirements, and therefore, has a good ability to cross-ventilate. |
| 9 | None | 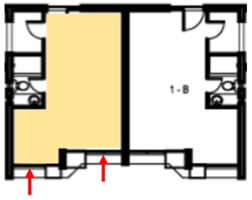 | Each flat has no significant secondary window opening and is, therefore, not likely to have adequate cross ventilation. |
| 10 | None |  | Each flat has no significant secondary window opening and is, therefore, not likely to have adequate cross ventilation. |
| 11 | (1), (2), (3), (4) | 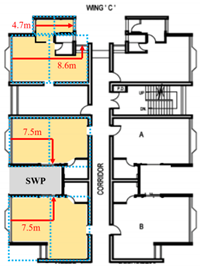 | The ventilated space (including the living room and bedrooms) of individual flats meets all the geometrical requirements, and therefore, has a good ability to cross-ventilate. |
| 12 | None | 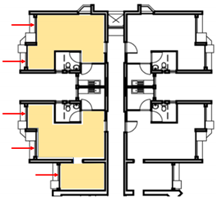 | Each flat has no significant secondary window opening and is, therefore, not likely to have adequate cross ventilation. |
| 13 | (1), (2), (3), (4) | 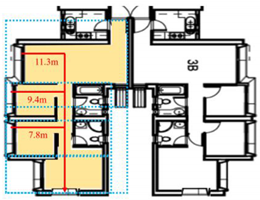 | The ventilated space (including the living room and bedrooms) of individual flats meets all the geometrical requirements, and therefore, has a good ability to cross-ventilate. |
| 14 | (1), (2), (3), (4) | 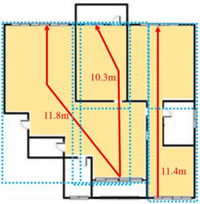 | The ventilated space (including the living room and bedrooms) of individual rooms meets all the geometrical requirements, and therefore, has a good ability to cross-ventilate. |
| 15 | (1), (2), (3), (4) | 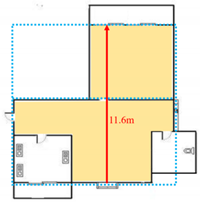 | The ventilated space (including the living room and bedroom) of individual rooms meets all the geometrical requirements, and therefore, has a good ability to cross-ventilate. |
Appendix D
| Outdoor Temperature (°C) | Outdoor Relative Humidity (%) | Wind Speed (m/s) | Global Solar Radiation (W/m2) | Ambient Outdoor PM2.5 Concentration (µg/m3) | ||||
|---|---|---|---|---|---|---|---|---|
| Ground-Floor | Middle-Floor | Top-Floor | ||||||
| Islands | ||||||||
| All year | Mean | 23.6 | 74.0 | 7.4 | 163.7 | 20.7 | 7.8 | 5.9 |
| Median | 23.9 | 76.0 | 4.2 | 3.9 | 15.0 | 4.0 | 1.7 | |
| Min | 7.6 | 19.0 | 0 | 0.1 | 0 | 0 | 0 | |
| Max | 35.1 | 99.0 | 16.8 | 1171.6 | 209.0 | 61.5 | 28.4 | |
| Kwai Tsing | ||||||||
| All year | Mean | 23.2 | 79.0 | 3.6 | 163.7 | 24.1 | 8.8 | 6.6 |
| Median | 23.5 | 82.0 | 2.1 | 3.9 | 20.7 | 5.4 | 2.2 | |
| Min | 4.5 | 15.0 | 0 | 0.1 | 0 | 0 | 0 | |
| Max | 35.6 | 99.0 | 12.7 | 1171.6 | 109.0 | 30.0 | 13.8 | |
| North | ||||||||
| All year | Mean | 23.4 | 80.0 | 5.4 | 163.7 | 20.2 | 7.2 | 5.3 |
| Median | 24.0 | 81.0 | 2.3 | 3.9 | 19.0 | 4.1 | 1.2 | |
| Min | 5.2 | 18.0 | 0 | 0.1 | 0 | 0 | 0 | |
| Max | 36.2 | 99.0 | 13.6 | 1171.6 | 139.0 | 40.9 | 18.9 | |
| Sai Kung | ||||||||
| All year | Mean | 23.2 | 81.0 | 3.7 | 163.7 | 16.8 | 6.9 | 5.2 |
| Median | 23.5 | 84.0 | 2.0 | 3.9 | 14.0 | 4.3 | 1.8 | |
| Min | 7.8 | 20.0 | 0 | 0.1 | 0 | 0 | 0 | |
| Max | 36.8 | 99.0 | 9.6 | 1171.6 | 87.0 | 26.2 | 12.1 | |
| Sha Tin | ||||||||
| All year | Mean | 23.7 | 77.0 | 4.4 | 163.7 | 24.0 | 9.0 | 6.8 |
| Median | 24.0 | 80.0 | 2.3 | 3.9 | 17.2 | 4.6 | 1.9 | |
| Min | 8.0 | 16.0 | 0 | 0.1 | 0 | 0 | 0 | |
| Max | 36.8 | 98.0 | 10.2 | 1171.6 | 126.0 | 37.1 | 17.1 | |
| Tai Po | ||||||||
| All year | Mean | 23.2 | 81.0 | 5.0 | 163.7 | 20.2 | 7.5 | 5.7 |
| Median | 23.6 | 84.0 | 2.1 | 3.9 | 19.1 | 5.1 | 2.1 | |
| Min | 7.8 | 21.0 | 0 | 0.1 | 0 | 0 | 0 | |
| Max | 36.3 | 99.0 | 8.2 | 1171.6 | 139.0 | 40.9 | 18.9 | |
| Tsuen Wan | ||||||||
| All year | Mean | 22.5 | 81.0 | 6.2 | 163.7 | 23.2 | 8.7 | 6.6 |
| Median | 22.8 | 83.0 | 2.5 | 3.9 | 19.0 | 5.1 | 2.1 | |
| Min | 6.8 | 18.0 | 0 | 0.1 | 0 | 0 | 0 | |
| Max | 35.3 | 99.0 | 11.2 | 1771.6 | 210.0 | 61.8 | 28.5 | |
| Tuen Mun | ||||||||
| All year | Mean | 23.6 | 77.0 | 4.7 | 163.7 | 26.3 | 9.8 | 7.5 |
| Median | 24.0 | 80.0 | 1.6 | 3.9 | 25.0 | 6.7 | 2.8 | |
| Min | 5.5 | 14.0 | 0 | 0.1 | 0 | 0 | 0 | |
| Max | 36.5 | 99.0 | 8.5 | 1171.6 | 153.0 | 45.0 | 20.8 | |
| Yuen Long | ||||||||
| All year | Mean | 23.7 | 80.0 | 5.3 | 163.7 | 20.5 | 7.7 | 5.8 |
| Median | 24.1 | 83.0 | 2.0 | 3.9 | 17.0 | 4.6 | 1.9 | |
| Min | 4.8 | 20.0 | 0 | 0.1 | 0 | 0 | 0 | |
| Max | 36.8 | 99.0 | 12.2 | 1171.6 | 106.0 | 31.2 | 14.4 | |
| Kowloon City | ||||||||
| All year | Mean | 23.6 | 79.0 | 4.1 | 163.7 | 24.3 | 9.1 | 6.9 |
| Median | 23.9 | 80.0 | 1.5 | 3.9 | 22.0 | 5.9 | 2.5 | |
| Min | 6.4 | 15.0 | 0 | 0.1 | 1.0 | 0 | 0 | |
| Max | 37.2 | 99.0 | 8.9 | 1171.6 | 108.0 | 31.8 | 14.7 | |
| Kwun Tong | ||||||||
| All year | Mean | 23.8 | 79.0 | 4.1 | 163.7 | 24.3 | 9.1 | 6.9 |
| Median | 24.0 | 80.0 | 1.5 | 3.9 | 22.0 | 5.9 | 2.5 | |
| Min | 5.8 | 15.0 | 0 | 0.1 | 1.0 | 0 | 0 | |
| Max | 37.0 | 99.0 | 8.9 | 1171.6 | 108.0 | 31.8 | 14.7 | |
| Sham Shui Po | ||||||||
| All year | Mean | 24.3 | 78.0 | 6.7 | 163.7 | 22.9 | 8.6 | 6.5 |
| Median | 24.5 | 80.0 | 3.2 | 3.9 | 17.9 | 4.8 | 2.0 | |
| Min | 9.8 | 21.0 | 0 | 0.1 | 0 | 0 | 0 | |
| Max | 37.3 | 99.0 | 11.8 | 1171.6 | 123.0 | 36.2 | 16.7 | |
| Wong Tai Shin | ||||||||
| All year | Mean | 23.7 | 79.0 | 4.1 | 163.7 | 24.3 | 9.1 | 6.9 |
| Median | 24.1 | 80.0 | 1.5 | 3.9 | 22.0 | 5.9 | 2.5 | |
| Min | 8.4 | 15.0 | 0 | 0.1 | 1.0 | 0 | 0 | |
| Max | 37.9 | 99.0 | 8.9 | 1171.6 | 108.0 | 31.8 | 14.7 | |
| Yau Tsim Mong | ||||||||
| All year | Mean | 23.6 | 76.0 | 6.6 | 163.7 | 27.3 | 10.3 | 7.7 |
| Median | 24.0 | 79.0 | 2.1 | 3.9 | 23.5 | 6.3 | 2.6 | |
| Min | 6.1 | 16.0 | 0 | 0.1 | 0 | 0 | 0 | |
| Max | 36.9 | 99.0 | 10.4 | 1171.6 | 146.0 | 43.0 | 19.8 | |
| Central and Western | ||||||||
| All year | Mean | 23.6 | 80.0 | 5.1 | 163.7 | 24.0 | 9.0 | 6.8 |
| Median | 23.8 | 82.0 | 2.6 | 3.9 | 20.4 | 5.5 | 2.3 | |
| Min | 6.7 | 23.0 | 0 | 0.1 | 0 | 0 | 0 | |
| Max | 35.8 | 99.0 | 11.9 | 1171.6 | 134.0 | 39.4 | 18.2 | |
| Eastern | ||||||||
| All year | Mean | 23.3 | 82.0 | 6.3 | 163.7 | 23.0 | 8.6 | 6.5 |
| Median | 23.7 | 85.0 | 2.1 | 3.9 | 18.7 | 5.0 | 2.1 | |
| Min | 6.3 | 26.0 | 0 | 0.1 | 0 | 0 | 0 | |
| Max | 36.2 | 99.0 | 12.8 | 1171.6 | 112.0 | 32.9 | 15.2 | |
| Southern | ||||||||
| All year | Mean | 23.7 | 77.0 | 5.5 | 163.7 | 20 | 7.5 | 5.7 |
| Median | 24.0 | 79.0 | 1.9 | 3.9 | 17.2 | 4.6 | 1.9 | |
| Min | 7.2 | 19.0 | 0 | 0.1 | 0 | 0 | 0 | |
| Max | 35.3 | 99.0 | 9.6 | 1171.6 | 105.0 | 30.9 | 14.3 | |
| Wan Chai | ||||||||
| All year | Mean | 24.5 | 80.0 | 5.1 | 163.7 | 25.8 | 9.7 | 7.3 |
| Median | 24.7 | 82.0 | 2.6 | 3.9 | 23.6 | 6.3 | 2.6 | |
| Min | 9.9 | 23.0 | 0 | 0.1 | 1.0 | 0 | 0 | |
| Max | 37.6 | 99.0 | 11.9 | 1171.6 | 139.0 | 40.9 | 18.9 | |
References
- EMSD. Hong Kong Energy End-Use Data 2019; Electrical and Mechanical Services Department: Hong Kong, China, 2019. [Google Scholar]
- Cooling-More Efforts Needed. Available online: https://www.iea.org/reports/cooling (accessed on 2 September 2022).
- Ji, Q.; Bi, Y.; Makvandi, M.; Deng, Q.; Zhou, X.; Li, C. Modelling Building Stock Energy Consumption at the Urban Level from an Empirical Study. Buildings 2022, 12, 385. [Google Scholar] [CrossRef]
- Burnett, J.; Bojić, M.; Yik, F. Wind-induced pressure at external surfaces of a high-rise residential building in Hong Kong. Build. Environ. 2005, 40, 765–777. [Google Scholar] [CrossRef]
- Li, J.; Ng, S.T.; Skitmore, M. Review of low-carbon refurbishment solutions for residential buildings with particular reference to multi-story buildings in Hong Kong. Renew. Sustain. Energy Rev. 2017, 73, 393–407. [Google Scholar] [CrossRef]
- Kwok, Y.T.; de Munck, C.; Lau, K.K.-L.; Ng, E. To what extent can urban ventilation features cool a compact built-up environment during a prolonged heatwave? A mesoscale numerical modelling study for Hong Kong. Sustain. Cities Soc. 2021, 77, 103541. [Google Scholar] [CrossRef]
- Jia, J.; Lee, W. Drivers of moderate increase in cooling energy use in residential buildings in Hong Kong. Energy Build. 2016, 125, 19–26. [Google Scholar] [CrossRef]
- Du, J.; Pan, W. Evaluating energy saving behavioral interventions through the lens of social practice theory: A case study in Hong Kong. Energy Build. 2021, 251, 111353. [Google Scholar] [CrossRef]
- Kwok, Y.T.; Lau, K.K.-L.; Lai, A.K.L.; Chan, P.W.; Lavafpour, Y.; Ho, J.C.K.; Ng, E.Y.Y. A comparative study on the indoor thermal comfort and energy consumption of typical public rental housing types under near-extreme summer conditions in Hong Kong. Energy Procedia 2017, 122, 973–978. [Google Scholar] [CrossRef]
- Liu, T.; Lee, W. Evaluating the influence of transom window designs on natural ventilation in high-rise residential buildings in Hong Kong. Sustain. Cities Soc. 2020, 62, 102406. [Google Scholar] [CrossRef]
- Kwok, Y.T.; Lai, A.K.L.; Lau, K.K.-L.; Chan, P.W.; Lavafpour, Y.; Ho, J.C.K.; Ng, E.Y.Y. Thermal comfort and energy performance of public rental housing under typical and near-extreme weather conditions in Hong Kong. Energy Build. 2017, 156, 390–403. [Google Scholar] [CrossRef]
- Chung, W.; Kam, M.; Ip, C. A study of residential energy use in Hong Kong by decomposition analysis, 1990–2007. Appl. Energy 2011, 88, 5180–5187. [Google Scholar] [CrossRef]
- Cheng, Y.; Cao, K.; Woo, C.; Yatchew, A. Residential willingness to pay for deep decarbonization of electricity supply: Contingent valuation evidence from Hong Kong. Energy Policy 2017, 109, 218–227. [Google Scholar] [CrossRef]
- Power, A. Does demolition or refurbishment of old and inefficient homes help to increase our environmental, social and economic viability? Energy Policy 2008, 36, 4487–4501. [Google Scholar] [CrossRef]
- Yu, C.; Du, J.; Pan, W. Improving accuracy in building energy simulation via evaluating occupant behaviors: A case study in Hong Kong. Energy Build. 2019, 202, 109373. [Google Scholar] [CrossRef]
- Dahanayake, K.C.; Chow, C.L. Comparing reduction of building cooling load through green roofs and green walls by EnergyPlus simulations. Build. Simul. 2018, 11, 421–434. [Google Scholar] [CrossRef]
- Liu, S.; Kwok, Y.T.; Lau, K.K.-L.; Chan, P.W.; Ng, E. Investigating the energy saving potential of applying shading panels on opaque façades: A case study for residential buildings in Hong Kong. Energy Build. 2019, 193, 78–91. [Google Scholar] [CrossRef]
- Brimblecombe, P.; Ning, Z. Effect of road blockages on local air pollution during the Hong Kong protests and its implications for air quality management. Sci. Total Environ. 2015, 536, 443–448. [Google Scholar] [CrossRef]
- Mason, T.G.; Schooling, C.M.; Chan, K.P.; Tian, L. An evaluation of the air quality health index program on respiratory diseases in Hong Kong: An interrupted time series analysis. Atmos. Environ. 2019, 211, 151–158. [Google Scholar] [CrossRef]
- Fan, Z.; Pun, V.C.; Chen, X.-C.; Hong, Q.; Tian, L.; Ho, S.S.-H.; Lee, S.-C.; Tse, L.A.; Ho, K.-F. Personal exposure to fine particles (PM2.5) and respiratory inflammation of common residents in Hong Kong. Environ. Res. 2018, 164, 24–31. [Google Scholar] [CrossRef] [PubMed]
- Chen, X.-C.; Chow, J.C.; Ward, T.J.; Cao, J.-J.; Lee, S.-C.; Watson, J.G.; Lau, N.-C.; Yim, S.H.L.; Ho, K.-F. Estimation of personal exposure to fine particles (PM2.5) of ambient origin for healthy adults in Hong Kong. Sci. Total Environ. 2018, 654, 514–524. [Google Scholar] [CrossRef]
- Ejohwomu, O.A.; Shamsideen Oshodi, O.; Oladokun, M.; Bukoye, O.T.; Emekwuru, N.; Sotunbo, A.; Adenuga, O. Modelling and Forecasting Temporal PM2.5 Concentration Using Ensemble Machine Learning Methods. Buildings 2022, 12, 46. [Google Scholar] [CrossRef]
- Dai, H.K.; Chen, C. Air infiltration rates in residential units of a public housing estate in Hong Kong. Build. Environ. 2022, 219, 109211. [Google Scholar] [CrossRef]
- Yang, Y.; Tang, R.; Qiu, H.; Lai, P.-C.; Wong, P.; Thach, T.-Q.; Allen, R.; Brauer, M.; Tian, L.; Barratt, B. Long term exposure to air pollution and mortality in an elderly cohort in Hong Kong. Environ. Int. 2018, 117, 99–106. [Google Scholar] [CrossRef] [PubMed]
- Tang, R.; Tian, L.; Thach, T.-Q.; Tsui, T.H.; Brauer, M.; Lee, M.; Allen, R.; Yuchi, W.; Lai, P.-C.; Wong, P.; et al. Integrating travel behavior with land use regression to estimate dynamic air pollution exposure in Hong Kong. Environ. Int. 2018, 113, 100–108. [Google Scholar] [CrossRef] [PubMed]
- Lin, H.; Ma, W.; Qiu, H.; Wang, X.; Trevathan, E.; Yao, Z.; Dong, G.-H.; Vaughn, M.G.; Qian, Z.; Tian, L. Using daily excessive concentration hours to explore the short-term mortality effects of ambient PM 2.5 in Hong Kong. Environ. Pollut. 2017, 229, 896–901. [Google Scholar] [CrossRef] [PubMed]
- Taylor, J.; Shrubsole, C.; Davies, M.; Biddulph, P.; Das, P.; Hamilton, I.; Vardoulakis, S.; Mavrogianni, A.; Jones, B.; Oikonomou, E. The modifying effect of the building envelope on population exposure to PM2.5 from outdoor sources. Indoor Air 2014, 24, 639–651. [Google Scholar] [CrossRef]
- Taylor, J.; Mavrogianni, A.; Davies, M.; Das, P.; Shrubsole, C.; Biddulph, P.; Oikonomou, E. Understanding and mitigating overheating and indoor PM2.5 risks using coupled temperature and indoor air quality models. Build. Serv. Eng. Res. Technol. 2015, 36, 275–289. [Google Scholar] [CrossRef]
- Chan, L.; Kwok, W. Vertical dispersion of suspended particulates in urban area of Hong Kong. Atmos. Environ. 2000, 34, 4403–4412. [Google Scholar] [CrossRef]
- Taylor, J.; Davies, M.; Mavrogianni, A.; Shrubsole, C.; Hamilton, I.; Das, P.; Jones, B.; Oikonomou, E.; Biddulph, P. Mapping indoor overheating and air pollution risk modification across Great Britain: A modelling study. Build. Environ. 2016, 99, 1–12. [Google Scholar] [CrossRef]
- Dai, X.; Liu, J.; Li, X.; Zhao, L. Long-term monitoring of indoor CO2 and PM2.5 in Chinese homes: Concentrations and their relationships with outdoor environments. Build. Environ. 2018, 144, 238–247. [Google Scholar] [CrossRef]
- Shrubsole, C.; Ridley, I.; Biddulph, P.; Milner, J.; Vardoulakis, S.; Ucci, M.; Wilkinson, P.; Chalabi, Z.; Davies, M. Indoor PM2.5 exposure in London’s domestic stock: Modelling current and future exposures following energy efficient refurbishment. Atmos. Environ. 2012, 62, 336–343. [Google Scholar] [CrossRef] [Green Version]
- Cheung, P.K.; Jim, C. Impacts of air conditioning on air quality in tiny homes in Hong Kong. Sci. Total Environ. 2019, 684, 434–444. [Google Scholar] [CrossRef] [PubMed]
- Cao, J.J.; Lee, S.-C.; Chow, J.C.; Cheng, Y.; Ho, K.F.; Fung, K.; Liu, S.X.; Watson, J. Indoor/outdoor relationships for PM2.5 and associated carbonaceous pollutants at residential homes in Hong Kong-case study. Indoor Air 2005, 15, 197–204. [Google Scholar] [CrossRef] [PubMed]
- Chao, C.Y.; Wong, K.K. Residential indoor PM10 and PM2.5 in Hong Kong and the elemental composition. Atmos. Environ. 2002, 36, 265–277. [Google Scholar] [CrossRef]
- Tong, X.; Wang, B.; Dai, W.-T.; Cao, J.-J.; Ho, S.S.H.; Kwok, T.C.Y.; Lui, K.-H.; Lo, C.-M.; Ho, K.F. Indoor air pollutant exposure and determinant factors controlling household air quality for elderly people in Hong Kong. Air Qual. Atmos. Health 2018, 11, 695–704. [Google Scholar] [CrossRef]
- Fazli, T.; Stephens, B. Development of a nationally representative set of combined building energy and indoor air quality models for U.S. residences. Build. Environ. 2018, 136, 198–212. [Google Scholar] [CrossRef]
- Taylor, J.; Shrubsole, C.; Symonds, P.; Mackenzie, I.; Davies, M. Application of an indoor air pollution metamodel to a spatially-distributed housing stock. Sci. Total Environ. 2019, 667, 390–399. [Google Scholar] [CrossRef]
- Crawley, D.B.; Lawrie, L.K.; Winkelmann, F.C.; Buhl, W.; Huang, Y.; Pedersen, C.O.; Strand, R.K.; Liesen, R.J.; Fisher, D.E.; Witte, M.J.; et al. EnergyPlus: Creating a new-generation building energy simulation program. Energy Build. 2001, 33, 319–331. [Google Scholar] [CrossRef]
- HA. Complete List of PRH/TPS Estates; Hong Kong Housing Authority: Hong Kong, China, 2018. [Google Scholar]
- BD. Database of Private Buildings in Hong Kong; Buildings Department: Hong Kong, China, 2018. [Google Scholar]
- Building Directory–Hong Kong. Available online: https://www.emporis.com/city/101300/hong-kong-china (accessed on 20 July 2022).
- Cheung, C.; Fuller, R.; Luther, M. Energy-efficient envelope design for high-rise apartments. Energy Build. 2005, 37, 37–48. [Google Scholar] [CrossRef]
- Fong, K.; Lee, C. Investigation of separate or integrated provision of solar cooling and heating for use in typical low-rise residential building in subtropical Hong Kong. Renew. Energy 2015, 75, 847–855. [Google Scholar] [CrossRef]
- HA. Standard Block Typical Floor Plans; Hong Kong Housing Authority: Hong Kong, China, 2018. [Google Scholar]
- CSD. Housing and Property; Census and Statistics Department: Hong Kong, China, 2018. [Google Scholar]
- Wan, K.; Yik, F. Building design and energy end-use characteristics of high-rise residential buildings in Hong Kong. Appl. Energy 2004, 78, 19–36. [Google Scholar] [CrossRef]
- CentaMap. Available online: http://hk.centamap.com/gc/home.aspx (accessed on 20 July 2022).
- BD. Guidelines on Design and Construction Requirements for Energy Efficiency of Residential Buildings; Buildings Department: Hong Kong, China, 2014. [Google Scholar]
- Lam, J.C. Residential sector air conditioning loads and electricity use in Hong Kong. Energy Convers. Manag. 2000, 41, 1757–1768. [Google Scholar] [CrossRef]
- HK-BEAM. Hong Kong Building Environmental Assessment Method: HK-BEAM Version 5/04 Existing Buildings; HK-BEAM Society: Hong Kong, China, 2004. [Google Scholar]
- Wan, K.; Yik, F. Representative building design and internal load patterns for modelling energy use in residential buildings in Hong Kong. Appl. Energy 2004, 77, 69–85. [Google Scholar] [CrossRef]
- Lam, J.C. An analysis of residential sector energy use in Hong Kong. Energy 1996, 21, 1–8. [Google Scholar] [CrossRef]
- ISO 13790; Energy Performance of Buildings, Calculation of Energy Use for Space Heating and Cooling. International Organization for Standardization: Geneva, Switzerland, 2008.
- O’Brien, W.; Kapsis, K.; Athienitis, A.K. Manually-operated window shade patterns in office buildings: A critical review. Build. Environ. 2013, 60, 319–338. [Google Scholar] [CrossRef]
- Weerasuriya, A.; Zhang, X.; Gan, V.J.; Tan, Y. A holistic framework to utilize natural ventilation to optimize energy performance of residential high-rise buildings. Build. Environ. 2019, 153, 218–232. [Google Scholar] [CrossRef]
- Mei, S.-J.; Hu, J.-T.; Liu, D.; Zhao, F.-Y.; Li, Y.; Wang, Y.; Wang, H.-Q. Wind driven natural ventilation in the idealized building block arrays with multiple urban morphologies and unique package building density. Energy Build. 2017, 155, 324–338. [Google Scholar] [CrossRef]
- Yang, L.; Li, Y. Thermal conditions and ventilation in an ideal city model of Hong Kong. Energy Build. 2010, 43, 1139–1148. [Google Scholar] [CrossRef]
- Zhou, H.; Lu, Y.; Liu, X.; Chang, R.; Wang, B. Harvesting wind energy in low-rise residential buildings: Design and optimization of building forms. J. Clean. Prod. 2017, 167, 306–316. [Google Scholar] [CrossRef]
- Zhong, H.-Y.; Zhang, D.-D.; Liu, Y.; Liu, D.; Zhao, F.-Y.; Li, Y.; Wang, H.-Q. Wind driven “pumping” fluid flow and turbulent mean oscillation across high-rise building enclosures with multiple naturally ventilated apertures. Sustain. Cities Soc. 2019, 50, 101619. [Google Scholar] [CrossRef]
- Ai, Z.; Mak, C. Wind-induced single-sided natural ventilation in buildings near a long street canyon: CFD evaluation of street configuration and envelope design. J. Wind Eng. Ind. Aerodyn. 2018, 172, 96–106. [Google Scholar] [CrossRef] [Green Version]
- Wang, R.; Ren, C.; Xu, Y.; Lau, K.K.-L.; Shi, Y. Mapping the local climate zones of urban areas by GIS-based and WUDAPT methods: A case study of Hong Kong. Urban Clim. 2018, 24, 567–576. [Google Scholar] [CrossRef]
- Tan, Y.; Liu, G.; Zhang, Y.; Shuai, C.; Shen, G.Q. Green retrofit of aged residential buildings in Hong Kong: A preliminary study. Build. Environ. 2018, 143, 89–98. [Google Scholar] [CrossRef]
- Climatological Information Services. Available online: https://www.hko.gov.hk/en/cis/climat.htm (accessed on 20 July 2022).
- Inquire and Download Air Quality Monitoring Data. Available online: https://cd.epic.epd.gov.hk/EPICDI/air/station/?lang=en (accessed on 20 July 2022).
- PD. Land Utilization in Hong Kong; PlanningNorth Point: Hong Kong, China, 2009. [Google Scholar]
- ASHRAE. ASHRAE Fundamentals Handbook 2017; American Society of Heating, Refrigeration and Air Conditioning Engineers: Atlanta, GA, USA, 2017. [Google Scholar]
- CIBSE. Environmental Design: CIBSE Guide A; The Chartered Institution of Building Services Engineers: London, UK, 2006. [Google Scholar]
- ASHRAE. ASHRAE Standard 160P: Criteria for Moisture Control Design Analysis in Buildings; American Society of Heating, Refrigeration and Air Conditioning Engineers: Atlanta, GA, USA, 2009. [Google Scholar]
- Wong, I.; Baldwin, A.N. Investigating the potential of applying vertical green walls to high-rise residential buildings for energy-saving in sub-tropical region. Build. Environ. 2016, 97, 34–39. [Google Scholar] [CrossRef]
- Zhang, L. Energy requirements for conditioning fresh air and the long-term savings with a membrane-based energy recovery ventilator in Hong Kong. Energy 2001, 26, 119–135. [Google Scholar] [CrossRef]
- Chen, X.; Yang, H.; Sun, K. A holistic passive design approach to optimize indoor environmental quality of a typical residential building in Hong Kong. Energy 2016, 113, 267–281. [Google Scholar] [CrossRef]
- Chen, X.; Yang, H. Combined thermal and daylight analysis of a typical public rental housing development to fulfil green building guidance in Hong Kong. Energy Build. 2015, 108, 420–432. [Google Scholar] [CrossRef]
- EMSD. Code of Practice for Energy Efficiency of Building Services Installation; Electrical and Mechanical Services Department: Hong Kong, China, 2018. [Google Scholar]
- HKG. Building (Planning) Regulations (Chapter 123); Hong Kong e-Legislation: Hong Kong, China, 1984. [Google Scholar]
- Haldi, F.; Robinson, D. Interactions with window openings by office occupants. Build. Environ. 2009, 44, 2378–2395. [Google Scholar] [CrossRef]
- Zhong, X.; Ridley, I.A. Verification of behavioural models of window opening: The accuracy of window-use pattern, indoor temperature and indoor PM2.5 concentration prediction. Build. Simul. 2020, 13, 527–542. [Google Scholar] [CrossRef]
- Fabi, V.; Andersen, R.V.; Corgnati, S.; Olesen, B.W. Occupants’ window opening behaviour: A literature review of factors influencing occupant behaviour and models. Build. Environ. 2012, 58, 188–198. [Google Scholar] [CrossRef]
- Dols, W.S.; Emmerich, S.J.; Polidoro, B.J. Coupling the multizone airflow and contaminant transport software CONTAM with EnergyPlus using co-simulation. Build. Simul. 2016, 9, 469–479. [Google Scholar] [CrossRef]
- Jones, B.; Das, P.; Chalabi, Z.; Davies, M.; Hamilton, I.; Lowe, R.; Milner, J.; Ridley, I.; Shrubsole, C.; Wilkinson, P. The Effect of Party Wall Permeability on Estimations of Infiltration from Air Leakage. Int. J. Vent. 2013, 12, 17–30. [Google Scholar] [CrossRef]
- Dimitroulopoulou, C.; Ashmore, M.; Hill, M.; Byrne, M.; Kinnersley, R. INDAIR: A probabilistic model of indoor air pollution in UK homes. Atmos. Environ. 2006, 40, 6362–6379. [Google Scholar] [CrossRef]
- Long, C.M.; Suh, H.H.; Catalano, P.J.; Koutrakis, P. Using Time- and Size-Resolved Particulate Data To Quantify Indoor Penetration and Deposition Behavior. Environ. Sci. Technol. 2001, 35, 2089–2099. [Google Scholar] [CrossRef] [PubMed]
- SketchUp Plugin Index. Available online: http://sketchupplugins.com/plugins/nrel-openstudio/ (accessed on 20 July 2022).
- JEPlus—An EnergyPlus Simulation Manager for Parametrics. Available online: http://www.jeplus.org/wiki/doku.php?id=start (accessed on 20 July 2022).
- SAS Trials. Available online: https://www.sas.com/en_us/trials.html (accessed on 20 July 2022).
- CSD. 2018 Population Census Summary Report; Census and Statistics Department: Hong Kong, China, 2018. [Google Scholar]
- Tan, Y.; Luo, T.; Xue, X.; Shen, G.Q.; Zhang, G.; Hou, L. An empirical study of green retrofit technologies and policies for aged residential buildings in Hong Kong. J. Build. Eng. 2021, 39, 102271. [Google Scholar] [CrossRef]
- EMSD. Hong Kong Energy End-Use Data 2018; Electrical and Mechanical Services Department: Hong Kong, China, 2018. [Google Scholar]
- Wan, M.P.; Wu, C.L.; To, G.N.S.; Chan, T.C.; Chao, C.Y.H. Ultrafine particles, and PM2.5 generated from cooking in homes. Atmos. Environ. 2011, 45, 6141–6148. [Google Scholar] [CrossRef]
- El Orch, Z.; Stephens, B.; Waring, M.S. Predictions and determinants of size-resolved particle infiltration factors in single-family homes in the U.S. Build. Environ. 2014, 74, 106–118. [Google Scholar] [CrossRef]
- Rim, D.; Wallace, L.A.; Persily, A.K. Indoor Ultrafine Particles of Outdoor Origin: Importance of Window Opening Area and Fan Operation Condition. Environ. Sci. Technol. 2013, 47, 1922–1929. [Google Scholar] [CrossRef] [PubMed]

| Archetype | Housing Type | Built Form | Age | % of the Housing Stock 1 |
|---|---|---|---|---|
| 1 | Tenement | Four storeys and each storey comprises compact flats | 1903–1940 | 2.4 |
| 2 | Tenement | Four storeys and each storey comprises two wings that are perpendicular | 1903–1940 | 3.2 |
| 3 | Low-rise flat | Six storeys and each storey comprises rectangular blocks joining end by end | 1941–1961 | 2.6 |
| 4 | Low-rise flat | An elongated rectangular block of single-facing flats | 1941–1961 | 4.8 |
| 5 | Low-rise flat | A central core with units that form wings extending outwards from the core in four directions, being low-rise | 1962–1990 | 1.9 |
| 6 | High-rise flat | Elongated rectangular blocks joining end by end | 1962–1990 | 2.1 |
| 7 | High-rise flat | Two rectangular blocks joining corner by corner | 1962−1990 | 3.7 |
| 8 | High-rise flat | Two H-shaped blocks joining end by end (with external access corridors) | 1962−1990 | 2.5 |
| 9 | High-rise flat | A central core with flats that form wings extending outwards from the core in three directions | 1962–1990 | 5.3 |
| 10 | High-rise flat | A central core with flats that form wings extending outwards from the core in two directions | 1962–1990 | 2.3 |
| 11 | High-rise flat | A Y-shaped block | 1991–2018 | 9.7 |
| 12 | High-rise flat | Similar branches asymptotic to two mutually perpendicular pairs of lines, in the shape of a cross (16 units per floor) | 1991–2018 | 11.7 |
| 13 | High-rise flat | Similar branches asymptotic to two mutually perpendicular pairs of lines, in the shape of a cross (8 units per floor) | 1991–2018 | 13.6 |
| 14 | Modern village house | Three storeys with a compact layout | 1998–2018 | 2.9 |
| 15 | Modern village house | Four storeys with a T-shaped layout | 1998–2018 | 3.2 |
| Archetype Number | Footprint 1 (m2) | Floor Area of Flat 2 (m2) | Building Height 1 (m) | Ceiling Height 1 (m) | WWR (%) | Internal Layout Sufficient for Cross Ventilation? 3 |
|---|---|---|---|---|---|---|
| 1 | 139 | 25 | 17 | 3.0 | 40 | Yes |
| 2 | 417 | 32 | 16 | 3.0 | 45 | No |
| 3 | 452 | 35 | 23 | 3.0 | 26 | No |
| 4 | 576 | 43 | 34 | 3.0 | 32 | No |
| 5 | 1062 | 49 | 27 | 2.8 | 30 | No |
| 6 | 1125 | 55 | 89 | 2.8 | 30 | No |
| 7 | 980 | 59 | 128 | 2.8 | 30 | No |
| 8 | 1020 | 58 | 97 | 2.8 | 30 | Yes |
| 9 | 983 | 61 | 82 | 2.8 | 30 | No |
| 10 | 920 | 56 | 136 | 2.8 | 30 | No |
| 11 | 1093 | 69 | 87 | 2.8 | 30 | Yes |
| 12 | 1265 | 63 | 132 | 2.8 | 30 | No |
| 13 | 767 | 71 | 139 | 2.8 | 30 | Yes |
| 14 | 158 | 158 | 11 | 3.0 | 50 | Yes |
| 15 | 136 | 136 | 18 | 3.0 | 45 | Yes |
| Archetype Number | Wall Type and U-Value (W/m2·K) | Floor Type and U-Value (W/m2·K) | Roof Type and U-Value (W/m2·K) | Window Type and U-Value (W/m2·K) | Permeability (m3 h−1 m−2 at 50 Pa) |
|---|---|---|---|---|---|
| 1 | SW1 1 (3.5) | SF1 2 (0.60) | IC 3 (0.58) | SCG 4 (5.2) | 18.9 |
| 2 | SW1 (3.5) | SF1 (0.60) | IC (0.58) | SCG (5.2) | 18.9 |
| 3 | SW1 (3.3) | SF1 (0.58) | IC (0.51) | SCG (5.0) | 11.6 |
| 4 | SW1 (3.3) | SF1 (0.58) | IC (0.51) | SCG (5.0) | 11.6 |
| 5 | SW2 5 (3.1) | SF1 (0.54) | IC (0.42) | SCG (4.6) | 10.1 |
| 6 | SW2 (3.1) | SF1 (0.54) | IC (0.42) | SCG (4.6) | 10.1 |
| 7 | SW2 (3.1) | SF1 (0.54) | IC (0.42) | SCG (4.6) | 10.1 |
| 8 | SW2 (3.1) | SF1 (0.54) | IC (0.42) | SCG (4.6) | 10.1 |
| 9 | SW2 (3.1) | SF1 (0.54) | IC (0.42) | SCG (4.6) | 10.1 |
| 10 | SW2 (3.1) | SF1 (0.54) | IC (0.42) | SCG (4.6) | 10.1 |
| 11 | SW2 (2.9) | SF1 (0.51) | IC (0.36) | SCG (4.6) | 9.2 |
| 12 | SW2 (2.9) | SF1 (0.51) | IC (0.36) | SCG (4.6) | 9.2 |
| 13 | SW2 (2.9) | SF1 (0.51) | IC (0.36) | SCG (4.6) | 9.2 |
| 14 | SW2 (2.6) | SF2 6 (0.49) | IC (0.30) | STG 7 (4.6) | 15.8 |
| 15 | SW2 (2.6) | SF2 (0.49) | IC (0.30) | STG (4.6) | 15.8 |
| Indoor Source | Period of PM2.5 Emission |
|---|---|
| Cooking in the kitchen | 7:40 a.m. to 8:00 a.m. |
| 12:00 p.m. to 12:30 p.m. 1 | |
| 7:00 p.m. to 7:30 p.m. | |
| Showering in the bathroom | 9:40 p.m. to 10:00 p.m. |
Publisher’s Note: MDPI stays neutral with regard to jurisdictional claims in published maps and institutional affiliations. |
© 2022 by the authors. Licensee MDPI, Basel, Switzerland. This article is an open access article distributed under the terms and conditions of the Creative Commons Attribution (CC BY) license (https://creativecommons.org/licenses/by/4.0/).
Share and Cite
Zhong, X.; Zhang, Z.; Wu, W.; Zhang, R. Estimating Space-Cooling Energy Consumption and Indoor PM2.5 Exposure across Hong Kong Using a City-Representative Housing Stock Model. Buildings 2022, 12, 1414. https://doi.org/10.3390/buildings12091414
Zhong X, Zhang Z, Wu W, Zhang R. Estimating Space-Cooling Energy Consumption and Indoor PM2.5 Exposure across Hong Kong Using a City-Representative Housing Stock Model. Buildings. 2022; 12(9):1414. https://doi.org/10.3390/buildings12091414
Chicago/Turabian StyleZhong, Xuyang, Zhiang Zhang, Wei Wu, and Ruijun Zhang. 2022. "Estimating Space-Cooling Energy Consumption and Indoor PM2.5 Exposure across Hong Kong Using a City-Representative Housing Stock Model" Buildings 12, no. 9: 1414. https://doi.org/10.3390/buildings12091414