Article

Resilient Capabilities to Tackle Supply Chain Risks: Managing Integration Complexities in Construction Projects

1
Department of Construction Engineering and Management, National University of Sciences and Technology (NUST), Islamabad 44000, Pakistan
2
School of Built Environment, University of New South Wales, Sydney, NSW 2052, Australia
3
School of Surveying and Built Environment, University of Southern Queensland, Springfield, QLD 4300, Australia
4
Department of Civil Engineering, COMSATS University Islamabad-Wah Campus, Wah Cantt 47040, Pakistan
*
Authors to whom correspondence should be addressed.
Buildings 2022, 12(9), 1322; https://doi.org/10.3390/buildings12091322
Submission received: 21 July 2022 / Revised: 22 August 2022 / Accepted: 26 August 2022 / Published: 29 August 2022

Abstract

:
Due to the increased globalization and the disruptions caused by pandemics, supply chains (SCs) are becoming more complex in all industries. Such increased complexities of the SCs bring in more risks. The construction industry is no exception; its SC has been disrupted in line with its industrial counterparts. Therefore, it is important to manage the complexities in integrating SC risks and resilient capabilities (RCs) to enable a resilient SC in construction. This study investigated the complexity involved in the dynamics of effects between organizations’ SC risks and RCs to overcome disruptive events. Past researchers investigated how to improve the performance of construction projects, regardless of the complexities and interdependencies associated with the risks across the entire SC. However, the system dynamics (SD) approach to describe the diversity of construction SCs under risks has received limited attention indicating a research gap pursued by this study. This work aimed to analyze and establish interconnectivity and functionality amongst the construction SC risks and RCs using systems thinking (ST) and SD modeling approach. The SD technique is used to assess the complexity and integrated effect of SC risks on construction projects to enhance their resilience. The risks and RCs were identified by critically scrutinizing the literature and were then ranked through content analysis. Questionnaire surveys and expert opinions (involving 10 experts) helped develop causal loop diagrams (CLDs) and SD models with simulations to assess complexity qualitatively and quantitatively within the system. Research reveals that construction organizations are more vulnerable to health pandemics, budget overruns, poor information coordination, insufficient management oversight, and error visibility to stakeholders. Further, the most effective RCs include assets visibility, collaborative information exchange, business intelligence gatherings, alternative suppliers, and inventory management systems. This research helps industry practitioners identify and plan for various risks and RCs within their organizations and SCs. Furthermore, it helps understand trade-offs between suitable RCs to abate essential risks and develop preparedness against disruptions to improve organizational policymaking, project efficiency, and performance.

1. Introduction

Increased globalization and high regard for innovation have made modern supply chains (SCs) more complex, uncertain, and interdependent. This has resulted in widespread interrelated risks with respect to inter and intra-organizational perspectives [1]. This interconnectedness and advancement in the global economy unfolds numerous benefits and ensures better living standards in various developed countries. However, it has intensified the SC risks to a greater extent [2].
SC disruptions have severely affected different countries in the world. The effects are more pronounced in developing countries. Although the SC problems of the developed and developing countries are similar, the poor performance of construction projects has more adverse effects on the long-term socio-economic and national development of the developing countries [3]. Various issues such as poor health and safety, environmental concerns, cost overruns, and poor work quality seriously disturb the project performance of developing countries compared to developed economies [4]. Further, the SC of the developing countries is subjected to secondary disruptions that are not common for developed countries, such as unskilled or untrained workforce, poor governance, corruption, bribery, and other such practices [5].
Nevertheless, in line with the global development initiatives, developing countries must uplift and improve their state of affairs. Accordingly, for an improved living standard, developing countries have started to strengthen their infrastructure. However, with the growing construction sector, proper knowledge about managing complexities related to the SC risks and building resilience in the construction SCs is needed. Accordingly, this research targets developing countries to investigate the understanding of construction SC risks and incorporate resilience in the relevant SCs to move towards a more globally developed construction industry and SCs.
Various risks are present in SCs worldwide, including socio-economic, political, technological, and natural disasters. These risks have made it difficult for organizations to understand and confront every aspect of this global marketplace leaving the doors open for unintended consequences and project failures [6]. Moreover, in a globalized world, where every industry is interconnected in one way or the other, risks are beyond any single organization’s control. Therefore, an error by one organization can send cascading effects out into the other sectors and become the primary cause of their disruption through a ripple effect [7]. Therefore, managing risks has become increasingly important across the SCs to reap holistic benefits and avoid collective damages.
The construction industry is dependent on a strong and uninterrupted SC. It suffers a lot because of interdependent risks and their associated consequences. Such risks provide the basis for deviation from project objectives. The associated poor project performance causes other great losses in relation to the construction project quality, time, and cost [8,9,10]. The transient nature of the project-based SC with interrelated risks makes interdependencies of the construction SCs unique compared to the other industries [11].
Similarly, the highly fragmented nature of the construction industry also reduces the organizations’ visibility to identify risks that may occur within the SC network. To handle ever-increasing complexities and interdependencies within the SC is challenging for a single entity to assess and control [1,12]. Consequently, to overcome disruptions across the SC, it is important for an entity to carefully explore the dynamics of the effects between its prevailing risks and resilient capabilities (RCs). The inability of the associated construction companies to view the SC operations collectively and their related risks makes them more vulnerable to unintended disruptions [13]. Therefore, the main challenge is to make the entire system resilient enough to survive the disruptive events and continue to progress stably.
SCs must be resilient enough to prevent or control disruptions [14]. SC resilience refers to the system’s preparedness for any uncertain environment and stability of operations to have proper command over the entire structure and function [15]. Accordingly, RCs are the characteristics of an organization that helps it foresee and alleviate disruptions [16]. Furthermore, removing risks with the help of effective capabilities makes the SCs more resilient to disruptions [1].
RC, such as flexibility of any task, is defined by its ability to consider the aftereffects of various uncertain situations it may face and be prepared to tackle such situations [17]. In construction, it is the capability to quickly adjust demands/supplies or the means of receiving inputs/delivering outputs of the project in case of any disruption [1]. For example, flexibility in construction can be enhanced by using the standardized components in various finished products during construction, as it can save cost and time and address the risk of being stocked out. Contrary to that, SC can achieve flexibility on the demand side by quickly increasing its storage capacity or distribution services without stocking surplus volumes to fulfill the unpredictable customer demands [18]. Another RC is the system’s efficiency. The system’s efficiency is the capability to fulfill the demands of customers keeping in mind the scope, time, and quality of the project but with minimum expenses and wastage. Furthermore, it is the ability to yield superior outputs with minimum resources [17]. For example, the system’s efficiency can be increased with the help of waste elimination as it helps the construction projects to be completed within the cost, and on time and with reduced harmful effects on the environment.
Past researchers aimed to improve the performance of construction projects but failed to pay attention to the complexities linked with SC risks and their interdependencies across the entire process [19,20]. For example, the intersection between risk management and resilience related to SC is indicated in the previous studies [21] but is not linked with the construction industry. Similarly, some researchers discussed resilience, considering the viewpoint of a single organization only [22,23,24,25]. Others tried to communicate the value of resilience against disruptive events by reviewing cascading effects of vulnerabilities and capabilities of SC on the entire system but with the perspective of their particular country [1]. The pre-disruption risk management processes were the main concern of the construction industry in the past [26,27], irrespective of the recovery process and post-disruption growth. However, a holistic approach across the SC process has not been adopted to date that investigates and links the RCs of construction organizations to SC risks. Thus, there is a clear lack of literature on the SCs’ response to ‘actual disruptions’ in the construction industry of developing countries. Similarly, realizing prevailing risks and using the existing capacities to mitigate them are less explored. Thus, there arises the need for alternative measures besides the traditional procedures to tackle unexpected risks while assessing SCs’ competence [28]. ISO 31 000 and EN IEC 31010 ed.2 described principles that enable organizations to manage risk. Accordingly, general principles for risk assessment include (1) planning the assessment (defining the purpose and scope of the assessment, understanding the context, engaging with stakeholders, defining objectives, considering human, organizational, and social factors, and reviewing criteria for decisions); (2) managing information and developing models (collecting information, analyzing data and developing models); (3) applying risk assessment techniques (identifying risk, determining causes of risk, investigating the effectiveness of existing controls, understanding their consequences and likelihood, analyzing dependencies, and understanding measures of risk); (4) reviewing the analysis (verifying and validating results and sensitivity analysis and monitoring and review); (5) applying results to support decisions (decisions about the significance of risk and selecting between the options); and (6) recording and reporting risk assessment process and outcomes [29]. These processes offer inputs into decisions about whether a treatment is required, priorities for treatment, and the actions proposed to treat risk. The technique to tackle risk depends on the situation’s complexity and novelty and the level of related knowledge and understanding. Here system thinking (ST) and causal loop diagrams (CLDs) can help the construction organizations of the developing countries to understand the functionality and integration between SC risks and RCs to gear up for tacking future problems.
According to Pettit et al. [16], SC resilience can be assessed in terms of vulnerabilities and capabilities. However, the researchers did not consider their integrated relationships and associated complexities. Wedawatta and Ingirige [30] presented a theoretical framework to map the resilience of medium-sized construction firms against extreme weather events. An experimental study to inspect the resilience of SC in a disruptive global event was conducted by Juttner and Maklan [31]. The authors explored the connection of resilience with the related concepts of vulnerability and risk management in SC. To survive in the uncertain global marketplace of developing countries, organizations should integrate resilience within their traditional risk management approach. Further, there is a need for a ‘risk resilience approach’ for construction SCs to deal efficiently with SC disruptions and improve the performance of SCs in delivering projects [32]. To retain growth in the construction sector of developing countries, more resilient and flexible SCs are required to function and minimize disruptions in their routine operations [1,9]. The above discussion highlights that resilience is an important aspect of SC management. However, resilience is in its nascency in the construction sector regarding research and adoption [22,24,33,34].
It is crucial to consider the dynamics of effects between the construction organization and their SCs’ risks and RCs to abate disruptive events collectively as construction projects do not operate linearly. Further, considering a simple linear relationship between risks and RCs ultimately increases project vulnerability [1]. For example, increasing collaboration among SC partners may trigger secondary risks due to communicating sensitive information [31]. Therefore, the construction organizations of developing countries need to understand the trade-offs between appropriate RCs to mitigate critical SC risks in their projects. Accordingly, due to the complexities involved in RCs and risk assessment, the ST technique may be used to review complications in which the influence of an individual component is considered from the system’s perspective [35]. ST uses CLDs to realize significant processes and their effects on project goals. Li et al. [36] used system dynamics (SD) to analyze the effects of risks and risk mitigation scenarios in chemical SC transportation. Peng et al. [37] researched the effects of post-seismic SC disruptions on inventory and transportation in SCs.
Similarly, Keilhacker and Minner [38] used the SD simulation model to test strategies to mitigate risks in different situations for rare earth elements SC. However, limited research in the construction sector uses the SD approach [39] to characterize the diversity, dynamism, and complexity of SCs under risk to make resilient construction SC. In particular, the following important research questions should be answered that have been targeted in the current study:
  • What complexities are involved in integrating critical risks related to SC management and RCs?
  • How to enable a resilient SC in the construction industry?
The dynamics of complex relationships between the organizations’ SC risks and RCs to mitigate disruptive events demand deeper and more focused analyses in the construction industry. However, to date, such analyses have not been reported. The current study humbly attempts to minimize this gap.
The novelty of this research lies in identifying the critical construction SC risks (associated with organizations, technology, and human factors) and RCs of the developing countries to tackle such issues. Further, establishing the interconnectivity between SC risks and RCs through ST and assessing the complexity and integrated effect of both variables through SD simulations are other contributions of the current study to the body of knowledge. To date, limited literature is available regarding understanding interrelationships among SC risks, RCs, complexity, and dynamics. Furthermore, resilience discipline is still in its nascency in the construction sector [22,24,33]. This gap is further exacerbated in developing countries. Accordingly, this study investigates the complexity involved in the dynamics of effects between construction organizations’ SC risks and RCs, using ST and SD modeling approaches to enhance system resilience and overcome disruptive events. This work aims to analyze and establish interconnectivity and functionality amongst the risk factors and RCs qualitatively by forming CLDs (reinforcing and balancing loops). SD modeling and simulations are run to quantitatively assess the system’s complexity. To accomplish the research aim, the following objectives have been identified:
  • To identify the risks associated with the construction SC in developing countries.
  • To identify the RCs necessary for construction SC, tailoring risks associated with SC management.
  • To establish the interconnectivity and functionality amongst the identified factors in SC management through ST.
  • To assess the complexity and evaluate the integrated effect of SC risks and RCs for a resilient SC through the SD approach.
Overall, this study utilizes an integrated approach to evaluate SC’s reaction to disruptions alongside three disruption phases (pre, during, and post-disruption), considering proactive and reactive risk management strategies. The aim is to improve the construction SC performance and withstand disruptive events. Pre-disruption is a proactive response devising ways and necessary actions to mitigate known risks [40]. During the disruption, an effective reactive response is important to reduce the spread of its impact. The efficiency of the risk management process used during the disruption is evaluated in this phase [41]. Post-disruption is the healing and learning phase. It focuses on how to resume the system as usual and deal with the aftereffects of the disruptions [42]. Thus, in an integrated approach, a proactive risk management plan made in the pre-disruption phase is implemented during disruption. Finally, the post-disruption phase involves all the necessary actions to improve the construction SC performance and resilience. Therefore, the current study aims at adding a holistic view to the existing construction literature. Accordingly, it will help the construction industry practitioners to understand major SC risks. The process includes inter-connectivity risks and how they transfer cascading impacts throughout the SC. It also includes the ability to get rid of them gradually by understanding trade-offs between suitable RCs to abate essential risks and develop organizational preparedness against disruptions to improve their decision-making, project efficiency, performance, and system resilience.
The remaining paper is organized as follows. Section 2 presents the relevant literature. Section 3 includes the methodology adopted to collect and analyze the data in the current study. Section 4 explains the detailed results of the study, comprising the CLDs and SD model and related simulations and their implications. Section 5 presents the discussion on the results and the research implications. Finally, Section 6 concludes the research, presents its limitations, and suggests future recommendations.

2. Literature Review

Pettit et al. [16] identified two important components with the help of which SC resilience can be achieved: risks and RCs. The literature related to the construction SC risks, RCs, complexity, and SD has been discussed in the following section:

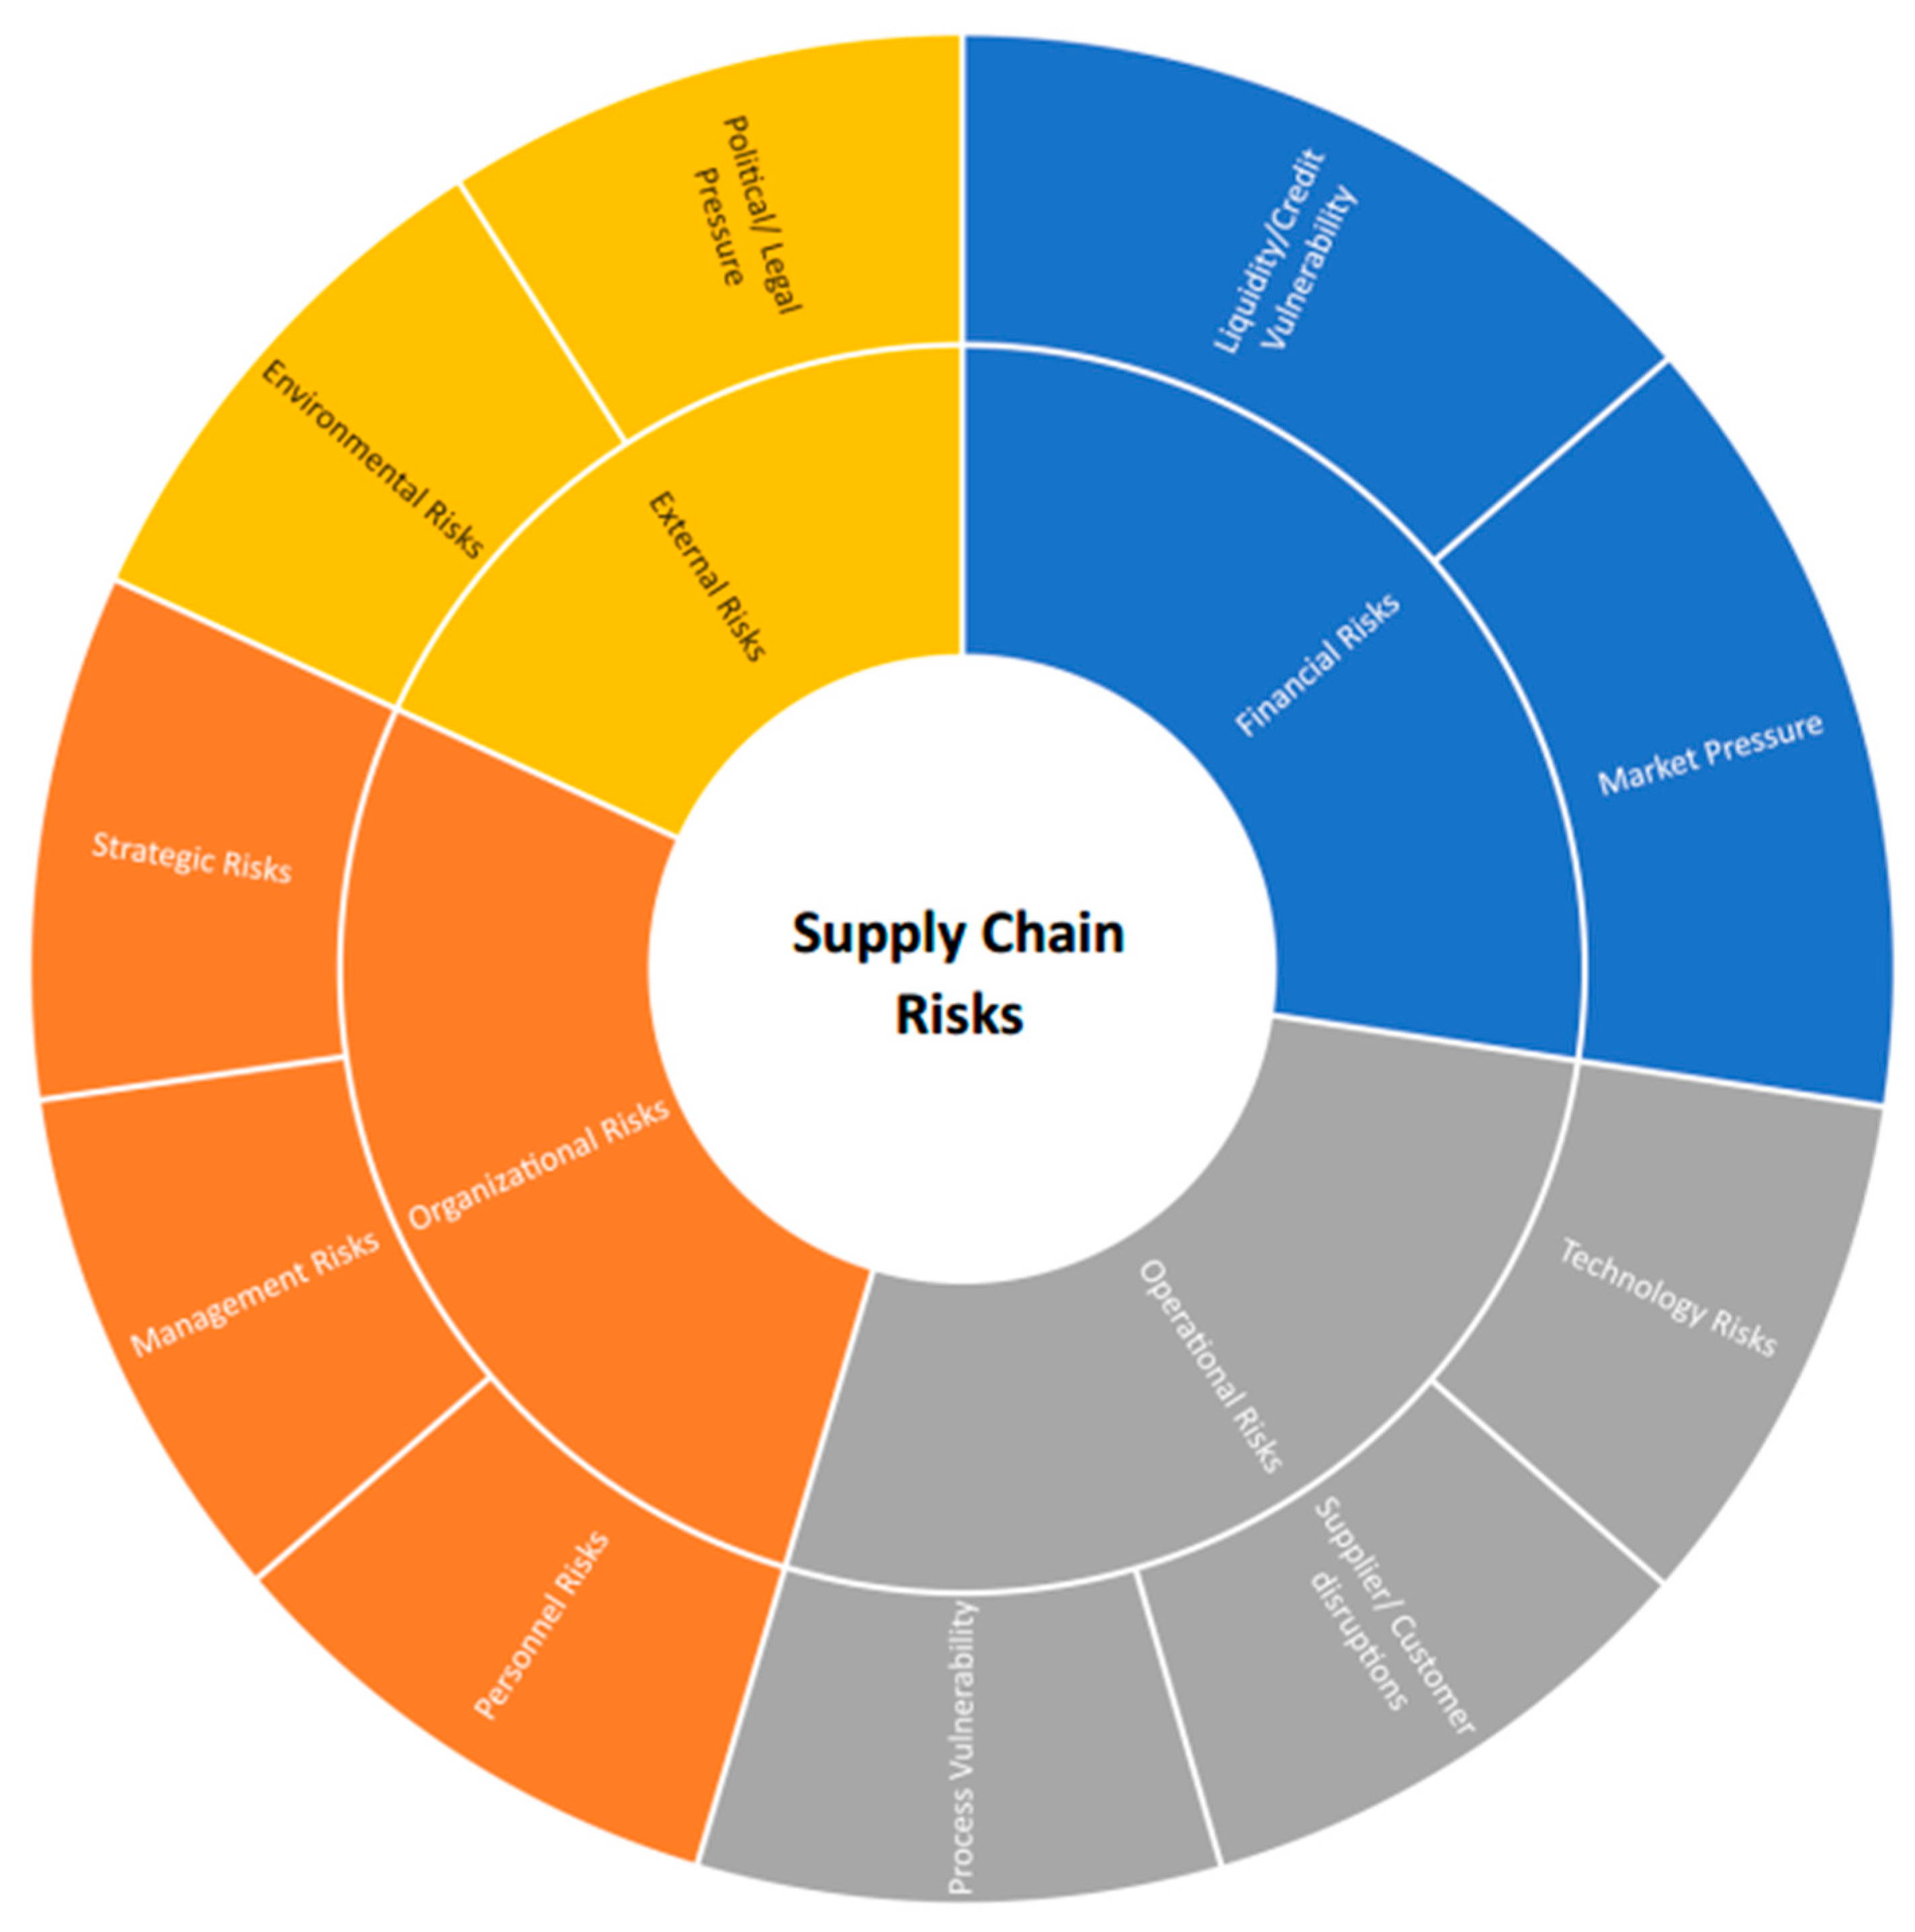
2.1. Construction Supply Chain Risks

Disruptions confronted by SCs have sparked the interest of different researchers. SC disruption is a spontaneous and unforeseen incident by which the usual stream of materials and goods is interrupted [43,44,45]. The presence of such disturbances having an adverse effect on SCs obviously puts them at risk [46]. Typical risk management practices seem ineffective because they rely on risk identification and statistical information [47]. Therefore, there is an urge to develop effective and efficient SC capabilities that can help to resist and withstand disruptions. Accordingly, an integrated and proactive approach is needed to evaluate SC’s reaction to disruptions alongside the typical pre- and post-disruption phases.
A precise and comprehensive definition of SC risks was given by Pettit et al. [16] as “fundamental factors that make an enterprise susceptible to disruptions”. Thus, decreasing the likelihood and severity of such risk factors can help the construction organization make SC more resilient and stable [40]. Different researchers in the past have addressed various SC risks. Wagner and Neshat [48] divided the SC risks into three groups: supply, demand, and SC structure. The supply risks are connected to the supply base and the supplier (portfolio, financial status, entire network among different suppliers) [43]. Demand risks are downstream operations in SC that involve the customer (financial status), the product (lifecycle, features), and the distribution and transportation systems adapted to serve the end customers. Finally, the SC structure risks arise due to the disintegrated SCs. For example, the ‘supplier or customer disruptions’ is a key concern in construction as inept contractors, sub-contractors, and suppliers can decelerate the project progress, making the SC more vulnerable to disruptions in project delivery [16]. Similarly, the supply–production–distribution chain is highly interrelated in delivering construction projects which can instigate vulnerability in the SC as materials are linked with labor, information, technology, and finance to complete the project [49]. Therefore, to mitigate disruptive events in construction projects, it is important to cope with vulnerability within the SCs.
SC risks have been grouped into seven main categories by Pettit et al. [16]: turbulence (i.e., natural disasters, price fluctuations, political instability); threats (i.e., theft, terrorism); connectivity (i.e., inter-relationships with external entities); external pressures (i.e., innovation and price pressures from competitors); resource limits (i.e., production and distribution capacity and suppliers availability); sensitivity (i.e., product and process reliability); and supplier or customer disruptions. These are further divided into 39 sub-factors. Despite the different category terminology used, there is an overlap of risk factors between Pettit et al. [16], and Wagner and Neshat [48].
Other researchers classified SC risks as financial risks (i.e., price fluctuations, price pressures). Construction organizations of developing countries suffering from these financial risks face cost overruns, affecting the project scope and performance and resulting in a loss in business opportunities. Other risks include operational risks (i.e., supplier disruptions, products availability); strategic risks (i.e., vast supply network, unproductive planning); hazards risks (i.e., natural disasters) [50,51]; demand and supply risks (i.e., customer disruptions, demand unpredictability) [52]; organizational risks (i.e., risks resulting due to the organization itself and are under its direct control); and external risks (ahead of the company and its SC’s control) [22,53,54]. Overall, poor information handling, inability to manage different stakeholders, and failure to control cost, time, and quality constraints by the construction organization affect the project performance and brings SC risks. Badea et al. [55,56] identified 16 potential SC risks that can cause cost, time, and quality problems in construction projects. The most critical are competitive cost, delivery, procurement, material quality, and delay risk. Chan et al. [56] identified 11 key SC risks in the Ghana construction industry, including price fluctuation, instability of interest rates, shortages of material, and unexpected changes in demand, as the most crucial ones.
The vulnerability may derive from sub-factors within the organization, external to the organization but within the SC network, or from factors external to the SC network. Figure 1 presents an overview of risk factors in construction SCs based on the above categorization. These risk factors were incorporated in the survey described in the methodology part to determine the area in which the SC members are most vulnerable in an attempt to build SC resilience.

2.2. Supply Chain Resilient Capabilities of Construction Organizations

According to Peck [57], the ability of an organization to change and restore itself according to any disruptive event is termed its resilience. It is an important skill that supplements typical risk management practices as it deals with several risks and includes various risk management mechanisms [15,47]. Resilience is a vast topic comprising disruptions, risks, and capabilities to mitigate the risks. Removing risks with the help of effective capabilities makes the SCs more resilient to disruptions. Such capabilities can either prevent or mitigate an actual disruption and its effects or make the entire SC acclimate to that disruption [1]. Most SC resilience literature seems to cover multi-sectoral issues. Researchers such as McManus [22] and Pettit et al. [24] have focused on the performance and capability of organizations to survive, adapt, and grow in the face of disruptions.
While the research on SC resilience is growing, more research in the construction industry context is required. Currently, the research related to construction SC resilience is limited. Among the few relevant studies, Abas et al. [13] targeted the critical risk factors affecting the construction SC and assessed the different success factors to realize their direct impact on the successful execution of construction projects. Similarly, Pettit, et al. [16] created a process flow to support different organizations in their resilience journey through the recommended SC Resilience Assessment and Management (SCRAM) tool. The authors investigated 14 RCs, including flexibility in sourcing and order fulfillment, capacity, efficiency, adaptability, visibility, anticipation, recovery, dispersion, collaboration, market position, organization, security, and financial strength. This helped the case study organizations to analyze their current SC resilience state and devise a proactive strategy rather than waiting for the next disruption.
Christopher and Peck [54] investigated four basic RCs: risk management in organizations, agility, re-engineering, and collaboration. Other secondary factors explained by the author were SC availability, efficiency, flexibility, redundancy, velocity, and visibility. Sheffi and Rice Jr [40] explored different risks faced by the SCs to pinpoint the main RCs needed to mitigate the identified risks. RCs such as flexibility, collaboration, redundancy, security, and customer relationship management are the center of attention for the researcher. Meng [58] stated that risk allocation is a crucial RC for construction SC. A proper risk management team can educate all the stakeholders about the possible risks in the project. According to Ryciuk [59], developing trust with a supplier is a key to establishing a successful construction SC. Similarly, Luo et al. [60] stated that effective communication is the most important RC for successful SC in construction projects.
The discussion above shows several common RCs identified by existing studies. Among them, flexibility and system efficiency are the important ones. The current study also assessed other main RCs (such as adaptability, capacity, and visibility) identified by previous researchers. The considered RCs are interrelated [30,31]. Therefore, it is important to understand the trade-offs between appropriate RCs to mitigate critical risks related to construction SCs. This is an under-researched area that previous researchers have not properly investigated [1,22,23,24,61]. Accordingly, it has been targeted in the current study.

2.3. Construction Complexity and System Dynamics

The construction industry is highly dependent on an interrupted SC and suffers a lot because of interdependent risks arising from the complexities of the SC process. Such risks provide the basis for deviation from project objectives resulting in poor overall project performance that has a snowball effect on quality, time, and cost [8,9]. Overall, construction processes are unpredictable, non-linear, and dynamic, making them susceptible to various disruptions [62]. The transient nature of the project-based SC with interrelated risks makes interdependencies of the construction SCs unique compared to the other industries [11]. Similarly, the highly fragmented construction industry reduces the organizations’ visibility to identify risks that may take place within the SC network [1].
The SD approach uses a non-linear feedback system to sort out the complicated relationships between various constructs. As a result, it presents the complex data in a more organized and simple way [63]. Built on the ST and feedback control theory, the SD approach assesses the dynamic behavior of the system using qualitative (CLDs) and quantitative (SD modeling and simulations) practices [64]. Computer simulation technology is used to dynamically examine the system’s changing trends, which helps make decisions and action plans and verify the validity of working strategy and decisions taken. SD is one such technology based on system modeling [65]. Thus, it helps reduce complexity to boost the system’s productivity [66]. In addition, the SD approach helps smooth the decision-making process and assess the problem with different viewpoints and timelines to devise a proper strategy.
Different researchers have leveraged the SD approach for addressing various complex phenomena. Lee et al. [67] discussed the complexity and uncertainty of construction projects resulting in re-work due to errors and changes. Peng et al. [37] studied the effects of post-seismic disruptions on inventory and transportation rates in SCs. Risks effects, as well as their mitigation scenarios in chemical SC transportation, were studied by Li et al. [36]. Keilhacker and Minner [38] used the SD simulation model to test various ways to abate risks in rare earth elements SC.
Khan et al. [66] and Naveed and Khan [68] used the ST and SD approach to manage the information complexity in construction projects. Ghufran et al. [69] used the SD approach to determine the challenges in adopting sustainable SC management in the construction industry. Amin et al. [70] identified the barriers to information management and factors affecting the adoption of collaborative technologies in construction using the SD approach. However, when it comes to construction SC risks and RCs integration and quantification using the SD approach, the research is limited, if not nonexistent. Thus, the SD approach was selected to assess the complex and interdependent relations between SC risks and RCs in the current study. It aims to bridge the literature gap in addressing the criticality of the construction SC management risks from resilience perspectives using the SD approach.

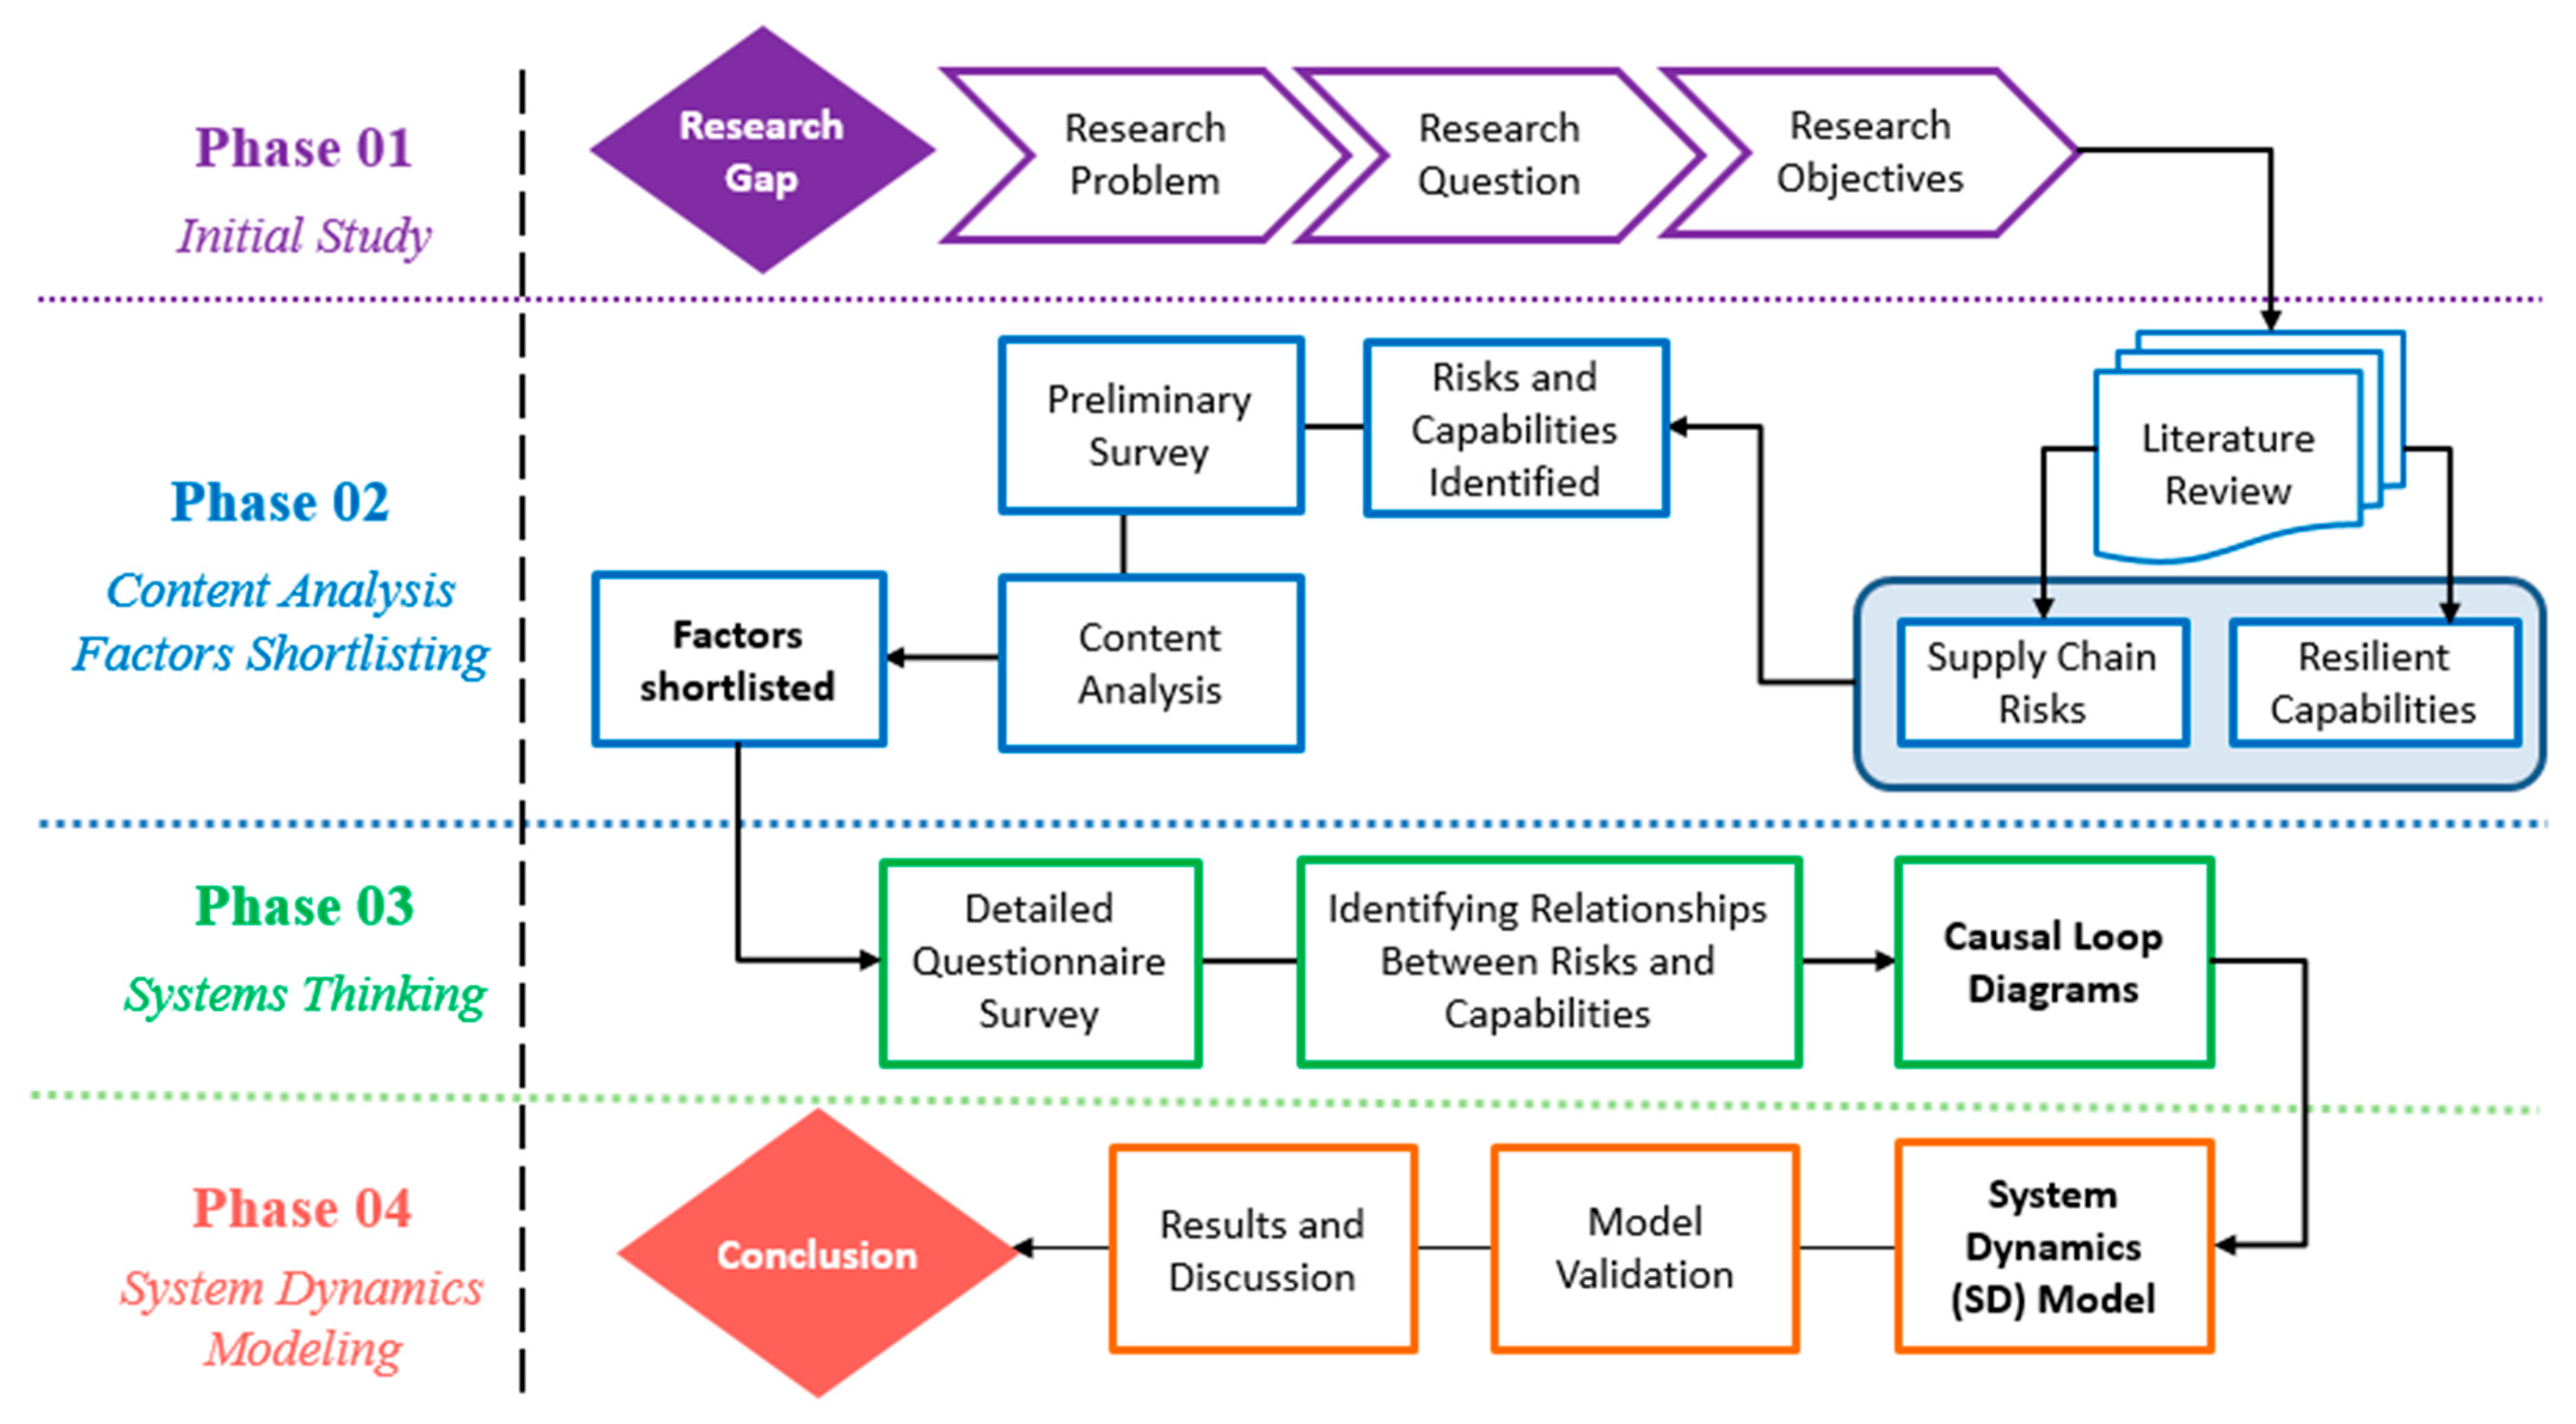
3. Research Methodology

In this research, a mixed method approach was adopted. To analyze and establish interconnectivity and functionality amongst the risk factors and RCs, a qualitative approach (ST and CLDs) was used. Afterward, SD modeling and simulations were run quantitatively to assess the system’s complexity. The research process of this study comprises four main phases (Figure 2), as explained below.

3.1. Initial Study

In the first phase, the research gap was highlighted after the detailed analysis of relevant research articles. Scrutiny of literature helped identify the SC risks and RCs that highlighted the need to incorporate the ‘risk-resilience approach’ to deal with complexities and uncertainties faced by SCs in the construction industry. Identifying the research gap helped refine research problems, with the help of which research objectives were planned and finalized.

3.2. Literature Review and Content Analysis

A two-fold method was used in the second phase to perform a detailed literature review. Research platforms including Scopus, Google Scholar, Web of Science Elsevier-Science Direct, Springer, Taylor and Francis, Emerald Insight, American Society of Civil Engineers, and MDPI were accessed for retrieving relevant literature published on the current study topic. Firstly, the risks associated with the construction SC management were identified by critically scrutinizing the literature. A total of 36 risk sub-factors were retrieved from the reviewed articles. Secondly, the capabilities required to mitigate risks and to make SCs more resilient to disruptions were also identified in the literature. As a result, 44 RCs were identified.
Once the risks in SCs and RCs were identified, the content analysis following Hsieh and Shannon [71] was performed to shortlist and rank the identified risks and RCs, based on their relevance. The content analysis consisted of a literature review and a preliminary survey from field experts. Then, scores were assigned to the key factors by the experts. At first, the literature score was calculated on a three-point Likert scale (1 for low, 3 for medium, and 5 for high) by multiplying the frequency of each factor by its impact after carefully assessing each author’s work [72].
A preliminary survey followed the initial survey to take feedback from the field experts of developing countries worldwide. Professionals appointed at various levels in construction projects, including project managers (12), construction managers (11), project directors (7), project/site engineers (10), design team leaders (6), and contract engineers (5) were involved in the survey. The key questions inquired about each respondent’s level of understanding of the topic, knowledge about critical SC risks, and the importance of RCs for managing resilience within their respective organizations.
As a result, 45% of the professionals responded with moderate understanding and 55% had an advanced understanding of the topic. Most of the professionals were associated with contractors (13), clients (11), consultants (10), and suppliers (5). Most (29) had professional experience ranging from 5–10 years. Further, the distribution was 11–15 years (6), 16–20 years (7), and over 20 years (8). As the focus of study of this research was on developing countries, all the responses were received from countries that include Pakistan (30), India (01), UAE (04), Afghanistan (01), Uzbekistan (7), Iran (1), Saudi Arabia (3), Morocco (2), Bahrain (3), Qatar (2), Turkey (7), and Oman (2). Sampling and data collection were based on convenience and approachability to the respondents; thus, the list does not cover all developing countries and is not exhaustive. Overall, 50 completed responses were received. Accordingly, the field score of each factor was calculated and normalized using their respective mode values following Jahan et al. [73].
The basic additive weighting approach was used to analyze the literature and field score differently by assessing and recommending suitable decision weights built on evidential reasoning [74]. First, ratios to experts and literature scores (such as 80/20, 70/30, 60/40) were calculated [73] and then analyzed using factor analysis in SPSS. Results indicated that there was not much variation in the data ranking as the correlation value fell within the range of 0.81–0.99 [75], as shown in Table 1.
As a result, 15 out of 36 risks (Table 2) and 16 RCs (Table 3) out of 44 were chosen based on the simple majority principle of having a cumulative impact up to 50%, employing a 60/40 weighting distribution following Jahan et al. [73].

3.3. Data Analysis

Detailed data collection and examination were performed in the third phase. An impact matrix questionnaire was developed through Google™ Docs [61]. The matrix consisted of the shortlisted risks and RCs to seek primary data. It was divided into two sections. The first section requested personal information of respondents, and the second section asked the respondents to rate the impact of the relation of each construction SC risk on all RCs required to mitigate the risks on a three-point Likert scale (1 = low, 2 = medium, 3 = high). The respondents were also asked to identify the polarity of the relations.
The questionnaire was distributed among experienced and skilled professionals of developing countries through online social and professional community platforms such as Research Gate®, Facebook®, LinkedIn®, and organizational emails. A total of 60 responses from 14 developing countries were collected. As generally acknowledged, a minimum sample size of 30 or above is required to satisfy the central limit theorem [56]. The reliability of these responses was checked using IBM SPSS Statistics [76].
After evaluating the collected data, the most important relations were ranked using the Relative Importance Index (RII) method. RII is a statistical method used to rank different factors [77,78]. Equation (1) was used to calculate the RII as follows:
Relative   Importance   Index   ( RII ) = W A N
where W = weight assigned on the Likert scale (varying from 1 to 3),
  • A = maximum weight assigned on the scale (i.e., 3 in this research),
  • N = total number of respondents (i.e., 60 in this research).
The value of RII is directly related to the importance of that specific relation or factor. RII has a minimum and maximum value of 0 and 1, respectively. The relation is important if the RII value of that factor is closer to 1 and vice versa. The collected survey data revealed 29 relations (Table 4) between SC risks and RCs as the most important ones having RII ≥ 0.75 [79]. All the RII values are provided as a supplementary file (Table S1) to this manuscript.

3.4. Demographic Details of the Survey Respondents

Construction field professionals were invited to participate in the final survey of this study. These respondents were appointed at various ranks in in their organizations, having different responsibilities in carrying out complex construction projects. The survey received a total of 60 responses from experts located in developing countries, including include Pakistan (41%), Bangladesh (16%), UAE (11%), India (6%), Malaysia (5%), Iran (4%), Jordan (3%), Saudi Arabia (2%), Morocco (2%), Brazil (2%), Kuwait (2%), Qatar (2%), Turkey (2%), and Oman (2%). In terms of the qualification of the respondents, the maximum response was from professionals having Master’s qualifications, i.e., 27 (45%). Nineteen responses (31%) were provided by professionals having bachelor’s degrees, thirteen responses (22%) by professionals having a doctorate degree, and only one response (2%) by diploma holders. Further, the respondents had varying years of professional experience. A total of 15 respondents (25%) had experience of 2 to 5 years, 17 respondents (28%) had experience of 6 to 10 years, 10 respondents (17%) had an experience of 11 to 15 years, 7 respondents (12%) had experience of 16 to 20 years, and 11 respondents (18%) had experience of 21 years and above. The higher qualifications and experience of the professionals in this survey emphasize the responses’ credibility.

3.5. System Dynamics Model Development and Validation

The conclusive phase of this research was the development of an SD model. The final shortlisted 29 relations were used for establishing CLD and representing the specific loops in the SD model. The CLD developing process was based on trial and error, repetitive and frequentative practice where all variables were positioned and linked to each other using professional insight. A positive (+) or negative (−) polarity is carried by each arrowhead, indicating a direct or indirect relation of that variable with its immediate variable in the loop, respectively. The closed chains of cause and effect known as feedback loops were identified as reinforcing (R) or balancing (B) loops.
The development of CLD paved the way for creating an SD model. Using the VENSIM® software (Ventana Systems Inc., Harvard, MA, USA), the CLD was first transformed into a stock and flow diagram (SFD). Finally, simulations were run to check the behavior over time graphs (BOTGs) for all the respective stocks. The SD model was also validated using various validation tests [80], including boundary adequacy, parameter verification, structure verification, and extreme condition tests. Furthermore, the SD model results were also presented to the construction industry professionals in the SC management domains for expert opinion and validation.

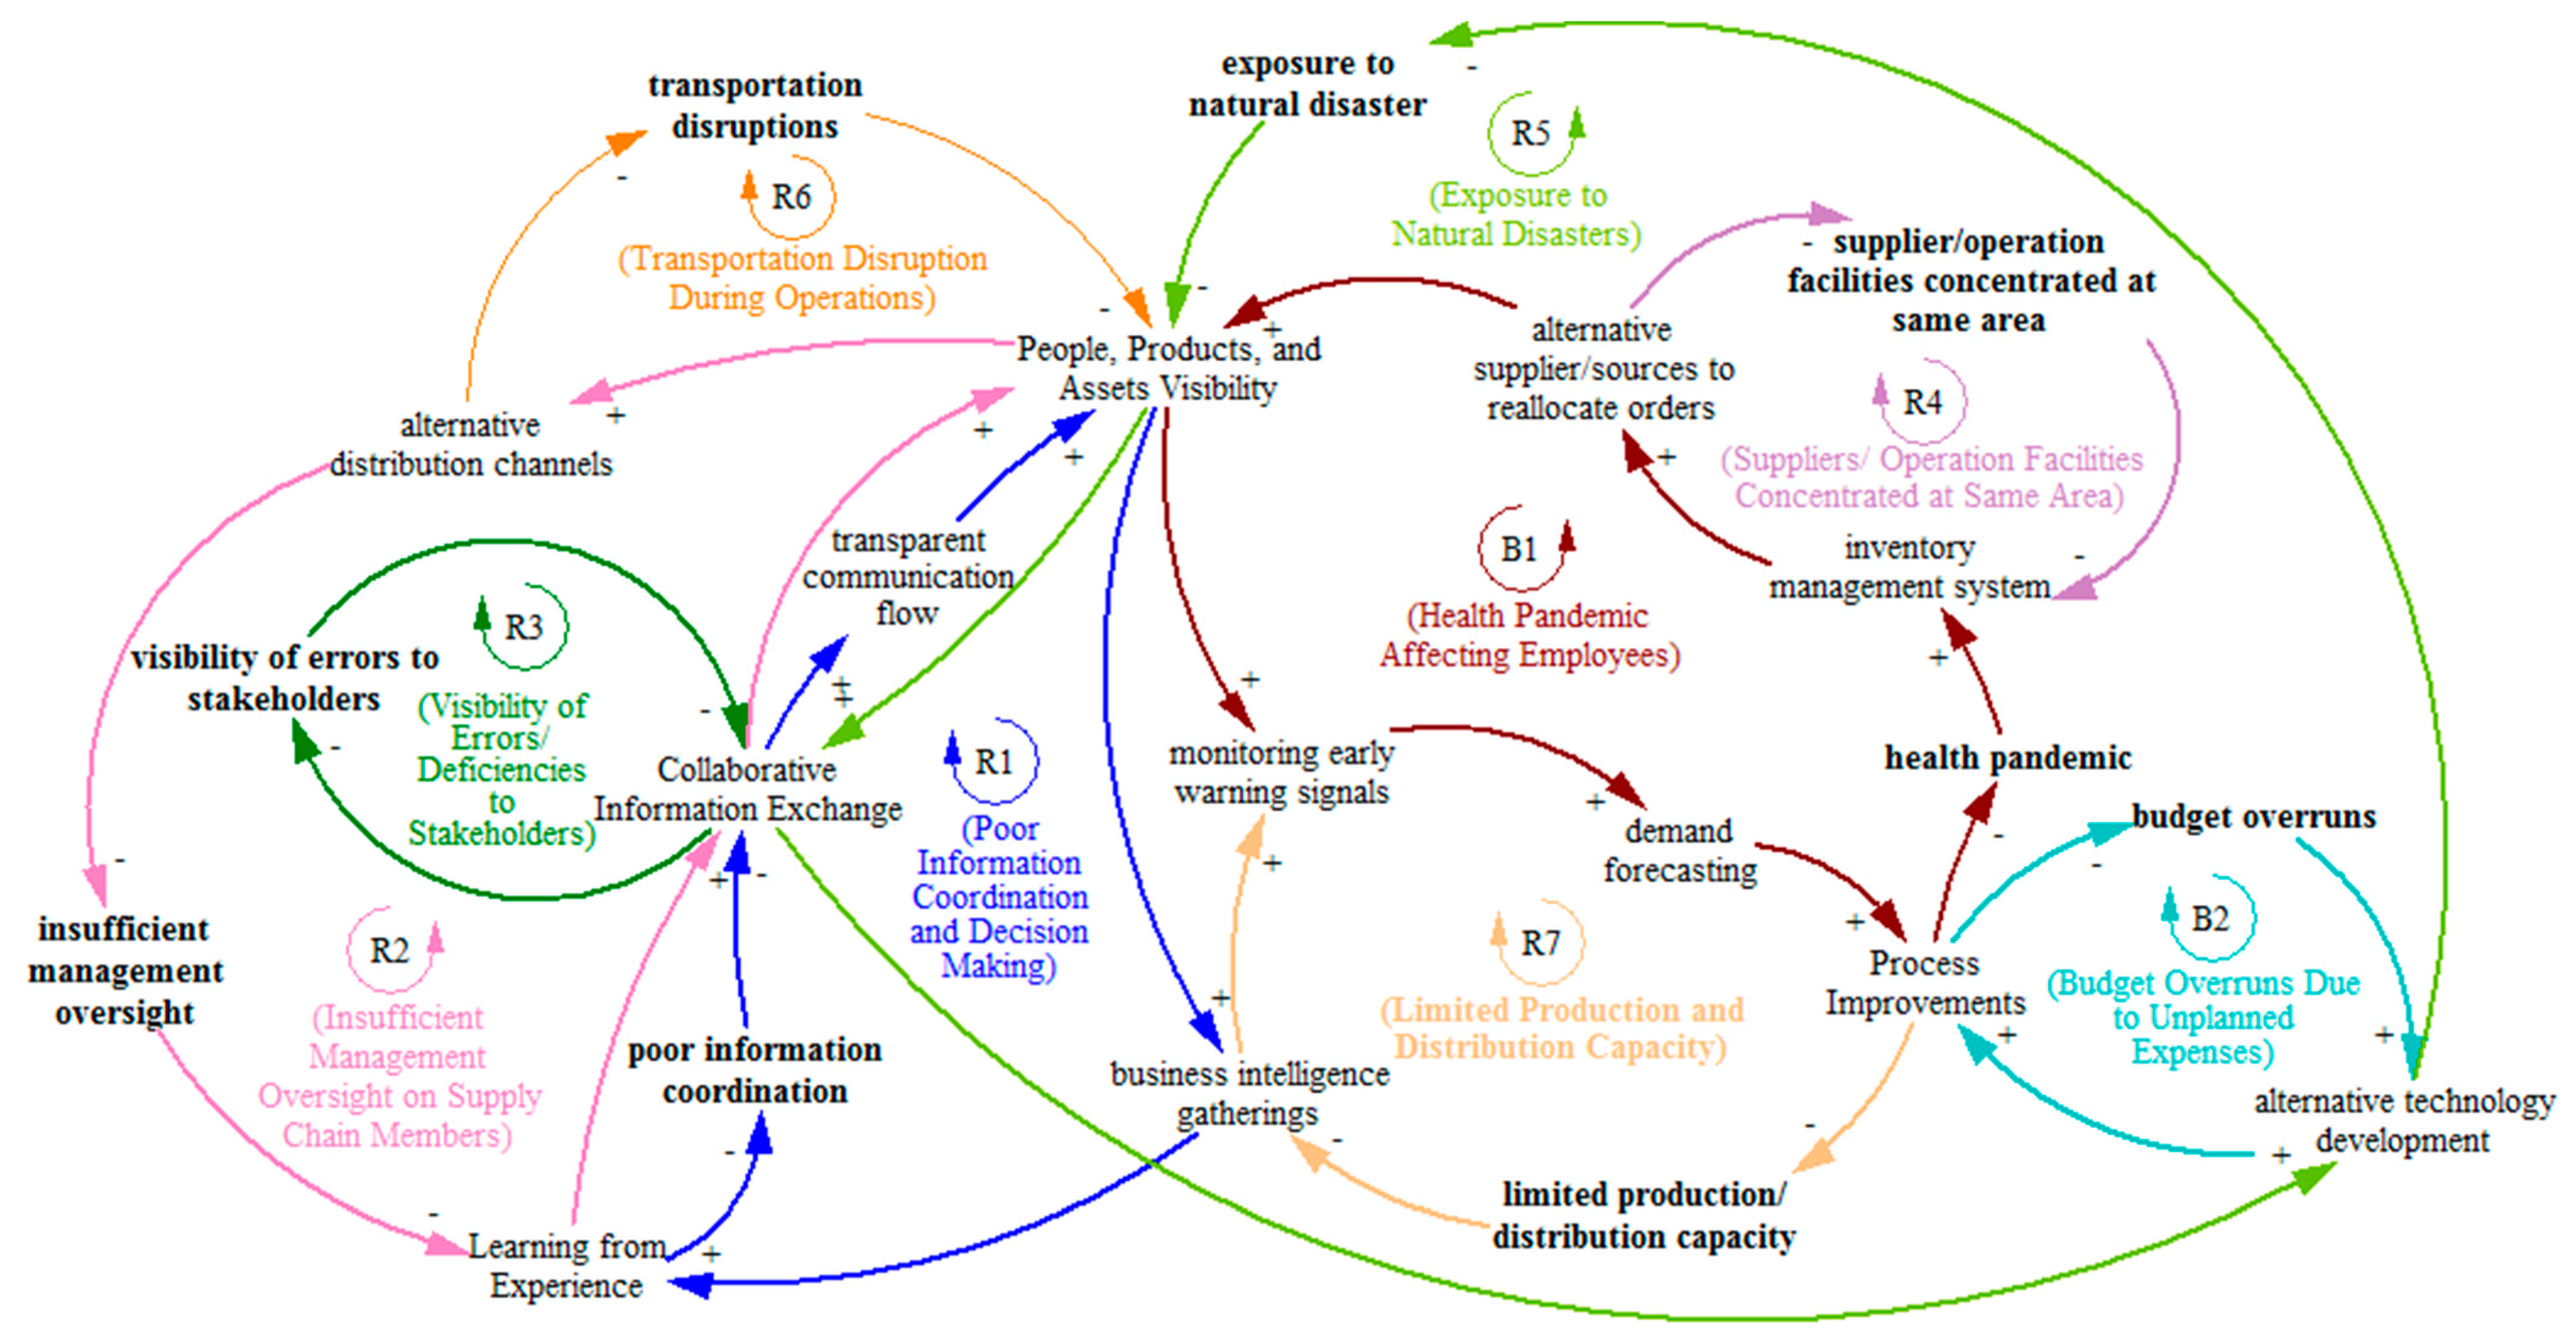
4. Results and Analyses

The CLD, as shown in Figure 3, is constructed based on the results collected through the surveys conducted in this research. The CLD demonstrates nine significant loops representing the interdependencies among RCs and SC risks affecting the system. It consists of two balancing (negative) loops labeled as ‘B’ and seven reinforcing (positive) loops labeled as ‘R’. Different colors in the CLD represent different loops to distinguish between them and help the readers apprehend it better. The loops are explained in the following sections.

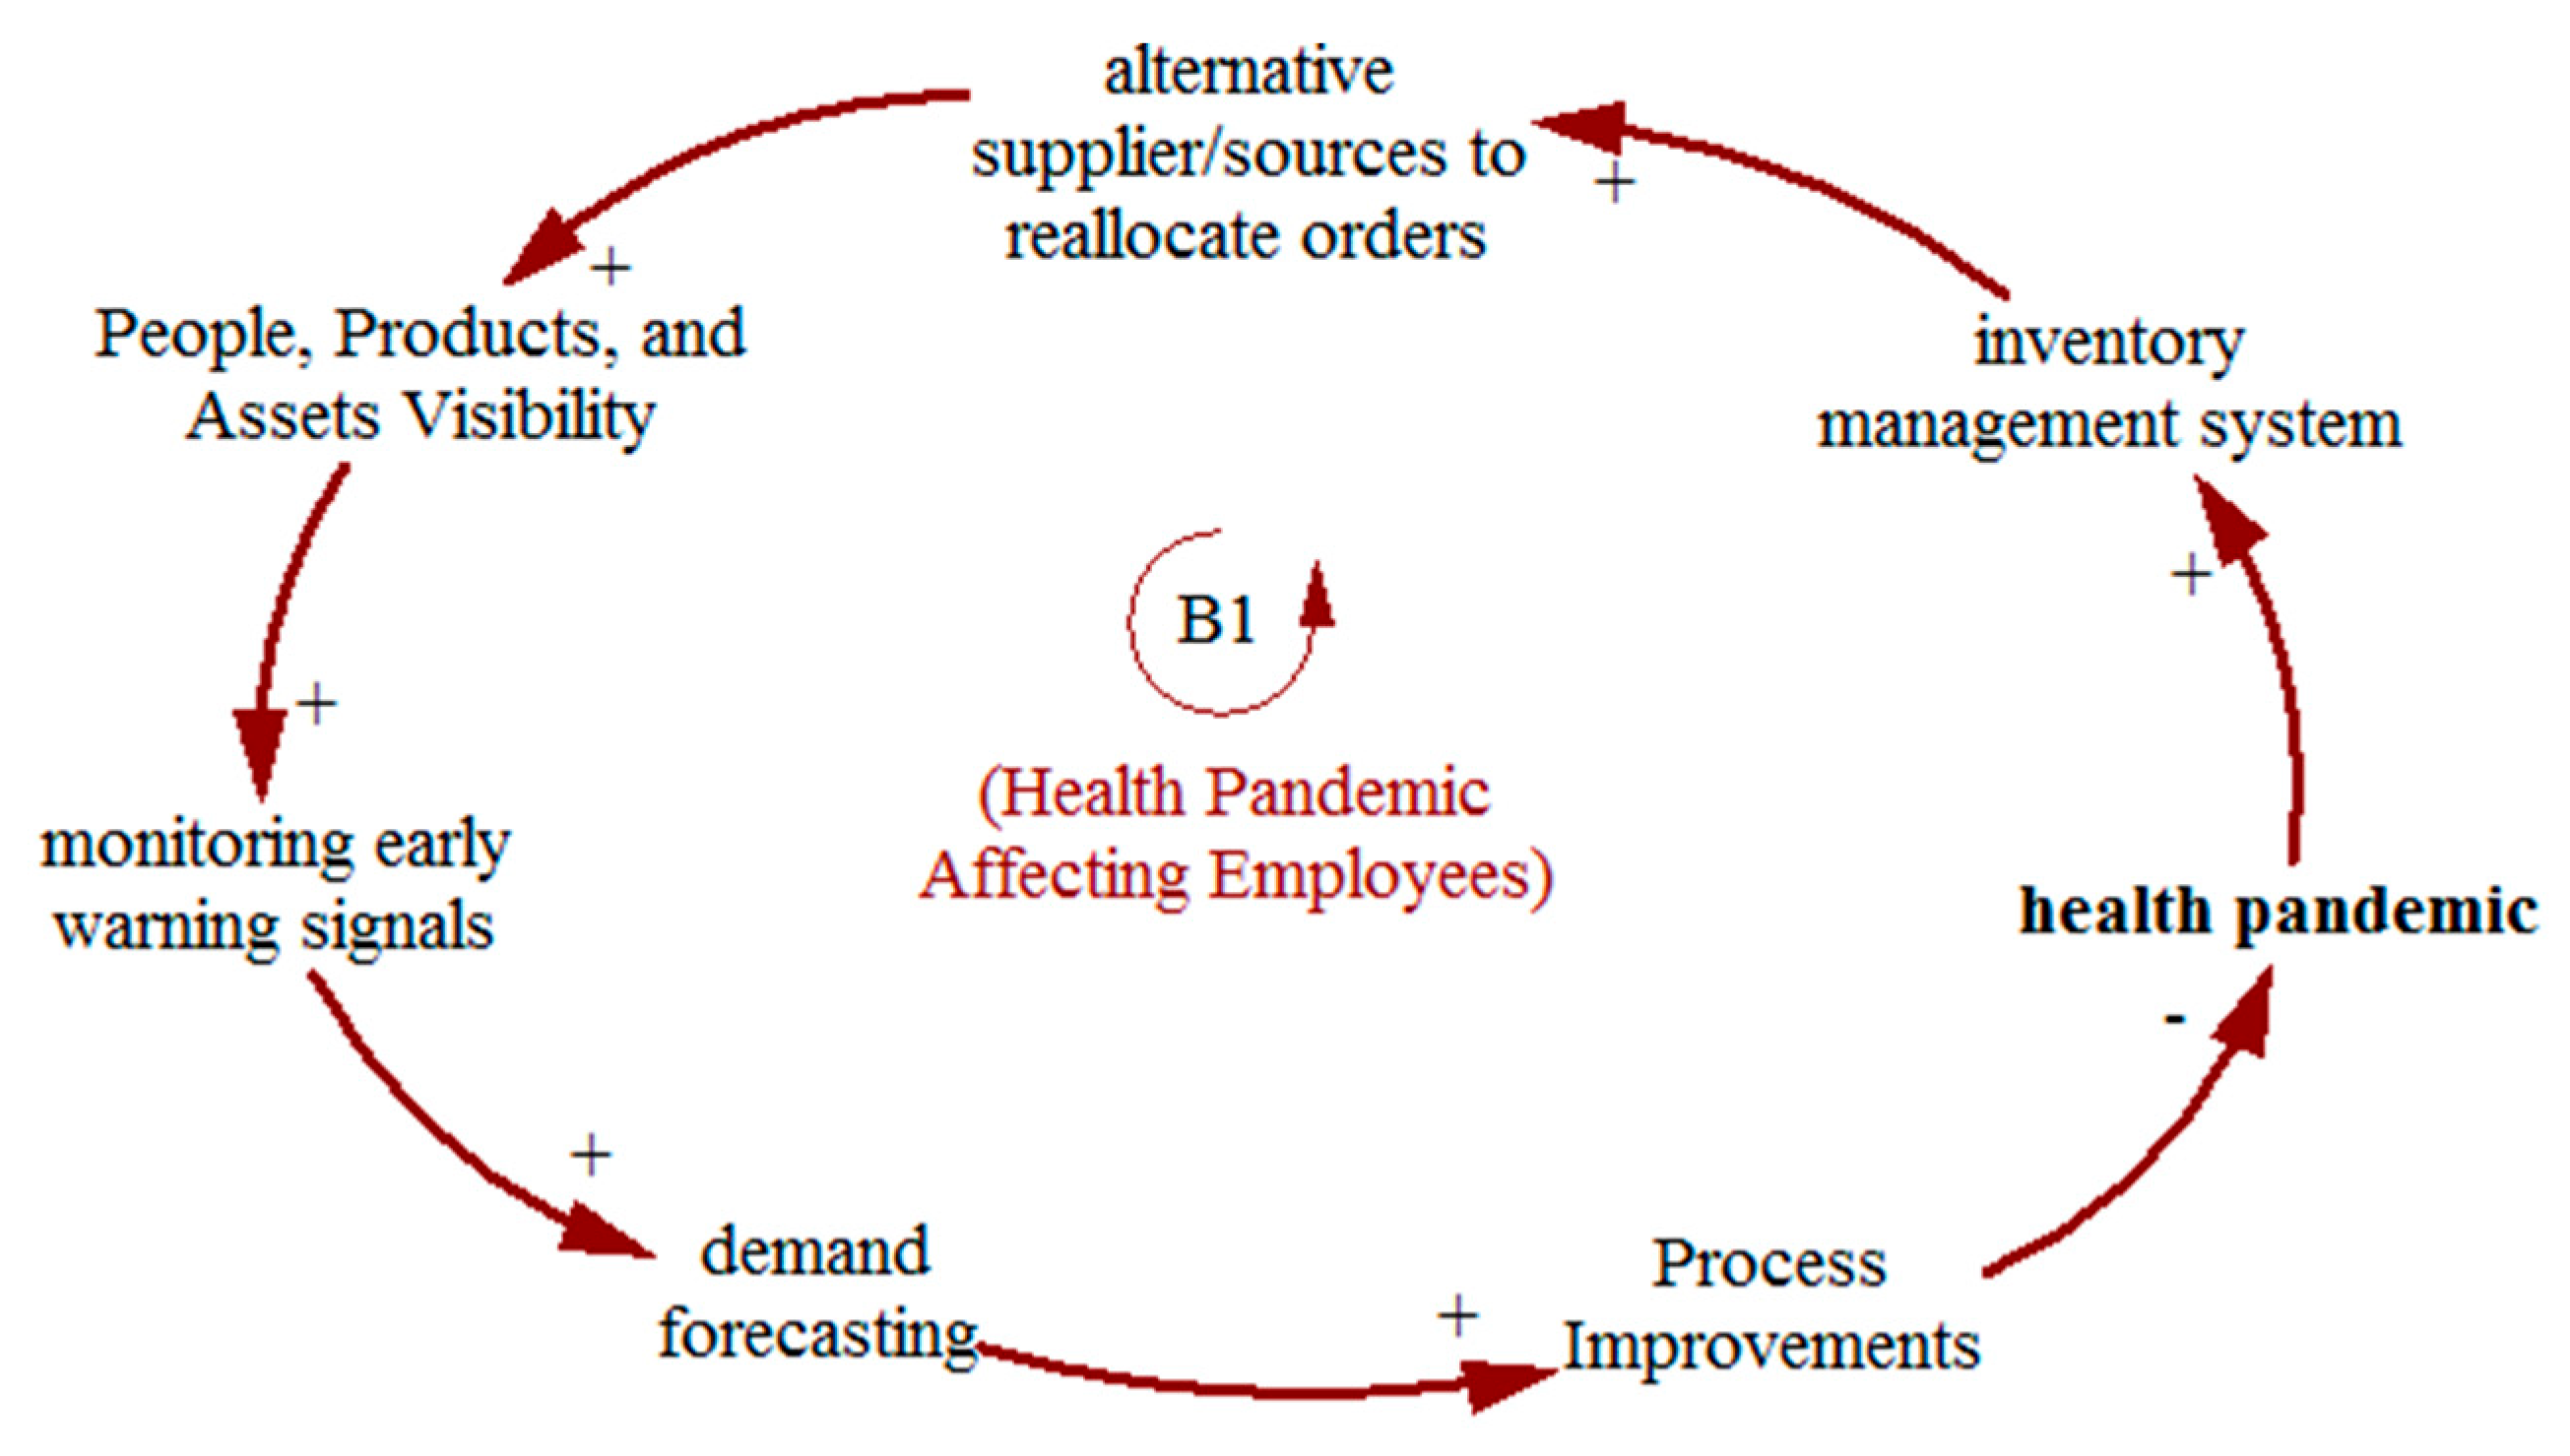
4.1. Balancing Loop B1 (Health Pandemic Affecting Employees)

The balancing loop B1 (see Figure 4) indicates that the health pandemic affects employees and the wider SC, which disturbs the whole inventory management system. The greater the impacts of the health pandemic, the greater the disruptions in the SC, and the inventory management will decline. Poor inventory management decreases the reallocation of alternative sources and suppliers, decreasing the visibility of people, products, and assets in the SC. The decrease in visibility reduces the monitoring of early warning signals which ultimately decreases demand forecasting and can result in a failure of the SC system. With the poor demand forecasting system, there will be less attention paid to the process improvement techniques to reduce lead times and delays, which adds to the employees’ burden and worries because of the heath pandemic. On the other hand, an improved process can reduce the effects of pandemics as indicated by a negative sign; however, the impact is lower, so the overall loop is negative.

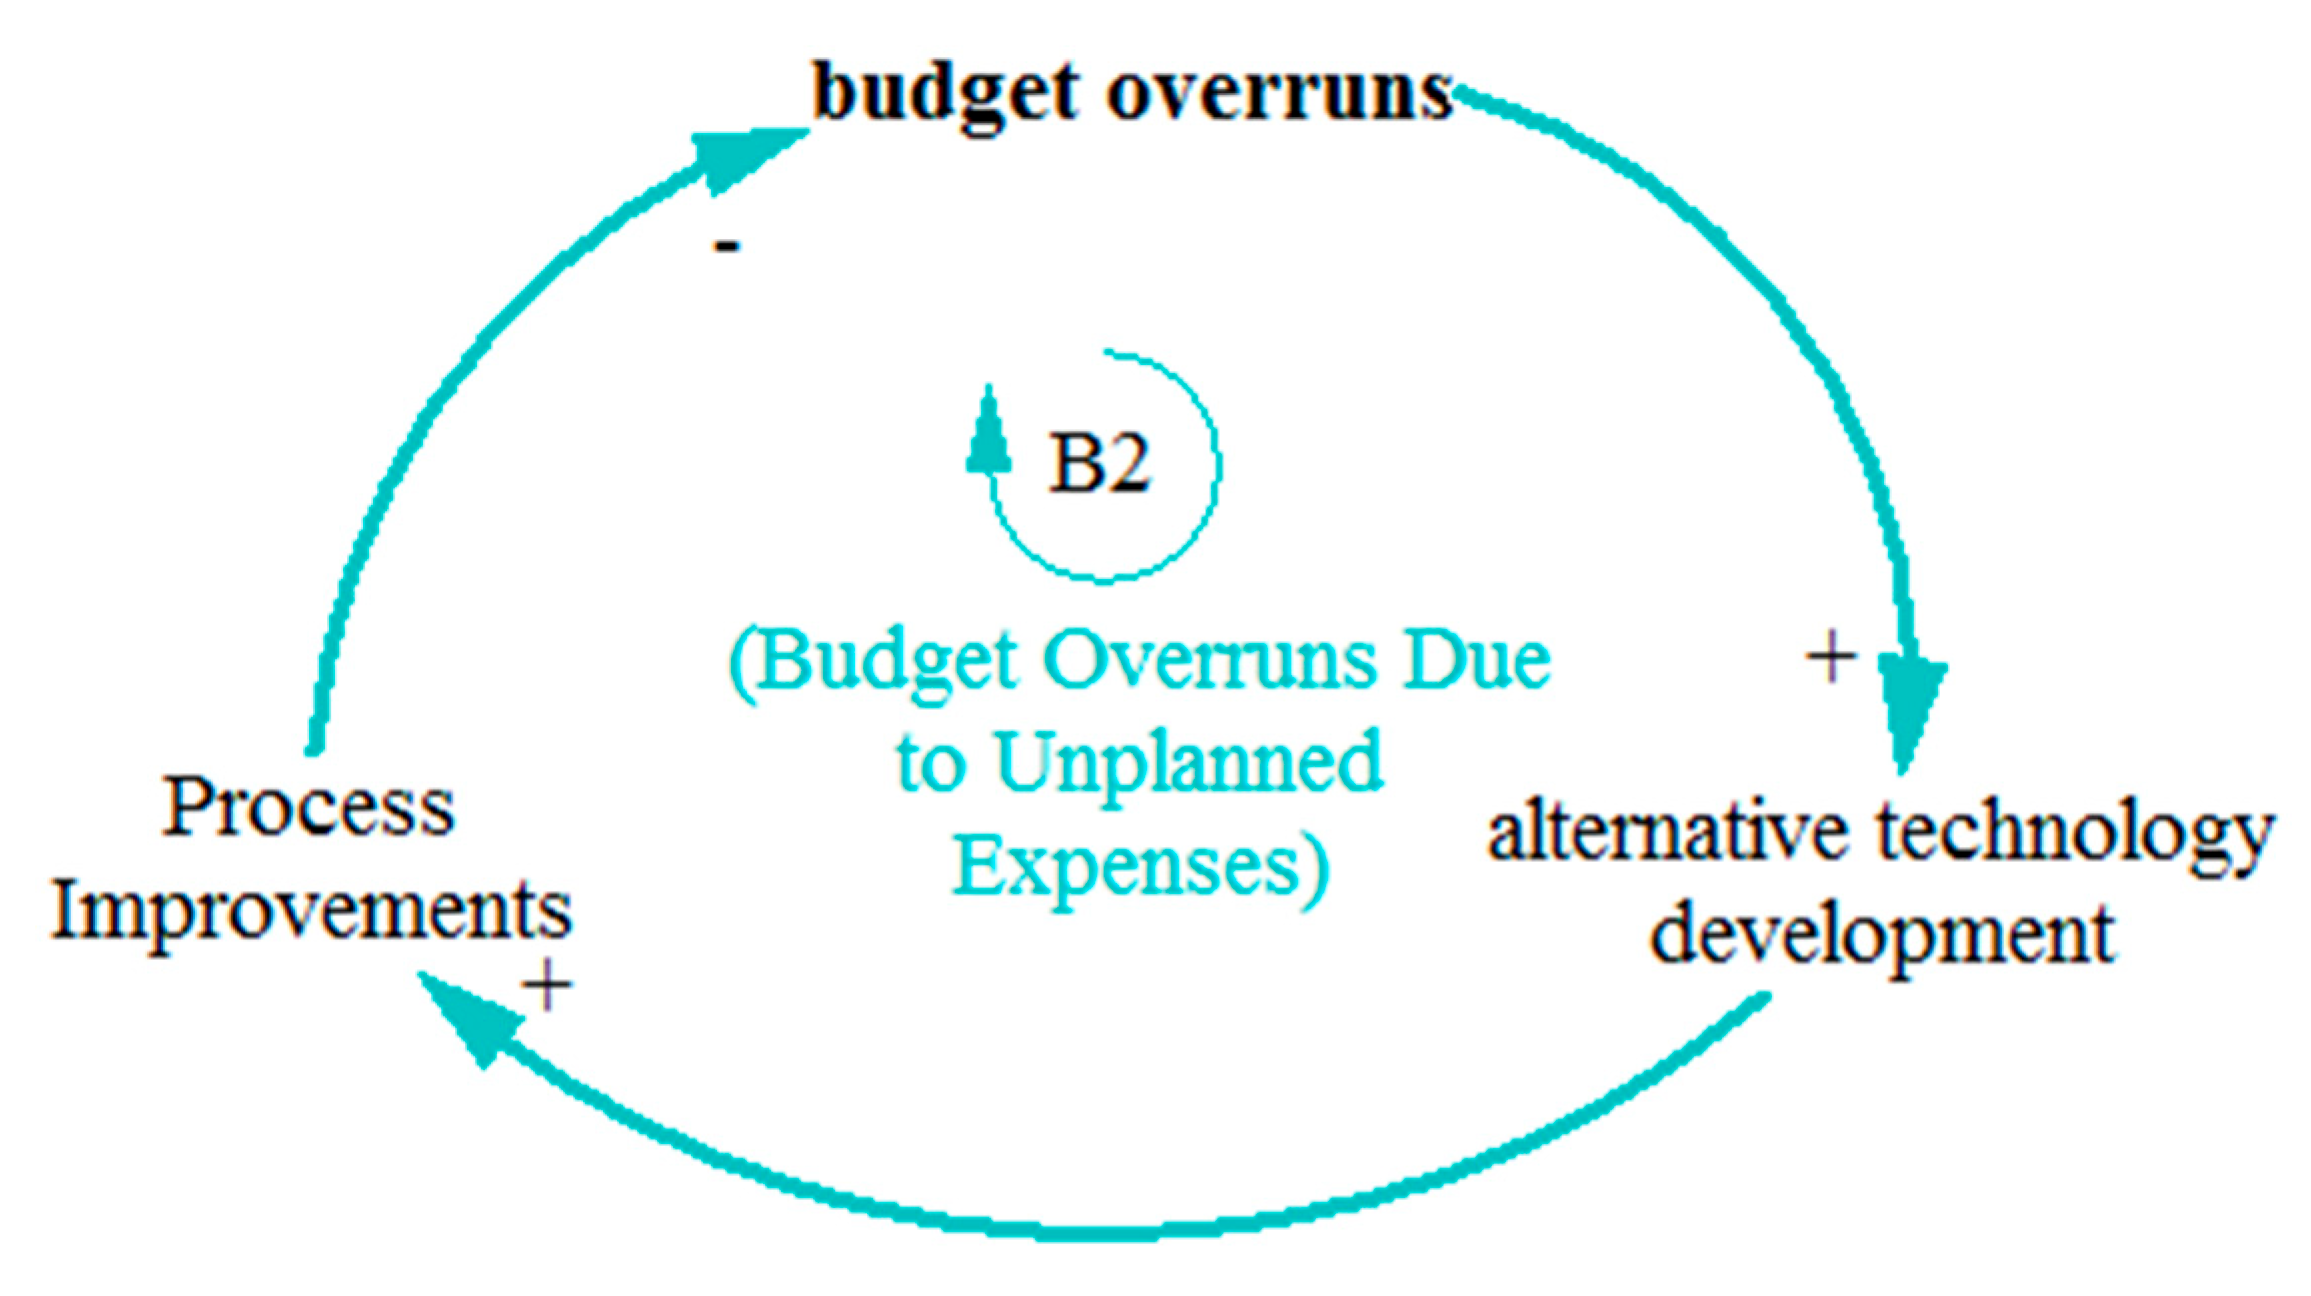
4.2. Balancing Loop B2 (Budget Overruns Due to Unplanned Expenses)

The balancing loop B2 in Figure 5 indicates that the increase in budget overruns due to unplanned expenses leads to an increase in alternative technology development by an organization to improve its system efficiency. The increase in technology development increases the process improvement techniques to reduce lead times. In addition, the increase in process improvement techniques decreases the budget overruns. Thus, an improved process and availability of alternate technologies will minimize the budget overruns.

4.3. Reinforcing Loop R1 (Poor Information Coordination and Decision Making)

The reinforcing loop R1 in Figure 6 shows that poor information coordination and decision making is caused by the decrease in collaborative information exchange among stakeholders. This decrease in information exchange reduces the transparent communication flow of an organization, both externally and internally. The transparent communication flow decreases the visibility of people, products, and assets and decreases awareness of future trends and practices collected through business intelligence gatherings. Further, business intelligence can be gained through experience, thus decreasing poor information coordination and decision making.

4.4. Reinforcing Loop R2 (Insufficient Management Oversight on Supply Chain Members)

The reinforcing loop R2 in Figure 7 indicates that insufficient management oversight of SC members is because of low learning from experience by an organization. Decreased learning from experience decreases the collaborative information exchange among stakeholders, decreasing the visibility of people, products, and assets on site. This reduced visibility reduces the chance for alternate distribution channels and modes of transport during any disruption. The availability of alternate distribution channels and modes of transport improves management oversight.

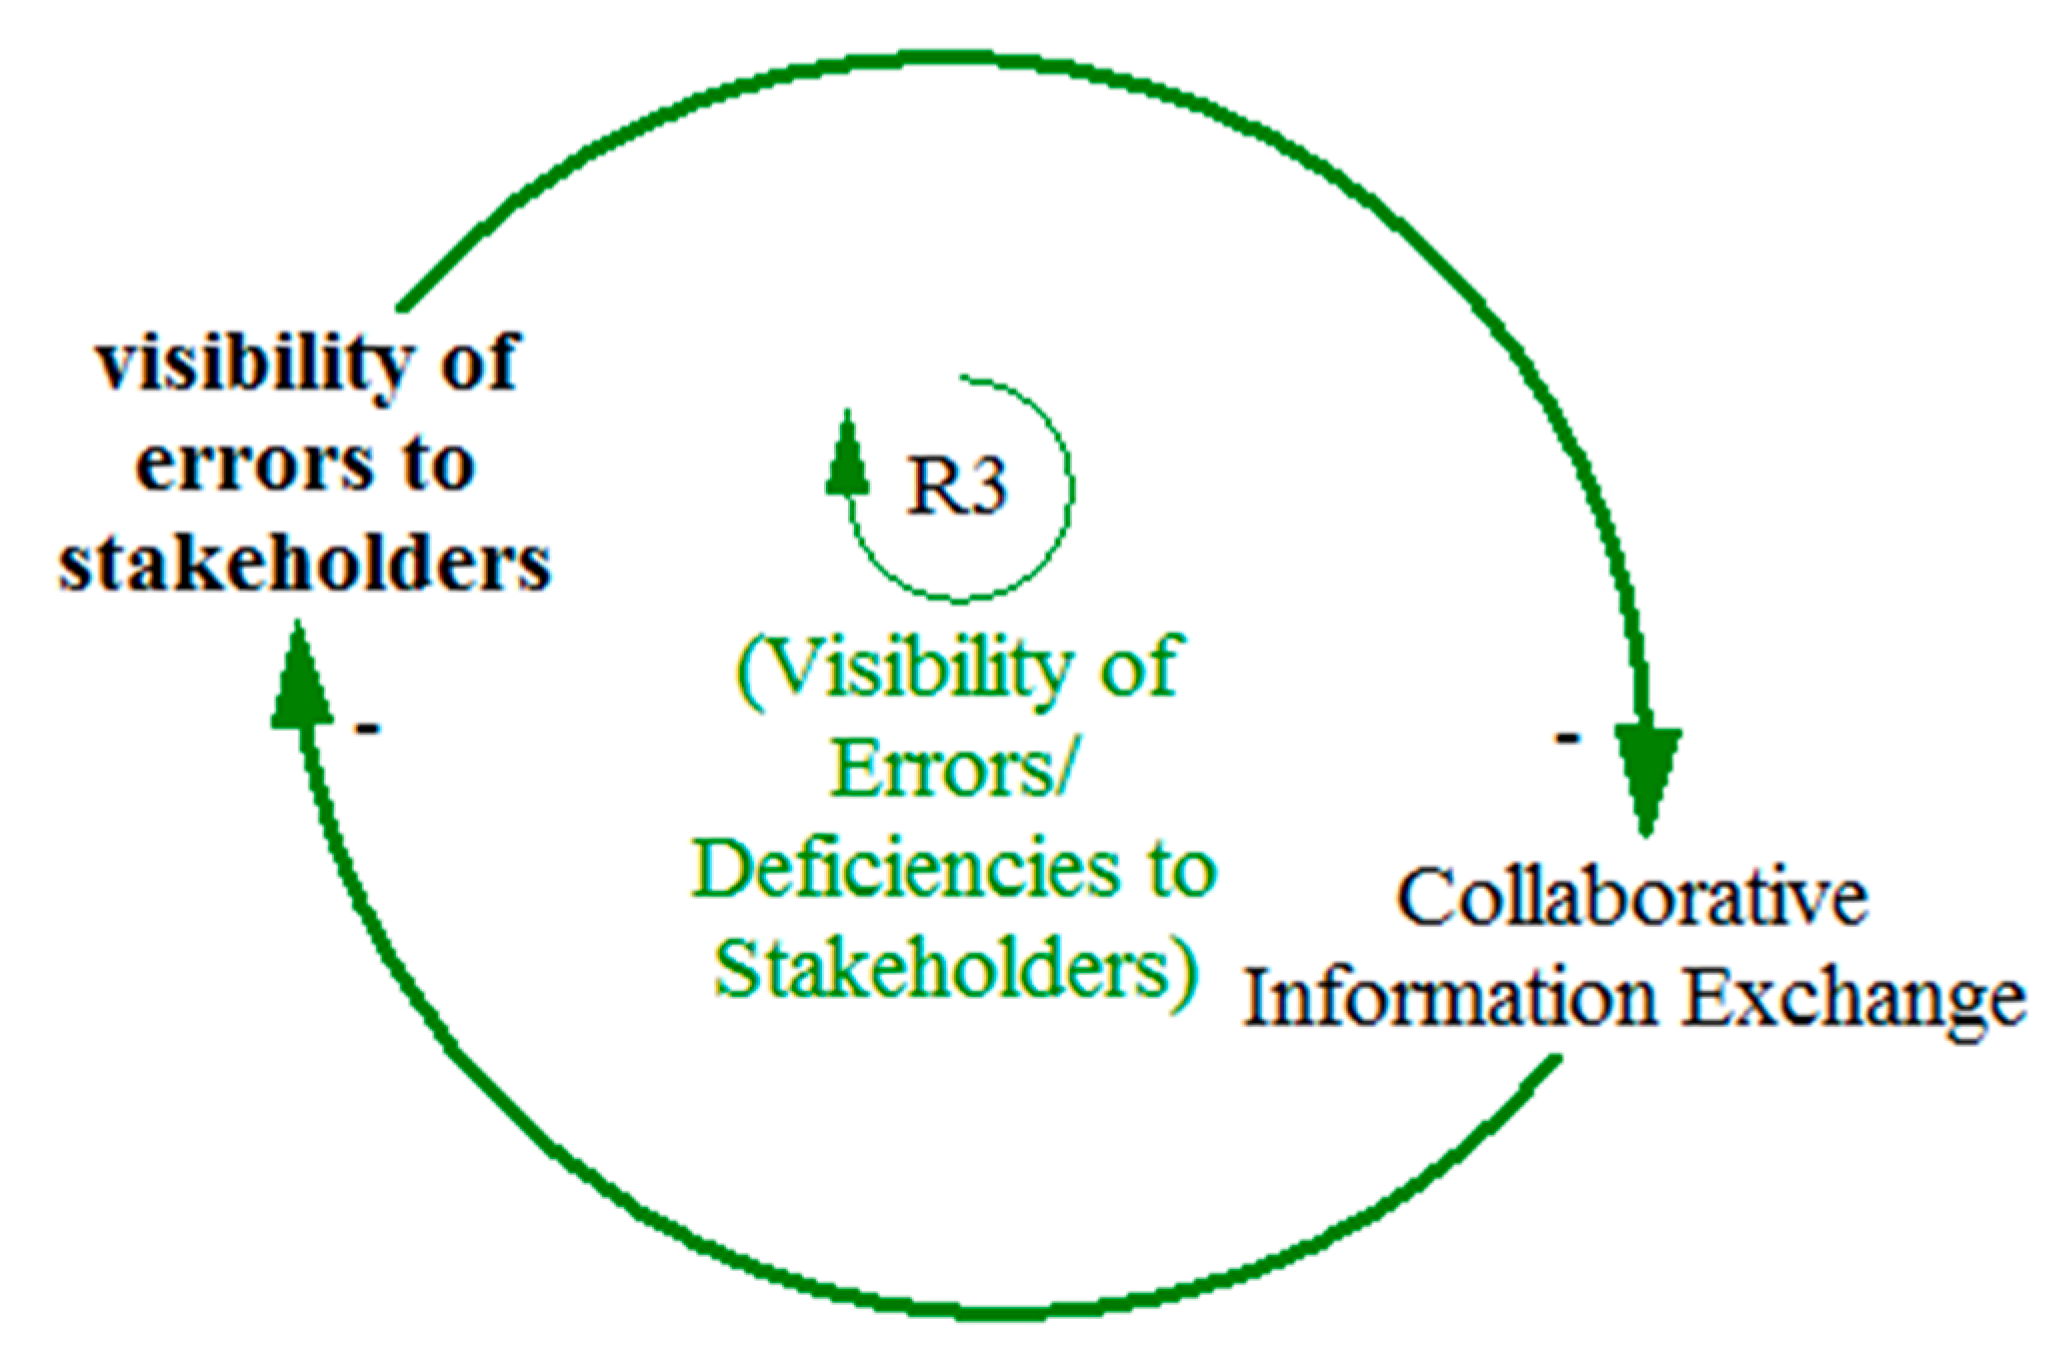
4.5. Reinforcing Loop R3 (Visibility of Errors/Deficiencies to Stakeholders)

The reinforcing loop R3 in Figure 8 shows that the visibility of errors to stakeholders decreases when collaborative information exchange among stakeholders increases. Therefore, having a suitable channel for information exchange among stakeholders will keep them aware and on top of any errors and issues before they materialize and create problems for the project team.

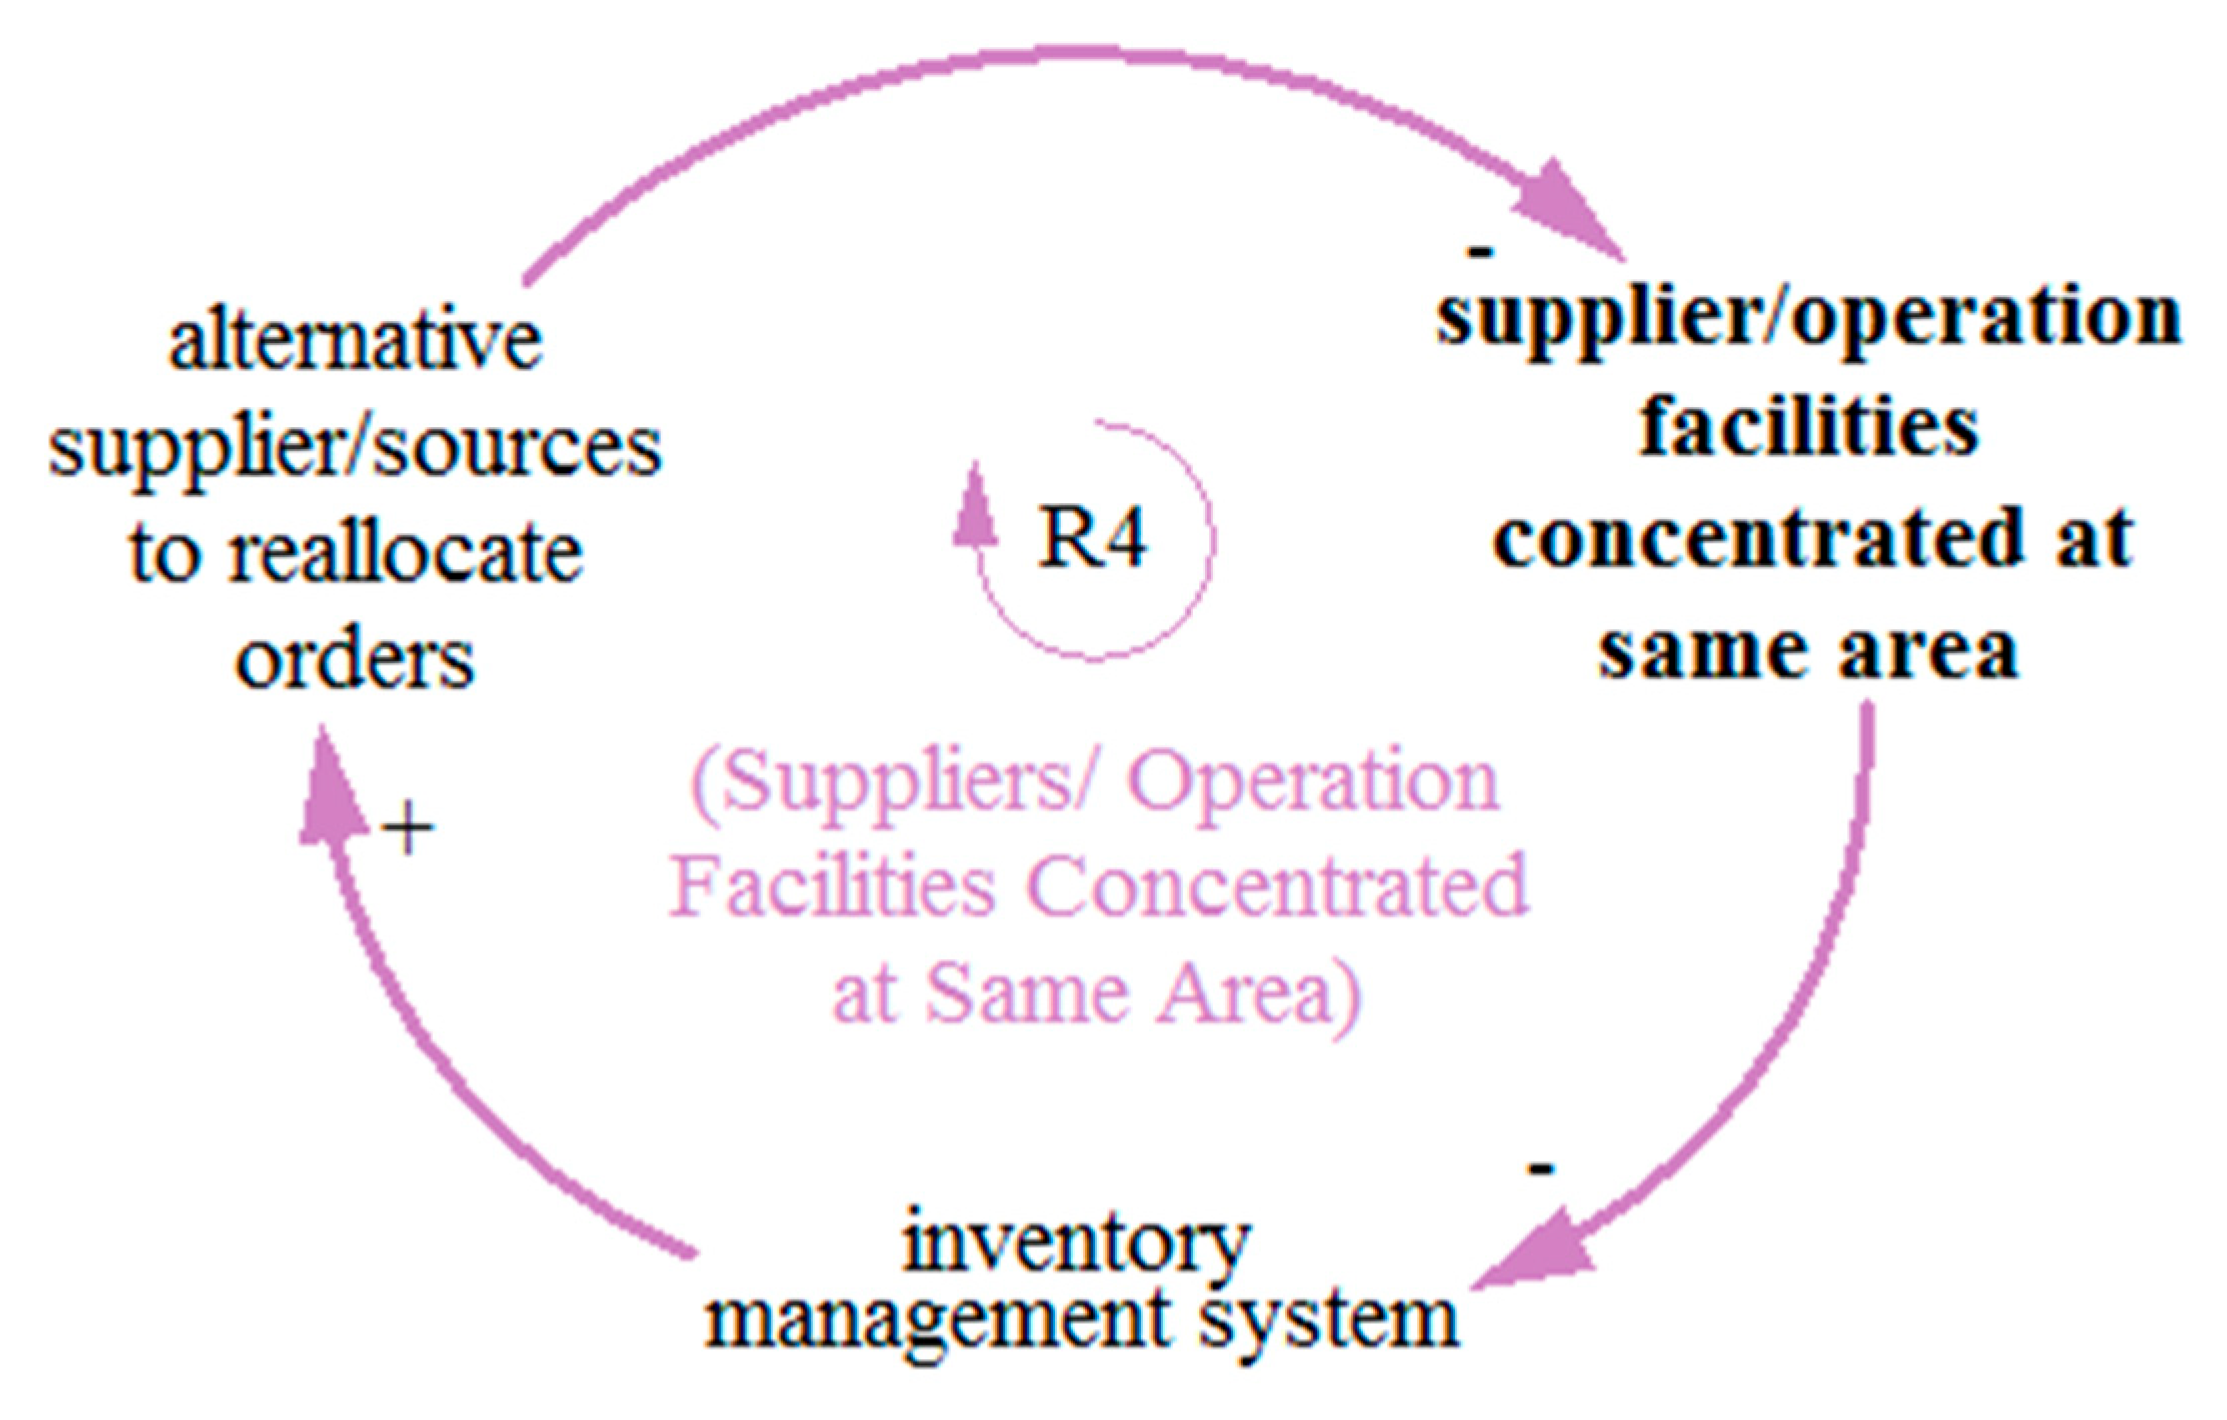
4.6. Reinforcing Loop R4 (Suppliers/Operation Facilities Concentrated at Same Area)

The reinforcing loop R4 in Figure 9 shows that the concentration of more suppliers/operation facilities in the same area indicates a poor inventory management system. An enhanced inventory management system will ultimately assign more alternative suppliers or facilities to reallocate orders in case of disruption. Hence, an increase in alternative suppliers or facilities decreases the concentration of supplier facilities in the same area.

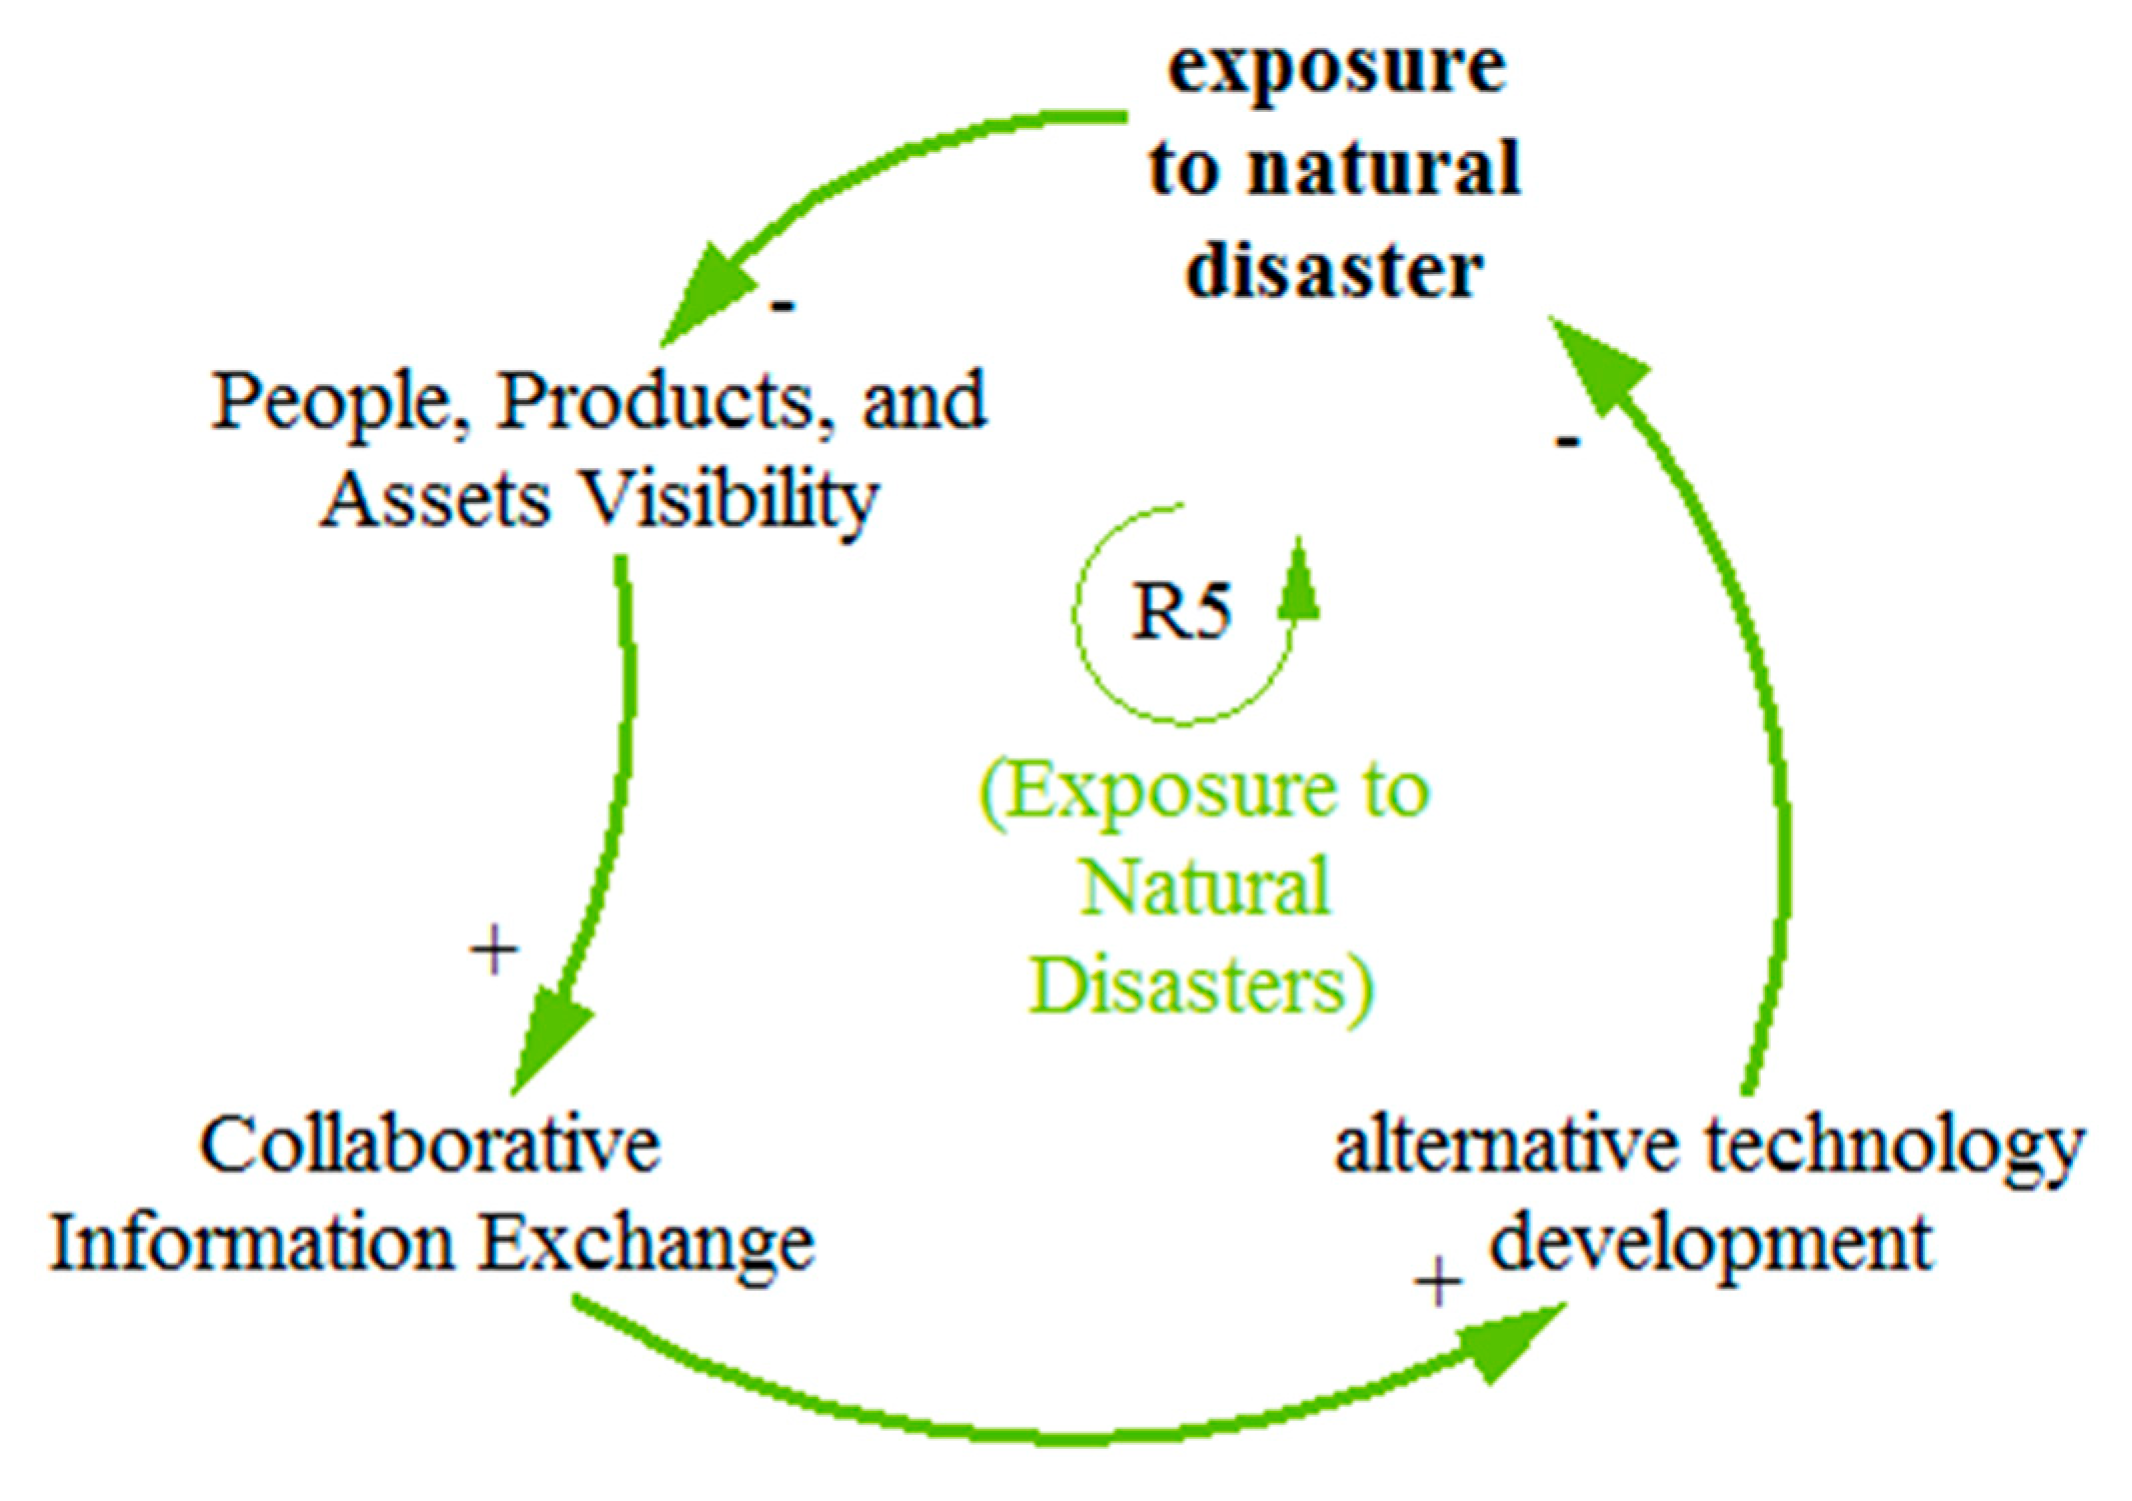
4.7. Reinforcing Loop R5 (Exposure to Natural Disasters)

The reinforcing loop R5 in Figure 10 shows that exposure to natural disasters increases when the visibility of people, products, and asset decreases. Further, the decreasing visibility decreases collaborative information exchange among stakeholders. This reduced information exchange decreases the alternative technology development programs within an organization that increases exposure to natural disasters.

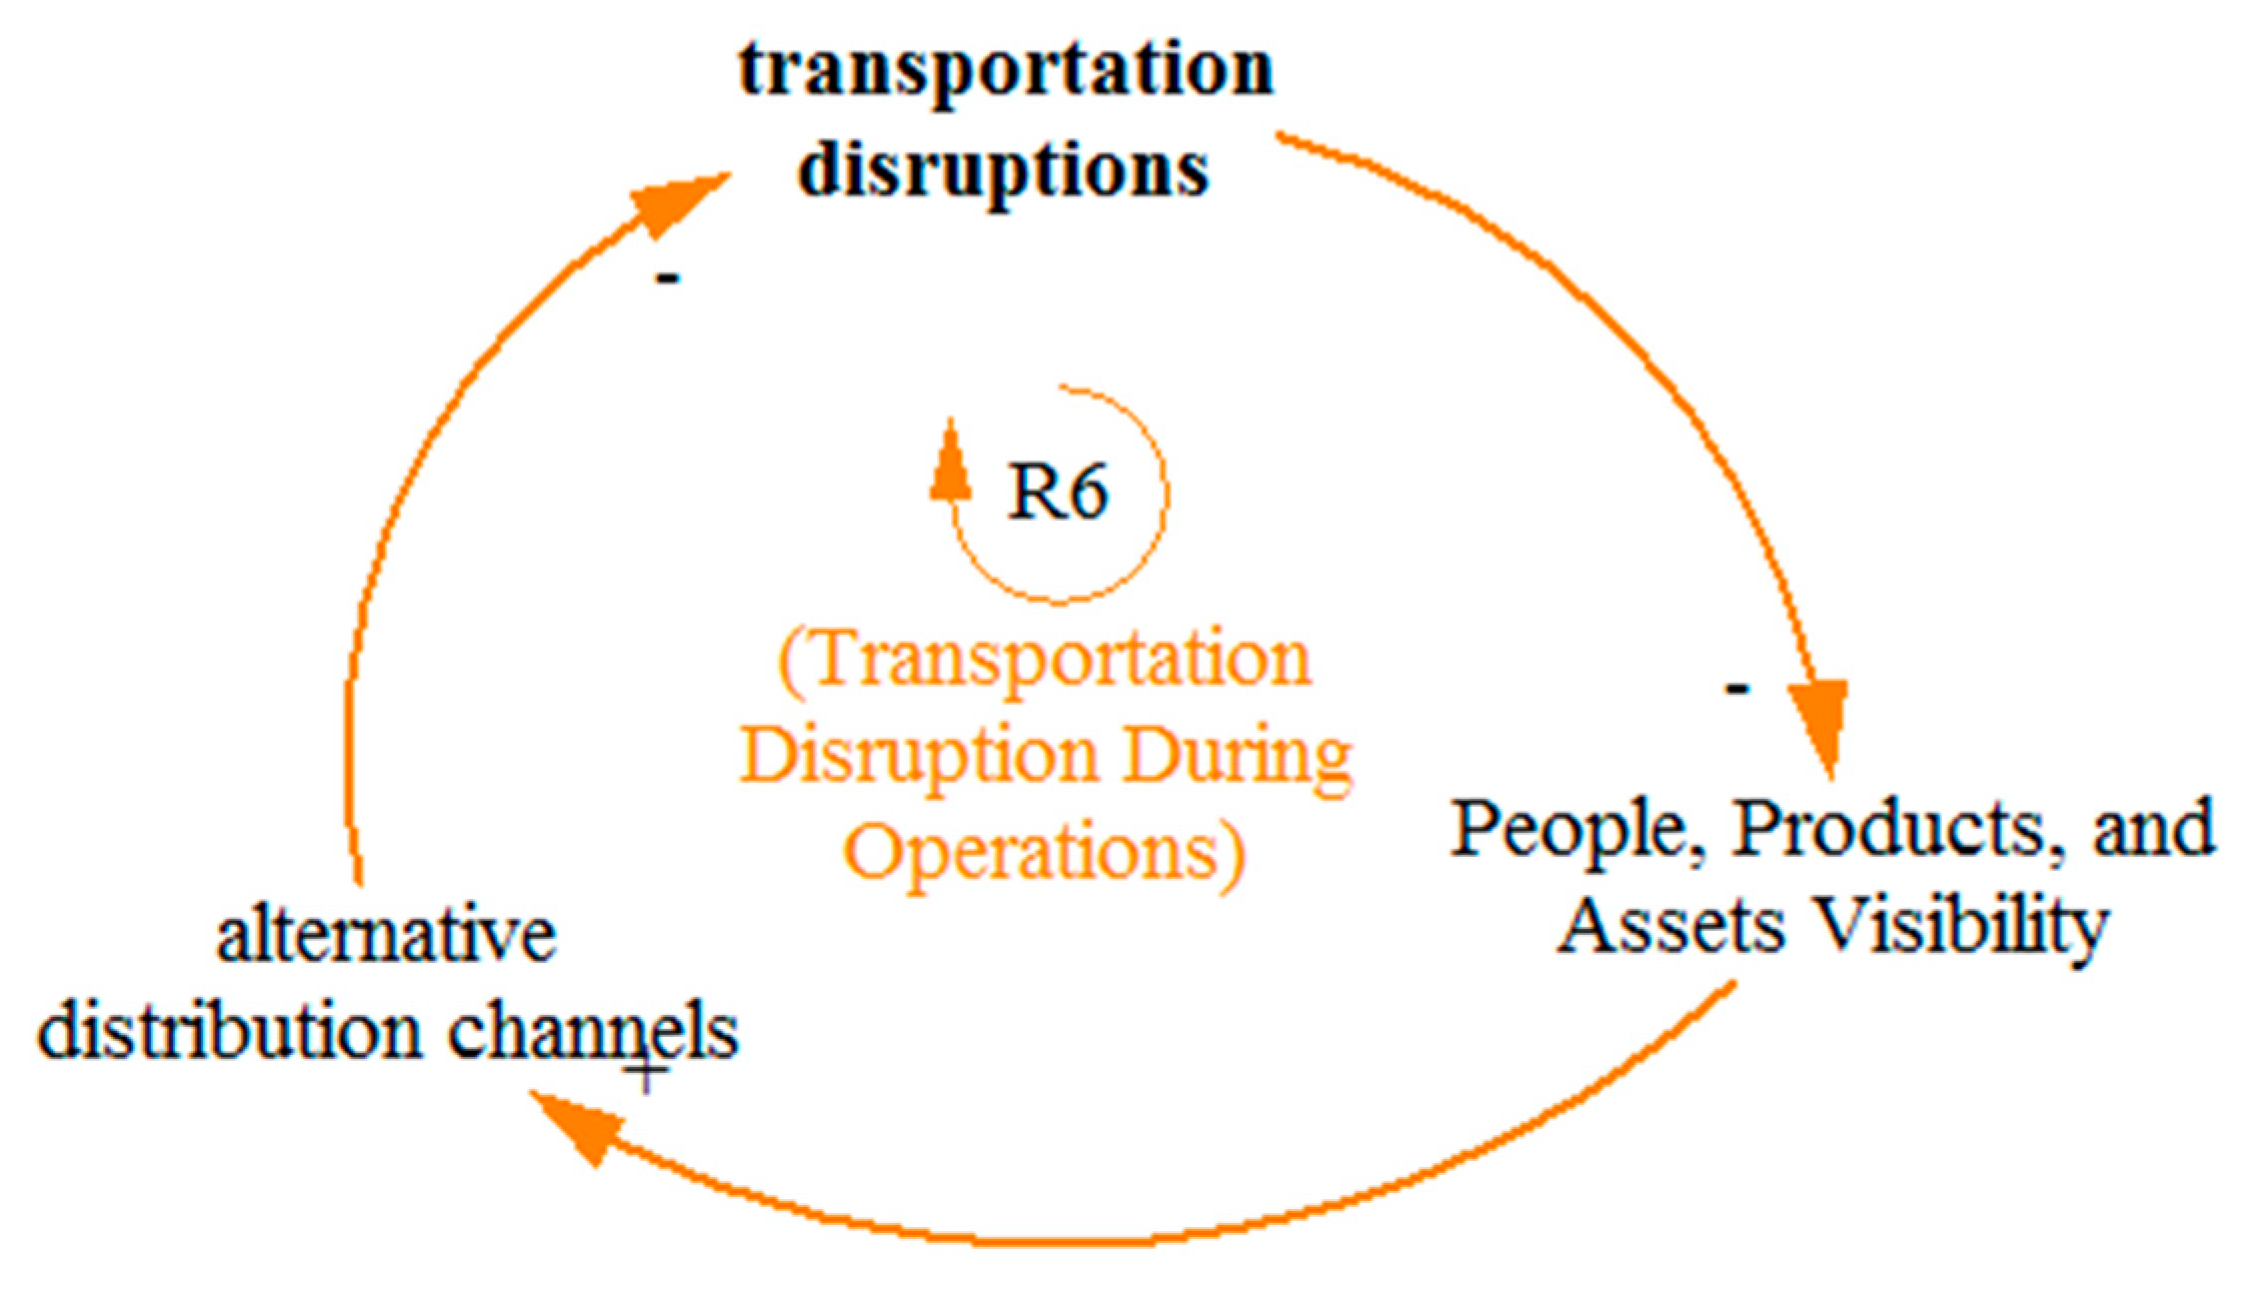
4.8. Reinforcing Loop R6 (Transportation Disruption during Operations)

The reinforcing loop R6 in Figure 11 shows that transportation disruption during operations decreases when the visibility of people, products, and assets increases on-site. The increase in visibility results in better and enhanced distribution channels and modes of transportation to tackle SC disruption. Thus, having better alternate distribution channels decreases the transportation disruption during operations.

4.9. Reinforcing Loop R7 (Limited Production and Distribution Capacity)

The reinforcing loop R7 in Figure 12 shows that the limitation of production and distribution capacity increases when there is less knowledge about future trends and behavior in the industry through business intelligence gatherings. This, in turn, decreases the monitoring of early warning signals, ultimately decreasing demand forecasting. With the poor demand forecasting system, there will be less attention paid to the process improvement techniques to reduce lead times and delays, which eventually increases an organization’s limited production and distribution capacity.

4.10. System Dynamics Modeling and Simulations

Simulation represents the system’s behavior over time. In this research study, a 6 month duration was considered, which is generally accepted as the project duration of a small-scale construction project SC. The CLD developed in this study was converted into SFD to predict the behavior of system variables over time using VENSIM® software. The SD model, as shown in Figure 13, consists of four main stocks: (a) people, products, and assets visibility, (b) collaborative information exchange, (c) process improvements, and (d) learning from experience governed by inflows and outflows. The field score of each variable in the final detailed survey was calculated and then normalized to be used as the coefficient for the respective variable present in the Equations (2)–(5) used in the SD model.
Stock-C1 = (0.034 × C2 + 0.035 × C3 + 0.036 × C4 − 0.034 × R1 − 0.035 × R2)
Stock-C3 = (0.035 × C1 + 0.035 × C5 − 0.037 × R3 − 0.035 × R4)
Stock-C5 = (0.034 × C9 − 0.035 × R5)
Stock-C6 = (0.7 × C7 + 0.9 × C8)
where the related variables include people, products, and asset visibility (C1), transparent communication flow (C2), collaborative information exchange (C3), alternative sources to reallocate orders (C4), learning from experience (C5), process improvements (C6), alternative technology development (C7), demand forecasting (C8), business intelligence gatherings (C9), transportation disruptions (R1), exposure to natural disaster (R2), poor information coordination (R3), visibility of errors to stakeholders (R4), and insufficient management oversight (R5).
The BOTG of ‘people, products, and assets visibility’ shows a draining process in Figure 14, implying that the factors in the loop play a negative role. The x-axis of the simulation represents time, and the y-axis represents the stock. People, products, and assets visibility are maximum at first, but with time it decreases; rapidly in the initial days and then slows down with time, decreasing until the end. The inflow of people, products, and assets, including risk factors such as transportation disruptions and exposure to natural disasters, are decreasing the visibility of the system. To increase the visibility of people, products, and assets, the impact of the RCs involved in inflow, i.e., transparent communication flow, collaborative information exchange, and alternative sources to reallocate orders, will have to be catered for. The impact of RCs must be increased to decrease the effects of SCs risks on the system to enhance its resilience.
Similar to ‘people, products, and asset visibility’, the BOTG of ‘collaborative information exchange’ shows a draining process in Figure 15, implying that the factors in the loop are playing a negative role. Collaborative information exchange is maximum at first, but with time it decreases, rapidly in the initial days and slows down with time. The inflow of collaborative information exchange consisting of risk factors such as poor information coordination and visibility of errors to stakeholders decreases the information exchange in the system. The impact of RCs, such as people, products, and assets visibility, and learning from experience will have to be catered for to increase collaborative information exchange. The impact of RCs must be increased to decrease the effects of SCs risks to enhance the system’s resilience.
The BOTG of ‘process improvements’ shows a compounding process in Figure 16 which implies that the factors in the loop are playing a positive role. Process improvement is minimal at first, but it follows an increasing trend with time. The inflow of process improvements consisting of RCs such as alternative technology development and customer demand forecasting increases the process improvements in the system. This shows the strong impact of RCs on the system to decrease the effects of critical risks.
The BOTG of ‘learning from experience’ shows a draining process in Figure 17, portraying a negative role. Learning from experience is maximum at first, but with the passage of time, it decreases, rapidly in the initial days and slowly with time. The inflow of learning from experience consists of the risk factor ‘insufficient management oversight’ that decreases the learning experience in the system. The impact of the RC ‘business intelligence gatherings’ will have to be catered for to increase it. The impact of RCs must be increased to decrease the effects of SC risks on the system.
Overall, the SD model addresses the different construction SC risks, diagnoses associated issues, and provides a solution to a complex system through the appropriate use of RCs to enhance the resilience and performance of the system. To put confidence in a simulation model to show the right behavior for the right reasons, it is necessary to validate it using different validation tests [80]. Four types of verification tests, including boundary adequacy, structure verification, parameters verification, and extreme condition tests, were applied in the current study to the SD model following Qudrat-Ullah and Seong [80]. These tests authenticate whether or not the key concepts tackling the problem are endogenous to the model. It further confirms whether the model structure is in harmony with the relevant descriptive knowledge of the system being modeled and verifies the consistency of parameters developed in the model with the descriptive and numerical knowledge of the system. Finally, the tests confirm the logical behavior of the model when extreme values are given to selected variables, respectively. Overall, the model validation is a continuous and repetitive process; hence, this model was validated from the beginning of its development until its completion.
Further to its validation, the model and its results were presented to 10 different construction industry professionals for expert opinion. The experts found that the critical risks and their related RCs presented in the SD model were quite clear, easy to understand, and useful as a guide in acquiring the necessary capabilities for the construction organizations that needed to develop their resilience in response to disruptions. However, some wording of the risks and RCs were changed following their suggestions to suit the construction organizations’ understanding of the terms. This helps in validating the model from a practical perspective.

5. Discussion and Implications

In this study, detailed scrutiny of 30 relevant research articles resulted in 12 key SC risks that were subdivided into 36 factors. Similarly, 13 key RCs were identified that were subdivided into 46 factors. After content analysis and a preliminary survey, 15 risks and 16 resilient capabilities were shortlisted. The CLD developed in this study consisted of seven reinforcing and two balancing loops, as shown in Figure 3. Table 3 represents the polarities as direct or indirect among the shortlisted factors. The model comprises four stocks: people, products, and assets visibility, collaborative information exchange, process improvements, and learning from experience. The simulation graph in Figure 14 shows that the people, products, and asset visibility of an organization in a developing country gradually decreases over time due to various endogenous variables. The decrease in the simulation graph’s curve with time in Figure 15 depicts the influence of numerous endogenous variables on collaborative information exchange. The increase in the simulation graph’s curve with time in Figure 16 shows the influence of numerous endogenous variables on process improvements. Lastly, the Figure 17 simulation graph signifies that due to the increase in insufficient management oversight, the learning experience of the organization gradually decreases over time. This shows the need to incorporate various RCs to achieve resilience within the SC of developing countries.
In terms of the objectives, the first two objectives of this research were to analyze the risks and RCs associated with construction SC management. To achieve these, a detailed literature review was carried out in this research to ascertain the current importance and value of various SC risks in the industry. The aim was to find ways to mitigate them and make SCs more secure and steady. Further, this helped to understand the concept of resilience and to identify various RCs required to manage current construction SC risks and categorize them appropriately. The third objective of this study was to establish the interconnectivity and functionality amongst the identified factors in SC management through ST. Therefore, the variables identified in the literature review were shortlisted with the help of two questionnaire surveys from professionals from developing countries. This helped to discover the critical interrelationships between risks and capabilities, their causes, and cascading effects on the projects’ performance. The survey results show that these SC risks and RCs are highly linked. The last objective was to assess the complexity and evaluate the integrated effect of SC risks and capabilities for a resilient SC, through SD approach. For this purpose, an SD model and simulations were run based on survey data [73]. The developed SD model highlighted the critical risks, their effects on the entire system and key capabilities, and how they help to mitigate critical risks to enhance systems resilience and foresee, investigate, and manage the system’s behavior accordingly.
This research contributes to the existing literature by identifying the critical risks prevailing in the construction SCs of developing countries and the required RCs. It helps the industry practitioners to have a complete check and balance of various prevailing or suspected risks and develop the capabilities they lack within their organizations’ SCs. The interrelations and interconnectivity of the variables described through model simulations will help understand the dynamics of relationships between SCs and RCs in the construction industries of developing countries. This will help the practitioners to enhance their preparedness against SCs disruptions and improve their project efficiency and performance without affecting the important project constraints (time, cost, quality, and scope). In terms of policy making, this research helps the policymakers immediately consider the system’s behavior, hold on to the situation, devise some policies, and act accordingly to improve the construction SC’s visibility and productivity.

6. Conclusions

The research reveals that construction organizations are more vulnerable to health pandemics, budget overruns, poor information coordination, insufficient management oversight, and error visibility to stakeholders. Further, the most effective RCs include visibility of people, products, and assets, collaborative information exchange, business intelligence gatherings, alternative suppliers, and inventory management systems.
The interrelationships between these construction SC risks and the associated RCs are established through ST. These interrelationships are iterated using SD modeling. A total of nine causal feedback loops are developed here, in which two loops are balancing, i.e., B1 and B2, and seven loops are reinforcing, i.e., R1 to R7. Then, the quantification of these integrated variables in causal feedback loops is achieved through the VENSIM®, SD modeling software. These loops are converted into stocks and flow diagrams.
ST makes it easier for the managers to understand management difficulties and the system’s behavior. The quantitative impacts of the variables on the system over a certain period are explained by SD simulations. However, it must be kept in mind that these models can only ease the decision-making process by permitting interdependencies and relationships to justify the complex behavior of the system. Moreover, these models cannot deliver project-specific advice to specialists. Therefore, to get detailed advice and practical solutions, one should practice the model in relationship and collaboration with a case-based or system expert to experience real-time problems occurring in the construction supply chain.
Overall, this research helps industry practitioners and organizations to realize the importance and interdependencies among critical construction SC risks and capabilities to avoid disruptions. It helps understand trade-offs between the most appropriate RCs required to mitigate key risks to strengthen their preparedness and SC resilience for continual improvement in the highly competitive construction industry. The following recommendations can be made to address the pertinent risk factors in the construction SC:
  • Set up an effective communication system with suppliers to improve trust.
  • A risk management team can integrate suppliers with other parties and inform them about expected risks during the project. In addition, previous project reviews, particularly the risks, can assist the existing project with preventive and corrective actions.
  • A relevant problem-solving strategy should be exercised to set apart the problem and its source and seek workable solutions.
In terms of limitations, for this research, only 60 responses were collected. Thus, for extensive analysis, more responses could be collected to conduct a more in-depth analysis. Additionally, case studies can be conducted to explore how these supply chain risks hinder the project’s performance during its different phases.
For future researchers, it would be thought-provoking to examine the cascading effects of blockages across different tiers of SCs networks on other interdependent industries and to study their dynamics and interdependencies. While using the risk resilience approach, future research could also consider the scale of disruption in terms of its severity and frequency. It will assist in deciding the most appropriate RCs needed to counter disruptions at varying magnitudes.

Supplementary Materials

The following supporting information can be downloaded at: https://www.mdpi.com/article/10.3390/buildings12091322/s1. Table S1: Relative Importance Index of SCs.

Author Contributions

Conceptualization, A.M. (Afia Malik), K.I.A.K., S.Q. and F.U.; methodology, A.M. (Afia Malik), K.I.A.K., S.Q. and F.U.; software, A.M. (Afia Malik) and K.I.A.K.; validation, A.M. (Afia Malik), K.I.A.K., S.Q., F.U. and A.M. (Ahsen Maqsoom); formal analysis, A.M. (Afia Malik), K.I.A.K., S.Q. and F.U.; investigation, A.M. (Afia Malik) and K.I.A.K.; resources, S.Q. and F.U.; data curation, A.M. (Afia Malik), K.I.A.K., S.Q., F.U. and A.M. (Ahsen Maqsoom); writing—original draft preparation, A.M. (Afia Malik), K.I.A.K., S.Q. and F.U.; writing—review and editing, K.I.A.K. and F.U.; visualization, A.M. (Afia Malik) and K.I.A.K.; supervision, K.I.A.K. and F.U.; project administration, K.I.A.K., S.Q., F.U. and A.M. (Ahsen Maqsoom); funding acquisition, F.U. All authors have read and agreed to the published version of the manuscript.

Funding

This research received no external funding.

Institutional Review Board Statement

Not applicable.

Informed Consent Statement

Informed consent was obtained from all subjects involved in the study.

Data Availability Statement

Data are available with the first author and can be shared upon reasonable request.

Conflicts of Interest

The authors declare no conflict of interest.

References

  1. Abidin, N.A.Z.; Ingirige, B. The dynamics of vulnerabilities and capabilities in improving resilience within Malaysian construction supply chain. Constr. Innov. 2018, 18, 412–432. [Google Scholar] [CrossRef]
  2. Kosansky, A.; Taus, M. Managing for Catastrophes: Building a Resilient Supply Chain. Supply Chain Manag. Rev. 2014. Available online: https://www.scmr.com/article/managing_for_catastrophes_building_a_resilient_supply_chain (accessed on 25 August 2022).
  3. Ofori, G. New Perspectives on Construction in Developing Countries; Routledge: London, UK, 2012. [Google Scholar]
  4. Tukamuhabwa, B.R.; Stevenson, M.; Busby, J.; Zorzini, M. Supply chain resilience: Definition, review and theoretical foundations for further study. Int. J. Prod. Res. 2015, 53, 5592–5623. [Google Scholar] [CrossRef]
  5. Abdul-Rahman, H.; Rahim, F.A.M.; Mohd, M.S. A study on quality management during the pre-construction stage of design-and-build projects. In Proceedings of the CME 25 Conference Construction Management and Economics—‘Past, Present and Future’, Reading, UK, 16–18 July 2007; p. 753. [Google Scholar]
  6. Swedberg, R. The structure of confidence and the collapse of Lehman Brothers. In Markets on Trial: The Economic Sociology of the US Financial Crisis: Part A; Emerald Group Publishing Limited: Bradford, UK, 2010. [Google Scholar]
  7. Wildgoose, N. Avoiding the Pitfalls of Supply Chain Disruptions; Zurich: Zurich, Switzerland, 2011. [Google Scholar]
  8. Le-Hoai, L.; Lee, Y.D.; Lee, J.Y. Delay and Cost Overruns in Vietnam Large Construction Projects: A Comparison with Other Selected Countries. KSCE J. Civ. Eng. 2008, 12, 367–377. [Google Scholar] [CrossRef]
  9. Mehdi Riazi, S.; Skitmore, M.; Cheung, F. The use of supply chain management to reduce delays: Malaysian public sector construction projects. In Proceedings of the 6th Nordic Conference on Construction Economics and Organisation—Shaping the Construction/Society Nexus, Volume 2: Transforming Practices; Widen, K., Klakegg, O.J., Lindahl, G.A., Gottlieb, S.C., Kahkonen, K.E., Haugbolle, K., Eds.; Danish Building Research Institute, Aalborg University: Aalborg, Denmark, 2011; pp. 403–414. [Google Scholar]
  10. Maqsoom, A.; Zahoor, I.; Ashraf, H.; Ullah, F.; Alsulami, B.T.; Salman, A.; Alqurashi, M. Nexus between Leader–Member Exchange, Paternalistic Leadership, and Creative Behavior in the Construction Industry. Sustainability 2022, 14, 7211. [Google Scholar] [CrossRef]
  11. Loosemore, M.; Teo, M.M.M. Crisis preparedness of construction companies. J. Manag. Eng. 2000, 16, 60–65. [Google Scholar] [CrossRef]
  12. Ghufran, M.; Khan, K.I.A.; Ullah, F.; Nasir, A.R.; Al Alahmadi, A.A.; Alzaed, A.N.; Alwetaishi, M. Circular Economy in the Construction Industry: A Step towards Sustainable Development. Buildings 2022, 12, 1004. [Google Scholar] [CrossRef]
  13. Abas, M.; Khattak, S.B.; Habib, T.; Nadir, U. Assessment of critical risk and success factors in construction supply chain: A case of Pakistan. Int. J. Constr. Manag. 2020, 1–9. [Google Scholar] [CrossRef]
  14. Jüttner, U.; Peck, H.; Christopher, M. Supply chain risk management: Outlining an agenda for future research. Int. J. Logist. Res. Appl. 2003, 6, 197–210. [Google Scholar] [CrossRef]
  15. Ponomarov, S.Y.; Holcomb, M.C. Understanding the concept of supply chain resilience. Int. J. Logist. Manag. 2009, 20, 124–143. [Google Scholar] [CrossRef]
  16. Pettit, T.J.; Fiksel, J.; Croxton, K.L. Ensuring Supply Chain Resilience: Development of a Conceptual Framework. J. Bus. Logist. 2010, 31, 1–21. [Google Scholar] [CrossRef]
  17. Olsson, N.O. Management of flexibility in projects. Int. J. Proj. Manag. 2006, 24, 66–74. [Google Scholar] [CrossRef]
  18. Pettit, T.J. Supply Chain Resilience: Development of a Conceptual Framework, an Assessment Tool and an Implementation Process; Ohio State University: Columbus, OH, USA, 2008. [Google Scholar]
  19. Maqsoom, A.; Khan, M.U.; Khan, M.T.; Khan, S.; Ullah, F. Factors influencing the construction time and cost overrun in projects: Empirical evidence from Pakistani construction industry. In Proceedings of the 21st International Symposium on Advancement of Construction Management and Real Estate; Springer: Singapore, 2018; pp. 769–778. [Google Scholar] [CrossRef]
  20. Osei-Kyei, R.; Chan, A.P.C. Factors attracting private sector investments in public-private partnerships in developing countries A survey of international experts. J. Financial Manag. Prop. Constr. 2017, 22, 92–111. [Google Scholar] [CrossRef]
  21. Mandal, S. An empirical investigation into supply chain resilience. IUP J. Supply Chain. Manag. 2012, 9, 46. [Google Scholar]
  22. McManus, S.T. Organisational Resilience in New Zealand. Ph.D. Thesis, University of Canterbury, Christchurch, New Zealand, 2008. [Google Scholar]
  23. Zsidisin, G.A.; Wagner, S.M. Do Perceptions Become Reality? The Moderating Role of Supply Chain Resiliency on Disruption Occurrence. J. Bus. Logist. 2010, 31, 1–20. [Google Scholar] [CrossRef]
  24. Pettit, T.J.; Croxton, K.L.; Fiksel, J. Ensuring Supply Chain Resilience: Development and Implementation of an Assessment Tool. J. Bus. Logist. 2013, 34, 46–76. [Google Scholar] [CrossRef]
  25. Ullah, F.; Thaheem, M.J. Concession period of public private partnership projects: Industry–academia gap analysis. Int. J. Constr. Manag. 2018, 18, 418–429. [Google Scholar] [CrossRef]
  26. Siang, L.C.; Ali, A.S. Implementation of risk management in the Malaysian construction industry. J. Surv. Constr. Prop. 2012, 3, 1–15. [Google Scholar] [CrossRef]
  27. Goh, C.S.; Abdul-Rahman, H.; Samad, Z.A. Applying Risk Management Workshop for a Public Construction Project: Case Study. J. Constr. Eng. Manag. 2013, 139, 572–580. [Google Scholar] [CrossRef]
  28. Camerer, C.F.; Kunreuther, H. Decision processes for low probability events: Policy implications. J. Policy Anal. Manag. 1989, 8, 565–592. [Google Scholar] [CrossRef]
  29. IEC 31010:2019; Risk Management—Risk Assessment Techniques. ISO (International Organization for Standardization): Geneva, Switzerland, 2019.
  30. Wedawatta, G.; Ingirige, B. A conceptual framework for understanding resilience of construction SMEs to extreme weather events. Built Environ. Proj. Asset Manag. 2016, 6, 428–443. [Google Scholar] [CrossRef]
  31. Juttner, U.; Maklan, S. Supply chain resilience in the global financial crisis: An empirical study. Supply Chain Manag. Int. J. 2011, 16, 246–259. [Google Scholar] [CrossRef]
  32. Kinman, B. Building a risk-resilient organisation. Resil. Win. Risk 2012, 1. Available online: https://www.pwc.com/gx/en/services/advisory/consulting/risk/resilience/publications/building-a-risk-resilient-organisation.html (accessed on 25 August 2022).
  33. Stephenson, A.V. Benchmarking the Resilience of Organisations. Ph.D. Thesis, University of Canterbury, Christchurch, New Zealand, 2010. [Google Scholar]
  34. Ullah, F.; Sepasgozar, S.M.; Shirowzhan, S.; Davis, S. Modelling users’ perception of the online real estate platforms in a digitally disruptive environment: An integrated KANO-SISQual approach. Telemat. Inform. 2021, 63, 101660. [Google Scholar] [CrossRef]
  35. Sterman, J.D. Business Dynamics: Systems Thinking and Modeling for a Complex World; McGraw-Hill, Inc.: New York, NY, USA, 2000; 982p. [Google Scholar]
  36. Li, C.Y.; Ren, J.; Wang, H.Y. A system dynamics simulation model of chemical supply chain transportation risk management systems. Comput. Chem. Eng. 2016, 89, 71–83. [Google Scholar] [CrossRef]
  37. Peng, M.; Peng, Y.; Chen, H. Post-seismic supply chain risk management: A system dynamics disruption analysis approach for inventory and logistics planning. Comput. Oper. Res. 2014, 42, 14–24. [Google Scholar] [CrossRef]
  38. Keilhacker, M.L.; Minner, S. Supply chain risk management for critical commodities: A system dynamics model for the case of the rare earth elements. Resour. Conserv. Recycl. 2017, 125, 349–362. [Google Scholar] [CrossRef]
  39. Oliveira, J.B.; Jin, M.; Lima, R.S.; Kobza, J.E.; Montevechi, J.A.B. The role of simulation and optimization methods in supply chain risk management: Performance and review standpoints. Simul. Model. Pract. Theory 2019, 92, 17–44. [Google Scholar] [CrossRef]
  40. Sheffi, Y.; Rice, J.B., Jr. A supply chain view of the resilient enterprise. MIT Sloan Manag. Rev. 2005, 47, 41. [Google Scholar]
  41. Berg, E.; Knudsen, D.; Norrman, A. Assessing performance of supply chain risk management programmes: A tentative approach. Int. J. Risk Assess. Manag. 2008, 9, 288–310. [Google Scholar] [CrossRef]
  42. Alkhaleel, B.A.; Liao, H.; Sullivan, K.M. Risk and resilience-based optimal post-disruption restoration for critical infrastructures under uncertainty. Eur. J. Oper. Res. 2022, 296, 174–202. [Google Scholar] [CrossRef]
  43. Svensson, G. A conceptual framework for the analysis of vulnerability in supply chains. Int. J. Phys. Distrib. Logist. Manag. 2000, 30, 731–750. [Google Scholar] [CrossRef]
  44. Kleindorfer, P.R.; Saad, G.H. Managing disruption risks in supply chains. Prod. Oper. Manag. 2009, 14, 53–68. [Google Scholar] [CrossRef]
  45. Hendricks, K.B.; Singhal, V.R.; Zhang, R. The effect of operational slack, diversification, and vertical relatedness on the stock market reaction to supply chain disruptions. J. Oper. Manag. 2009, 27, 233–246. [Google Scholar] [CrossRef]
  46. Craighead, C.W.; Blackhurst, J.; Rungtusanatham, M.J.; Handfield, R.B. The severity of supply chain disruptions: Design characteristics and mitigation capabilities. Decis. Sci. 2007, 38, 131–156. [Google Scholar] [CrossRef]
  47. Fiksel, J.; Polyviou, M.; Croxton, K.L.; Pettit, T.J. From Risk to Resilience: Learning to Deal with Disruption. MIT Sloan Manag. Rev. 2015, 56, 79–86. [Google Scholar]
  48. Wagner, S.M.; Neshat, N. Assessing the vulnerability of supply chains using graph theory. Int. J. Prod. Econ. 2010, 126, 121–129. [Google Scholar] [CrossRef]
  49. Benton, W.; McHenry, L.F. Construction Purchasing & Supply Chain Management; McGraw-Hill: New York, NY, USA, 2010. [Google Scholar]
  50. Blos, M.F.; Quaddus, M.; Wee, H.; Watanabe, K. Supply chain risk management (SCRM): A case study on the automotive and electronic industries in Brazil. Supply Chain Manag. Int. J. 2009, 14, 247–252. [Google Scholar] [CrossRef]
  51. Perez-Franco, R.; Singh, M.; Sheffi, Y. Expressing a Firm’s Supply Chain Strategy: A Framework and a Method. Manuscr. Draft. Mass. Inst. Technol. 2010. Available online: https://citeseerx.ist.psu.edu/viewdoc/download?doi=10.1.1.399.3040&rep=rep1&type=pdf (accessed on 25 August 2022).
  52. Chowdhury, M.; Hossan, M.; Dewan, M.N.A.; Quaddus, M. Supply chain resilience to mitigate disruptions: A QFD approach. In Proceedings of the 16th Pacific Asia Conference on Information Systems, Ho Chi Minh City, Vietnam, 11–15 July 2012. [Google Scholar]
  53. Einarsson, S.; Rausand, M. An approach to vulnerability analysis of complex industrial systems. Risk Anal. 1998, 18, 535–546. [Google Scholar] [CrossRef]
  54. Christopher, M.; Peck, H. Building the resilient supply chain. Int. J. Logist. Manag. 2004, 15, 1–14. [Google Scholar] [CrossRef]
  55. Badea, A.; Prostean, G.; Goncalves, G.; Allaoui, H. Assessing risk factors in collaborative supply chain with the analytic hierarchy process (AHP). Procedia-Soc. Behav. Sci. 2014, 124, 114–123. [Google Scholar] [CrossRef]
  56. Chan, A.P.C.; Darko, A.; Olanipekun, A.O.; Ameyaw, E.E. Critical barriers to green building technologies adoption in developing countries: The case of Ghana. J. Clean. Prod. 2018, 172, 1067–1079. [Google Scholar] [CrossRef]
  57. Peck, H. Drivers of supply chain vulnerability: An integrated framework. Int. J. Phys. Distrib. Logist. Manag. 2005, 35, 210–232. [Google Scholar] [CrossRef]
  58. Meng, X. The effect of relationship management on project performance in construction. Int. J. Proj. Manag. 2012, 30, 188–198. [Google Scholar] [CrossRef]
  59. Ryciuk, U. Identification of factors related to trust formation in construction supply chains. Procedia Eng. 2017, 182, 627–634. [Google Scholar] [CrossRef]
  60. Luo, W.; Shi, Y.; Venkatesh, V. Exploring the factors of achieving supply chain excellence: A New Zealand perspective. Prod. Plan. Control. 2018, 29, 655–667. [Google Scholar] [CrossRef]
  61. Rasul, N.; Malik, M.S.A.; Bakhtawar, B.; Thaheem, M.J. Risk assessment of fast-track projects: A systems-based approach. Int. J. Constr. Manag. 2021, 21, 1099–1114. [Google Scholar] [CrossRef]
  62. Bertelsen, S. Complexity–Construction in a New Perspective; IGLC-11: Blacksburg, VA, USA, 2003; Available online: https://citeseerx.ist.psu.edu/viewdoc/download?doi=10.1.1.509.5436&rep=rep1&type=pdf (accessed on 25 August 2022).
  63. Forrester, J.W. System dynamics: The foundation under systems thinking. Sloan Sch. Management. Mass. Inst. Technol. 1999, 10, 1–3. Available online: http://static.clexchange.org/ftp/documents/system-dynamics/SD2011-01SDFoundationunderST.pdf (accessed on 28 August 2022).
  64. Sterman, J.D. System dynamics modeling: Tools for learning in a complex world. Calif. Manag. Rev. 2001, 43, 8–25. [Google Scholar] [CrossRef]
  65. Feng, Y. System dynamics modeling for supply chain information sharing. Phys. Procedia 2012, 25, 1463–1469. [Google Scholar] [CrossRef]
  66. Khan, K.I.A.; Flanagan, R.; Lu, S.-L. Managing information complexity using system dynamics on construction projects. Constr. Manag. Econ. 2016, 34, 192–204. [Google Scholar] [CrossRef]
  67. Lee, S.; Peña-Mora, F.; Park, M. Web-enabled system dynamics model for error and change management on concurrent design and construction projects. J. Comput. Civ. Eng. 2006, 20, 290–300. [Google Scholar] [CrossRef]
  68. Naveed, F.; Khan, K.I.A. Investigating the influence of information complexity on construction quality: A systems thinking approach. Eng. Constr. Archit. Manag. 2021, 29, 1427–1448. [Google Scholar] [CrossRef]
  69. Ghufran, M.; Khan, K.I.A.; Thaheem, M.J.; Nasir, A.R.; Ullah, F. Adoption of Sustainable Supply Chain Management for Performance Improvement in the Construction Industry: A System Dynamics Approach. Architecture 2021, 1, 161–182. [Google Scholar] [CrossRef]
  70. Amin, F.; Khan, K.I.A.; Ullah, F.; Alqurashi, M.; Alsulami, B.T. Key Adoption Factors for Collaborative Technologies and Barriers to Information Management in Construction Supply Chains: A System Dynamics Approach. Buildings 2022, 12, 766. [Google Scholar] [CrossRef]
  71. Hsieh, H.-F.; Shannon, S.E. Three approaches to qualitative content analysis. Qual. Health Res. 2005, 15, 1277–1288. [Google Scholar] [CrossRef] [PubMed]
  72. Ullah, F.; Ayub, B.; Siddiqui, S.Q.; Thaheem, M.J. A review of public-private partnership: Critical factors of concession period. J. Financial Manag. Prop. Constr. 2016, 21, 269–300. [Google Scholar] [CrossRef]
  73. Jahan, S.; Khan, K.I.A.; Thaheem, M.J.; Ullah, F.; Alqurashi, M.; Alsulami, B.T. Modeling Profitability-Influencing Risk Factors for Construction Projects: A System Dynamics Approach. Buildings 2022, 12, 701. [Google Scholar] [CrossRef]
  74. Ahmad, Z. BIM Driven Project Risk Management: A Causal Evolution. Master’s Thesis, National University of Science and Technology, Islamabad, Pakistan, 2017. [Google Scholar]
  75. Watkins, M.W. A Step-by-Step Guide to Exploratory Factor Analysis with SPSS; Routledge: London, UK, 2021. [Google Scholar]
  76. Wang, J.; Yu, B.; Tam, V.W.; Li, J.; Xu, X. Critical factors affecting willingness of design units towards construction waste minimization: An empirical study in Shenzhen, China. J. Clean. Prod. 2019, 221, 526–535. [Google Scholar] [CrossRef]
  77. Hossen, M.M.; Kang, S.; Kim, J. Construction schedule delay risk assessment by using combined AHP-RII methodology for an international NPP project. Nucl. Eng. Technol. 2015, 47, 362–379. [Google Scholar] [CrossRef]
  78. Muneeswaran, G.; Manoharan, P.; Awoyera, P.; Adesina, A. A statistical approach to assess the schedule delays and risks in Indian construction industry. Int. J. Constr. Manag. 2020, 20, 450–461. [Google Scholar] [CrossRef]
  79. Rooshdi, R.R.R.M.; Abd Majid, M.Z.; Sahamir, S.R.; Ismail, N.A.A. Relative importance index of sustainable design and construction activities criteria for green highway. Chem. Eng. Trans. 2018, 63, 151–156. [Google Scholar]
  80. Qudrat-Ullah, H.; Seong, B.S. How to do structural validity of a system dynamics type simulation model: The case of an energy policy model. Energy Policy 2010, 38, 2216–2224. [Google Scholar] [CrossRef]
Figure 1. Supply chain risks.
Buildings 12 01322 g001
Figure 2. Schematic diagram of research methodology.
Buildings 12 01322 g002
Figure 3. The causal loop diagram.
Buildings 12 01322 g003
Figure 4. Balancing loop B1 (health pandemic affecting employees).
Buildings 12 01322 g004
Figure 5. Balancing loop B2 (budget overruns due to unplanned expenses).
Buildings 12 01322 g005
Figure 6. Reinforcing loop R1 (poor information coordination and decision making).
Buildings 12 01322 g006
Figure 7. Reinforcing loop R2 (insufficient management oversight on supply chain members).
Buildings 12 01322 g007
Figure 8. Reinforcing loop R3 (visibility of errors/deficiencies to stakeholders).
Buildings 12 01322 g008
Figure 9. Reinforcing loop R4 (suppliers/operation facilities concentrated at same area).
Buildings 12 01322 g009
Figure 10. Reinforcing loop R5 (exposure to natural disasters).
Buildings 12 01322 g010
Figure 11. Reinforcing loop R6 (transportation disruption during operations).
Buildings 12 01322 g011
Figure 12. Reinforcing loop R7 (limited production and distribution capacity).
Buildings 12 01322 g012
Figure 13. System dynamics model.
Buildings 12 01322 g013
Figure 14. Simulation result of ‘people, products, and asset visibility’.
Buildings 12 01322 g014
Figure 15. Simulation result of ‘collaborative information exchange’.
Buildings 12 01322 g015
Figure 16. Simulation result of ‘process improvements’.
Buildings 12 01322 g016
Figure 17. Simulation result of ‘learning from experience’.
Buildings 12 01322 g017
Table 1. Correlation matrix.
RAT80/20RAT70/30RAT60/40RAT50/50RAT40/60RAT30/70RAT20/80
CorrelationRAT80/201.0000.9700.9250.8860.8550.8300.810
RAT70/300.9701.0000.9890.9720.9550.9400.928
RAT60/400.9250.9891.0000.9960.9880.9800.972
RAT50/500.8860.9720.9961.0000.9980.9940.990
RAT40/600.8550.9550.9880.9981.0000.9990.997
RAT30/700.8300.9400.9800.9940.9991.0000.999
RAT20/800.8100.9280.9720.9900.9970.9991.000
Table 2. Shortlisted risk factors affecting construction SCs with normalized and cumulative scores.
Sr#Risk Factors Affecting Construction SCsRespondent’s Normalized ScoreLiterature’s Normalized Score60/40Cumulative Score
0.6*RS + 0.4*LS
1Health pandemic affecting employees0.034720.038270.0362851430.036285143
2Budget overruns/unplanned expenses0.027780.047830.035915870.072201013
3Poor information coordination and decision making0.027780.047830.035915870.108116883
4Insufficient management oversight (on SC members)0.027780.047830.035915870.144032753
5Visibility of errors to stakeholders0.027780.047830.035915870.179948623
6Outsourcing to different suppliers0.027780.041450.0333648490.213313472
7Decentralization of suppliers/operation facilities0.027780.041450.0333648490.246678322
8Severe price fluctuations in the market0.034720.028700.0324586130.279136934
9Exposure to natural disasters0.027780.038270.0320893390.311226274
10Pressure from public opinion0.027780.038270.0320893390.343315613
11Poor utilities (electrical power, water, sewer) availability0.027780.038270.0320893390.375404952
12Products quality problems0.027780.038270.0320893390.407494291
13Transportation disruption during operations0.027780.038270.0320893390.439583631
14Limited production and distribution capacity0.027780.038270.0320893390.47167297
15Exposure to political disruptions0.027780.035080.0308138290.502486799
Table 3. Shortlisted resilience capabilities with normalized and cumulative scores.
Sr#Resilient CapabilitiesRespondent’s Normalized ScoreLiterature’s Normalized Score60/40Cumulative Score
0.6*RS + 0.4*LS
1People, products, and assets visibility (real-time data on location)0.022730.050640.0338922270.033892227
2Collaborative information exchange among stakeholders0.022730.050640.0338922270.067784454
3Business intelligence gatherings (modern trends and technology awareness)0.022730.050640.0338922270.101676682
4Alternative suppliers/sources to quickly reallocate orders0.022730.045310.0317600310.133436713
5Inventory management system (fast rerouting of requirements)0.022730.045310.0317600310.165196744
6Alternate distribution channels (modes of transportation)0.022730.045310.0317600310.196956775
7Product commonality (flexible design)0.022730.045310.0317600310.228716806
8Mode of communication (external, internal)0.022730.045310.0317600310.260476837
9Order postponement willingly by clients due to disruption0.022730.045310.0317600310.292236868
10Risk management/business continuity planning0.022730.045310.0317600310.323996899
11Alternative technology development0.022730.039980.0296278350.353624733
12Learning from experience0.022730.039980.0296278350.383252568
13Process improvements (to reduce lead-times)0.022730.039980.0296278350.412880403
14Monitoring early warning signals (near miss analysis)0.022730.031980.0264295410.439309944
15Customers demand forecasting0.022730.031980.0264295410.465739484
16Contingency planning (drills, training)0.022730.031980.0264295410.492169025
Table 4. RII score and polarity of shortlisted variables.
RisksResilient CapabilitiesPolarityWeighted RII Score
Health pandemicPeople, products, and assets visibility (real-time data on location)0.75
Alternative suppliers/sources to quickly reallocate order0.79
Inventory management system (Fast rerouting of requirements+0.76
Process improvements (to reduce lead times)0.76
Monitoring early warning signals (deviations near misses’ analysis)0.75
Customers demand forecasting0.75
Budget overruns/unplanned expensesProcess improvement0.75
Alternative technology development+0.75
Poor information coordination and decision makingPeople, products, and assets visibility (real-time data on location)0.77
Collaborative information exchange (among stakeholders)0.81
Business intelligence gatherings (modern trends and technology awareness).0.76
Mode of communication (external and internal)0.75
Learning from experience0.75
Insufficient management oversight of SC membersPeople, products, and assets visibility (real-time data on location)0.75
Collaborative information exchange (among stakeholders)0.77
Alternate distribution channels (modes of transportation0.76
Learning from experience0.76
Visibility of errors/deficiencies to stakeholdersCollaborative information exchange (among stakeholders)0.78
Decentralization of suppliers/operation facilitiesAlternative suppliers/sources to quickly reallocate order0.76
Inventory management system (Fast rerouting of requirements0.76
Exposure to natural disastersPeople, products, and assets visibility (real-time data on location)0.77
Collaborative information exchange (among stakeholders)0.77
Alternative technology development0.76
Transportation disruption during operationsAsset visibility0.75
Alternate distribution channels (modes of transportation0.78
Limited production and distribution capacityBusiness intelligence gatherings (Awareness of modern trends & technology).0.77
Process improvements (to reduce lead times)0.76
Monitoring early warning signals (deviations near misses’ analysis)0.81
Customers demand forecasting0.76
Publisher’s Note: MDPI stays neutral with regard to jurisdictional claims in published maps and institutional affiliations.

