Article

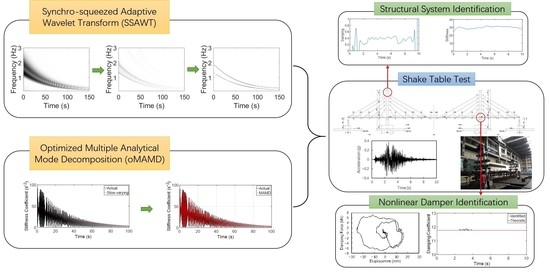
Synchro-Squeezed Adaptive Wavelet Transform-Based Optimized Multiple Analytical Mode Decomposition: Parameter Identification of Cable-Stayed Bridge under Earthquake Input

1
Department of Bridge Engineering, Tongji University, 1239 Siping Road, Shanghai 200092, China
2
Shanghai Typhoon Institute of China Meteorological Administration, 166 Puxi Road, Shanghai 200030, China
*
Author to whom correspondence should be addressed.
Buildings 2022, 12(8), 1285; https://doi.org/10.3390/buildings12081285
Submission received: 4 August 2022 / Revised: 17 August 2022 / Accepted: 18 August 2022 / Published: 22 August 2022
(This article belongs to the Special Issue Structural Health Monitoring of Buildings, Bridges and Dams)

Abstract

:
Deriving critical parametric information from recorded signals for system identification is critical in structural health monitoring and damage detection, while the time-varying nature of most signals often requires significant processing efforts due to structural nonlinearity. In this study, synchro-squeezed adaptive wavelet transform-based optimized multiple analytical mode decomposition (SSAWT-oMAMD) is proposed. The SSAWT algorithm acts as the preprocessing algorithm for clear signal component separation, high temporal and frequency resolution, and accurate time–frequency representation. Optimized MAMD is then utilized for signal denoising, decomposition, and identification, with the help of AWT for bisecting frequency determination. The SSAWT-oMAMD is first verified by the analytical model of two Duffing systems, where clear separation of the two signals is presented and identification of complex time-varying stiffness is achieved with errors less than 2.9%. The algorithm is then applied to system identification of a cable-stayed bridge model subjected to earthquake loading. Based on both numerical and experimental results, the proposed method is effective in identifying the structural state and viscous damping coefficient.

Graphical Abstract

1. Introduction

Signal processing focuses on analyzing, modifying, and synthesizing signals, and it typically includes two categories in terms of structural health monitoring: representation and decomposition. For signal representation, it generally gives a different viewing angle of a signal other than time domain. To be specific, the methods related to the time–frequency representation of time-varying signals include, but are not limited to, Wigner–Ville distribution [1], short-time Fourier transform [2], and wavelet transform [3]. The Wigner–Ville distribution is better for energy concentration, while it may fail to capture instantaneous characteristics of the signal. Short-time Fourier transform is based on Fourier transform, and it can provide time-frequency representation of time-varying signal with a fixed short-time window length. The window length, however, prevents the short-time Fourier transform from simultaneously obtaining optimal temporal and frequency resolution, due to Heisenberg’s uncertainty principle. Wavelet transform introduces a mother wavelet and scaling factor, which yields varying time-frequency resolution that changes with frequency. Although the resolution variation is unchanged over time, high time resolution in the high frequency range and high frequency resolution in the low frequency range meet the requirements for most practical applications. To further enhance the temporal and frequency resolution of time–frequency representation obtained using conventional wavelet transform, a synchro-squeezed wavelet transform is proposed [4]. It provides more accurate and sharper time–frequency representation of the signal. An adaptation algorithm [5] is proposed to formulate synchro-squeezed adaptive wavelet transform (SSAWT) [6], and temporal and frequency resolution is optimized in any part of the time–frequency plane, based on signal characteristics. Therefore, SSAWT provides the optimal time–frequency representation of the signal, while preserving the advantages from both synchro-squeezing technique and wavelet transform. For signal decomposition, signal with mixed modes are separated for individual analysis. Some typical decomposition methods include filter [7], empirical mode decomposition [8], Hilbert vibration decomposition [9], and analytical mode decomposition (AMD) [10]. Empirical mode decomposition is a popular method for the decomposition of signals with time-varying characteristics, since it does not require a designated cutoff frequency. Despite its wide range of applications [11,12,13,14,15,16], mode mix is inevitable if the adjacent components are of close frequency values. Hilbert vibration decomposition is utilized for nonlinear system identification [17,18,19], but it is difficult for such method to extract low amplitude harmonics from noisy conditions. AMD is an adaptive analytical filter, and its most significant advantage belongs to the capability of time-varying signal decomposition with high accuracy [20,21,22]. Frequency identification procedures based on higher-order spectrum theory are proposed; these can reduce the influence of the noise satisfied with the nonstationary random process [23]. Based on frequency domain decomposition, an innovative method is proposed to identify the closely spaced modes, by calculating the angles between singular vectors at the peak point and the ones around the peak point [24]. An innovative method is proposed based on the virtual frequency response function and Eigensystem realization algorithm (VFRF-ERA), which can reduce the influence of nonideal excitation and identify structural modes [25].
In the past decades, many cable-stayed bridges have been constructed worldwide, serving as key nodes in transportation networks. However, many of these bridges are located in earthquake-prone zones, and it is therefore necessary to study the nonlinear structural behavior under earthquake input. Shake table tests are carried out in limited research works: tests for structural response analysis under non-uniform excitation [26]; tests for comparison of various isolation devices used in cable-stayed bridge [27]; tests for understanding wave propagation effects on structure–soil–pile interaction [28]; and tests for studying the effect of viscous damper on seismic performance [29]. In addition, the experimental study of a new lateral isolation system consisting of elastoplastic cables and a parallel fluid viscous damper for long-span cable-stayed bridges against near-fault earthquakes was conducted and verified [30]. Experimental and numerical models were tested and analyzed for seismic responses of long-span cable-stayed bridge [31]. These studies are only fundamental investigations of the structural responses of cable-stayed bridges under seismic load. However, system identification has not been carried out under earthquake loading, and the damage cannot be indicated by a simple frequency shift from Fourier transformation. Considering the scarcity of shake table test, the system identification of a cable-stayed bridge under earthquake load is even rarer. To the best of the authors’ knowledge, system identification of cable-stayed bridges mainly focuses on modal identification from ambient vibrations [32,33,34,35,36,37,38]. Filtered iterative reference-driven S-transform (FIrST) time-varying parameter identification is proposed for obtaining high-resolution time-varying structural characteristics from multisensory bridge structures [39]. Although ambient vibration can generate enough amplitude for bridge deck movement, nonlinear behaviors of bridge components (e.g., viscous damper, structural damage) are difficult to capture. Therefore, it is necessary to perform parameter identification of cable-stayed bridge components during an earthquake with shake table test, in order to understand the seismic behavior or even damage progression. The seismic responses of Yokohama Bay Bridge under the 2011 Great East Japan earthquake were investigated according to on-site observation, monitoring data, and system identification. However, no parameter identification is performed, while only data interpretation and modal analysis were conducted for intuitive conclusions [40]. The linear and nonlinear displacement identification is performed by using the Kanade–Lucas–Tomasi algorithm from video data, but no structural parameters were further identified from the extracted data [41]. With the optimization approach [42] and adaptation algorithm [5], the optimized multiple AMD (oMAMD) was further proposed, and preliminary system identification of bridge structures was carried out for damping and stiffness variation detection [43].
In this study, synchro-squeezed adaptive wavelet transform based optimized multiple analytical mode decomposition (SSAWT-oMAMD) is proposed. The SSAWT utilizes the adaptation algorithm for optimal time–frequency representation and synchro-squeezing technique for the enhancement of temporal and frequency resolution. With the help of SSAWT, optimized MAMD is then utilized for signal denoising, decomposition, and identification. The objects for identification in this study include the analytical example of two closely spaced Duffing systems, a nonlinear viscous damping system of numerical bridge model, and structural systems of a one-twentieth-scale cable-stayed bridge experimental model. The analytical example of Duffing systems is to verify the effectiveness of the proposed SSAWT-oMAMD algorithm in identification accuracy for systems with fast-varying components. The numerical and experimental models of a cable-stayed bridge are to demonstrate the capability of the proposed algorithm in practical engineering applications for identification of nonlinear behaviors of structural components.

2. SSAWT-oMAMD Algorithm

2.1. Synchro-Squeezed Adaptive Wavelet Transform

SSAWT combines the adaptation algorithm with the synchro-squeezing method, which aims to provide more precise time–frequency representation of a time-varying signal. The adaptation algorithm automatically adjusts the key features of mother wavelet at each given time instant. Thus, the algorithm yields the optimal time–frequency representation of a given time-varying signal over the entire 2D plane for wavelet transform. The synchro-squeezing method is a special case of reallocation, which sharpens the ridgelines obtained from wavelet transform results. SSAWT has been applied to feature extractions of acoustic emission signals [6], which are typically difficult to achieve with conventional signal processing methods.
First, at a given time instant τ k over the time history of a signal, short-time wavelet transform is performed for the k th short-time segment. The short-time segment ( n = ( T T τ n ) / Δ t in total) retains the time duration of [ τ k ,   τ k + T τ k ] . The optimal center frequency ( ω c ) and window length ( T τ k ) are determined by the adaptation algorithm. This formulates the short-time continuous wavelet transform (STCWT) for each consecutive time instant:
STCWT { x ( t ) } ( a , b ;   τ k , T τ k ) = 1 a x ( t ) w τ k , T τ k ( t ) ψ a , b ( t ) ¯ d t
To eliminate the distorting effects from the influence cone of wavelet transform and discontinuity of segment stitching, adjacent edges of the transformed segments are overlapped, summed, and averaged. The adaptive wavelet transform with wavelet can therefore be expressed as:
AWT ( ω , b ) = k = 0 n 1 1 p k STCWT { x ( t ) } ( a , b ; τ k , T τ k ) = k = 0 n q k p k 1 2 π ω c ( τ k ) / ω τ k τ k + T τ k x ( t ) e ( t b ) 2 ω 2 2 ω c 2 ( τ k ) e i ω ( t b ) d t
where ω c ( τ k ) is the center frequency at τ k , a ( τ k ) is the scaling factor at τ k , T τ k is the window length, p k is the parameter for averaging that counts the number of windowed segments spanning over τ k , and q k is the normalization factor of each short-time segment.
Then, synchro-squeezing method is applied to the adaptive wavelet transform results. The adaptive wavelet transform is synchro-squeezed and transferred from the time-scale plane to a time–frequency plane by:
SSAWT { x ( t ) } ( ω , b ) = A ( b ) AWT { x ( t ) } ( a , b ) a 3 / 2 δ ( ω x ( a , b ) ω ) d a
where ω x ( a , b ) = i 1 W x ( a , b ) [ W x ( a , b ) ] b .
In this way, SSAWT minimizes energy dispersion and adaptively optimizes the key features of the mother wavelet at each instant, which gives a more accurate time–frequency representation.

2.2. Optimized Multiple Analytical Mode Decomposition

Optimized AMD is proposed for mode decomposition of both time-invariant and time-varying signals, and is effective in denoising and filtering. Here, AMD ω b ( t ) [ · ] is denoted as the decomposed low frequency component of a signal s ( t ) with respect to the time-varying bisecting frequency of ω b ( t ) . In the time domain, such optimized AMD algorithm is expressed in phase domain as:
s ( θ ) = { 1 2 AMD ω b ( t ) [ s ( θ ) ] + 1 2 AMD ω b ( t ) [ AMD ω b ( t ) [ s ( θ ) ] ] 0 < ω b ( t ) < 1 4 ω s ( t ) s ( t ) + 1 2 AMD ω b ( t ) [ s ( θ ) ] 1 2 AMD [ AMD ω b ( t ) [ s ( θ ) ] ] 1 4 ω s ( t ) < ω b ( t ) < 1 2 ω s ( t )
The optimized MAMD integrates the optimized AMD with MAMD for better accuracy of parameter identification of nonlinear systems with fast-varying components. The optimized MAMD algorithm starts from the equation of motion of a time-varying nonlinear system:
x ¨ ( t ) + 2 h ( t ) x ˙ ( t ) + ω 2 ( t ) x ( t ) = p ( t )
where 2 h ( t ) = 2 h s ( t ) + 2 h f ( t ) and ω 2 ( t ) = ω s 2 ( t ) + ω f 2 ( t ) , and the subscripts s and f denote the slow- and fast-varying components of the damping and stiffness coefficients. Here, fast-varying components of damping and stiffness coefficients, if they exist, are at higher frequencies than those of the x ˙ ( t ) and x ( t ) .
Optimized AMD is first used to denoise the original signal. Then, it is applied for a second time to decompose the stiffness and damping coefficients, in order to obtain the modified slow-varying components:
ω s 2 = AMD min [ ω x 1 ( t ) , ω x 2 ( t ) ] { ω 0 x 2 ( t ) }
2 h s = AMD min [ ω x ˙ 1 ( t ) , ω x ˙ 2 ( t ) ] { 2 h 0 x ( t ) }
where the bisecting frequencies, ω x 1 ( t ) , ω x 2 ( t ) , ω x ˙ 1 ( t ) , and ω x ˙ 2 ( t ) , are determined by SSAWTs, and ω 0 x 2 ( t ) and 2 h 0 x ( t ) represent the initial stiffness and damping coefficients that mixed with both fast- and slow-varying components. The actual slow-varying components are then determined as ω s 2 = ω s 2 + ω 0 p 2 and 2 h s = 2 h s + 2 h 0 p .
Typically, the dominant frequency band of the fast-varying components is known for either the stiffness or damping coefficient. By introducing the optimized AMD for the third time, the fast-varying component with lower frequency is decomposed first, and the other is obtained afterwards:
2 h f = AMD ω b ( t ) { 2 h ˜ f }
ω f 2 = AMD ω b ( t ) { ω ˜ f 2 }
Here, 2 h ˜ f and ω ˜ f 2 are the fast-varying coefficients of damping and stiffness coefficients with distorting terms, and the bisecting frequency ω b ( t ) is also acquired from SSAWT.
Finally, the actual damping and stiffness coefficient are obtained by:
2 h = 2 h s + 2 h f
ω 2 = ω s 2 + ω f 2
The SSAWT-oMAMD algorithm is thus summarized in the flowchart given in Figure 1.

3. Analytical Model

3.1. Duffing System

To demonstrate the effectiveness of the proposed SSAWT-oMAMD algorithm, two closely spaced Duffing systems (Figure 1) are mixed in a single time history function. Both systems are with the initial displacement of 100 and can be mathematically expressed as:
System   1 :   x ¨ + 0.05 x ˙ + x + 0.01 x 3 = 0  
System   2 :   x ¨ + 0.05 x ˙ + 3 x + 0.02 x 3 = 0
The frequency variations of the two Duffing systems are given in Figure 2 in the blue (System 1) and red (System 2) curves. Since the two systems are subjected to free vibration, the instantaneous frequency of each system starts at a higher value and gradually decreases to zero. Along the general trend of frequency decrease, fast-varying fluctuation is present, indicating the existence of a higher stiffness component in both systems. The two systems retain the maximum frequency difference of 0.5 Hz at the initial state, while it is reduced to less than 0.2 Hz at the end, making it challenging for signal processing methods to distinguish the two.

3.2. SSAWT Representation

Before applying SSAWT to the time function, synchro-squeezed wavelet transform is first utilized for comparison, in order to demonstrate the necessity of using SSAWT. Since conventional wavelet transform suffers from energy dispersion (Figure 3), it has thicker curves in the time–frequency representation than the synchro-squeezed wavelet transform with enhanced sharp curves. Therefore, synchro-squeezed wavelet transform results are further compared in Figure 4. The synchro-squeezed Morlet wavelet transform results are given with different center frequencies. By varying the center frequency, a certain portion of the time–frequency plane retains the optimal representation of the system response. However, none of the four transforms can guarantee the clear time and frequency separation of the two systems over the entire time span. The synchro-squeezing technique is able to provide enhancement to the conventional wavelet transform results, but also possesses the basic properties and drawbacks of wavelet transform.
Therefore, SSAWT is performed for the time history function with different mother wavelets, as shown in Figure 5. In general, the adaptation algorithm is successful in providing the optimal time–frequency representation of time history function of the two Duffing systems, regardless of mother wavelet types. However, differences still exist among the selection of mother wavelets. Bump wavelet-based SSAWT is the thickest curve of frequency variation among the transform results, due to its feature of wider variance in time and narrower variance in frequency. If frequency components of the two systems come even closer, bump wavelet-based SSAWT may be ineffective in the separation of the components. On the other hand, SSAWT results of the lognormal wavelet and Morelet wavelet are equivalent, while that of Morlet retains slightly smoother curves with less obvious bulges. Considering the ease of center frequency selection and variation, the Morlet wavelet is thus more suitable for the adaptation algorithm.

3.3. Optimized MAMD Identification

Based on SSAWT results, time-varying bisecting frequency is determined (Figure 2), and optimized AMD is performed to decompose the two Duffing systems from time history function. Without loss of generality, the decomposed Duffing system 1 of Equation (1) is compared with the actual time function of the original system response, as shown in Figure 6. To quantify the difference, the accuracy index (IA) is defined for measuring x d ( t ) from x ( t ) :
IA = 0 T [ x d ( t ) x ( t ) ] 2 d t 0 T [ x ( t ) ] 2 d t
where x d ( t ) is the decomposed component obtained by the optimized AMD, and x ( t ) is the actual signal.
A smaller IA value indicates the better reconstruction and decomposition accuracy. In this example, the IA values of both Duffing systems are 0.055, which represents good agreement between the decomposed and actual system responses in the time domain.
For Duffing system 1, the damping coefficient is constant with no fast-varying component, while a fast-varying component exists for the stiffness coefficient. As shown in Figure 7a, the wavelet transform of x ( t ) agrees with the instantaneous frequency obtained from Hilbert spectral analysis. However, the system retains both slow- and fast-varying components of stiffness coefficient, while both methods are unable to pinpoint the fast-varying component of stiffness coefficient as indicated in the figure. To obtain the optimal separation of x ( t ) and ω f 2 ( t ) , SSAWT is again performed and presented in Figure 7b. In this way, the bisecting frequency for slow- and fast-varying component decomposition in optimized MAMD can be determined.
Figure 8 compares the actual stiffness coefficient and instantaneous stiffness coefficient extracted directly from Hilbert spectral analysis. The difference between the two is significant, although Hilbert spectral analysis is able to catch the fast-varying fluctuations to certain extent. Therefore, optimized MAMD is performed for higher identification accuracy. As shown in Figure 9, optimized AMD is first performed to obtain the slow-varying component of the stiffness coefficient (Figure 9a), and optimized AMD is conducted again for the acquirement of fast-varying component. By combining the slow- and fast-varying components, the final identification of the stiffness coefficient from Duffing system 1 is given in Figure 9b. IA is also calculated to evaluate the effectiveness of identification, which yields a small value of 0.29. This shows that SSAWT-oMAMD can be applied for the parameter identification of analytical models with fast-varying system parameters with good accuracy.

4. Shake Table Test

4.1. Bridge Model

As shown in Figure 10, the prototype bridge is a typical cable-stayed bridge with span arrangement of 110 m + 260 m + 110 m, and enlarged design details are given in Appendix A (Figure A1, Figure A2). The concrete tower is 108 m tall and “diamond” in shape. A concrete box girder is used for the entire span length, and the piers of the side span are also thin-walled hollow-section reinforced concrete. For each bridge tower, there are two viscous dampers deployed in between the bottom surface of the bridge girder and the top surface of the tie beam of the bridge tower in the longitudinal direction. This is to mitigate the seismic responses of the bridge, which makes four dampers in total. Each viscous damper retains the damping coefficient ( C ) of 5000 kN · ( s / m ) 0.3 , and the corresponding velocity exponent ( α ) is thus 0.3.
The bridge model is scaled to 1/20 of the prototype (Figure 11, with enlarged design details shown in Appendix A, Figure A2 and Figure A3), and it is tested at one of the world’s largest multifunctional four-table facility at International Joint Research Laboratory of Earthquake Engineering (ILEE) of Tongji University. The aim is to investigate the nonlinear behavior of the complex bridge structure under earthquake load. The detailed similitudes are given in Table 1 for various structures, materials, and loading properties. The experimental bridge model is scaled to 25 m in total span length (5.5 m + 13 m + 5.5 m) and 5.38 m in tower height. Each bridge tower or pier is placed on one shake table for earthquake input. In terms of material, it is ideal to use the same material for the bridge model, while this needs excessive amount of counterweight to balance other design requirement. Therefore, micro-concrete is used instead of the original concrete material, and such type of concrete retains the same construction procedure, vibration technique, and curing process as the original concrete. By adjusting the mix ratio, the elastic modulus can be lowered to 0.3 of the original concrete, which in turn decreases the demand on additional mass to the same ratio of 0.3. In addition, the damping coefficient of the experimental bridge model can be determined as 11.755 kN / ( m / s ) 0.3 from Table 1, and load cells and displacement sensors are deployed to the damper to record seismic behavior under earthquake load.
The earthquake input of the shake table test is selected from Pacific Earthquake Engineering Research Center (PEER) strong ground motion database, and a near-fault earthquake that occurred on 28 June 1992 at Landers, California, is selected. The record LCN266 is 2.19 km from the fault, with the peak ground acceleration (PGA) of 0.72 g and total time duration of 48.12 s. The incremental loading protocol is given in Table 2, where PGA of the earthquake record is scaled from 0.1 g to 0.4 g with a step size of 0.1 g. The scaled earthquake input (PGA = 0.4 g, duration ≈ 10 s) and its corresponding response spectrum are given in Figure 12. The earthquake acts in the longitudinal direction of the bridge model, and all four shake tables are subjected to uniform input.

4.2. Parameter Identification

4.2.1. Numerical Simulation

Finite element models of the prototype bridge and test specimen are created prior to actual shake table experiment for comparison and verification. As given in Figure 13, finite element analysis is carried out by using OpenSees for simulating the responses of structural and geotechnical systems subjected to earthquake loadings. Fiber-based force beam–column elements are used for the reinforced concrete components of the bridges, which will provide nonlinear behavior for any potential structural damage. The fiber-based element consists of two types of material used in actual bridges: concrete and steel. Concrete is fulfilled by Concrete01 material and steel is simulated with Steel01 material, which considers the balance of computational efficiency and simulation accuracy. Parameters of both types of material are determined from sample tests. Table 3 compares the first ten natural vibration periods of the finite element models of the prototype and specimen. Differences between the periods scaled from the prototype bridge and those of the test specimen are generally below 5%, except for the ninth mode. This indicates that the test specimen is in good agreement with the prototype bridge, and that the scaling approach is reasonable.
In the finite element model of the test specimen, viscous damping is simulated by an exponential Maxwell model as given in Figure 14. More detailed design of the viscous damper is given in Appendix A (Figure A4). The nonlinear force–deformation relationship is given by:
f = k x k = c x ˙ c α
where k is the spring constant, c is the damping coefficient, α is the damping exponent, x k is the spring displacement, and x ˙ c is the damper velocity.
The total travel distance of spring and damping is:
x = x k + x c
Theoretically, parameter identification of the damping coefficient with optimized MAMD can be obtained through the following procedure:
First, optimized AMD is performed for denoising for the known time histories of f and x . Then, the duratives of spring and damper displacements (i.e., spring and damper velocities) are obtained as follows, since k and c are nonzero values:
x ˙ k = f ˙ / k
x ˙ c = ( f / c ) 1 / α
In this way, a generalized equation of motion can be formulated as:
x ˙ = x ˙ k + x ˙ c = f ˙ / k + ( f / c ) 1 / α
By applying the Hilbert transform, a new function can be obtained:
H [ x ˙ ] = H [ x ˙ k ] + H [ x ˙ c ] = H [ f ˙ ] / k + H [ f 1 / α ] / c 1 / α
It is worth noting that any fast-varying components need to be identified by the optimized MAMD in this step for better accuracy.
Finally, the damping coefficient can be acquired from Equations (19) and (20):
c = { ( f 1 / α ) · H [ f ˙ ] f ˙ · H [ f 1 / α ] } / { x ˙ · H [ f ˙ ] f ˙ · H [ x ˙ ] } α
By performing the parameter identification based on the SSAWT-oMAMD algorithm, the SSAWT results of the time histories are obtained as shown in Figure 15. Compared with conventional wavelet transform, SSAWT gives sharper and more clear separation of identified frequency components. Based on the time–frequency representation of the known time histories of f and x , slow- and fast-varying components can be decomposed by optimized AMD, and the final identified damping coefficient is given in Figure 16. The straight red line is the theoretical value of the damping coefficient, which is 11.755 kN / ( m / s ) 0.3 . The prominent duration of the input earthquake is mainly in the range of 2 s to 4 s. The nonlinear behavior of the viscous damper is excited during this period, and parameters can thus be identified. The maximum difference between the identified damping coefficient and the theoretical value is off by 0.8%, indicating the proposed SSAWT-oMAMD algorithm is effective in identifying the parameters from complex nonlinear structural systems.

4.2.2. Test Results

In terms of system identification of test specimen, SSAWT-oMAMD is applied to two cases: (1) damage identification of bridge tower, and (2) parameter identification of damper.
For damage identification of the bridge tower, the time history of acceleration at the top of the bridge tower and its SSAWT under the 0.4 g (PGA) earthquake input are given in Figure 17. The acceleration response is directly correlated with the earthquake input due to the large stiffness of the bridge tower, and the prominent peaks are generally between 2 s and 4 s. Based on the time–frequency representation of SSAWT, the first four vibration modes are excited by the seismic load, which corresponds to the numerical results (0.97 Hz, 1.82 Hz, 2.71 Hz, and 3.83 Hz) of the inverse of natural periods given in Table 3. However, a difference still exists between the test and simulation results, since the frequencies of test model are generated and influenced by the inherent frequency characteristics of the earthquake.
Based on the SSAWT of acceleration time history, bisecting frequencies between the structural modes can be determined. The optimized AMD method is thus applied to decompose each mode. As given in Figure 18, the dominant mode is separated and denoised from the others, and a clean single mode of structural vibration is thus obtained. Since the bridge is equipped with multisensory instrumentation, it is also suitable for more advanced methods to be applied for structural identification. Therefore, together with data acquired from additional accelerometer at tower mid-height as the reference, FirST [40] is thus applied for frequency extraction from original readings of the acceleration time history given in Figure 17a. The FIrST identification is shown in Figure 18c, which is of equivalent results to SSAWT with shorter but more concentrated frequency variation of the dominant vibration mode. Both methods can serve as a robust preprocessing tool for optimized MAMD.
Based on the extracted dominant mode of structural vibration, optimized MAMD is used to identify dynamic properties of the bridge model, by considering the bridge structure has normalized mass and stiffness in a decoupled multi-degree-of-freedom system, based on the assumption of mode orthogonality. In this way, the dynamic equation of motion can be defined, and damping and stiffness coefficients of the bridge structure can be identified with earthquake input and structural responses known for each natural mode:
x ¨ ( t ) + 2 h p x ˙ ( t ) + ω p 2 x ( t ) = x ¨ g ( t )
Following the procedure of SSAWT-oMAMD, the identified stiffness and damping of the test model under 0.4 g earthquake input are shown in Figure 19. The time of interest is from 3 s to 6 s, where the strong motions of the earthquake input occur. As shown in the figure, damping and stiffness of the dominant mode stay relatively constant, which is in accordance with the SSAWT result and observations from the experiment. This confirms that the bridge specimen has experienced little damage throughout the entire process of the experiment.
For parameter identification of viscous damping, a similar procedure is performed for the bridge specimen with the finite element model. The seismic behavior of the damper is shown in Figure 20, and its nonreality is observed with a full force-displacement cycle, where the maximum design damping force of 6 kN is reached.
As shown in Figure 21, the damping coefficient can be identified with a maximum deviation of 2.7% from theoretic value. However, due to difference between numerical simulation and actual test performance (including manufacturing error and randomness of material), the identified damping coefficient of the test model has a larger error and a shorter identification period for detection.

5. Conclusions

In this study, SSAWT-oMAMD is proposed by using SSAWT as the preprocessing algorithm for system identification with optimized MAMD. The adaptation algorithm of SSAWT is effective in separation of the signal components, and the synchro-squeezing technique lowers energy dispersion and sharpens the ridgelines of the time–frequency representation. SSAWT results with different mother wavelets are compared, and the Morlet wavelet is selected as a suitable candidate for clear time–frequency representation. The SSAWT is thus an effective preprocessing tool for the determination of bisecting frequency. Optimized MAMD utilizes the optimized AMD method with multiple steps, which integrate denoising, decomposition, and identification.
The SSAWT-oMAMD is first verified by the analytical model of two Duffing systems, where clear separation of the two signals is presented and accurate identification of complex time-varying stiffness is achieved with errors less than 2.9%. The SSAWT-oMAMD algorithm is then applied to system identification of a cable-stayed bridge model subjected to earthquake loading. Based on both numerical and experimental results, the proposed method is effective in identifying the structural conditions and the viscous damping coefficient.

Author Contributions

Conceptualization, H.Q.; methodology, H.Q.; software, A.C.; validation, T.L.; formal analysis, H.Q. and A.C.; investigation, H.Q.; resources, Z.G.; data curation, Z.G.; writing—original draft preparation, H.Q.; writing—review and editing, Z.G.; visualization, A.C.; supervision, Z.G.; funding acquisition, H.Q. and Z.G. All authors have read and agreed to the published version of the manuscript.

Funding

This research was funded by National Key Research and Development Program of China, grant number 2021YFF0502200; National Natural Science Foundation of China, grant number 52008316; Science and Technology Commission of Shanghai Municipality, grant numbers 20ZR1461400, 20PJ1413900.

Institutional Review Board Statement

Not applicable.

Informed Consent Statement

Not applicable.

Data Availability Statement

The data presented in this study are available on request from the corresponding author.

Conflicts of Interest

The authors declare no conflict of interest.

Appendix A. Bridge Design

Figure A1. Tower design of bridge prototype (unit: mm).
Buildings 12 01285 g0a1
Figure A2. Elevation view (unit: mm): (a) bridge prototype; (b) bridge model.
Buildings 12 01285 g0a2
Figure A3. Tower design of bridge model (unit: mm).
Buildings 12 01285 g0a3
Figure A4. Viscous damper (unit: mm).
Buildings 12 01285 g0a4

References

  1. Wigner, E.P. On the Quantum Correction for Thermodynamic Equilibrium. In Part I: Physical Chemistry. Part II: Solid State Physics; Springer: Berlin/Heidelberg, Germany, 1997; pp. 110–120. [Google Scholar]
  2. Jacobsen, E.; Lyons, R. The sliding DFT. IEEE Signal Process. Mag. 2003, 20, 74–80. [Google Scholar]
  3. Daubechies, I. Ten Lectures on Wavelets; Society for Industrial and Applied Mathematics: Philadelphia, PA, USA, 1992. [Google Scholar]
  4. Daubechies, I.; Lu, J.; Wu, H.-T. Synchrosqueezed wavelet transforms: An empirical mode decomposition-like tool. Appl. Comput. Harmon. Anal. 2011, 30, 243–261. [Google Scholar] [CrossRef] [Green Version]
  5. Qu, H.; Li, T.; Chen, G. Adaptive wavelet transform: Definition, parameter optimization algorithms, and application for concrete delamination detection from impact echo responses. Struct. Health Monit. 2019, 18, 1022–1039. [Google Scholar] [CrossRef]
  6. Qu, H.; Li, T.; Chen, G. Synchro-squeezed adaptive wavelet transform with optimum parameters for arbitrary time series. Mech. Syst. Signal Process. 2019, 114, 366–377. [Google Scholar] [CrossRef]
  7. Jackson, L.B. Digital Filters and Signal Processing: With MATLAB® Exercises; Springer Science & Business Media: New York, NY, USA, 2013. [Google Scholar]
  8. Huang, N.E.; Shen, Z.; Long, S.R.; Wu, M.C.; Shih, H.H.; Zheng, Q.; Yen, N.-C.; Tung, C.C.; Liu, H.H. The empirical mode decomposition and the Hilbert spectrum for nonlinear and non-stationary time series analysis. Proc. R. Soc. Lond. Ser. A Math. Phys. Eng. Sci. 1998, 454, 903–995. [Google Scholar] [CrossRef]
  9. Feldman, M. Time-varying vibration decomposition and analysis based on the Hilbert transform. J. Sound Vib. 2006, 295, 518–530. [Google Scholar] [CrossRef]
  10. Wang, Z.C.; Chen, G.D. Analytical mode decomposition of time series with decaying amplitudes and overlapping instantaneous frequencies. Smart Mater. Struct. 2013, 22, 095003. [Google Scholar] [CrossRef]
  11. Huang, N.E.; Attoh-Okine, N.O. The Hilbert-Huang Transform in Engineering; CRC Press: Boca Raton, FL, USA, 2005. [Google Scholar]
  12. Huang, N.E. Hilbert-Huang Transform and Its Applications; World Scientific: Singapore, 2014. [Google Scholar]
  13. Kunwar, A.; Jha, R.; Whelan, M.; Janoyan, K. Damage detection in an experimental bridge model using Hilbert-Huang transform of transient vibrations. Struct. Control Health Monit. 2011, 20, 1–15. [Google Scholar] [CrossRef]
  14. Chen, B.; Zhao, S.-L.; Li, P.-Y. Application of Hilbert-Huang Transform in Structural Health Monitoring: A State-of-the-Art Review. Math. Probl. Eng. 2014, 2014, 317954. [Google Scholar] [CrossRef]
  15. Mao, J.-X.; Wang, H.; Feng, D.-M.; Tao, T.-Y.; Zheng, W.-Z. Investigation of dynamic properties of long-span cable-stayed bridges based on one-year monitoring data under normal operating condition. Struct. Control Health Monit. 2018, 25, e2146. [Google Scholar] [CrossRef]
  16. Li, B.; Cai, Z.; Duan, Z. Generating spectrum-matched bidirectional time histories using Hilbert-Huang Transform. J. Build. Eng. 2022, 58, 105033. [Google Scholar] [CrossRef]
  17. Feldman, M. Nonparametric identification of asymmetric nonlinear vibration systems with the Hilbert transform. J. Sound Vib. 2012, 331, 3386–3396. [Google Scholar] [CrossRef]
  18. Feldman, M. Hilbert transform methods for nonparametric identification of nonlinear time varying vibration systems. Mech. Syst. Signal Process. 2014, 47, 66–77. [Google Scholar] [CrossRef]
  19. Karim, A.Z.; Bashar, S.S.; Miah, S.; Al Mahmud, A.; Al Amin, M.A. Identification of seizure from single channel EEG using Support Vector Machine & Hilbert Vibration Decomposition. In Proceedings of the 2020 IEEE Symposium on Industrial Electronics & Applications (ISIEA), Shah Alam, Malaysia, 17–18 July 2020; pp. 1–6. [Google Scholar]
  20. Chen, G.; Wang, Z. A signal decomposition theorem with Hilbert transform and its application to narrowband time series with closely spaced frequency components. Mech. Syst. Signal Process. 2012, 28, 258–279. [Google Scholar] [CrossRef]
  21. Wang, Z.-C.; Ren, W.-X.; Liu, J.-L. A synchrosqueezed wavelet transform enhanced by extended analytical mode decomposition method for dynamic signal reconstruction. J. Sound Vib. 2013, 332, 6016–6028. [Google Scholar] [CrossRef]
  22. Wang, Z.-C.; Ge, B.; Ren, W.-X.; Hou, J.; Li, D.; He, W.-Y.; Chen, T. Discrete analytical mode decomposition with automatic bisecting frequency selection for structural dynamic response analysis and modal identification. J. Sound Vib. 2020, 484, 115520. [Google Scholar] [CrossRef]
  23. Qu, C.-X.; Yi, T.-H.; Zhou, Y.-Z.; Li, H.-N.; Zhang, Y.-F. Frequency Identification of Practical Bridges through Higher-Order Spectrum. J. Aerosp. Eng. 2018, 31, 04018018. [Google Scholar] [CrossRef]
  24. Qu, C.-X.; Yi, T.-H.; Li, H.-N.; Chen, B. Closely spaced modes identification through modified frequency domain decomposition. Measurement 2018, 128, 388–392. [Google Scholar] [CrossRef]
  25. Qu, C.; Yi, T.; Li, H. Mode identification by eigensystem realization algorithm through virtual frequency response function. Struct. Control Health Monit. 2019, 26, e2429. [Google Scholar] [CrossRef]
  26. Zong, Z.-H.; Zhou, R.; Huang, X.-Y.; Xia, Z.-H. Seismic response study on a multi-span cable-stayed bridge scale model under multi-support excitations. Part I: Shaking table tests. J. Zhejiang Univ. Sci. A 2014, 15, 351–363. [Google Scholar] [CrossRef] [Green Version]
  27. Xu, Y.; Wang, R.; Li, J. Experimental Verification of a Cable-Stayed Bridge Model Using Passive Energy Dissipation Devices. J. Bridg. Eng. 2016, 21, 04016092. [Google Scholar] [CrossRef]
  28. Xie, W.; Sun, L.; Lou, M. Wave-passage effects on seismic responses of pile–soil–cable-stayed bridge model under longitudinal non-uniform excitation: Shaking table tests and numerical simulations. Bull. Earthq. Eng. 2020, 18, 5221–5246. [Google Scholar] [CrossRef]
  29. Guo, W.; Li, J.; Guan, Z. Shake Table Test on a Long-Span Cable-Stayed Bridge with Viscous Dampers Considering Wave Passage Effects. J. Bridg. Eng. 2021, 26, 04020118. [Google Scholar] [CrossRef]
  30. Guan, Z.; You, H.; Li, J. An effective lateral earthquake-resisting system for long-span cable-stayed bridges against near-fault earthquakes. Eng. Struct. 2019, 196, 109345. [Google Scholar] [CrossRef]
  31. Guan, Z.; Li, J.; Guo, W.; Qu, H. Design and validation of a shaking-table test model on a long-span cable-stayed bridge with inverted-Y-shaped towers. Eng. Struct. 2019, 201, 109823. [Google Scholar] [CrossRef]
  32. Chang, C.C.; Chang, T.Y.P.; Zhang, Q.W. Ambient Vibration of Long-Span Cable-Stayed Bridge. J. Bridg. Eng. 2001, 6, 46–53. [Google Scholar] [CrossRef]
  33. Ko, J.; Sun, Z.; Ni, Y. Multi-stage identification scheme for detecting damage in cable-stayed Kap Shui Mun Bridge. Eng. Struct. 2002, 24, 857–868. [Google Scholar] [CrossRef]
  34. Ren, W.-X.; Peng, X.-L.; Lin, Y.-Q. Experimental and analytical studies on dynamic characteristics of a large span cable-stayed bridge. Eng. Struct. 2005, 27, 535–548. [Google Scholar] [CrossRef]
  35. Kim, J.-T.; Ho, D.-D.; Nguyen, K.-D.; Hong, D.-S.; Shin, S.W.; Yun, C.-B.; Shinozuka, M. System identification of a cable-stayed bridge using vibration responses measured by a wireless sensor network. Smart Struct. Syst. 2013, 11, 533–553. [Google Scholar] [CrossRef]
  36. Lozano-Galant, J.A.; Nogal, M.; Paya-Zaforteza, I.; Turmo, J. Structural system identification of cable-stayed bridges with observability techniques. Struct. Infrastruct. Eng. 2014, 10, 1331–1344. [Google Scholar] [CrossRef]
  37. Asadollahi, P.; Li, J. Statistical Analysis of Modal Properties of a Cable-Stayed Bridge through Long-Term Wireless Structural Health Monitoring. J. Bridg. Eng. 2017, 22, 04017051. [Google Scholar] [CrossRef]
  38. Sun, M.; Alamdari, M.M.; Kalhori, H. Automated Operational Modal Analysis of a Cable-Stayed Bridge. J. Bridg. Eng. 2017, 22, 05017012.1–05017012.16. [Google Scholar] [CrossRef]
  39. Siringoringo, D.M.; Fujino, Y.; Namikawa, K. Seismic Responses Analyses of the Yokohama-Bay Cable-Stayed Bridge in the 2011 Great East Japan (Tohoku) Earthquake. J. Bridge Eng. ASCE, 2013; in press. [Google Scholar]
  40. Yang, D.; Zhan, Y.; Zhang, J.; Au, F.T. Iterative reference-driven S-transform time-varying parameter identification for bridges under moving vehicle. J. Sound Vib. 2022, 517, 116477. [Google Scholar] [CrossRef]
  41. Zhao, J.; Bao, Y.; Guan, Z.; Zuo, W.; Li, J.; Li, H. Video-based multiscale identification approach for tower vibration of a cable-stayed bridge model under earthquake ground motions. Struct. Control Health Monit. 2019, 26, e2314. [Google Scholar] [CrossRef]
  42. Wang, Z.-C.; Xin, Y.; Xing, J.-F.; Ren, W.-X. Hilbert low-pass filter of non-stationary time sequence using analytical mode decomposition. J. Vib. Control. 2017, 23, 2444–2469. [Google Scholar] [CrossRef]
  43. Qu, H.; Li, T.; Wang, R.; Li, J.; Guan, Z.; Chen, G. Application of adaptive wavelet transform based multiple analytical mode decomposition for damage progression identification of Cable-Stayed bridge via shake table test. Mech. Syst. Signal Process. 2021, 149, 107055. [Google Scholar] [CrossRef]
Figure 1. SSAWT-oMAMD algorithm.
Buildings 12 01285 g001
Figure 2. Time–frequency plane of Duffing systems.
Buildings 12 01285 g002
Figure 3. Wavelet transforms: (a) center frequency of 1 Hz; (b) center frequency of 2 Hz; (c) center frequency of 3 Hz; (d) center frequency of 4 Hz.
Buildings 12 01285 g003
Figure 4. Synchro-squeezed wavelet transforms: (a) center frequency of 1 Hz; (b) center frequency of 2 Hz; (c) center frequency of 3 Hz; (d) center frequency of 4 Hz.
Buildings 12 01285 g004
Figure 5. Synchro-squeezed wavelet transform: (a) lognormal wavelet; (b) Morlet wavelet; (c) bump wavelet.
Buildings 12 01285 g005aBuildings 12 01285 g005b
Figure 6. Comparison between actual and decomposed system responses.
Buildings 12 01285 g006
Figure 7. Time–frequency representation of x ( t ) and ω f 2 ( t ) : (a) wavelet transform; (b) SSAWT.
Buildings 12 01285 g007
Figure 8. Instantaneous system stiffness coefficient by Hilbert transform.
Buildings 12 01285 g008
Figure 9. System stiffness coefficient by optimized MAMD: (a) slow-varying component; (b) identified coefficient.
Buildings 12 01285 g009
Figure 10. Bridge prototype (unit: mm).
Buildings 12 01285 g010
Figure 11. Bridge model (unit: mm).
Buildings 12 01285 g011
Figure 12. Earthquake input: (a) time history; (b) response spectrum.
Buildings 12 01285 g012
Figure 13. Finite element model: (a) prototype bridge; (b) test model.
Buildings 12 01285 g013
Figure 14. Exponential Maxwell damper: (a) actual design (unit: mm); (b) theoretic model.
Buildings 12 01285 g014
Figure 15. Time–frequency representation of damping force variation: (a) wavelet transform; (b) SSAWT.
Buildings 12 01285 g015
Figure 16. Identified damping coefficient from numerical analysis of bridge model.
Buildings 12 01285 g016
Figure 17. Acceleration at tower top under 0.4 g earthquake input: (a) acceleration time history; (b) SSAWT.
Buildings 12 01285 g017
Figure 18. Decomposed acceleration for the dominant mode of vibration: (a) acceleration time history; (b) SSAWT; (c) FIrST.
Buildings 12 01285 g018
Figure 19. Identified structural property: (a) structure damping; (b) structure stiffness.
Buildings 12 01285 g019
Figure 20. Seismic response of viscous damper.
Buildings 12 01285 g020
Figure 21. Identified damping coefficient from shake table test of bridge model.
Buildings 12 01285 g021
Table 1. Design similitudes of cable-stayed bridge model.
ParameterRelationModel
MaterialStrain, ε S ε = 1 1
Stress, σ S σ = S E 0.3
Elastic modulus, E S E = 1 0.3
Poisson’s ratio, μ S μ = 1 1
Density, ρ S ρ = S E S a S l 6
GeometryLength, l S l = 1 1/20
Area, S S s = S l 2 1/400
Deformation, δ S δ = S l 1/20
Angle, θ S θ = 1 1
LoadForce, F S F = S E S l 2 0.00075
Moment, M S M = S E S l 3 0.0000375
DynamicMass, m S m = S ρ S l 3 0.00075
Stiffness, k S k = S E S l 0.015
Time, t S t = ( S m S k ) 0.5 0.2236
Frequency, f S f = 1 S t 4.4721
Damping, c S c = S m S t 0.003354
Velocity, v S v = S l S t 0.2236
Acceleration, a S a = S l S t 2 1
Table 2. Test procedure.
SequenceInputTime StepPGA
1LCN2660.001120.1 g
2LCN2660.001120.2 g
3LCN2660.001120.3 g
4LCN2660.001120.4 g
Table 3. Comparison of natural periods.
ModeMode ShapePeriod
PrototypeScaledModelError
1Longitudinal vibration of girder4.6191.0331.032−0.04%
2Vertical vibration of girder (1st mode)2.3660.5290.5493.76%
3Vertical vibration of girder (2nd mode)1.5960.3570.3693.36%
4Vertical vibration of girder (3rd mode)1.1540.2580.2611.18%
5Vertical vibration of girder (4th mode)1.0240.2290.2321.45%
6Lateral vibration of tower (1st mode)0.9700.2170.211−2.72%
7Lateral vibration of tower (2nd mode)0.8730.1950.1970.83%
8Vertical vibration of girder (5th mode)0.8530.1910.190−0.28%
9Lateral vibration of tower (3rd mode)0.8330.1860.174−6.66%
10Vertical vibration of girder (6th mode)0.6490.1450.1524.84%
Publisher’s Note: MDPI stays neutral with regard to jurisdictional claims in published maps and institutional affiliations.

