
A Performance-Based Window Design and Evaluation Model for Naturally Ventilated Offices


1
Department of Architecture, College of Engineering, Salahaddin University-Erbil, Erbil 44001, Iraq
2
Department of Architecture, Faculty of Architecture, Eastern Mediterranean University, Famagusta 99628, Cyprus
*
Author to whom correspondence should be addressed.
Buildings 2022, 12(8), 1141; https://doi.org/10.3390/buildings12081141
Submission received: 11 July 2022
/
Revised: 21 July 2022
/
Accepted: 29 July 2022
/
Published: 1 August 2022
(This article belongs to the Topic Ventilation and Indoor Air Quality)
Abstract
:This study proposes a performance-based window design model for optimised natural ventilation potential by reducing the level of indoor carbon dioxide (CO2) concentration and improving thermal comfort, consequently minimising supplementary heating/cooling loads. The model consists of several stages: (1) Knowledge acquisition, (2) establishing a relationship between window design and natural ventilation, (3) identifying performance criteria and the design of experiments (DOE), (4) conducting performance-based dynamic simulations, (5) evaluation of findings, and (6) making informed design decisions. The study also proposed an evaluation method by which assessments of indoor CO2 concentration and adaptive thermal comfort are performed using the threshold suggested by the World Health Organisation (WHO, Geneva, Switzerland) and the acceptability categories of the British/European standard BS EN 15251:2007. The proposed model was applied to a single office inspired by the staff offices at the Department of Architecture, Eastern Mediterranean University, Famagusta, North Cyprus. The findings show that the developed model of performance-based window design enables the handling of various window design variables along with different performance criteria to determine the near-optimal window design alternatives for effective natural ventilation (NV) and mixed-mode (MM) offices. This model can guide architects in making informed decisions in the early stages of office window design.
1. Introduction
Air movement for habitable spaces has an important impact on perceived indoor air quality [1]. Studies claim that air tightening within an occupied zone may result in complaints of unsatisfactory indoor air, particularly in air-conditioned (AC) spaces. Recent field studies suggest that elevated airspeed can achieve thermal comfort even at higher temperatures and improve perceived indoor air quality [2].
The importance of indoor air quality (IAQ) is reflected in the increased number of researchers studying various aspects of this topic. Due to the increasing demand for energy-saving and energy-efficient buildings, research into IAQ requires adopting various passive alternatives. In recent studies, the utilisation of natural ventilation to remove indoor pollutants and maintain indoor air quality, along with the indoor thermal comfort of various building types, has been challenged [3]. However, past attempts examined one goal at a time (e.g., indoor air quality, thermal comfort, energy consumption, productivity, etc.) and assessed the ideal environmental conditions for optimising that single target. The findings of previous studies recommend conflicting objectives and emphasise the need to pursue a more integrative approach to indoor environmental quality (IEQ) by tackling more than one criterion simultaneously [1].
Natural ventilation through window openings is the most common means to deliver fresh air indoors [4]. An effective method for maintaining indoor air quality and thermal comfort is window openings controlled by building occupants. It has been proven that window-based NV can profitably replace mechanical ventilation, as well as ventilative cooling techniques using windows, and it can be harvested during free-running periods instead of using AC systems [5]. Therefore, a significant amount of energy consumption and carbon dioxide emissions can be reduced [6,7].
These discussions often note that window design has a strong relationship with NV performance regardless of the building type. Evidently, window design is an early decision for architects, who need adequate knowledge supported by quantitative data and experiments concerning airflow and heat transfer in buildings [8]. This study attempts to bridge the gaps in window design, natural ventilation, indoor air quality, and thermal comfort in a holistic, performance-based design approach that can guide architects in early design decisions.
1.1. Aim and Objectives of the Study
An appropriate window design can maximise the free-running period and thus save a considerable amount of energy and reduce CO2 emissions. Thus, architects need to understand the elements of window design decisions in terms of NV performance. The primary aim of this study is to develop a performance-based window design model that can optimise natural ventilation performance in terms of reduced indoor CO2 concentration and supplementary heating/cooling loads, as well as improved ventilation rates and thermal comfort in NV and MM offices.
Accordingly, the objectives of the study are:
- To develop a performance-based window design model for early window design in terms of natural ventilation performance;
- To develop an evaluation model for assessing the findings of the model;
- To test the developed model using a case application;
- To identify the most influential window design parameters and their optimal levels with respect to each selected criterion;
- To demonstrate the trade-off selection method for window design variables among multiple conflicting performance criteria.
1.2. Architectural Considerations for Natural Ventilation
The relationship of natural ventilation with a building is developed using various aspects of architectural design, which Kleiven [9] defined as characteristic elements in his concept of a “natural ventilation system”. The decisions on these aspects are mainly made in the early architectural design process, including site selection (building location), planning, landscaping, building form, and envelope-related components [10].
Overall, building envelope elements have a greater impact on natural ventilation performance [11] due to the fact that most of these components are directly related to natural ventilation design, such as openings, shadings, orientation, thermal mass, etc. This study focuses on the effects of the building envelope, particularly those of window design on natural ventilation performance; thus, more details are provided on these topics.
1.3. Window Design Parameters
The glazed envelope is located at the opening of the building’s façade and provides a visual connection between the outdoor environment and the indoor spaces. In addition to providing aesthetic value and a view to the outside, windows are the most critical components that affect building performance in terms of indoor air quality, natural ventilation, thermal comfort, daylight, visual comfort, and, essentially, energy performance. According to state-of-the-art research in the reviewed literature, including but not limited to [12,13,14,15,16,17,18], the most important window design variables identified are: size, orientation, type, opening, shape, position, separation, glazing, frame, and the availability of shading.
The impact of the window-to-wall ratio on different building performance goals has been studied more frequently, such as in the cases of [19,20,21,22,23,24]. The reviewed studies report that window size has a significant impact on natural ventilation conditions [25] and indoor environmental quality [26]. An investigation of windows located at the east and west orientations in a hot–humid climate showed that a 25% WWR provided better indoor thermal comfort conditions than a 50% WWR [27]. According to building regulations in North Cyprus, the minimum window size is defined as a 10% window-to-floor area ratio [28]. However, the question of whether this window size is sufficient to sustain the indoor air and thermal conditions of naturally ventilated offices needs to be answered.
Window orientation is considered a significant design parameter in terms of wind direction and solar radiation. A suitably placed window in a specific wall orientation can maximise ventilative cooling potential and minimise direct solar radiation, which is highly important in warm and hot climates. Therefore, window orientation is one of the critical energy-efficient design decisions that influence building envelope energy performance. The results of one study [29] investigating the effect of orientation and envelope insulation appliances found an up to 43% reduction in the resulting cooling load. Researchers [27] conducted an experimental study in a hot–humid climate; they reported that rooms with east-orientated windows had less thermal comfort hours than west-oriented windows in the case of 50% WWR, while both rooms performed similarly when they had a 25% WWR. The optimum window size depends on the window orientation and weather conditions; for instance, WWRs ranging from 10–70% are suggested for different window orientations and climates in Iran, where the difference between the minimum and maximum energy consumption rate is between 20–100% in its hot–humid climate [30].
Window type and natural ventilation are closely related to each other. The basic window types, performance ratings, and glossary of window-related terms are described in the AAMA/NWWDA/CSA 101/I.S.2/A440-08—North American Fenestration Standard/Specification for Windows, Doors, and Skylights [31]. Wang and Chen [32] investigated the impact of different window types, namely, casement, awning, and hopper windows, on single-sided natural ventilation with different opening angles using computational fluid dynamics (CFD) as an airflow prediction method. The findings suggest that the impact of the window type on the ventilation rate varied with the wind direction, whereby the windows and the turbulence effect created different flow patterns. These conclusions were also reported by a similar study [33]. Another study [34] evaluated the influence of different window types on ventilation performance in the residential buildings of Hong Kong using air change per hour (ACH) to quantify natural ventilation. The authors claimed that casement windows are the most effective design solutions, followed by awnings and sliding windows, in that order. It has been reported that casement windows are preferable in warm months, while hopper windows are preferable in cold months for both single-sided and cross ventilation [35]. Moreover, the natural ventilation performance of hopper windows also improves with a different opening angle [36], while the discharge coefficients of casement and hopper windows do not vary significantly [35]. Casement windows allow higher airflows for windward conditions compared to hopper and awning windows; however, hopper windows perform better in terms of overall airflow rates for all wind directions due to fewer obstructions [37].
In naturally ventilated buildings, window-opening behaviour significantly affects indoor air quality, thermal comfort, and energy consumption [38,39]. Closed windows increase the concentration of indoor particles (e.g., PM2.5) emitted by indoor particle sources [40]. Window-opening behaviour relies on both subjective sensations, particularly physiology and psychology, and objective factors, which include indoor air and thermal comfort; thus, it is subjected to a fair degree of randomness and uncertainty [41]. It has been found that the duration of window-opening in warm climates is significantly higher than in cold climates, especially during working hours (9:00–17:00) on weekdays, even in residential apartments [42]. Researchers [38,41] identified the major variables in determining the probability of window-opening as the level of indoor CO2 concentration and outdoor temperature. Furthermore, window-opening prediction models and occupant behaviour have recently come under consideration [43,44], including questions concerning the reliability of simulation tools in handling this matter [45,46]. A few studies claim that occupant-controlled window operation leads to insufficient natural ventilation performance; instead, they recommend automated ventilation control schemes [47,48,49,50].
Window shape (or window aspect ratio) is another important parameter that can affect the flow pattern of air indoors. The commonly used window shapes are rectangular (vertical or horizontal) and square shapes. One study [15] tested a number of vertical and horizontal rectangles and square windows with cross ventilation. The square window performed better than both the vertical rectangle and horizontal rectangle windows.
Opening position (or window location) is considered a significant factor that can affect the indoor airflow pattern. Shetabivash [13] studied the effect of various window positions and configurations on natural cross ventilation performance. The window positions the study investigated included placing the windows at the top and bottom of a room in opposite directions (windward and leeward sides). When the windows were placed at the same level but near the bottom of the wall, this presented the least effective scenario. However, window positions perpendicular to each other can improve natural cross ventilation performance [16]. Ventilation flow rate also depends on window separation in a way that low separation (S’~0.1)—aperture separation scaled by building width (S’)—can boost single-sided natural ventilation performance, while a larger separation (S’ > ½) inhibits the realisation of this added benefit [51].
A window’s thermal performance is typically a function of the glazing, frame, and perimeter details, with the overall goal of achieving the most effective natural ventilation (in the case of openable windows) to maintain IAQ and TC, as well as the best possible daylight transmission with the least heat transmission (e.g., heat gain and heat loss). Overall, glazing thermal performance relies on controlling the level of radiative heat transfer, which is mostly transferred through solar radiation and longwave infrared radiation [52]. One of the most effective ways of improving window thermal performance is the use of low-E coatings on the glass pane. Window frame conductivity is a function of the frame material, geometry, and use of thermal breaks inside the frames. Aluminium, vinyl (PVC), wood, and fibreglass are the common materials used for window frames in the building construction industry.
External window shade is another envelope component that is mainly applied to envelope openings. It is a form of solar control that can be utilised to optimise the amount of solar gain and daylight entering a building. Therefore, it can reduce energy use and, eventually, CO2 emissions. Window shade has a significant influence on the thermal and visual comfort of occupants, protecting them from overheating and glare. Numerous studies focus on the role of window shades on the energy usage, thermal comfort, and visual performance of buildings [20,22,53,54,55,56]. Overall, well-thought-out window parameters (including window size, orientation, and shades) lead to a significant improvement in natural ventilation conditions and thermal comfort, increasing the airspeed by six times and reducing the air temperature by 2.5% [12]. The most effective way to realise the full potential of natural ventilation in the Mediterranean climate is to determine the appropriate window-to-wall area for optimal thermal performance, the appropriate material for glazed windows, and the right shading devices when deciding on the building envelope so that the reliance on active systems is minimized [55].
2. The Proposed Model of Window Design and Evaluation Relative to Natural Ventilation Performance
2.1. Rationale of the Proposed Model
Architectural design is an iterative process of understanding, exploration, and validation in which design assumptions are continuously modified and assessed against the intended performance criteria. Using iterations, designers have the ability to go back and forth through the cyclical process until the design solution achieves a lower risk of failure. Therefore, architects need comprehensive frameworks to explore and evaluate their early design decisions, which eventually affect the upcoming design stages, construction stage, and post-occupancy building performance. The concept of the proposed model originated from a performance-based design approach within the digital design process. In the PBD paradigm, “performance” is defined as “the desirability of the confluence between form and function in a given context” [57]. Unlike generative design (another approach to the digital design process), in the PBD paradigm, the computer does not generate design solutions but “acts as a partner with the designer during the design process” [58]. Hence, a performance-based design approach facilitates structuring the architectural design process to enable architects to make informed decisions in the early design stages [58,59].
Numerous studies have investigated the impact of window design on indoor environmental conditions [11,12,13,14,15,16,17,23,24,25,26,27,30,32,34,35,36,37,38,39,40,41,43,44,45,46,47,48,49,51,60,61]. Certainly, these attempts confirm the crucial role of window design on occupant health, comfort, and productivity, especially in naturally ventilated buildings. The concept of proposing a comprehensive, performance-based window design model is intended to provide architects with informative feedback about potential design decisions aimed at simultaneously improving IAQ and TC performance. Another significance of the proposed model is that it overcomes the limitations of previous methods in terms of reducing the required time and effort by adopting a practical approach in conducting a minimal number of experiments, called Taguchi design of experiments, to determine the impact of each design parameter on the performance criteria. For reference, in the case of eight parameters, each with three levels (38), the full factorial design method requires 6561 runs to test all combinations; in contrast, only 18 runs are necessary (less than 3%) for the Taguchi orthogonal arrays used in the proposed model. In addition, the proposed model facilitates the trade-off selection of design solutions among multiple objective functions as an alternative to the assumed optimal solution for a particular criterion.
2.2. Components of the Proposed Model
The proposed model is a performance-based model encompassing procedural methods aimed at ensuring architects make educated decisions early on in the design stage concerning office envelope design, particularly window- and NV-related design parameters. The major stages include (1) knowledge acquisition, (2) establishing a relationship between window design and natural ventilation, (3) identifying performance criteria and the design of experiments (DOE), (4) conducting performance-based dynamic simulations, (5) the evaluation of findings, and (6) making informed design decisions.
2.2.1. Knowledge Acquisition
To start any architectural design process, the predesign stages involve data collection and knowledge acquisition about the project and its requirements. Therefore, the first stage of the proposed model is referred to as the “knowledge acquisition” of the space under design, such as the building location, information about the context and environment, and the building type and function, as well as relative local or international building regulations and codes. These pieces of information serve as design constraints, not variables, and should be considered by designers in defining design parameters in the proposed model.
2.2.2. Establishing a Relationship between Window Design and Natural Ventilation
A well-designed window paves the way for efficient NV performance to improve indoor air, occupant thermal comfort, and, consequently, a reduction in the use of mechanical ventilation and cooling [25]. In addition, airflow rate, windspeed, and indoor temperature are directly proportional to the various window design variables [60,61].
This stage combines the design of envelope-related components and a natural ventilation strategy. The model concentrates on the design of wall glazing in relation to NV performance within early building envelope design; nevertheless, other envelope-related design parameters can also be studied using the proposed model. Natural ventilation types (i.e., wind-driven and buoyancy-driven) and classifications (i.e., single-sided and cross ventilation) are defined by the window design parameters, for which the amount of airflow that enters and leaves the space is determined accordingly. Therefore, this stage establishes a relationship between window design and natural ventilation by developing a correlation between various parameters affecting the ventilation rates and, consequently, indoor air and thermal conditions.
2.2.3. Design of Experiments and Identifying Performance Criteria
Design of experiment is proposed as an alternative to full factorial design (FFD), in which the number of necessary experiments can be minimised to a reasonable amount while obtaining all the required information about the sensitivity of the design variables under study. Among the available DOE methods, this study suggests the use of the “Taguchi orthogonal arrays” method [62] as a standard method of experimental design. Furthermore, the data analyses include the analysis of variance (ANOVA) approach and the signal-to-noise (S/N) ratio [63]. Using this performance-based model, architects can select intended environmental performance objectives in the domains of indoor environmental quality and energy efficiency goals. However, in this model, the considered performance criteria are limited to ventilation rates, the indoor CO2 concentration level, and occupant comfort.
2.2.4. Performance-Based Dynamic Simulations
The British/European standard 15251:2007 recommends “whole year computer simulations” as a reliable method to study and evaluate the indoor environment and energy performance of new and existing buildings. Studies on computer modelling and simulations have shown that computer simulations play a vital role in building design, influencing resident comfort and energy performance by helping to solve building performance issues [64]. Computer simulations of energy modelling require substantial knowledge about the physical and operational characteristics of the building, as well as precise input data on the building and climate. During the application of the proposed model, any validated simulation software can be used, such as computational fluid dynamics tools. In this study, Tas Engineering software version 9.4.4—developed by Environmental Design Solutions Limited (EDSL) [65]—was used to conduct the computational dynamic thermal simulations and fulfil this stage of the study.
2.2.5. Evaluation and Decision-Making
This stage covers the evaluation of the analytical and numerical findings from simulation experiments, on the basis of which informed decisions can be made. The evaluation method comprises the assessment of each measurement indicator of the selected performance criteria, namely ventilation rate, carbon dioxide concentration, thermal comfort, and supplementary heating/cooling loads using a relevant and recommended calculated indicator. Following the evaluation of findings and data analysis, architects can make informed decisions, taking into account whether they are satisfied with the performance of the initial design or the evaluated results, and suggest improvements through the modification of envelope-related parameters, particularly wall glazing variables and NV design. Accordingly, the framework of the proposed model is developed and illustrated in Figure 1.
2.3. Evaluation Method of the Findings
The BS EN 15251:2007 standard in Annex I (see Table 1) contains a classification of indoor environmental assessments based on building status [66]. The developed model addresses the early design of office spaces by assessing the impact of various architectural design variables on the indoor environment, as well as the energy performance of a mixed-mode strategy (if applicable). Consequently, it applies a year-round hourly dynamic computer simulation based on the classification method suggested in the BS EN 15251:2007 standard. The objective is to guide decision-making in the early design phases and apply building performance simulation (BPS) at the outset of the design process in a PBD approach. The effectiveness of window design and its implications for NV performance were assessed in terms of the ventilative cooling potential for IAQ and TC and the additional HVAC load needed to maintain indoor environmental conditions when natural ventilation proved insufficient due to extreme weather conditions.
According to the BS EN 15251:2007 standard [66], the “calculated indicators of indoor environment method include the (1) simple indicator, (2) hourly criteria, (3) degree hours criteria, and (4) overall thermal comfort criteria (weighted PMV criteria)”. The hourly criteria indicator was adopted in this study, which allows building performance to be assessed based on the percentage of time (%) and/or number of hours (h) during which the intended criteria were met.
This research is limited to examining and evaluating the performance of window-based natural ventilation in diluting indoor carbon dioxide and maintaining acceptable indoor air and thermal comfort for the building occupants. Hence, the considered measurement criteria are the ventilation rate and CO2 level, thus assessing indoor air performance and predicting the thermal sensation of occupants using the adaptive comfort model to evaluate indoor thermal comfort in free-running buildings while also lowering HVAC loads in mixed-mode spaces. The evaluation model for assessing the potential findings from the proposed model is illustrated in Figure 2.
2.3.1. Assessment of Indoor Air Performance
The assessment of indoor air is limited to ventilation rates and carbon dioxide levels. Other common measurements of IAQ include concentrations of formaldehyde (HCHO) and volatile organic compounds (VOCs), which were not considered in this study. The concentration of carbon dioxide in an indoor space is often a reliable indicator of the quality of the space. CO2 concentration has also been used in previous studies to evaluate the ventilation performance of indoor spaces using the “gas tracer method” in field experiments or through dynamic building simulations. The benchmark limits of acceptable carbon dioxide concentrations in indoor spaces are defined by multiple standards and guidelines, including: the WHO [67], ASHRAE 62.1 [68], BS EN 15251 [66], and EN 13779 [69] standards. The World Health Organisation [67] recommends 1000 ppm as the upper limit of CO2 concentration, after which higher concentration levels are an indication of poor ventilation, significantly increasing the likelihood of indoor air quality problems and resulting in sick building syndrome [70].
In the same vein, the BS EN 15251:2007 standard [66] classifies indoor CO2 levels into different categories. The ASHRAE 62.1 standard similarly endorses the 1000 ppm threshold specified by the WHO, which is within the Category II range of indoor carbon dioxide concentration specified by the BS EN 15251:2007 standard. The 1000 ppm threshold recommended by the WHO was utilised in this study to evaluate the natural ventilation performance of different types of offices. Table 2 outlines the various standards addressing the level of indoor carbon dioxide concentration.
2.3.2. Assessment of Ventilation Rates
Natural ventilation efficiency can be evaluated based on the amount of fresh air delivered to indoor spaces from the outdoor environment. The airflow rate can be evaluated through the relevant standards for determining the acceptability of indoor air quality and ventilation rates, including the ASHRAE 62.1 [68], BS EN 15251 [66], and EN 13779 [69] standards. The minimum ventilation rates outlined in these standards are determined based on the type of building, occupancy, and/or floor area. The breathing zone outdoor airflow (Vbz) in the ASHRAE 62.1 standard is calculated using Equation (1). Similarly, the BS EN 15251:2007 uses Equation (2) to calculate the overall ventilation rates (qtot) for indoor spaces based on the building emission ventilation rates (qB). It is noteworthy that, despite the fact that both standards adopt similar logics, they do not necessarily produce identical outputs. The ventilation rate calculation method suggested in the BS EN 15251:2007 standard was utilised in the proposed evaluation model. Table 3 outlines the recommended ventilation rates for office spaces. It is worth mentioning that the ventilation rate for smoking was omitted due to the prohibition on smoking in offices.
where Rp is the airflow rate per person (L/s·pers), Pz is the number of occupants, Ra is airflow per unit area (L/s·m2), and Az is the zone floor air (m2).
where qtot is the total ventilation rate of the space (L/s), n is the number of occupants, qp is the airflow rate per person (L/s·pers), A is the zone floor air (m2), and qB is the airflow rate for building emissions (L/s·m2).
2.3.3. Assessment of Indoor Thermal Comfort
Indoor thermal comfort is another significant performance criterion that needs to be evaluated when assessing IEQ, especially in warm and hot climates. As stated in the previous sections, the scope of this research is limited to NV—including mixed-mode—buildings; therefore, to achieve more reliable results, the most precise and suitable thermal comfort model should be employed. Fanger’s PMV and PPD model [71] is widely used to assess the thermal comfort status of airconditioned spaces, although some researchers claim that the PMV and PPD method overestimates the percentage of occupant discomfort in hot and warm conditions for naturally ventilated spaces [72]. Furthermore, field studies have proved that the adaptive thermal comfort model is better suited to addressing the thermal comfort of users in free-running and MM buildings, owing to the fact that this method takes into account human adaptation mechanisms as a reaction to changes in the outdoor environment [1,73].
The field studies under review take a negative position regarding the classification of the MM system with respect to AC buildings in current thermal comfort standards (i.e., ASHRAE 55 and BS EN 15251), arguing instead that natural ventilation is in use for most of the occupied hours in office spaces. Natural ventilation is described as being synonymous with free-running buildings in the aforementioned thermal comfort standards, for which the adaptive thermal comfort model has been developed using information generated by a variety of field studies. Recent field surveys have found that occupant thermal sensations in NV and MM buildings are better represented using the adaptive model relative to the PMV/PPD model, which does not adequately account for the various ways in which residents can adapt to variations in outdoor weather conditions. Furthermore, adaptive thermal comfort can also be used in conducting climate change impact studies on mixed-mode office spaces [74].
In mixed-mode buildings, indoor thermal comfort involves NV and AC systems, which can be assessed individually using the adaptive and steady-state thermal comfort models, respectively. This study implements an adaptive method to quantify occupant thermal sensations in terms of being comfortable or not in a given period, thereby evaluating the space based on acceptable adaptive model comfort ranges suggested by the relative standards. The British/European adaptive comfort model, stated in the BS EN 15251:2007 standard [66], is used on account of its being less restrictive when explaining the model’s applicability conditions compared to the American adaptive model (i.e., ASHRAE 55).
However, because this study focuses on the potential benefits of natural ventilation in office spaces (as a free-running building or under a mixed-mode strategy), the evaluation of indoor thermal comfort is limited to the natural ventilation period by the adaptive thermal comfort of the BS EN 15251:2007 standard shown in Equation (3). The optimal indoor operative temperature is defined relative to an exponentially weighted outdoor running mean temperature, which is calculated for the previous 7–30 days using Equation (4). Depending on the value of constant α, the significance of the resulting temperatures declines over time. The three categories defined in the standard are I (To ± 2), II (To ± 3), and III (To ± 4), respectively representing high, normal (for new buildings), and moderate (for existing buildings) expectations. Table 4 reports the details of the adaptive thermal comfort model of both the American (ASHRAE 55) and British/European (BS EN 15251) standards. Based on the upper and lower limits of the intended category, the number of comfort hours during the occupancy period can be utilised as an indicator in evaluating the thermal comfort performance of a design scenario, and it is formulated by the BS EN 15251:2007 standard as follows:
where is the indoor optimal operative temperature (°C); stands for the exponentially weighted running mean temperature (°C) for the last 7–30 days; represents a constant between 0 and 1; and is the daily mean outdoor temperature for the day before, the day before that (), the day before that (), and so on.
The significance of the temperatures declines over time, with the speed of decay depending on the value of the constant, α. The equation developers suggested α = 0.8 as an appropriate value according to their SCAT database [75].
2.3.4. Assessment of Heating, Ventilation, and Airconditioning Loads
The aim of the mixed-mode strategy is to realise the full potential of natural ventilation using operable windows and maintain the quality of indoor thermal performance by utilising supplementary heating, ventilation, and air-conditioning (HVAC) in extreme weather conditions. This results in significant energy savings, along with a reduction in GHG emissions.
Natural ventilation is typically used in a hot or warm climate when the outdoor temperature ranges between 20 °C to 24 °C [76]. To amplify the impact of ventilative cooling and ensure compliance with the occupants’ window-opening preferences, as outlined in the adaptive thermal comfort model, NV operation can be predicted or, alternatively, designed based on automation. Such an automated design will allow the windows to start opening when the indoor air temperature is at 21 °C and fully open when this rises to 24 °C. Practically speaking, the building management system (BMS) will need to be integrated with the necessary control mechanism [76,77].
To reduce the chance of overcooling, the operation of window openings conforms to the cooling/heating temperature ranges suggested by the BS EN 15251:2007 standard for a particular category, such as Category II for normal expectations, as shown in Table 5. The maximum temperature required for cooling in AC spaces is 26 °C, while the minimum indoor temperature for heating is 20 °C. However, occupants in naturally ventilated buildings are able to adapt to a wider range of temperatures relative to the outdoor temperature using a variety of adaptive behaviours [78]. The operation of air-conditioning within the mixed-mode system is regulated by the minimum heating temperature setpoint for Category II (20 °C), while the cooling temperature setpoint is defined by the Category II upper limit of the European adaptive model, as shown in Equation (5). For reference, cooling begins when the outdoor running mean temperature is 30 °C and the indoor operative temperature reaches 31.7 °C.
Lastly, the annual comfort hours provided by natural ventilation (free-running period) are represented by the number of hours when the indoor operative temperature is within the acceptability limits of the adaptive model. Thermal satisfaction can be provided for the remaining office working hours (discomfort period) through mechanical air-conditioning in the mixed-mode system. The total HVAC load of the air-conditioning period is calculated for each design alternative. A comparative study for a particular design solution can be conducted to contrast the performances of the mixed-mode system and full air-conditioning based on the heating and cooling temperature ranges, as defined in Table 5. Therefore, the assessment of HVAC in MM offices is based on maximising the free-running period (only NV in operation) and minimising the AC period using the number of hours, in which a specific mode is in operation during office working hours (occupation), as the calculated indicator.
2.4. Validation of the Model Using Ventilative Cooling Methods
Developed by the National Institute of Standards and Technology (NIST) [79] and further advanced in the International Energy Agency (IEA) Annex 62 [80] framework, the ventilative cooling (VC) method is used in validating natural ventilation performance in comparison to the comfort hours forecasted by the dynamic building simulation. The prevalence of this method is partly due to the growing interest in energy-efficient buildings and reducing greenhouse gas emissions. The VC method is useful for evaluating the potential benefits of natural ventilation during early design stages by accounting for internal heat gains (i.e., lighting, occupancy, solar radiation gains, and equipment gains), the thermal properties of the building envelope, and the airflow rate required to maintain IAQ and TC based on the relevant standards and regulations. Based on local climatic conditions, such an analysis is particularly useful for designer decision-making as it relates to the configuration of the building envelope and layout.
The algorithm used by the model considers the intended thermal comfort criteria and processes annual climatic conditions on an hourly basis. The model is derived from the energy balance of a well-mixed single zone, accepting that the accumulation term of the energy balance could be insignificant in the event that either the space’s thermal mass is negligible or the internal temperature is maintained at a relatively constant level. In such an instance, the steady state model defines the thermal response of the zone based on an approximation of the particular climate’s ventilative cooling potential, calculated using Equation (6).
where is the heating balance point temperature (°C), is the internal heating setpoint temperature (°C), is the total internal and solar heat gains (W/m2), is the minimum required mass flow rate (kg/s), is air capacity (J/kg·K), is envelope thermal conductance (w/K), is average U-value of the envelope (W/m2·K), and is the area of the envelope exposed to outdoor conditions (m2).
According to this method, heating must be introduced when the outdoor air temperature falls below a certain level in order to preserve the indoor air temperature at a required internal heating setpoint temperature (Ti-hsp), which is determined by the heating balance point temperature (To-hbp). Direct ventilative cooling can be introduced when the outdoor temperature is higher than the heating balance point temperature as a means to counterbalance internal heat gains and maintain IAQ and TC within the required range. However, the utility of VC diminishes when the outdoor temperature is at or below To-hbp, although acceptable and healthy indoor air requires the provision of the minimum required ventilation rate suggested by the relevant standards, including BS EN 15251:2007 and ASHRAE 62.1.
In AC buildings, the steady-state values constitute the minimum and maximum Ti-hsp, taking into consideration the building type, such as the indoor temperature ranges suggested for cooling and heating in office spaces, as previously outlined in Table 5. However, the development of the adaptive comfort model progresses relative to variations in outdoor temperature; consequently, the acceptability limits (ASHRAE 55) or categories (BS EN 15251) for adaptive comfort are used to calculate Ti-hsp. As was pointed out earlier, Category II (for new buildings) of adaptive thermal comfort forms the primary focus of this study, the conditions for which are also applied to the analysis of ventilative cooling.
To compare the results of both the VC method and the dynamic simulations, it is necessary to calculate the amount of direct ventilative cooling resulting from an increase in the airflow rate. This can guarantee comfort conditions when the outdoor temperature falls inside the limits set for the comfort zone temperature, taking into consideration the temperature range of the particular category (i.e., Category II of the BS EN 15251 standard). If we accept that conductive losses that occur in the warm months are relatively small compared to the internal gains (i.e., ∑UA (Ti-max − To-db) < qi), the ventilation rate required for the provision of thermal comfort can be calculated using Equation (7).
where Ti-max is the upper limit temperature of Category II (calculated by Equation (5) and To-db is the outdoor dry bulb temperature.
3. Model Application: Window Design of a Single Office with Single-Sided Natural Ventilation
3.1. Knowledge Acquisition
In this study, a hypothesised single office with single-sided natural ventilation was proposed, inspired by the academic staff offices at the Department of Architecture, Faculty of Architecture, Eastern Mediterranean University, Famagusta, North Cyprus. The application of various open-plan offices with cross ventilation can be found in [81]. The office floor area is 16.8 m2, and the floor aspect ratio was taken to be 1:1 (4.1 m × 4.1 m). The clear ceiling height was fixed at 3 m in accordance with the normal floor-to-ceiling height recommended in local building codes and regulations [28]. To examine the effect of an exclusively window-based NV design on the predefined performance criteria, the layout and form configuration, as well as the properties of the vertical and horizontal opaque features, were fixed in all design scenarios. These offices are designed to accommodate just one person; however, the provided space is often used by two persons, or even more, in some situations for a limited period. In this research, it was assumed that two occupants use the space during office hours (i.e., 9 am to 5 pm). Therefore, the floor area per person exceeds the suggested 10 m2 per user in single offices [66,82], resulting in elevated internal heat gains and, eventually, higher CO2 releases from occupants.
Due to the size of single offices, the majority of cases utilising such office designs have only one wall with an external condition or exposed to the outdoor environment. Hence, there might be a limit to the amount of fresh air permitted into the indoor space through a window (or windows) from this particular external wall, which is known as single-sided natural ventilation. It is worth mentioning that in North Cyprus, the minimum ratio of the WFR is 10%, and the minimum provided window-opening area is 5% or half of the minimum WFR [28].
3.2. Establishing a Relationship between Window Design and Natural Ventilation
The considered window design variables included window size, orientation, type, glazing property, aspect ratio, location, and shading availability. The levels of window size were 10%, 20%, 30%, and 50% (e.g., an approximately fully glazed external wall) window-to-floor area. The window orientations studied were north, south, east, and west, while the remaining available orientations were excluded. As explained in the previous sections, there are various types of windows relative to their operation. Of these, four common types were investigated in the present study, namely: casement, sliding, double-hung, and single-hung. The selected window types offer different natural ventilation scenarios depending on the driving forces of the NV, such as wind-driven and buoyancy effects. The glazing property is considered one of the most sensitive parameters affecting window performance in terms of indoor thermal comfort. Single-pane glass, double glass, double glass with low emissivity (low-E) coating, and triple glass with low-E coating were tested as various levels of glazing properties. The window aspect ratios of 1:1 (square shape) and 1:2 (rectangle shape), as well as the location of the window placement (i.e., middle or side) in the wall, were other studied variables and their particular levels were taken into account. The availability of shading is another studied parameter that can have a significant influence on window performance. Different design scenarios with either fully shaded windows during office hours or no shading mechanisms were examined as parameter levels to determine the role of shading in the summer period. Shading can be provided using any external or internal means, vegetation, solar shading devices, internal curtains, etc. In this research, external shading devices using horizontal fins (for south-oriented windows) or vertical fins (for east- and west-oriented windows) were implemented. The fins were designed in a way such that they can prevent excessive solar gains during office working hours in the warm months, specifically, May, June, July, August, and September.
The hypothesised office for a single-office design comprises a single thermal zone, which is located on the ground floor. The wall containing the window was defined as an external wall, whereas the other walls were assumed to be internal walls, and the ceiling was also considered an internal surface. Table 6 summarises the construction specifications used in the building performance simulations. The selection of materials and their properties were identical to the case study office building (determined by field observations), representing common construction systems in the study location (determined by studying local building construction guidelines). However, the glazing material was considered one of the window design variables in order to test different compositions.
3.3. DOE and Selection of Performance Criteria
Table 7 outlines the studied window design parameters and their considered levels. Based on the number of design parameters and their levels, the most appropriate Taguchi orthogonal array is L16 (4^4 2^3) for which the Taguchi-based DOE suggests sixteen experiments to understand the whole study as well as the effect of each variable on the intended performance objectives. Thus, Table 8 reports the required design scenarios and the specific levels of each factor.
Using analysis of variance, the effect of the design parameters on the intended performance criteria was evaluated, including the DF, the SSV, the SSTO, the MSV, the MSE, and factor effectiveness. The S/N ratio was used to identify the near-optimal level combinations of the design variables through a logarithmic transformation of the mean square deviation, where the signal-to-noise ratio of larger-is-better was employed for performance criteria related to NV, and smaller-is-better was applied for supplementary AC loads.
The intended measurement criteria for assessing window design in relation to NV performance were the airflow rates, CO2 concentration, adaptive thermal comfort, and mixed-mode loads. The calculated indicator for the NV-related measurements was the number of hours in which the criteria were met. That is, the total number of hours at which airflow rate and adaptive comfort are within Category II of the BS EN 15251:2007 standard and the number of hours in which the CO2 concentration level is equal to or less than the WHO threshold of 1000 ppm. Furthermore, the number of electricity loads (kWh/m2) required to maintain indoor thermal conditions when NV is not adequate was calculated to evaluate MM air-conditioning loads.
3.4. Performance-Based Simulation
3.4.1. Setting Weather Data
The international climate zone classification provided in ANSI/ASHRAE/IES 90.1-2019 [83] and the Köppen–Geiger climate system [84] classify Famagusta (35.1149° N, 33.9192° E) weather under warm–humid or the Csa: Mediterranean climate, respectively. This climate is characterised by cold, rainy, rather changeable winters and dry, hot summers in which July and January are the warmest and coldest months of the year, as described in Figure 3. Figure 4 and Figure 5 show the monthly average diurnal temperature swing and global horizontal radiation and the wind rose of the study location, respectively.
The moderate climate of Famagusta facilitates the adoption of the mixed-mode system to preserve IAQ and TC conditions, which maximises the use of natural ventilation and energy-saving potential. The International Weather for Energy Calculations (IWEC) [85] offers typical metrological year (TMY) hourly datasets, which can be used for dynamic computational simulations. For verification purposes, the TMY datasets were compared to hourly weather data for 2019, measured by an official local metrological office. The comparison indicated the relative consistency and accuracy of the TMY datasets, which represent real conditions.
3.4.2. Benchmark Values for Internal Heat Gains and Schedules
The empirical-based benchmark values suggested by the Chartered Institution of Building Services Engineers (CIBSE) Guide A: Environmental Design [82] were employed to define the internal heat gains of the single thermal zone (office space); refer to Table 9. For occupancy, electrical equipment, and 500 lux artificial light schedules, the internal gains of the highest possible scenario (k = 1.0) were accounted for, corresponding to 45.0 W/m2, the average total internal heat gain (Qint). Finally, 0.3 ach was set for infiltration, and in order to determine only natural ventilation potential, no mechanical ventilation was assigned to the mixed-mode system.
The ASHRAE 55 standard [86] and ASHRAE standard [87] predict a metabolic rate of 1.2 met for office activities (e.g., sedentary and light office work), which corresponds to 125.7 W/person. Based on the Du Bois method [88], an average-sized adult releases 0.0052 L/s carbon dioxide, which is described in the ASHRAE 62.1 standard (ventilation for acceptable indoor air quality) [68]. In accordance with the 8.4 m2 office area per person in this specific case study, the total CO2 generation rate was 2.22 l/h/m2.
4. Results and Discussion
4.1. Impact of Window Design Variables on the Studied Performance Criteria
To appraise the window design variables and their respective levels, the annual acceptable hours, specified in the category ranges, for ventilation rate, carbon dioxide concentration, and adaptive thermal comfort were calculated. In addition, the annual air-conditioning loads for each design experiment, defined by the Taguchi L16 (4^4 2^3) orthogonal array, was measured and are displayed in Table 10 and Figure 6.
The sixteen representative runs indicate that scenarios 15 and 11 provide more acceptable comfort hours in terms of the ventilation rate, CO2, and thermal comfort compared to other simulated cases. In scenario 15, airflow rates were inside Category II for about 1573 occupancy hours (75.3%), carbon dioxide less than 1000 ppm was recorded for 1740 h (83.3%), and thermal comfort was within the Category II range of adaptive comfort for 1391 h (66.6%). The initial interpretation for this case could be the suitability of a larger window size, which provides more fresh air and ambient air-cooling potential, particularly when the window is placed at a southern orientation. In contrast, for example, these combinations required a higher energy demand for mechanical cooling (14.7 kWh/m2) than scenario 9 (12.9 kWh/m2), which means that larger window sizes contribute to a higher internal heat gain by allowing for a greater amount of solar radiation, particularly when solar shading does not exist.
Using the analysis of variance method, the factor effect (percentage contributions) of the window design variables were perceived, as outlined in Table 11, Table 12, Table 13 and Table 14. It can be concluded that window size has the highest impact on airflow and CO2 concentration at 81.59% and 73.54%, respectively, followed by the window orientation and type. Moreover, the window aspect ratio and location have the least influence on the studied performance objectives, for which the factor effect does not surpass 1.1% in any cases.
Contrarily, the factor effect of the window design parameters indicates different patterns when the acceptability hours of the adaptive thermal comfort are considered: window orientation comes in first at 58.12%, followed by window size (24.25%) and shading (6.85%). The air-conditioning load needed to maintain indoor thermal conditions is highly affected by glazing property (29.36%), window orientation (26.52%), window size (14.79%), window type (11.44%), and the availability of external shading devices or other useful shading means (8.09%). Thus, the role of solar radiation is crucial to indoor thermal comfort, as well as AC loads, particularly in the absence of solar shading. Window location and aspect ratio have a lesser influence compared to other design variables, in which the percentages of contribution were calculated at 3.72% and 6.08%, respectively.
After determining the percentage contributions of each design parameter using the ANOVA approach, the signal-to-noise ratio method was then used to identify the most appropriate factor levels, thus obtaining the near-optimal design scenarios that can support early design decision-making.
4.2. Identifying Optimal Design Alternative
Using the signal-to-noise ratio method, the most significant level combinations of each design parameter were determined, which represent a near-optimal design scenario. Although this level combination does not necessarily correspond to the optimal case, as discrete levels of the parameters were implied in the analysis.
Figure 7 shows the S/N ratios for the tested design variable levels relative to each intended performance criterion. Figure 7a–c is based on the signal-to-noise of greater-is-better, while Figure 7d applies smaller-is-better. By observing Figure 7a,b, it can be seen that the optimal level combinations for both ventilation rate and CO2 performance are almost similar, specifically for the factors that represent the most influential variables, confirming the direct proportionality relationship between the amount of delivered airflow and indoor air pollutants. For ventilation rate performance, the optimal level combinations are as follows:
- Larger window size (more opening area) (i.e., 50% WFR);
- South orientation;
- Casement or double-hung windows;
- Double glass with low-E coating;
- Longitudinal windows (i.e., an aspect ratio of 1:2) rather than square windows;
- Window located in the middle of the wall;
- No shading devices because external shadings may prevent wind from entering the space.
Concerning carbon dioxide concentration, similar level combinations are preferred, except for the glazing property and aspect ratio, in which triple glazing and square windows show better results for the performance of this criterion. By looking at the S/N ratio plot of thermal comfort, shown in Figure 7c, the selection of optimal level combinations is as follows:
- Large-sized window (i.e., 50% WFR), noting that 20% WFR performs better than 30% WFR;
- Southern window orientation offers far better thermal comfort acceptance compared to other orientations;
- Double-hung or sliding window types;
- Triple glass or low-E coated double glass;
- Square windows (i.e., an aspect ratio of 1:1);
- Window located in one side of the wall rather than the middle; however, this variable does not make a considerable difference in adaptive comfort;
- The availability of solar shading contributes to better indoor thermal conditions, especially in the case of higher-glazing U-values.
The S/N ratio plot of the studied variable levels relative to the performance of mechanical air-conditioning loads, shown in Figure 7d, indicates significant differences compared to the performance of the rest of the criteria. Discovered by analysis of variance, the most influential variable was glazing property, followed by window orientation and size. The optimal level combinations include:
- Small to medium window size (e.g., 10% WFR to 20% WFR);
- Northern orientation or southern orientation;
- Sliding or casement;
- Triple glass, followed by double glass with low-E coating;
- Square windows;
- Window located in the middle of the wall;
- The presence of an external shading device.
4.3. Trade-off Selection Based on Near-Optimal Level Combinations
In the multi-objective optimisation approach, the near-optimal level combinations are prescribed by selecting trade-offs between distinct objective functions. Consequently, the most effective level combinations (trade-offs) and their overall performance results for each criterion are outlined in Table 15, followed by their visual illustration in Figure 8.
Based on the S/N ratio results, the trade-off window orientation is south-facing windows with square shapes placed in the middle of external walls. Offices with small windows normally require less energy demand; however, larger-sized windows were found to be the most appropriate scenarios when consciously designed by considering optimal factorial level combinations. For reference, trade-off options 1 and 6 had the same window design features, but a larger-sized window (50% WFR) was assigned to the former, and a smaller window (20% WFR) was provided for the latter; thus, the MM supplementary loads were recorded at 11.66 kWh/m2 and 12.94 kWh/m2, respectively. Consequently, the larger-sized window can be a considerably more energy-efficient solution by 10.4% compared to the 20% WFR. In addition, large windows can have a better outside view and aesthetic appearance, while visual comfort risks can be eliminated or lowered using a novel solar shading design.
The same window design characteristics were applied to options 1 through 4, although window types varied. Double-hung windows offer the best possible results for each performance criteria, followed by sliding, casement, and single-hung windows. Such a window design, with trade-off option 1 attributes, provides 72.3% of occupancy hours inside Category II ventilation rates, an 83.7% CO2 concentration level below the WHO threshold (1000 ppm), and a 70.2% adaptive comfort Category II, and it maintains indoor conditions for 29.8% of hours; altogether, an annual AC load of 11.66 kWh/m2 is needed. Since double-hung and sliding windows allow effective air circulation, particularly in both the wind-driven and buoyancy effects, natural ventilation might occur through double-hung windows. These results are tangible evidence that needs to be considered by architects when making early decisions concerning the window design of offices in the Mediterranean region and similar climatic conditions.
Shading negatively affects NV performance relative to VR and CO2 concentration performance, as can be seen in trade-off option 5, which performs better than the previous design scenarios. Nevertheless, solar shading improves indoor thermal comfort and reduces AC loads. In this situation, a double glass window with low-E coating can be more profitable than triple glass. Conversely, if shading does not exist, a triple glass window is essential if high-performance offices are intended.
4.4. Results of Airflow Rates
Table 15 reports the total annual number of hours at which the ventilation rates, for both occupancy and building pollution, were higher than the lower limit of Category II (VR ≥ 2.1) for the selected trade-off designs. Despite the constant window size (50% of floor area) and other window design features (apart from window type) assigned to scenarios for trade-off options 1–4, the double-hung window provided more acceptability hours (1511 h) of VR than sliding (1502 h), casement (1501 h), and single-hung (1398 h) windows. Therefore, double-hung windows facilitate effective NV to allow fresh air to enter the space, while sliding and casement windows perform similarly relative to airflow rates.
The optimal design solutions for each of the double-hung, sliding, casement, and single-hung windows offer 72.3%, 71.9%, 71.8%, and 66.8% Category II ventilation rate hours annually during office working hours. Due to cold outdoor conditions, which keep windows closed most of the time, January and February recorded lower airflows than the threshold. Therefore, a minimum airflow rate for acceptable indoor air quality needs to be provided using mechanical ventilation, or alternatively, windows should be opened regularly for a short time to replace exhausted indoor air. In general, the window aspect ratio had a minimal impact on the airflow performance; nevertheless, longitudinal (e.g., rectangle) windows were found to be better than the square shape.
Figure 9 shows the monthly ventilation rates for the trade-off designs selected through the analysis of variance and signal-to-noise ratio approach, in which the double-hung, sliding, and casement windows can accomplish Category II minimum amounts of ventilation rates for all months except January and February using the proposed window-opening scheme and MM cut-off temperature. By comparing the VR of trade-off option 3 to trade-off option 5, one can see that external solar shading (in this case, horizontal fins) reduces the NV potential for the airflow rate by 4.8%, but it can simultaneously enhance ambient air’s ventilative cooling potential. The amount of VR reaches 10 L/s·m2 in the spring and autumn months, when windows are open during most of the occupancy hours; thus, the ventilative cooling potential of ambient air facilitates passive cooling. Finally, the small-sized window, namely, 20% WFR, offers 1235 h of Category II VR, 29.2% less effective in bringing fresh air indoors compared to the same window design inputs in the large window (i.e., 50% WFR).
4.5. Results of Carbon Dioxide Concentration
The number of hours for which the level of CO2 concentration is below 1000 ppm during occupancy time is presented in Table 15. The shaded double-hung window (50% WFR) provides around 1749 h out of 2088 h per annum, corresponding to approximately 83.7% of the time. Moreover, sliding, and casement windows offer approximately 83%, while the single-hung window provides 78.1% of the office hours within the CO2 threshold. The mixed-mode cut-off temperature of 31.7 °C closed the windows during the harsh summer days, which resulted in increased CO2 concentration. In the warm and cool periods, the average carbon dioxide concentration was below the WHO threshold. However, when the windows are closed during office working hours, the level of CO2 concentration exceeded the recommended threshold. For example, CO2 concentration rose to over 1400 ppm in July and August when the office window was closed all the time due to hot outside temperatures, regardless of the window type, as shown in Figure 10.
Different window types offered similar results in terms of indoor CO2 concentration. Conversely, window size had a significant effect on the level of carbon dioxide concentration; for instance, a 20% WFR can only provide 69.0% (1441 h) compared to the same scenarios for a large-sized window (83.7%). In addition to a high indoor concentration in the warm months, a small-sized window can cause health-related problems in the cold months. Overall, larger window sizes, with greater opening fractions, allow more airflow to enter indoors, which can lower the level of CO2. The availability of solar shading does not make a considerable difference in regard to CO2 contamination, such as in the case of trade-off options 1 and 5.
4.6. Results of Adaptive Thermal Comfort
In this research, the potential of natural ventilation alone for thermal comfort was studied and reported, and TC during air-conditioning hours was excluded. In other words, the discomfort hours require the operation of mechanical air-conditioning within the MM system. By looking at Figure 11, specifically trade-off options 1–5, the total annual number of comfort hours through NV reaches 90%, meaning that the NV strategy can provide acceptable comfort conditions for nearly all the occupancy time in the cold period. In the other words, these months constitute a free-running period. In June and September, it can cover approximately 40% to 60% of the office working time. However, the minimum number of comfort hours can be found during July (less than 10%) and August (less than 15%) in the summer. Therefore, the AC mode should be working most of the time during July and August compared to the other months.
Nearly all window types with double glass coated with low-E and shading offer similar thermal comfort hours—for reference: double-hung, 70.2%; sliding, 69.5%; casement, 66.04%; and single-hung, 65.8%. In addition, triple glass without shading can offer identical results with a small difference, such as with a casement window at 66.9%. However, a small-sized window (i.e., 20%) can only provide 57.2% comfort hours during office occupancy time. Window location does not have a significant effect on indoor thermal comfort, while a window with an aspect ratio of 1:1 performs better than a window with a 1:2 proportion. Figure 12 illustrates the scatter plot of hourly indoor operative temperature in accordance with an outdoor running mean temperature for each month, employing the Category II upper and lower limits of the BS EN 15251:2007 standard for the optimal design scenarios: (a) O-1 and (b) O-6 (large and small windows, respectively). The hours appearing in between both limits represent the acceptable thermal comfort hours for Category II. The hours exceeding the upper limit correspond to the “too warm” hours in the summertime, particularly in July and August, while those below the lower limit are “too cool” hours in the winter occupancy time.
4.7. Air Conditioning Loads of the Mixed-Mode Strategy and a Fully Airconditioned Case
The operation of air-conditioning within the mixed-mode system began when the indoor operative temperature was higher than 31.7 °C in the warm period or lower than 20 °C in the cool period. These approximately correspond to the upper and lower boundary limits of Category II in the British/European adaptive comfort standards. All the design variables affect AC loads as well as different factorial levels. Generally, the north façade receives a lesser solar ratio; thus, a lesser amount of air-conditioning loads will be required, especially in the absence of solar shading in the cases of the other window orientations that receive more annual solar radiation. Hence, the S/N ratio showed that smaller windows might spend less on MM air-conditioning compared to unshaded large-sized windows.
Large windows (i.e., 50% WFR) with double-hung, sliding, or single-hung properties are more energy-efficient solutions than windows with size a 20% window-to-floor ratio, as well as with respect to the other studied criteria. A 50% WFR with a double-hung shaded square window located in the middle of the wall and double glass low-E utilises 11.66 kWh/m2 annually, whereas a 20% WFR, having the same design variables as the large-sized window, needs a 12.94 kWh/m2 AC load per annum. However, a large-sized shaded casement window with double glass low-E seems to be an inefficient window type in relation to AC load, requiring 14.94 kWh/m2 annually, which is even more than the unshaded casement window with triple glass (14.56 kWh/m2). When a designer does not apply a solar shading device, a high-performance window property (e.g., triple glass) must be used to achieve results nearly equal to a shaded window with a higher glazing U-value. Regardless of the window size, glazing property, location, or proportion, windows in southern and the northern external walls constitute the most efficient window orientations; therefore, these windows allow a greater amount of natural ventilation to be harnessed, thus facilitating less dependence on active AC systems.
The monthly air-conditioning loads for trade-off design scenarios are presented in Figure 13. High outdoor running mean temperatures cause elevated indoor operative temperatures in July and August, in which the Category II upper limit, 31.7 °C (cooling setpoint), is surpassed during most office working hours; thus, the maximum AC loads were recorded in these months. In nearly all the design scenarios, the cool period represents the free-running (no mechanical systems in operation) months, while in the rest of the months, both the natural ventilation and air-conditioning modes of the mixed-mode system were alternated. Unshaded high-performance windows (trade-off option 5) and shaded small-sized windows (trade-off option 6) utilise a small amount of AC load in the cool months. Conversely, if the air-conditioning is controlled by the adaptive comfort upper and lower limits of a particular category, the results might not be identical to the previous cases. This study used constant cooling and heating setpoints for the activation of AC; this was due to the limitations of the current dynamic simulation software. In this case, the results of the “comfort hours” indicator can better define the free-running hours. Overall, double-hung and sliding windows are more efficient window types than single-hung and casement windows, respectively.
In order to assess the performance of the mixed-mode system against a fully air-conditioned scenario, the air-conditioning loads of the O-1 trade-off design were compared to an identical design case with a fully AC system, using 20 °C and 26 °C for the heating and cooling temperatures, respectively, as suggested in Category II of the BS EN 15251:2007 standard, illustrated in Figure 14. In July and August, the fully AC scenario used more than 11.0 kWh/m2, nearly 7.0 kWh/m2 more compared to the MM system. In the heating season, particularly January, February, and March, both MM and AC systems performed similarly due to assigning the same heating setpoint temperature (i.e., 20 °C) to both systems, although the fully AC system consumed more energy. The total annual cooling and heating loads for the fully AC and MM cases were 56.63 and 11.66 kWh/m2, respectively. Accordingly, the mixed-mode system can reduce cooling and heating loads by 79.41% compared to a fully AC cellular office, taking into account the design specifications of the O-1 trade-off design in the climatic conditions of Famagusta, North Cyprus. An almost similar reduction in air-conditioning loads was also observed in the results of a field study [77], in which the mixed-mode office consumed less than a quarter of the energy required by a similar fully air-conditioned space; a nearly 45% reduction was reported in another study [7].
5. Conclusions
This study presented a performance-based window design and evaluation model for NV and MM offices. The applicability of the proposed model was tested on the window design of a naturally ventilated single office with additional cooling and heating (mixed-mode conditioning) in a Mediterranean climate. Multiple window design variables and levels were assessed using the Taguchi orthogonal array, ANOVA analysis, and S/N ratio approach, which are suggested in the model. The investigations included the study of window size, orientation, window type, glazing property, aspect ratio, location, and window shading in relation to the potential of NV to achieve acceptable indoor air and thermal comfort with significantly reduced air conditioning loads using a mixed-mode strategy. Suggested in the model stages, an hourly dynamic simulation method was utilised to measure the CO2 concentration levels, airflow rate, adaptive thermal comfort, and cooling/heating loads, taking the hours in which a specific criterion was satisfied as the calculated indicator. The analysis of variance results revealed the effectiveness of each variable on the selected performance criteria, as stated below.
5.1. Contribution of Window Design Parameters to Airflow Rate and CO2 Concentration
- Window size was in the first rank or scored the highest percentage of contribution (81.59% and 73.54%, respectively), followed by window orientation and type.
5.2. Contribution of Window Design Parameters to Adaptive Thermal Comfort
- Window orientation plays a vital role in providing comfortable indoor conditions, with a percentage of contribution of 58.12%. Window orientation is significantly correlated with the position of the sun and the direction of the wind, determining the amount of air and solar radiation permitted into the space.
5.3. Contribution of Window Design Parameters to the Supplementary Air Conditioning Loads
- The supplementary AC load required to retain indoor thermal conditions when NV is not sufficient is highly influenced by the window’s glazing property (or U-value), for which the percentage of contribution was recorded at 29.36%.
- Window orientation, size, type, and external shading are the most significant parameters affecting the energy-efficient MM office, with their individual factor effectiveness calculated as 26.52%, 14.79%, 11.44%, and 8.09%, respectively.
Accordingly, trade-off designs with near-optimal combinations were selected and further studied. The outcome of the O-1 trade-off design revealed that the ventilation rate met the minimum VR ≥ 2.1 for approximately 72.3% of the annual office working hours. The level of CO2 concentration did not exceed the 1000 ppm threshold for 83.7% of the time. The indoor operative temperature was within the Category II temperature ranges of the adaptive comfort approximately 70.2% of the occupancy time, constituting the free-running period, while air-conditioning was required for the remainder of the time to sustain indoor thermal comfort conditions, requiring 11.66 kWh/m2. Up to 90% of the office working hours in January, February, March, April, May, October, November, and December constitute the free-running period based on the number of comfort hours designated by the BS EN 15251 standard adaptive model.
Conversely, as a result of the elevated outdoor air temperature, ventilative cooling could only offer 5–15% adaptive comfort hours in July and August, as well as 40–60% in June and September. Nonetheless, the mixed-mode system resulted in a 79.41% reduction in cooling/heating loads relative to a fully air-conditioned scenario, considering the conditions of this study. The reduction in air-conditioning loads is also similar to the results reported by a reviewed field study.
Author Contributions
Conceptualization, H.K.A. and H.Z.A.; methodology, H.K.A.; software, H.K.A.; validation, H.K.A. and H.Z.A.; formal analysis, H.K.A.; investigation, H.K.A.; resources, H.Z.A.; data curation, H.K.A.; writing—original draft preparation, H.K.A.; writing—review and editing, H.K.A. and H.Z.A.; visualization, H.K.A.; supervision, H.Z.A.; project administration, H.Z.A.; funding acquisition, H.Z.A. All authors have read and agreed to the published version of the manuscript.
Funding
This research received no external funding.
Institutional Review Board Statement
Not applicable.
Informed Consent Statement
Not applicable.
Data Availability Statement
Not applicable.
Conflicts of Interest
The authors declare no conflict of interest.
References
- DeDear, R.J.; Brager, G.S. Thermal Comfort in Naturally Ventilated Buildings: Revisions to ASHRAE Standard 55. Energy Build. 2002, 34, 549–561. [Google Scholar] [CrossRef] [Green Version]
- Fang, L.; Wargocki, P.; Witterseh, T.; Clausen, G.; Fanger, P.O. Field Study on the Impact of Temperature, Humidity and Ventilation on Perceived Air Quality. In Proceedings of the Indoor Air, Edinburgh, Scotland, 8–13 August 1999; pp. 107–112. [Google Scholar]
- Jia, L.-R.; Han, J.; Chen, X.; Li, Q.-Y.; Lee, C.-C.; Fung, Y.-H. Interaction between Thermal Comfort, Indoor Air Quality and Ventilation Energy Consumption of Educational Buildings: A Comprehensive Review. Buildings 2021, 11, 591. [Google Scholar] [CrossRef]
- Larsen, T.S.; Heiselberg, P. Single-Sided Natural Ventilation Driven by Wind Pressure and Temperature Difference. Energy Build. 2008, 40, 1031–1040. [Google Scholar] [CrossRef]
- Abdullah, H.K.; Alibaba, H.Z. Towards Nearly Zero-Energy Buildings: The Potential of Photovoltaic-Integrated Shading Devices To Achieve Autonomous Solar Electricity and Acceptable Thermal Comfort in Naturally-Ventilated Office Spaces. In Proceedings of the 16th International Conference on Clean Energy, Philadelphia, PA, USA, 9–11 May 2018; Eastern Mediterranean University: Famagusta, North Cyprus, 2018; pp. 1–11. [Google Scholar]
- Mora-pérez, M.; Guillen-guillamón, I.; López-patiño, G.; López-jiménez, P.A. Natural Ventilation Building Design Approach in Mediterranean Regions—A Case Study at the Valencian Coastal Regional Scale (Spain). Sustainability 2016, 8, 855. [Google Scholar] [CrossRef] [Green Version]
- Duan, Z.; Sun, Y.; Wang, M.; Hu, R.; Dong, X. Evaluation of Mixed-Mode Ventilation Thermal Performance and Energy Saving Potential from Retrofitting a Beijing Office Building. Buildings 2022, 12, 793. [Google Scholar] [CrossRef]
- Zhai, Z.; El Mankibi, M.; Zoubir, A. Review of Natural Ventilation Models. Energy Procedia 2015, 78, 2700–2705. [Google Scholar] [CrossRef] [Green Version]
- Kleiven, T. Natural Ventilation in Buildings: Architectural Concepts, Consequences and Possibilities; Norwegian University of Science and Technology: Trondheim, Norway, 2003. [Google Scholar]
- Tran, T. Optimization of Natural Ventilation Design in Hot and Humid Climates Using Building Energy Simulation; University of Hawai’i: Honolulu, HI, USA, 2013. [Google Scholar]
- Inanici, M.N.; Demirbilek, F.N. Thermal Performance Optimization of Building Aspect Ratio and South Window Size in Five Cities Having Different Climatic Characteristics of Turkey. Build. Environ. 2000, 35, 41–52. [Google Scholar] [CrossRef]
- Elshafei, G.; Negm, A.; Bady, M.; Suzuki, M.; Ibrahim, M.G. Numerical and Experimental Investigations of the Impacts of Window Parameters on Indoor Natural Ventilation in a Residential Building. Energy Build. 2017, 141, 321–332. [Google Scholar] [CrossRef]
- Shetabivash, H. Investigation of Opening Position and Shape on the Natural Cross Ventilation. Energy Build. 2015, 93, 1–15. [Google Scholar] [CrossRef]
- Stavrakakis, G.M.; Zervas, P.L.; Sarimveis, H.; Markatos, N.C. Optimization of Window-Openings Design for Thermal Comfort in Naturally Ventilated Buildings. Appl. Math. Model. 2012, 36, 193–211. [Google Scholar] [CrossRef]
- Yin, W.; Zhang, G.; Yang, W.; Wang, X. Natural Ventilation Potential Model Considering Solution Multiplicity, Window Opening Percentage, Air Velocity and Humidity in China. Build. Environ. 2010, 45, 338–344. [Google Scholar] [CrossRef]
- Gao, C.F.; Lee, W.L. Evaluating the Influence of Openings Configuration on Natural Ventilation Performance of Residential Units in Hong Kong. Build. Environ. 2011, 46, 961–969. [Google Scholar] [CrossRef]
- Roetzel, A.; Tsangrassoulis, A.; Dietrich, U.; Busching, S. A Review of Occupant Control on Natural Ventilation. Renew. Sustain. Energy Rev. 2010, 14, 1001–1013. [Google Scholar] [CrossRef]
- Albatayneh, A. Optimising the Parameters of a Building Envelope in the East Mediterranean Saharan, Cool Climate Zone. Buildings 2021, 11, 43. [Google Scholar] [CrossRef]
- Fadzil, S.F.S.; Abdullah, A.; Harun, W.M.W. The Impact of Varied Orientation and Wall Window Ratio (WWR) To Daylight Distribution in Residental Rooms. In Proceedings of the CIBW 107 International Symposium on Construction in Developing Economies: Commonalities Among Diversities, Penang, Malaysia, 5–7 October 2009; pp. 478–486. [Google Scholar]
- Wagdy, A.; Sherif, A.; Sabry, H.; Arafa, R.; Mashaly, I. Daylighting Simulation for the Configuration of External Sun-Breakers on South Oriented Windows of Hospital Patient Rooms under a Clear Desert Sky. Sol. Energy 2017, 149, 164–175. [Google Scholar] [CrossRef]
- AlAnzi, A.; Seo, D.; Krarti, M. Impact of Building Shape on Thermal Performance of Office Buildings in Kuwait. Energy Convers. Manag. 2009, 50, 822–828. [Google Scholar] [CrossRef]
- Pedrini, A.; Vilar De Carvalho, J.P. Analysis of Daylight Performance in Classrooms in Humid and Hot Climate. In Proceedings of the 30th International PLEA Conference, Gujarat, India, 16–18 December 2014; CEPT University: Ahmedabad, India, 2014; pp. 1–10. [Google Scholar]
- Aflaki, A.; Mahyuddin, N.; Al-Cheikh Mahmoud, Z.; Baharum, M.R. A Review on Natural Ventilation Applications through Building Façade Components and Ventilation Openings in Tropical Climates. Energy Build. 2015, 101, 153–162. [Google Scholar] [CrossRef]
- Alibaba, H.Z. Determination of Optimum Window to External Wall Ratio for Offices in a Hot and Humid Climate. Sustainability 2016, 8, 187. [Google Scholar] [CrossRef] [Green Version]
- Sacht, H.; Lukiantchuki, M.A. Windows Size and the Performance of Natural Ventilation. Procedia Eng. 2017, 196, 972–979. [Google Scholar] [CrossRef]
- Huang, K.; Feng, G.; Li, H.; Yu, S. Opening Window Issue of Residential Buildings in Winter in North China: A Case Study in Shenyang. Energy Build. 2014, 84, 567–574. [Google Scholar] [CrossRef]
- Al-Tamimi, N.A.M.; Syed Fadzil, S.F.; Wan Harun, W.M. The Effects of Orientation, Ventilation, and Varied WWR on the Thermal Performance of Residential Rooms in the Tropics. J. Sustain. Dev. 2011, 4, 142. [Google Scholar] [CrossRef]
- KTMMOB Chapter 96 Regulation: The Streets and Buildings Regulation. Available online: http://www.mimarlarodasi.org/tr/mevzuat/fasil-96-duzenleme/ (accessed on 21 May 2019).
- Rilling, D.; Han Siang, S.; Hui Siang, S. Thermal Simulation as Design Tool for Residential Buildings in Southeast Asia. J. Alam Bina 2007, 9, 45–54. [Google Scholar]
- Shaeri, J.; Habibi, A.; Yaghoubi, M.; Chokhachian, A. The Optimum Window-to-Wall Ratio in Office Buildings for Hot-Humid, Hot-Dry, and Cold Climates in Iran. Environments 2019, 6, 45. [Google Scholar] [CrossRef] [Green Version]
- NAFS. AAMA/NWWDA/CSA 101/I.S.2/A440-08—North. American Fenestration Standard/Specification for Windows, Doors, and Skylights; NAFS: Schaumburg, IL, USA, 2008. [Google Scholar]
- Wang, H.; Chen, Q. Modeling of the Impact of Different Window Types on Single-Sided Natural Ventilation. Energy Procedia 2015, 78, 1549–1555. [Google Scholar] [CrossRef] [Green Version]
- Gough, H.L.; Barlow, J.F.; Luo, Z.; King, M.F.; Halios, C.H.; Grimmond, C.S.B. Evaluating Single-Sided Natural Ventilation Models against Full-Scale Idealised Measurements: Impact of Wind Direction and Turbulence. Build. Environ. 2020, 170, 106556. [Google Scholar] [CrossRef]
- Liu, T.; Lee, W.L. Using Response Surface Regression Method to Evaluate the Influence of Window Types on Ventilation Performance of Hong Kong Residential Buildings. Build. Environ. 2019, 154, 167–181. [Google Scholar] [CrossRef]
- Heiselberg, P.; Svidt, K.; Nielsen, P.V. Characteristics of Airflow from Open Windows. Build. Environ. 2001, 36, 859–869. [Google Scholar] [CrossRef]
- Yang, C.; Shi, H.; Yang, X.; Zhao, B. Research on Flow Resistance Characteristics with Different Window/Door Opening Angles. HVAC R Res. 2010, 16, 813–824. [Google Scholar] [CrossRef]
- Wang, H.; Karava, P.; Chen, Q. Development of Simple Semiempirical Models for Calculating Airflow through Hopper, Awning, and Casement Windows for Single-Sided Natural Ventilation. Energy Build. 2015, 96, 373–384. [Google Scholar] [CrossRef]
- Andersen, R.; Fabi, V.; Toftum, J.; Corgnati, S.P.; Olesen, B.W. Window Opening Behaviour Modelled from Measurements in Danish Dwellings. Build. Environ. 2013, 69, 101–113. [Google Scholar] [CrossRef]
- Rodrigues, A.M.; Santos, M.; Gomes, M.G.; Duarte, R. Impact of Natural Ventilation on the Thermal and Energy Performance of Buildings in a Mediterranean Climate. Buildings 2019, 9, 123. [Google Scholar] [CrossRef] [Green Version]
- Xiao, Y.; Wang, L.; Yu, M.; Liu, H.; Liu, J. Effects of Source Emission and Window Opening on Winter Indoor Particle Concentrations in the Severe Cold Region of China. Build. Environ. 2018, 144, 23–33. [Google Scholar] [CrossRef]
- Li, N.; Li, J.; Fan, R.; Jia, H. Probability of Occupant Operation of Windows during Transition Seasons in Office Buildings. Renew. Energy 2015, 73, 84–91. [Google Scholar] [CrossRef]
- Lai, H.K.; Kendall, M.; Ferrier, H.; Lindup, I.; Alm, S.; Hänninen, O.; Jantunen, M.; Mathys, P.; Colvile, R.; Ashmore, M.R.; et al. Personal Exposures and Microenvironment Concentrations of PM2.5, VOC, NO2and CO in Oxford, UK. Atmos. Environ. 2004, 38, 6399–6410. [Google Scholar] [CrossRef]
- Deme Belafi, Z.; Naspi, F.; Arnesano, M.; Reith, A.; Revel, G.M. Investigation on Window Opening and Closing Behavior in Schools through Measurements and Surveys: A Case Study in Budapest. Build. Environ. 2018, 143, 523–531. [Google Scholar] [CrossRef]
- Markovic, R.; Grintal, E.; Wölki, D.; Frisch, J.; van Treeck, C. Window Opening Model Using Deep Learning Methods. Build. Environ. 2018, 145, 319–329. [Google Scholar] [CrossRef] [Green Version]
- Stazi, F.; Naspi, F.; Ulpiani, G.; Di Perna, C. Indoor Air Quality and Thermal Comfort Optimization in Classrooms Developing an Automatic System for Windows Opening and Closing. Energy Build. 2017, 139, 732–746. [Google Scholar] [CrossRef]
- Tahmasebi, F.; Mahdavi, A. An Inquiry into the Reliability of Window Operation Models in Building Performance Simulation. Build. Environ. 2016, 105, 343–357. [Google Scholar] [CrossRef] [Green Version]
- Dhalluin, A.; Limam, K. Comparison of Natural and Hybrid Ventilation Strategies Used in Classrooms in Terms of Indoor Environmental Quality, Comfort and Energy Savings. Indoor Built Environ. 2012, 23, 527–542. [Google Scholar] [CrossRef]
- Psomas, T.; Fiorentini, M.; Kokogiannakis, G.; Heiselberg, P. Ventilative Cooling through Automated Window Opening Control Systems to Address Thermal Discomfort Risk during the Summer Period: Framework, Simulation and Parametric Analysis. Energy Build. 2017, 153, 18–30. [Google Scholar] [CrossRef] [Green Version]
- Sorgato, M.J.; Melo, A.P.; Lamberts, R. The Effect of Window Opening Ventilation Control on Residential Building Energy Consumption. Energy Build. 2016, 133, 1–13. [Google Scholar] [CrossRef]
- Chen, C.-P.; Hwang, R.-L.; Liu, W.; Shih, W.-M.; Chang, S.-Y. The Influence of Air-Conditioning Managerial Scheme in Hybrid-Ventilated Classrooms on Students’ Thermal Perception. Indoor Built Environ. 2015, 24, 761–770. [Google Scholar] [CrossRef]
- Daish, N.C.; Carrilho da Graça, G.; Linden, P.F.; Banks, D. Impact of Aperture Separation on Wind-Driven Single-Sided Natural Ventilation. Build. Environ. 2016, 108, 122–134. [Google Scholar] [CrossRef] [Green Version]
- Vigener, N.; Brown, M.A. Whole Building Desing Guide. Available online: https://www.wbdg.org/guides-specifications/building-envelope-design-guide (accessed on 18 November 2021).
- Ercan, B.; Elias-Ozkan, S.T. Performance-Based Parametric Design Explorations: A Method for Generating Appropriate Building Components. Des. Stud. 2015, 38, 33–53. [Google Scholar] [CrossRef]
- Lavin, C.; Fiorito, F. Optimization of an External Perforated Screen for Improved Daylighting and Thermal Performance of an Office Space. Procedia Eng. 2017, 180, 571–581. [Google Scholar]
- Mirrahimi, S.; Mohamed, M.F.; Haw, L.C.; Ibrahim, N.L.N.; Yusoff, W.F.M.; Aflaki, A. The Effect of Building Envelope on the Thermal Comfort and Energy Saving for High-Rise Buildings in Hot-Humid Climate. Renew. Sustain. Energy Rev. 2016, 53, 1508–1519. [Google Scholar] [CrossRef]
- Miran, F.D.; Abdullah, H.K. Evaluation of the Optimal Solar Shading Devices for Enhancing Daylight Performance of School Building (A Case Study of Semi-Arid Climate—Erbil City). ZANCO J. Pure Appl. Sci. 2016, 28, 580–598. [Google Scholar]
- Kalay, Y.E. Performance-Based Design. SFPE Handb. Fire Prot. Eng. Fifth Ed. 1999, 8, 395–409. [Google Scholar] [CrossRef]
- Gagne, J. An Interactive Performance-Based Expert System for Daylighting in Architectural Design; Massachusetts Institute of Technology: Cambridge, MA, USA, 2011. [Google Scholar]
- Petersen, S.; Svendsen, S. Method and Simulation Program Informed Decisions in the Early Stages of Building Design. Energy Build. 2010, 42, 1113–1119. [Google Scholar] [CrossRef]
- Abdullah, H.K.; Alibaba, H.Z. Window Design of Naturally Ventilated Offices in the Mediterranean Climate in Terms of CO2 and Thermal Comfort Performance. Sustainability 2020, 12, 473. [Google Scholar] [CrossRef] [Green Version]
- Aldawoud, A. Windows Design for Maximum Cross-Ventilation in Buildings. Adv. Build. energy Res. 2017, 11, 67–86. [Google Scholar] [CrossRef]
- Taguchi, G.; Yokoyama, Y. Taguchi Methods: Design of Experiments; American Supplier Institute: Dearborn, MI, USA, 1994. [Google Scholar]
- Roy, R.K. A Primer on the Taguchi Method Dearborn; Society of Manufacturing Engineer: Southfield, MI, USA, 2010. [Google Scholar]
- Nimlyat, P.S.; Dassah, E. Computer Simulations In Buildings: Implications For Building Energy Performance. IOSR J. Eng. 2014, 4, 56–62. [Google Scholar] [CrossRef]
- EDSL TAS Engineering (Computer Software), v.9.5.0; Envieonmental Desing Solutions Ltd.: Stony Stratford, UK, 2019.
- EN 15251; BS EN 15251—Indoor Environmental Input Parameters for Design and Assessment of Energy Performance of Buildings Addressing Indoor Air Quality, Thermal Environment. Lighting and Acoustics. British Standards Institution (BSI): London, UK, 2007.
- WHO. Air Quality Guidelines for Europe, 2nd ed.; European Series, No. 91; World Health Organization Regional Office for Europe: Copenhagen, Denmark, 2000; ISBN 92 890 1358 3.
- ASHRAE; ANSI/ASHRAE Standard 62.1—Ventilation for Acceptable Indoor Air Quality. American National Standard Institute (ANSI) and American Society of Heating, Refrigerating, and Air-Conditioning Engineers (ASHRAE): Atlanta, GA, USA, 2019.
- BS EN 13779; BS EN 13779—Ventilation for Non-Residential Buildings—Performance Requirements for Ventilation and Room-Conditioning Systems. British Standards Institution (BSI): London, UK, 2007.
- Erdman, C.A.; Steiner, K.C.; Apte, M.A. Indoor Carbon Dioxide Concentrations and Sick Building Syndrome Symptoms in the Base Study Revisited: Analyses of the 100 Building Dataset. Indoor Air 2002, 443–448. [Google Scholar]
- Fanger, P.O. Thermal Comfort; Danish Technical Press: Copenhagen, Denmark, 1970. [Google Scholar]
- Nguyen, A.T.; Singh, M.K.; Reiter, S. An Adaptive Thermal Comfort Model for Hot Humid South-East Asia. Build. Environ. 2012, 56, 291–300. [Google Scholar] [CrossRef] [Green Version]
- Humphreys, M.A.; Nicol, J.F.; Raja, I.A. Field Studies of Indoor Thermal Comfort and the Progress of the Adaptive Approach. Adv. Build. Energy Res. 2007, 1, 55–88. [Google Scholar] [CrossRef]
- de Wilde, P.; Tian, W. The Role of Adaptive Thermal Comfort in the Prediction of the Thermal Performance of a Modern Mixed-Mode Office Building in the UK under Climate Change. J. Build. Perform. Simul. 2010, 3, 87–101. [Google Scholar] [CrossRef]
- Nicol, F.; Humphreys, M. Derivation of the Adaptive Equations for Thermal Comfort in Free-Running Buildings in European Standard EN15251. Build. Environ. 2010, 45, 11–17. [Google Scholar] [CrossRef]
- Deng, X.; Tan, Z. Numerical Analysis of Local Thermal Comfort in a Plan Office under Natural Ventilation. Indoor Built Environ. 2020, 29, 972–986. [Google Scholar] [CrossRef]
- Rowe, D. A Study of a Mixed Mode Environment in 25 Cellular Offices at the University of Sydney. Int. J. Vent. 2003, 1, 53–64. [Google Scholar] [CrossRef]
- Halawa, E.; Van Hoof, J. The Adaptive Approach to Thermal Comfort: A Critical Overview. Energy Build. 2012, 51, 101–110. [Google Scholar] [CrossRef]
- Emmerich, S.J.; Polidoro, B.; Axley, J.W. Impact of Adaptive Thermal Comfort on Climatic Suitability of Natural Ventilation in Office Buildings. Energy Build. 2011, 43, 2101–2107. [Google Scholar] [CrossRef]
- Belleri, A.; Avantaggiato, M.; Psomas, T.; Heiselberg, P. Evaluation Tool of Climate Potential for Ventilative Cooling. Int. J. Vent. 2018, 17, 196–208. [Google Scholar] [CrossRef] [Green Version]
- Abdullah, H.K.; Alibaba, H.Z. Open-Plan Office Design for Improved Natural Ventilation and Reduced Mixed Mode Supplementary Loads. Indoor Built Environ. 2020, 0, 1–23. [Google Scholar] [CrossRef]
- CIBSE. Guide A: Environmental Design; The Chartered Institution of Building Services Engineers (CIBSE): London, UK, 2015. [Google Scholar]
- ASHRAE. ANSI/ASHRAE Standard 90.1—Energy Standard for Buildings Except Low-Rise Residential Buildings; American National Standard Institute (ANSI) and American Society of Heating, Refrigerating and Air-Conditioning Engineers (ASHRAE): Atlanta, GA, USA, 2016. [Google Scholar]
- Kottek, M.; Grieser, J.; Beck, C.; Rudolf, B.; Rubel, F. World Map of the Köppen-Geiger Climate Classification Updated. Meteorol. Z. 2006, 15, 259–263. [Google Scholar] [CrossRef]
- ASHRAE. International Weather for Energy Calculations (IWEC Weather Files) User’s Manual and CD-ROM; ASHRAE: Atlanta, GA, USA, 2001. [Google Scholar]
- ASHRAE; ANSI/ASHRAE Standard 55—Thermal Environmental Conditions for Human Occupancy. American National Standard Institute (ANSI) and American Society of Heating, Refrigerating and Air-Conditioning Engineers (ASHRAE): Atlanta, GA, USA, 2017.
- ASHRAE. ASHRAE Handbook: Fundamentals; American Society of Heating, Refrigerating and Air-Conditioning Engineers: Atlanta, GA, USA, 2013. [Google Scholar]
- Du Bois, D.; Du Bois, E.F. A Formula to Estimate the Approximate Surface Area If Height and Weight Be Known. Arch. Intern. Med. 1916, 17, 863–871. [Google Scholar] [CrossRef] [Green Version]
Figure 1.
The framework of the proposed model.
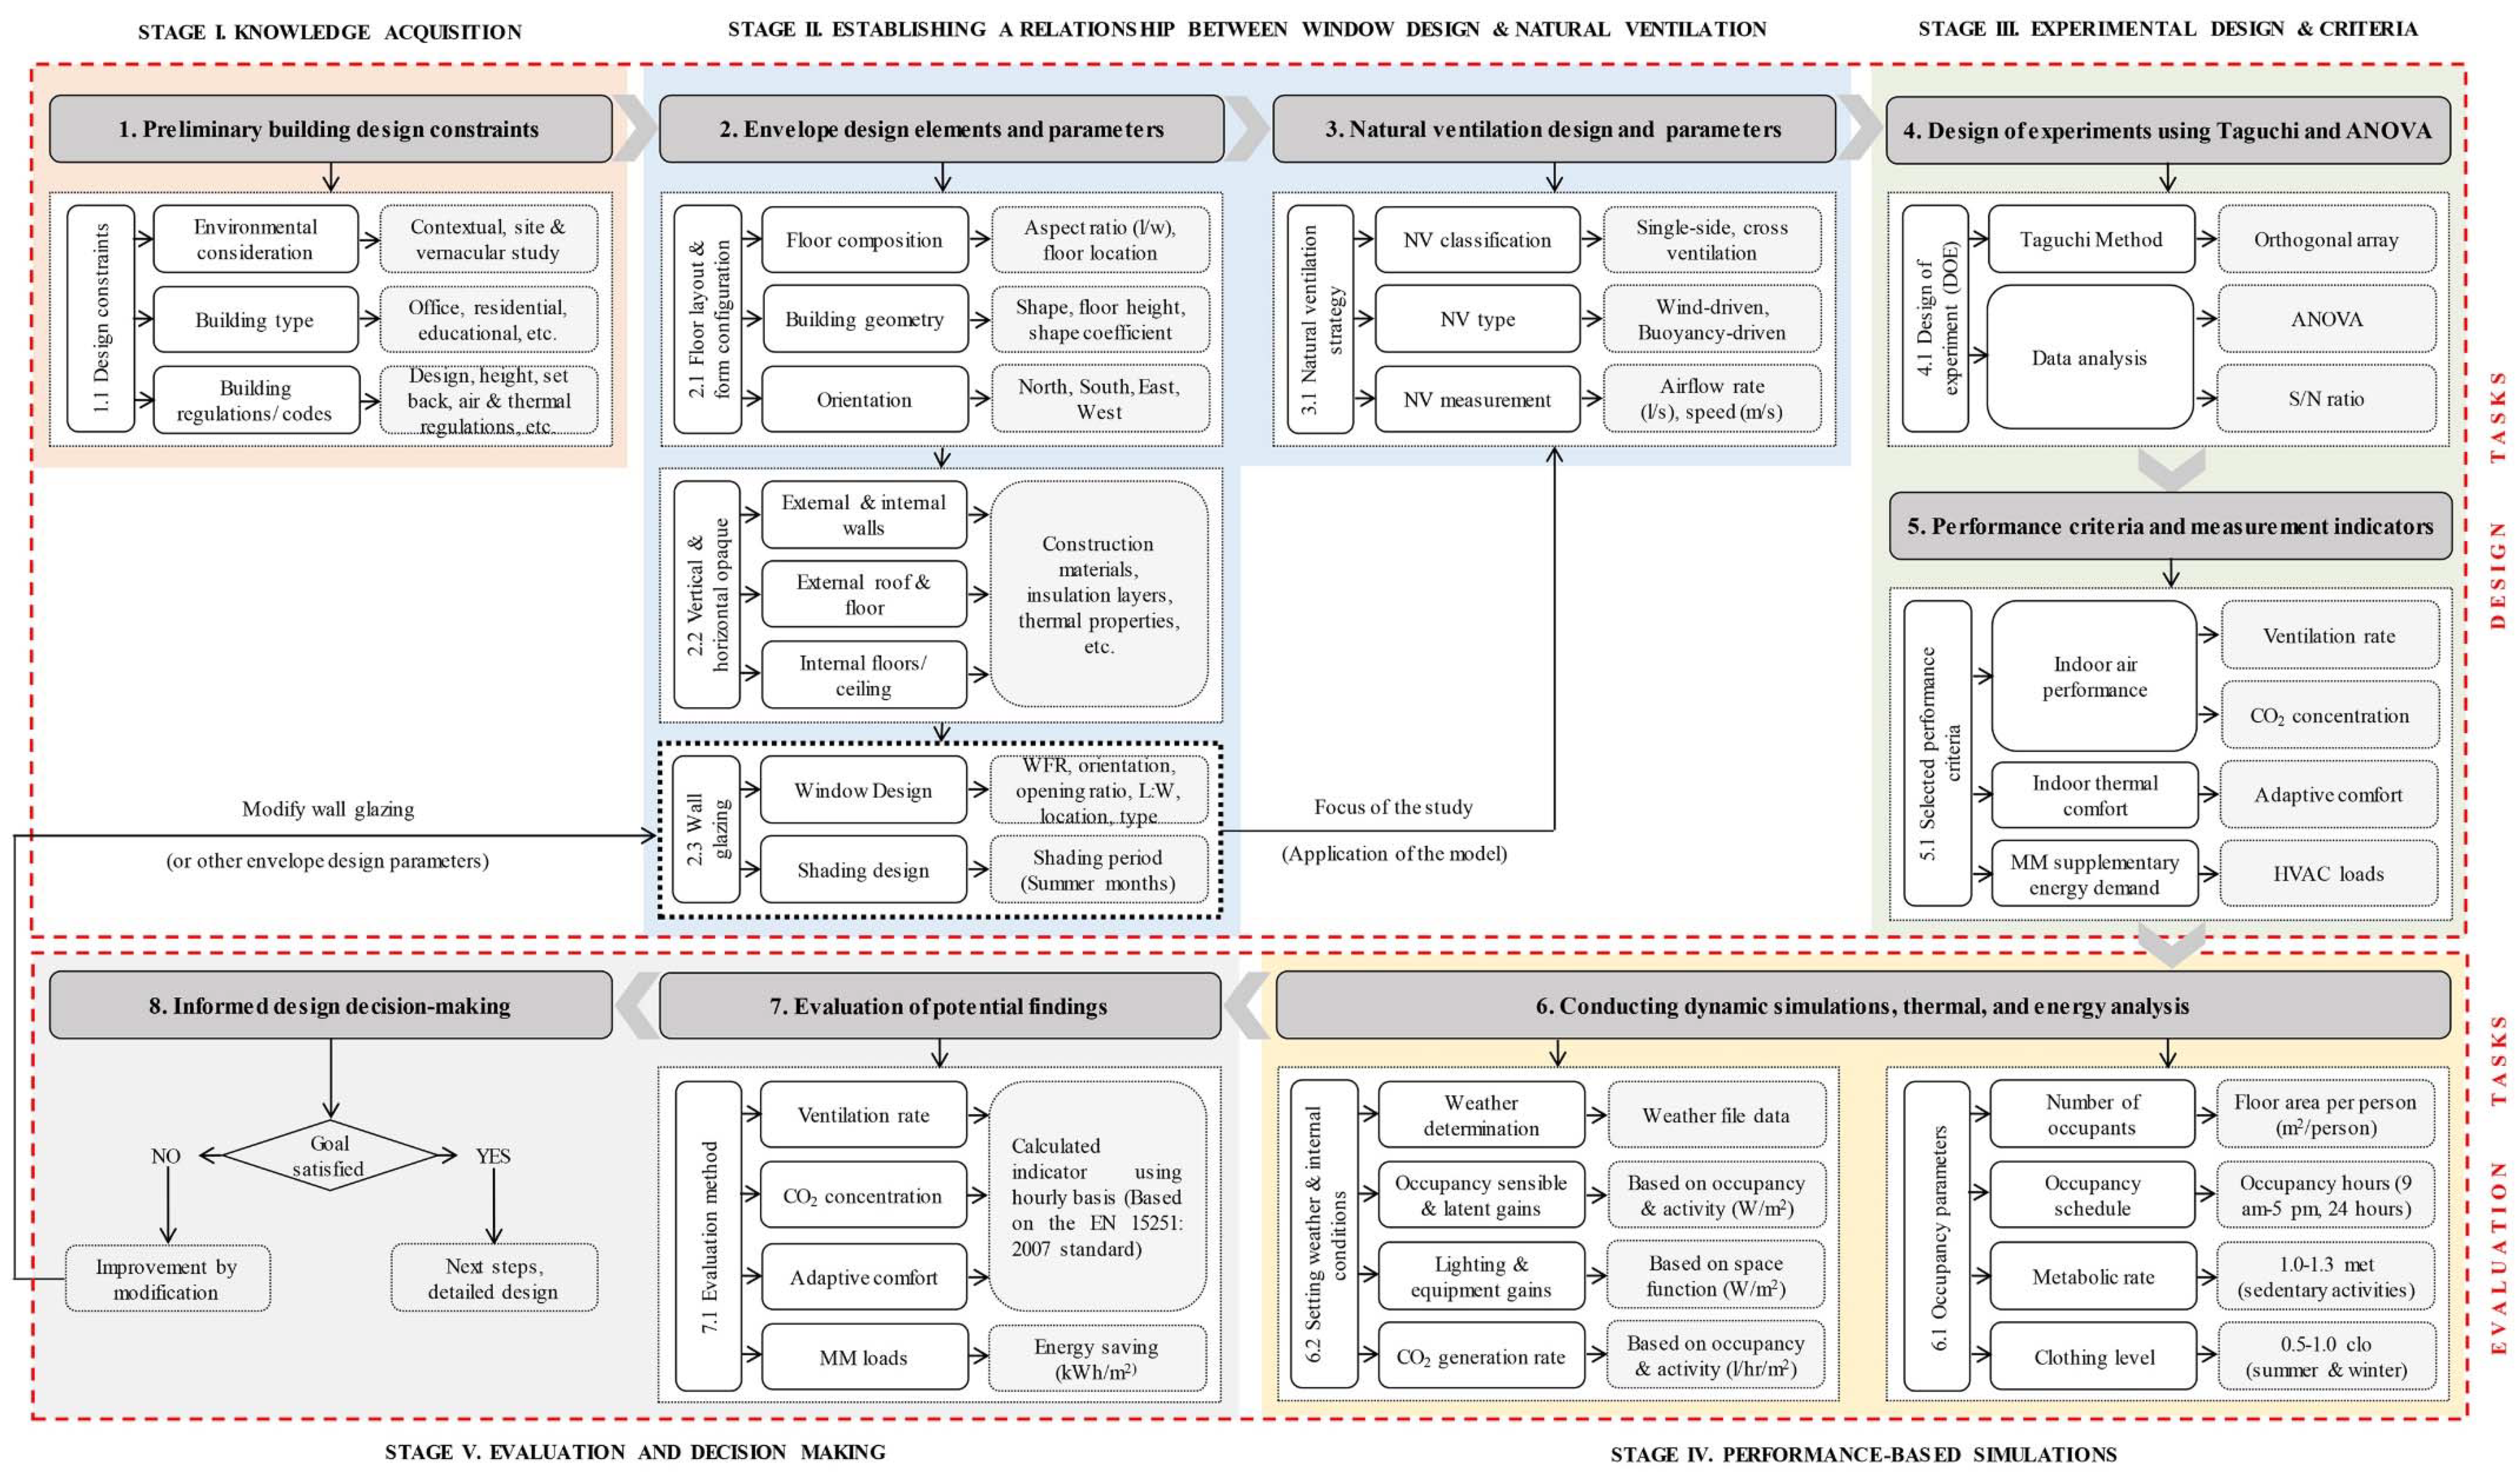
Figure 2.
Evaluation model used to assess findings from the proposed window design model.

Figure 3.
Famagusta climate characteristics on (a) 21st January and (b) 21st July.
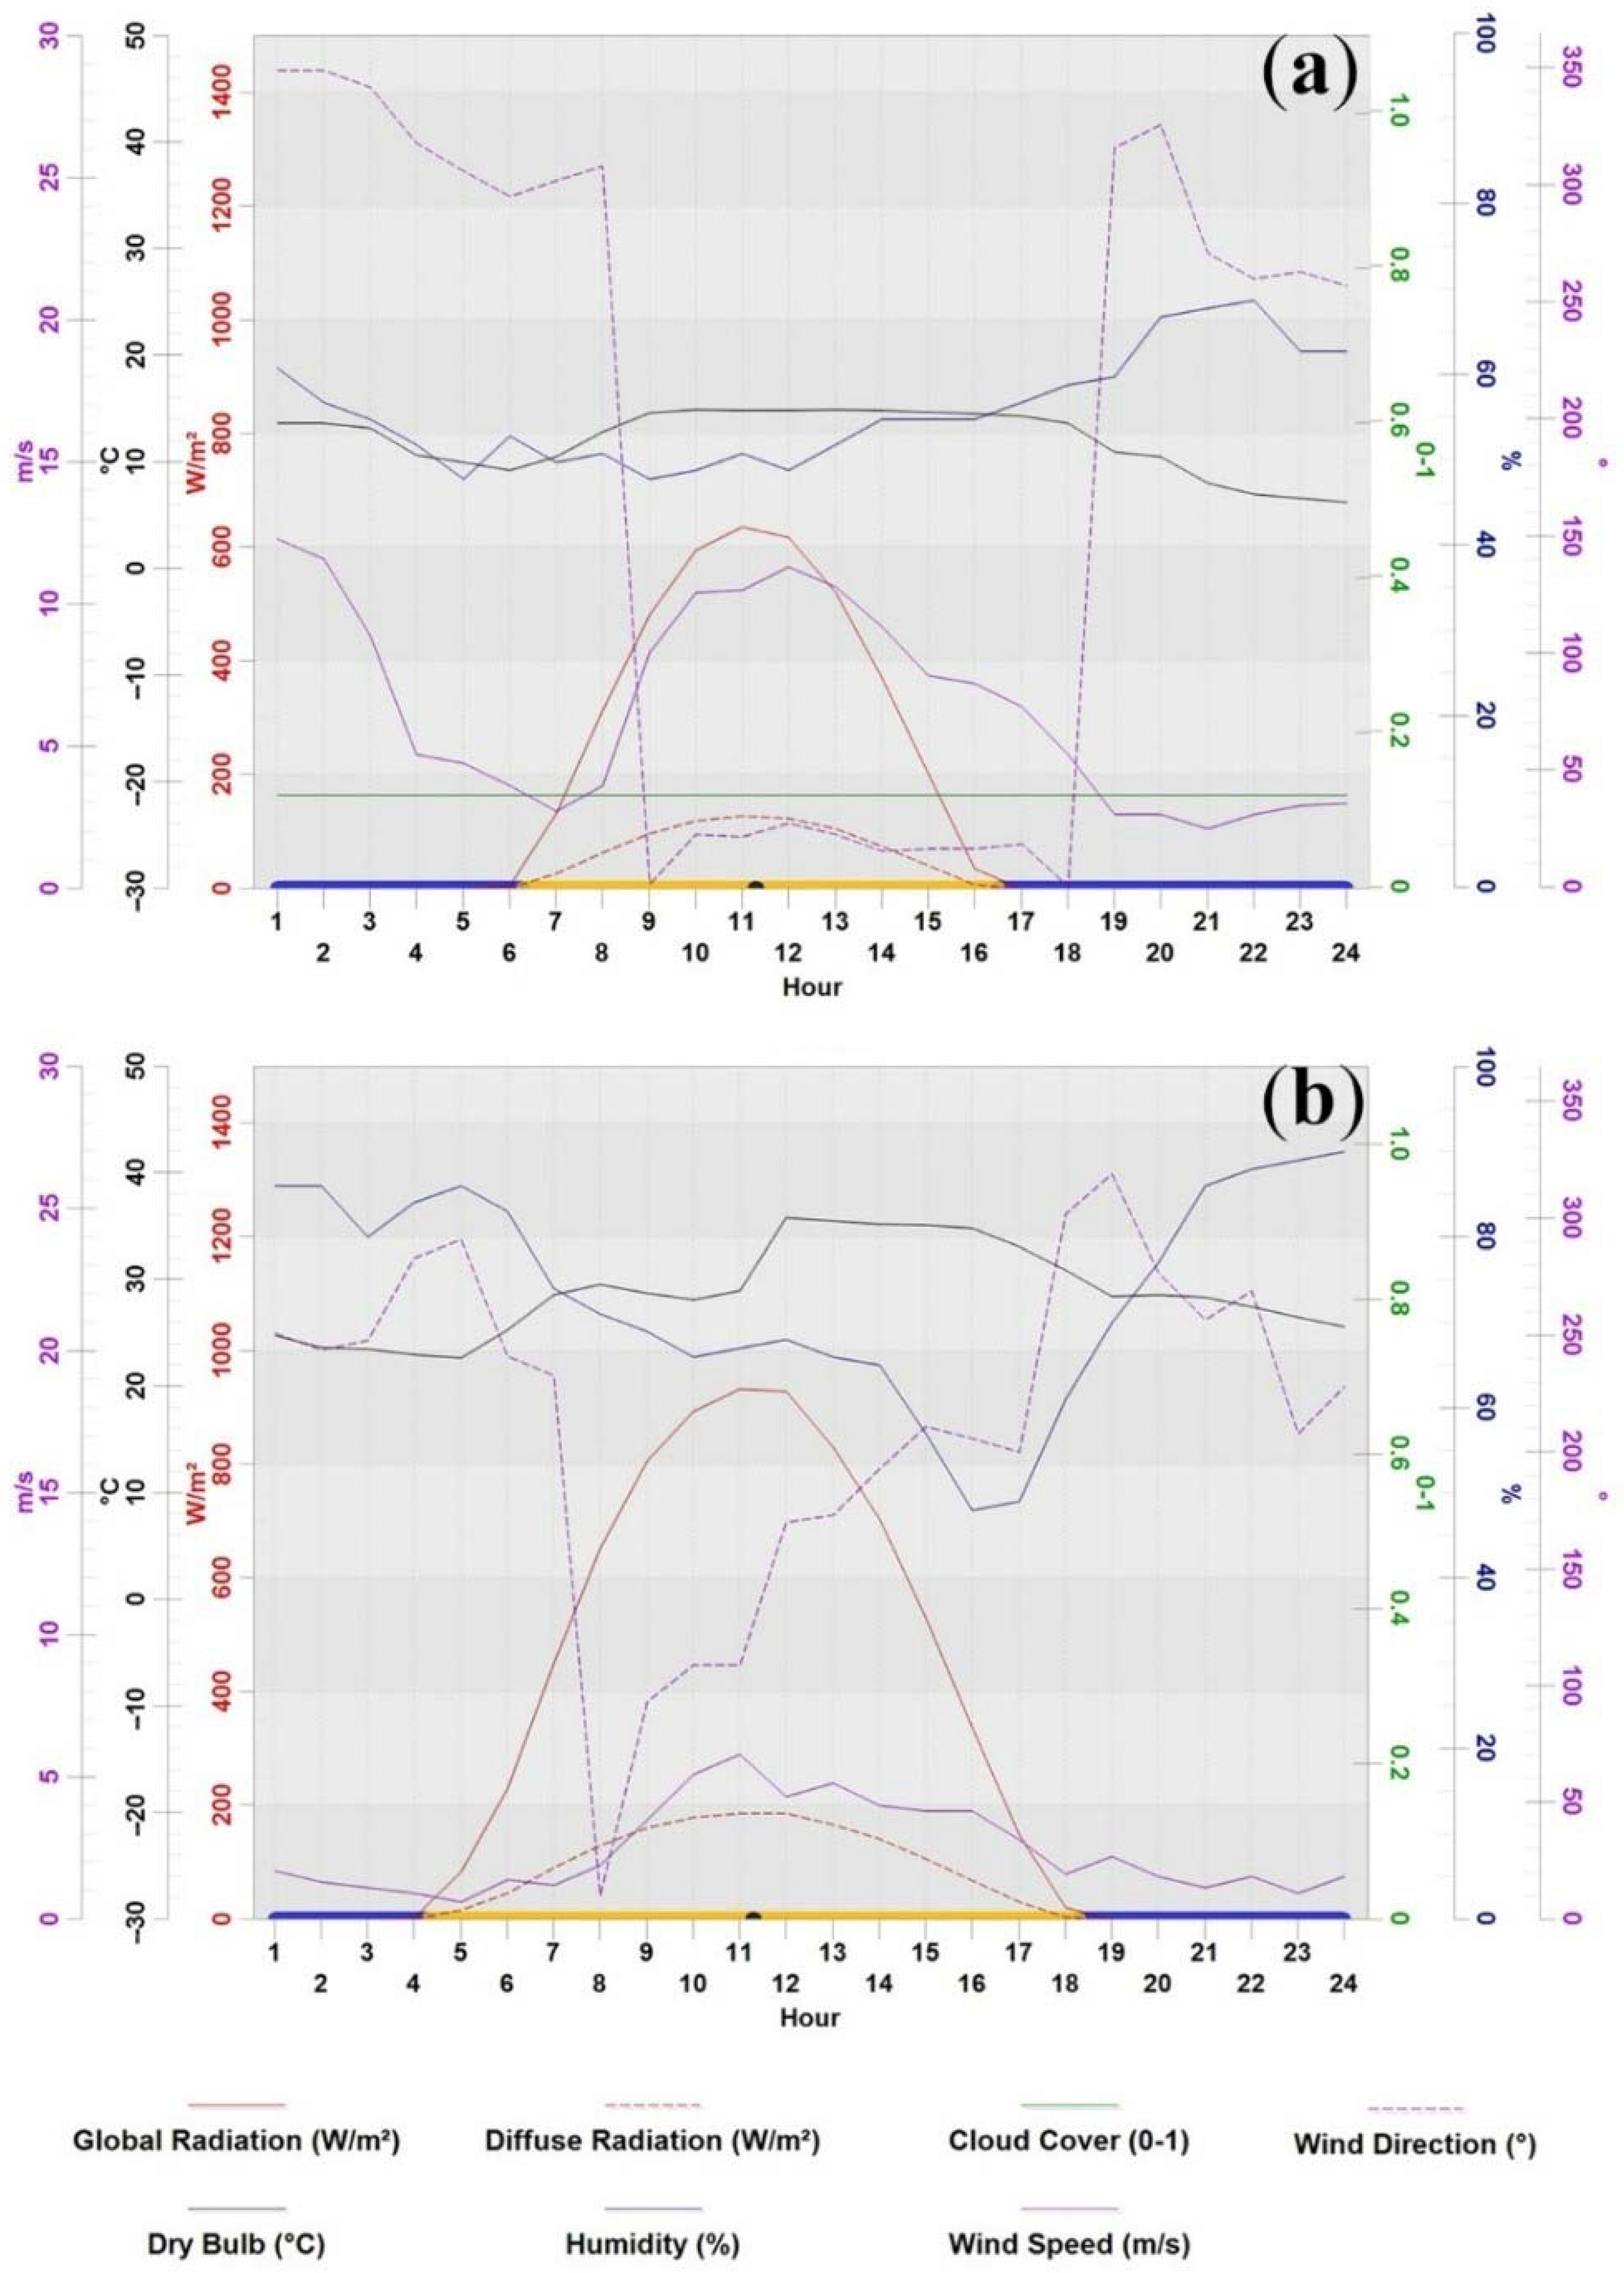
Figure 4.
Monthly average diurnal temperature swing and global horizontal radiation.
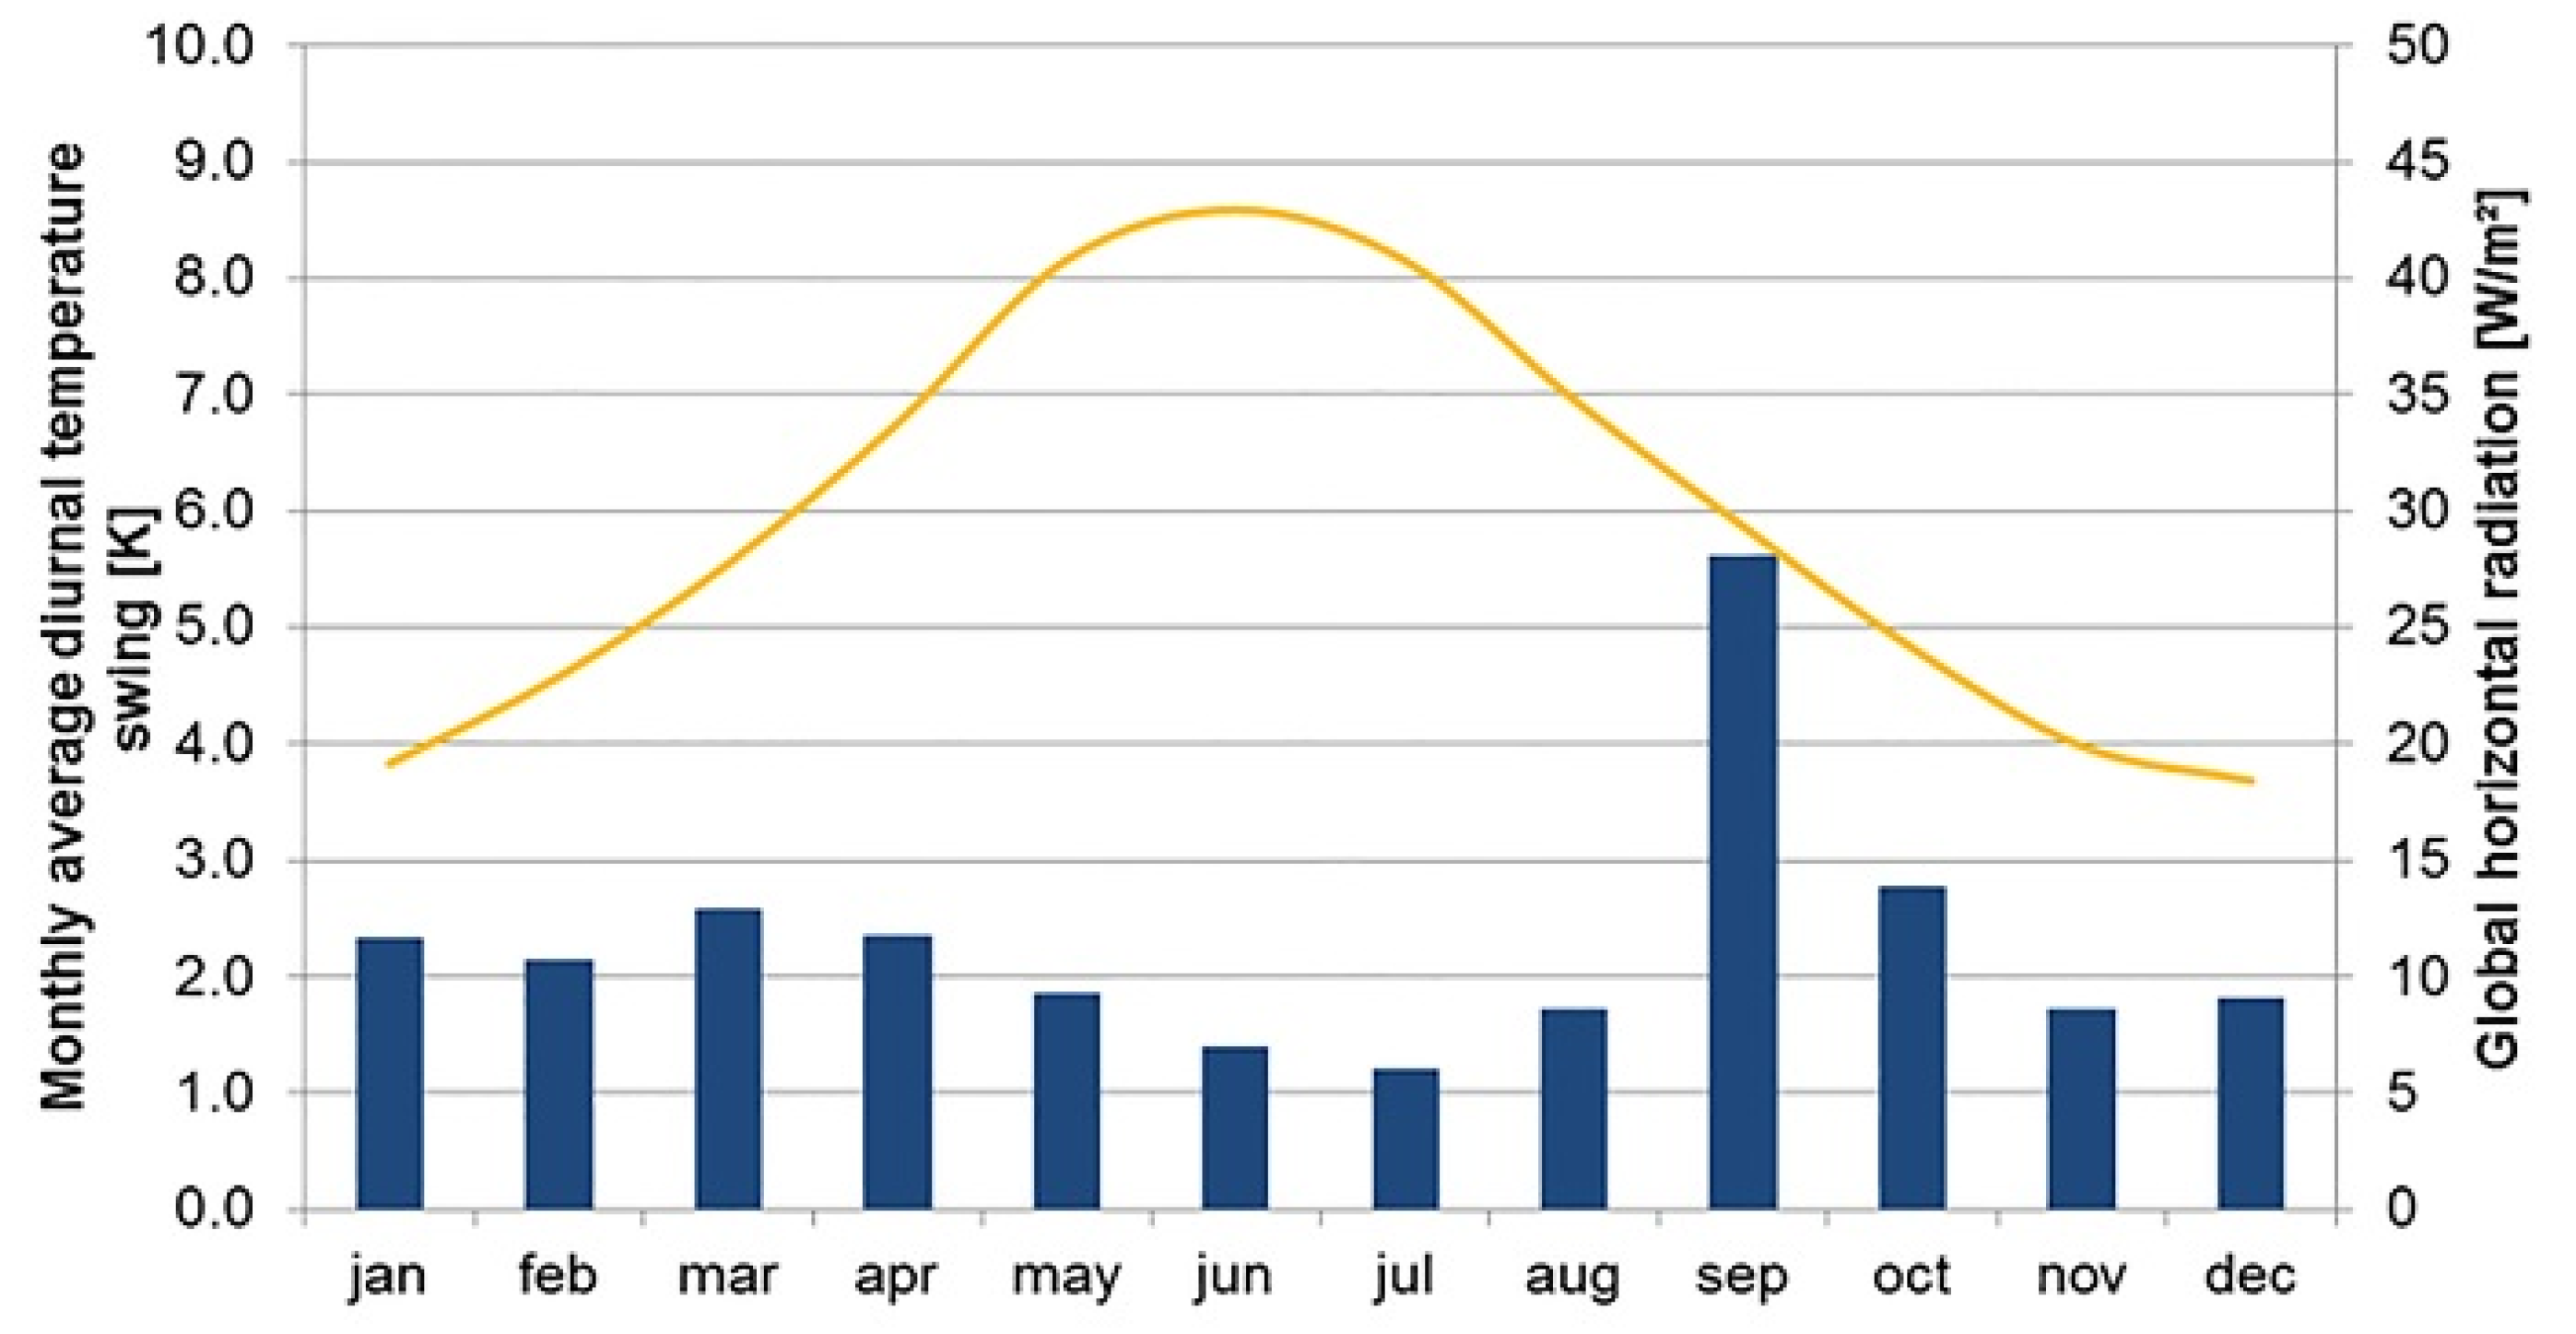
Figure 5.
Wind speed and wind directions in Famagusta.
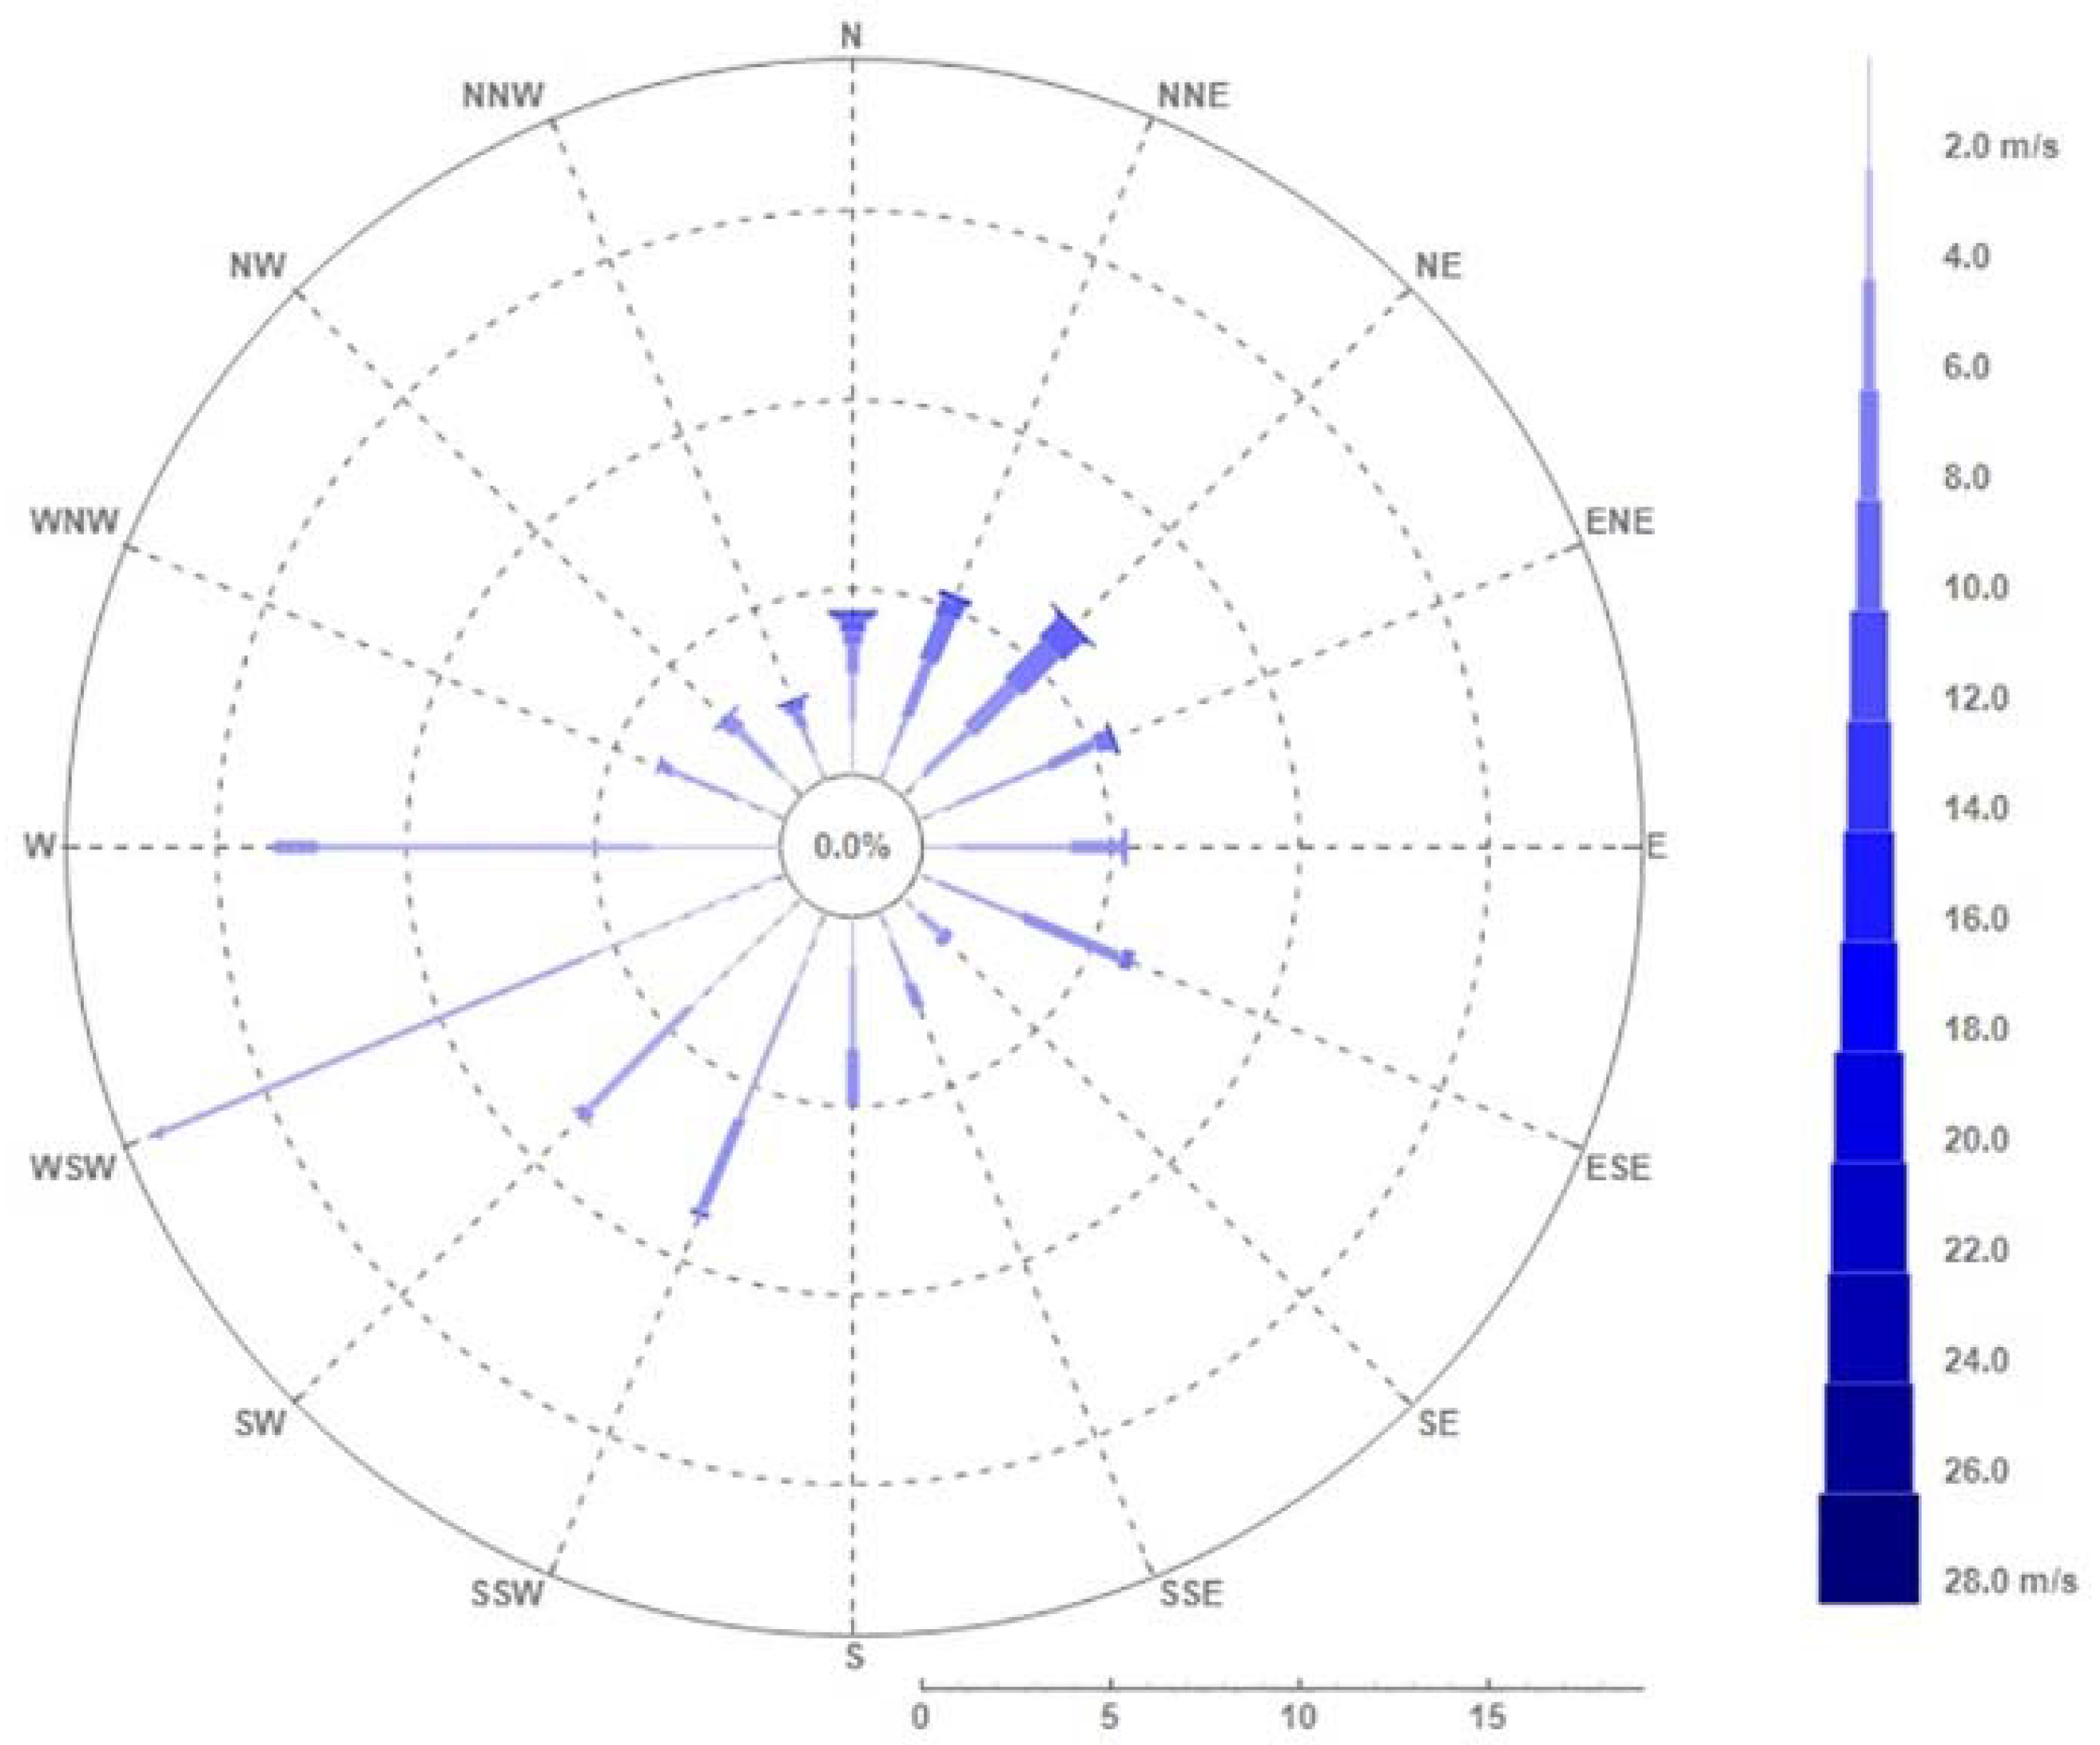
Figure 6.
Annual acceptability hours of the VR, CO2 and TC, and AC loads for the 16-simulation runs suggested by the Taguchi L16 (4^4 2^3) orthogonal array.
Figure 6.
Annual acceptability hours of the VR, CO2 and TC, and AC loads for the 16-simulation runs suggested by the Taguchi L16 (4^4 2^3) orthogonal array.

Figure 7.
Signal-to-noise (S/N) ratio plots showing the effectiveness of each parameter and optimal factorial levels for (a) ventilative rate, (b) CO2 concentration, (c) adaptive thermal comfort, and (d) AC loads.
Figure 7.
Signal-to-noise (S/N) ratio plots showing the effectiveness of each parameter and optimal factorial levels for (a) ventilative rate, (b) CO2 concentration, (c) adaptive thermal comfort, and (d) AC loads.
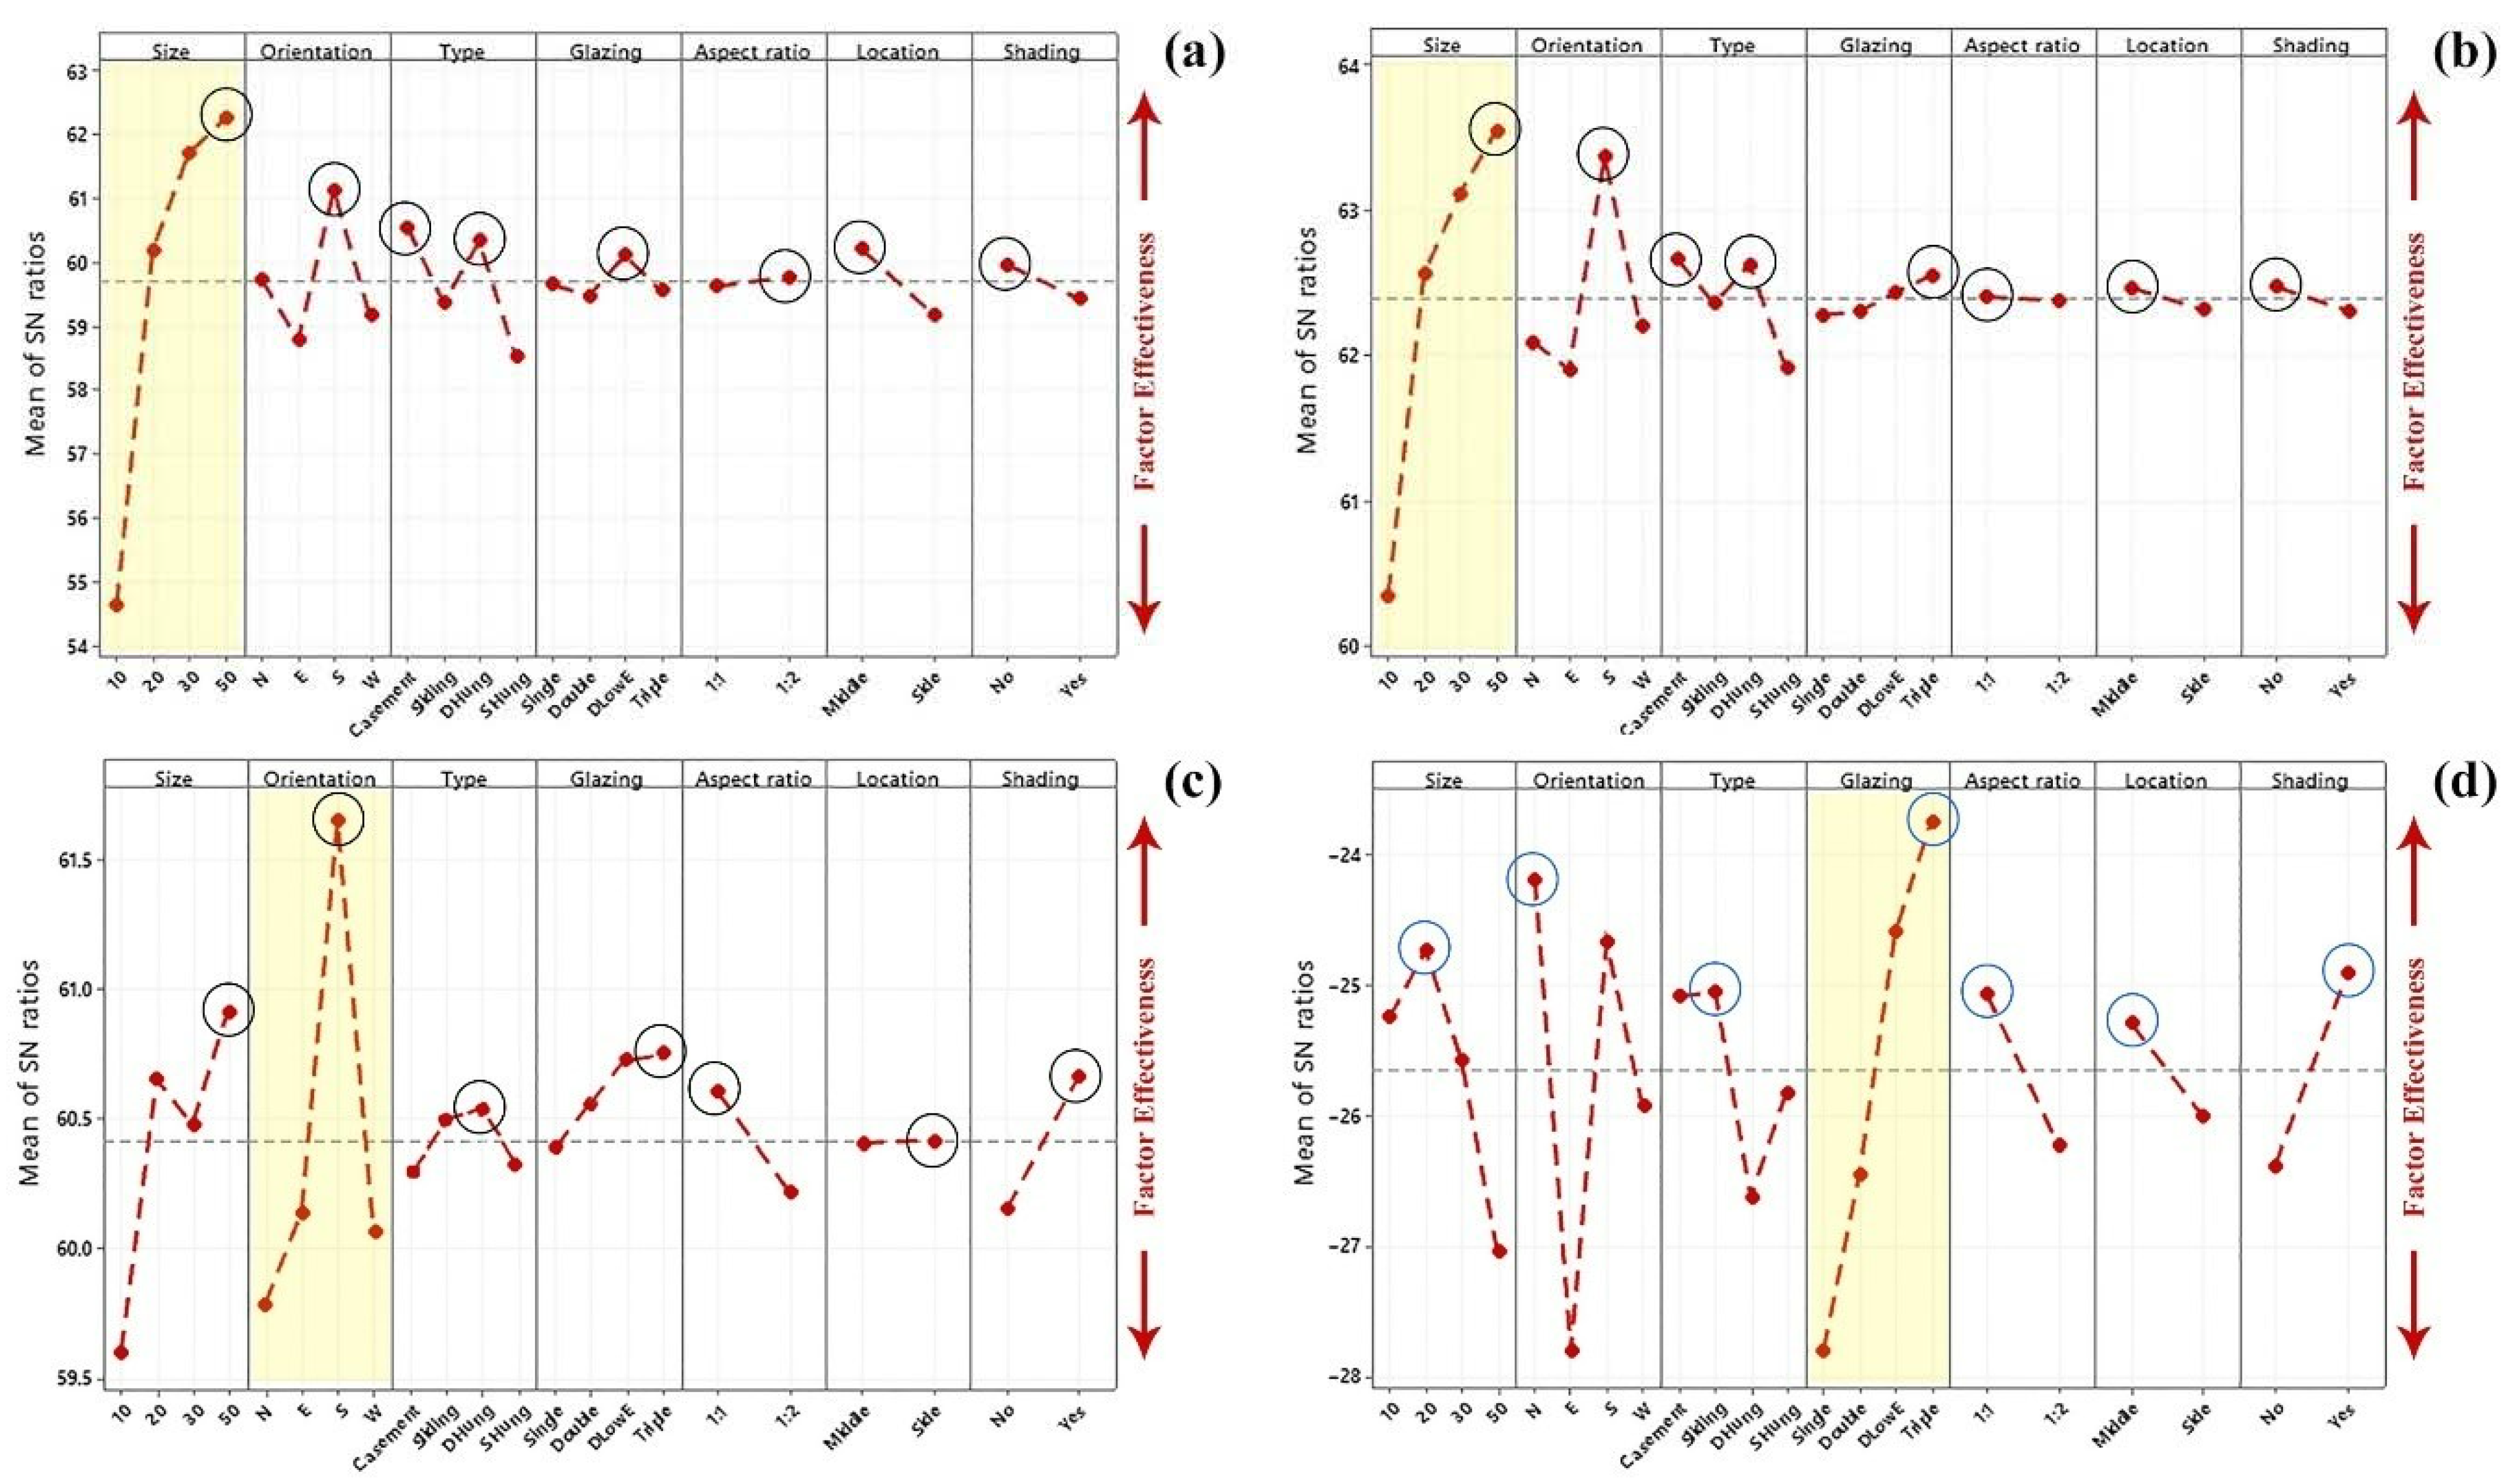
Figure 8.
The selected trade-off options for a detailed study of the intended performance criteria.

Figure 9.
Monthly airflow rates for the studied trade-off design scenarios.
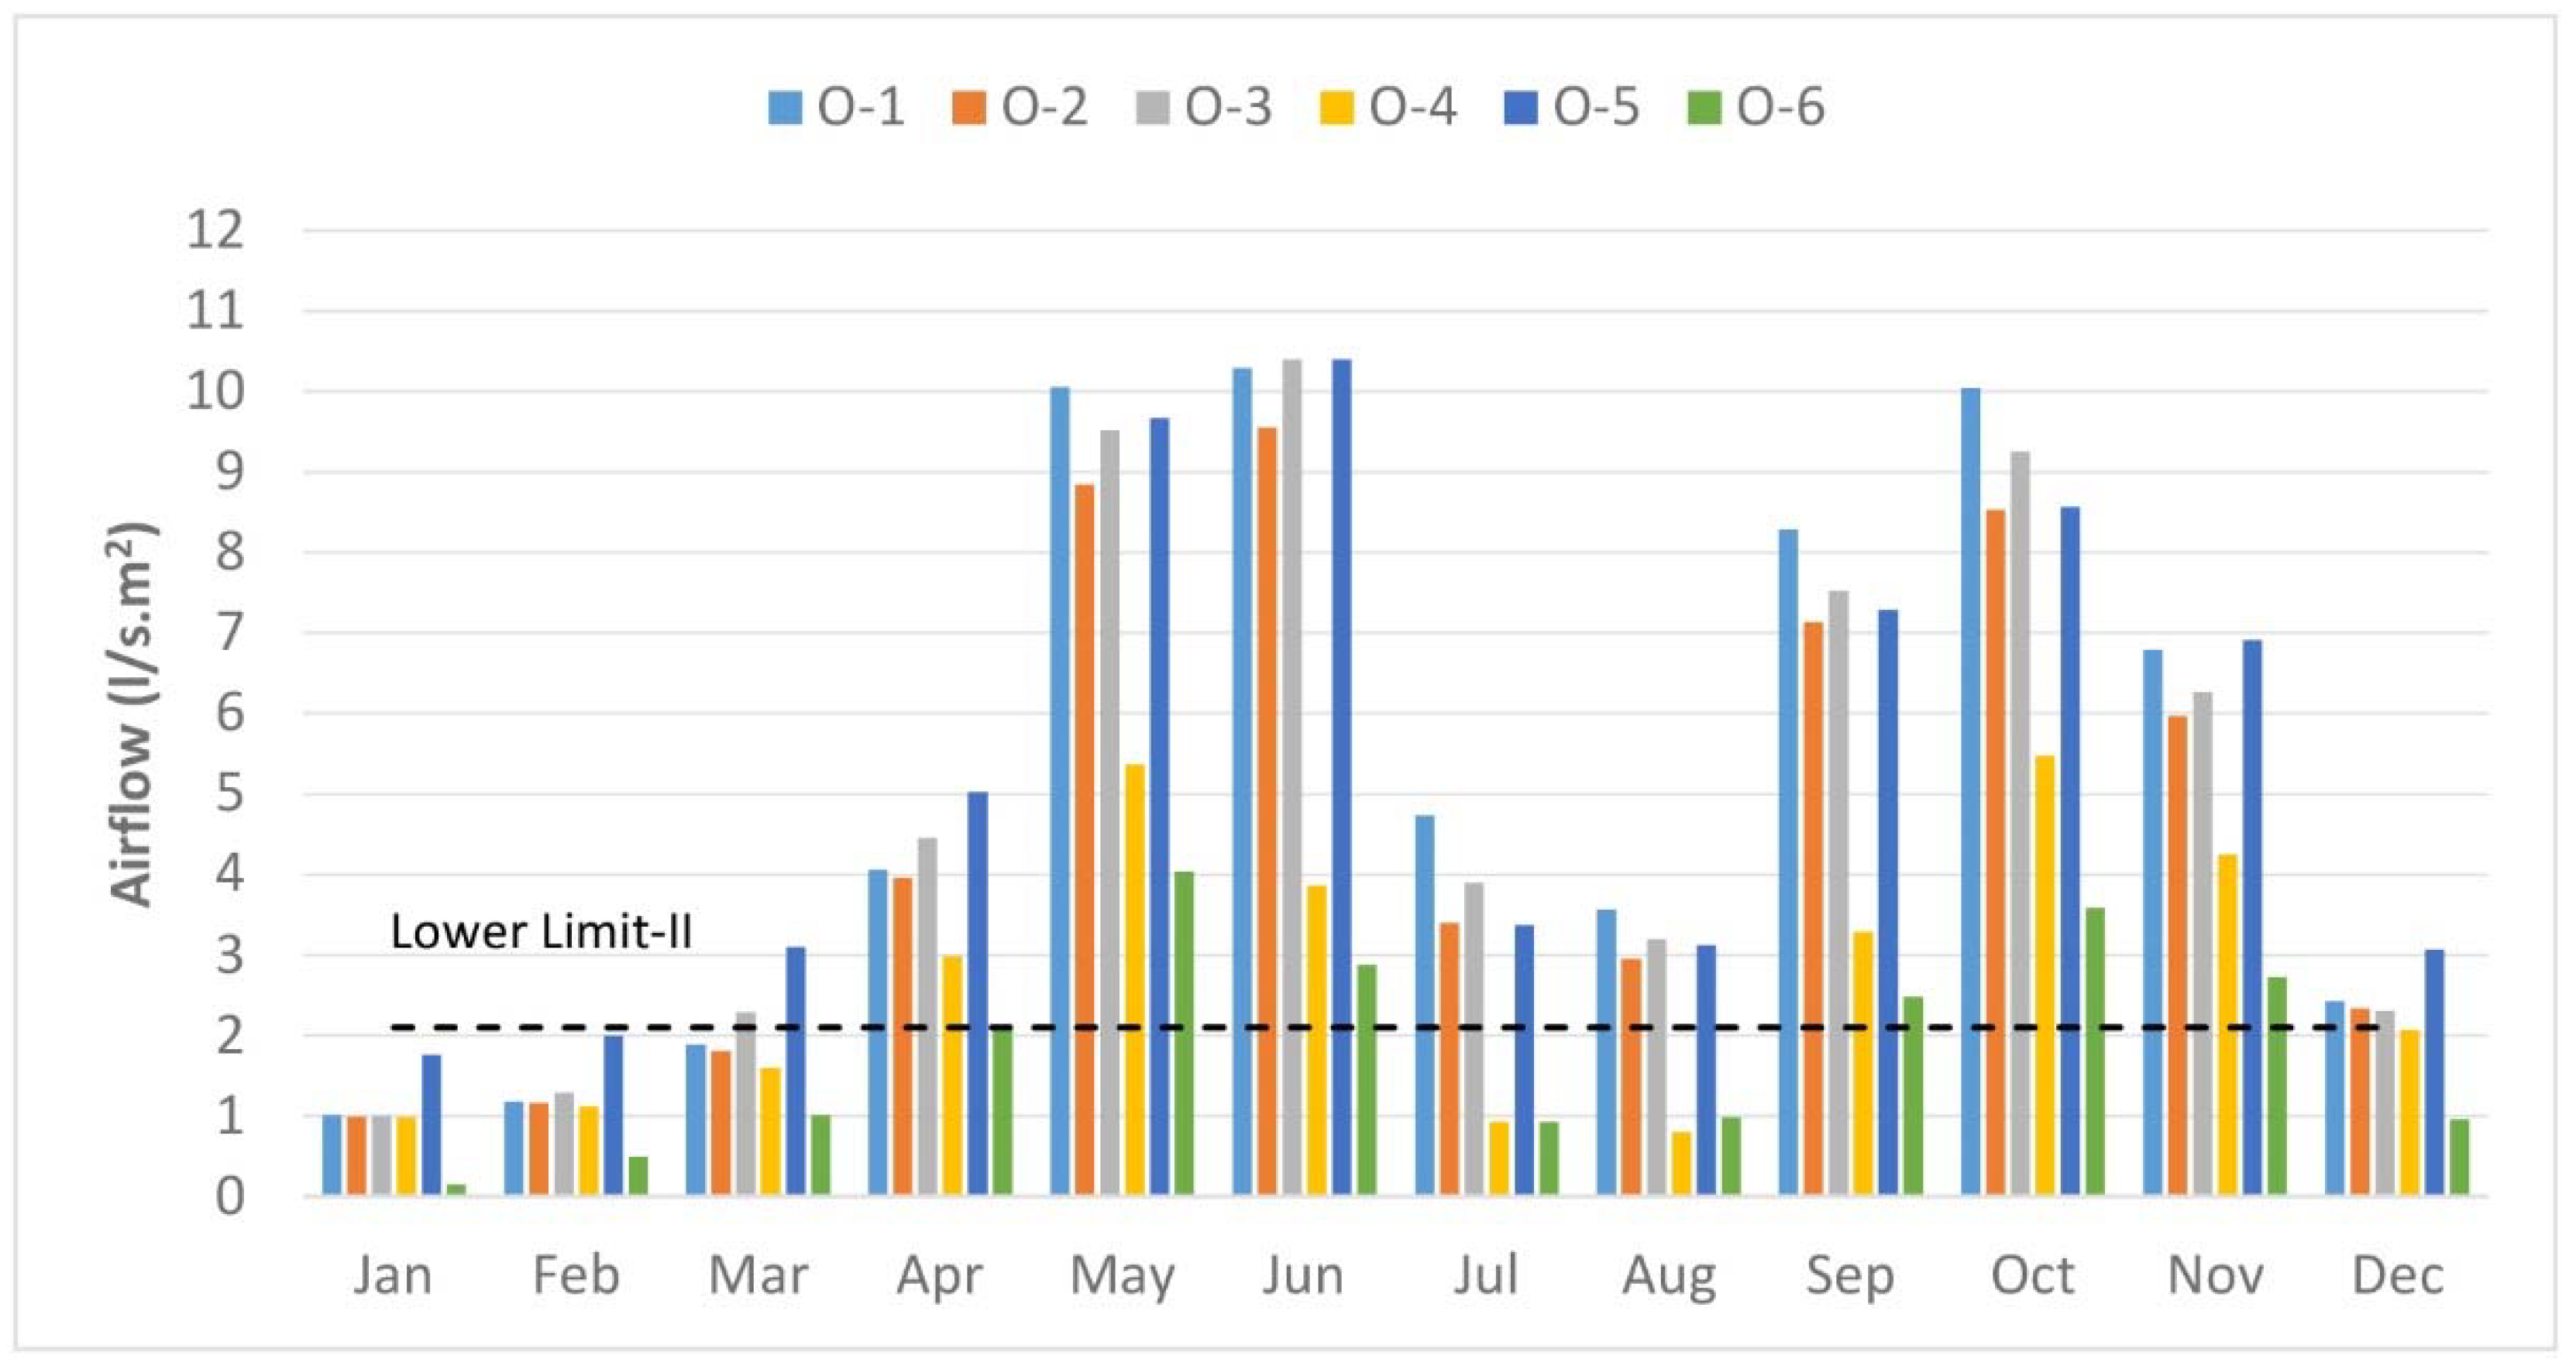
Figure 10.
The level of carbon dioxide concentration for the studied trade-off scenarios.
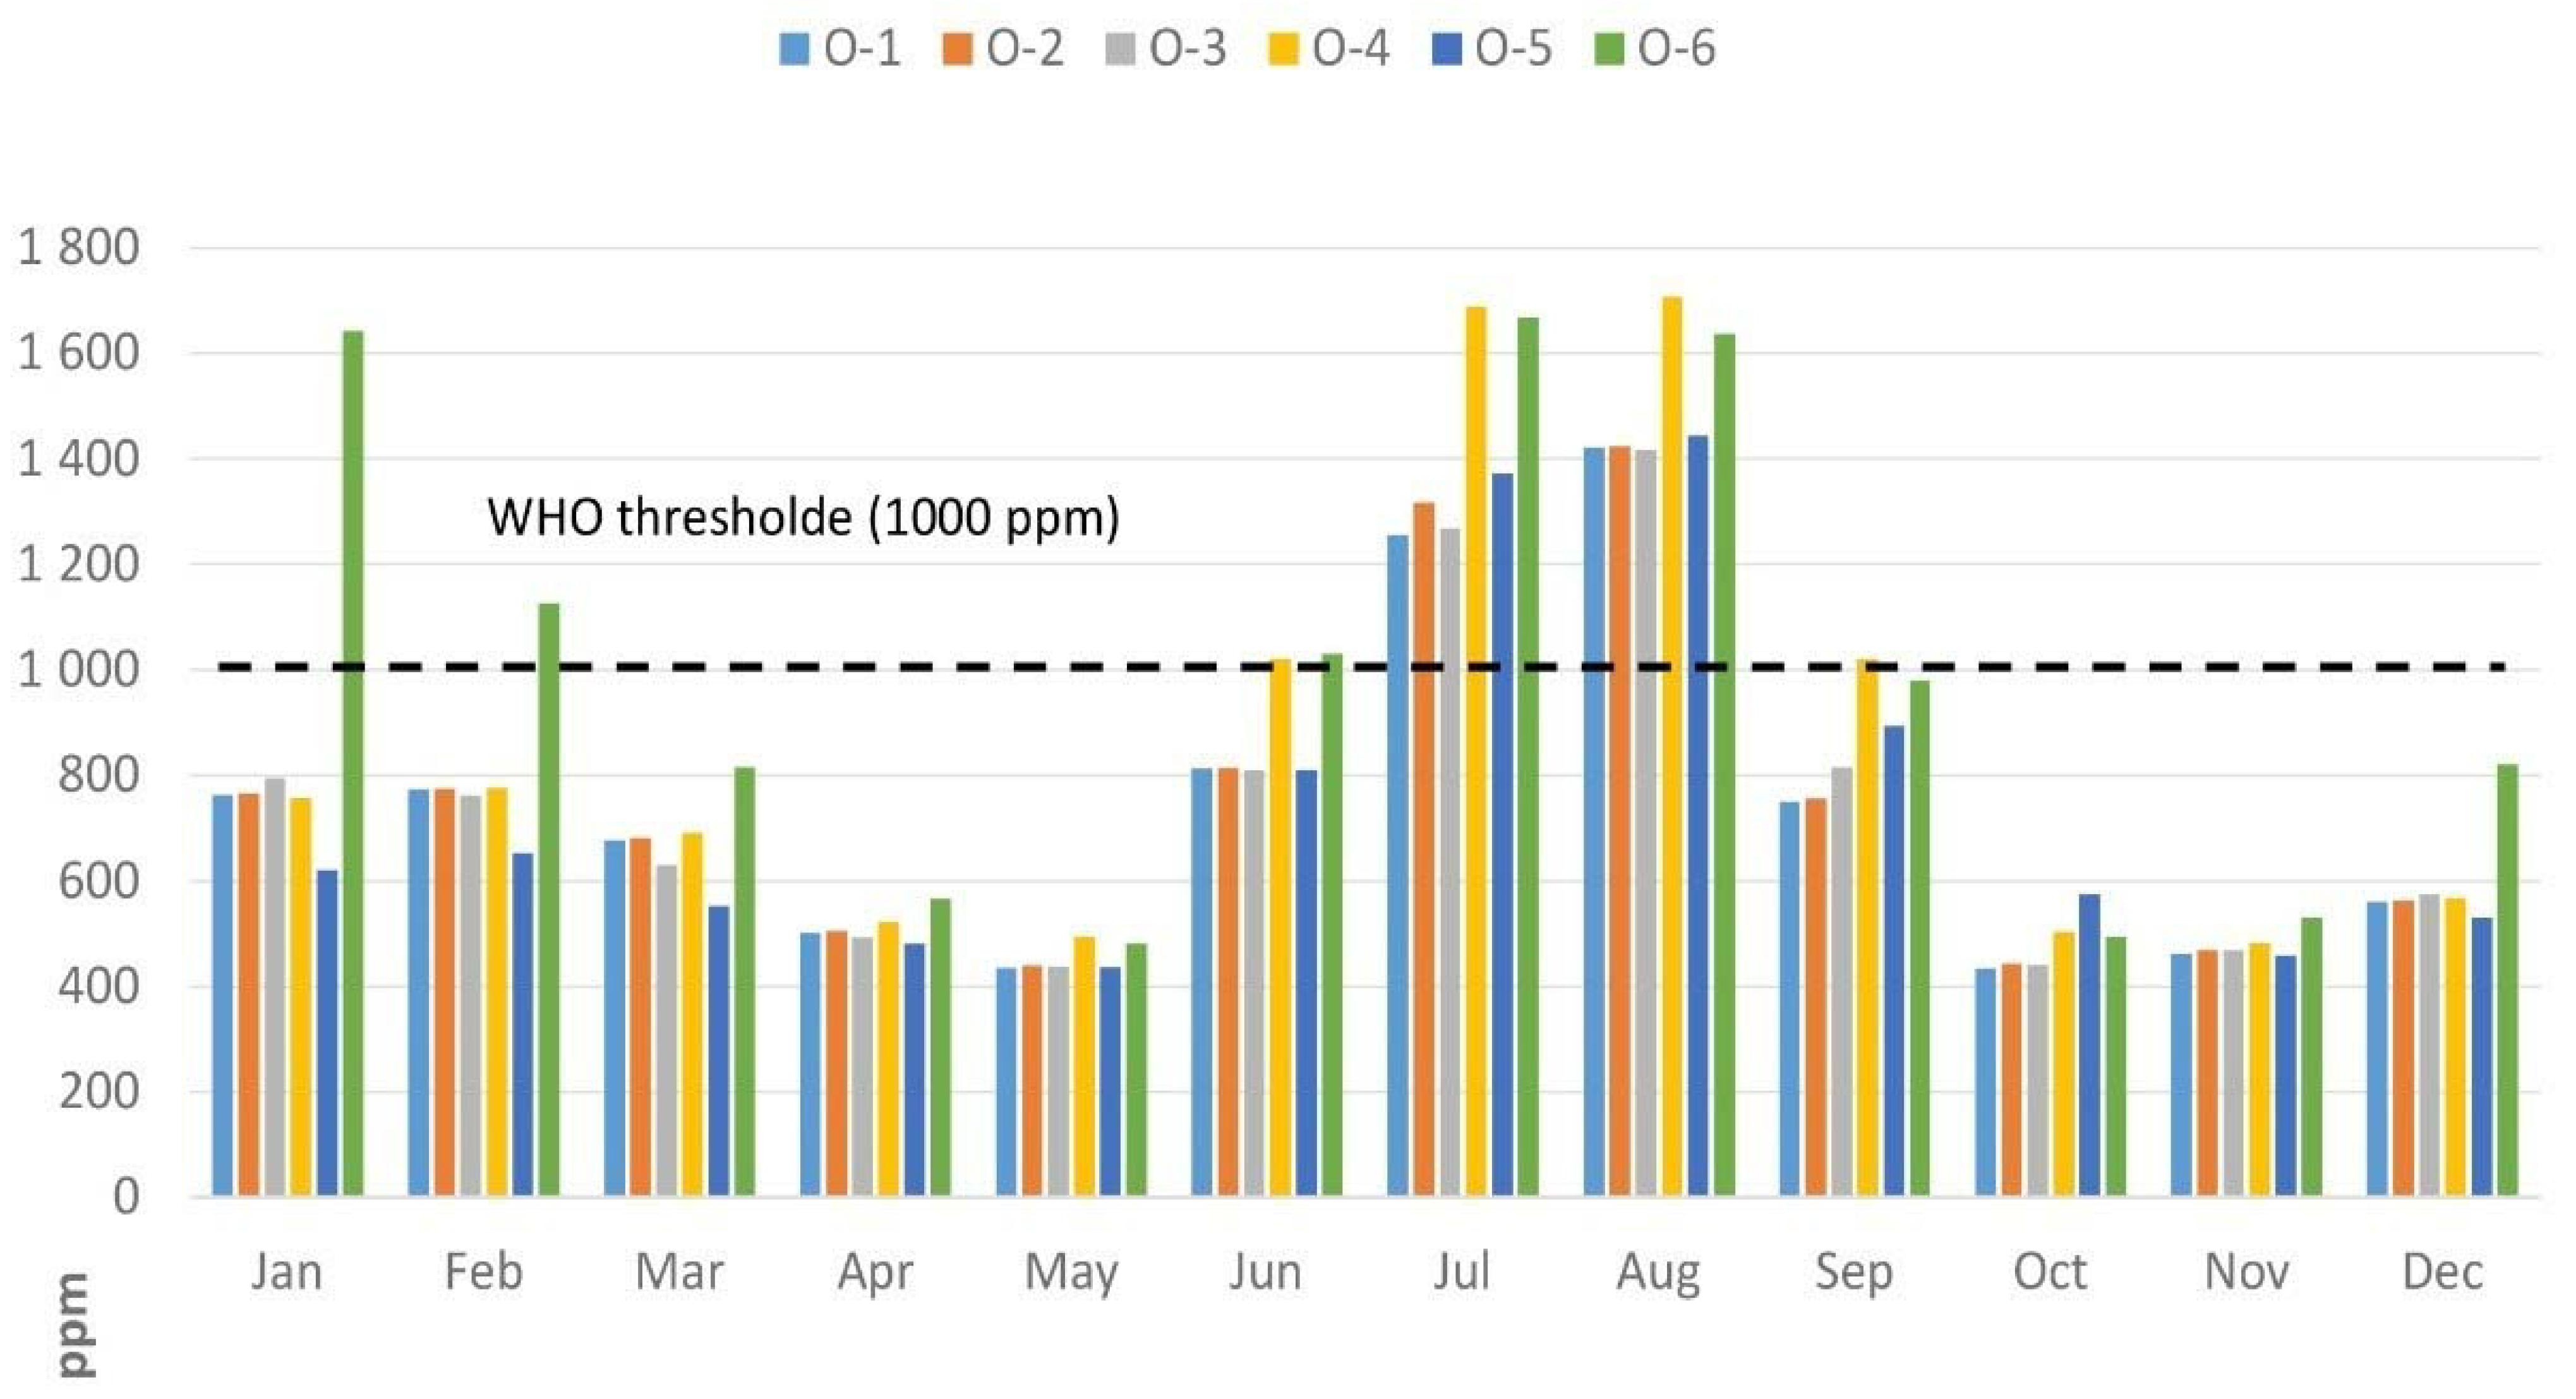
Figure 11.
Monthly percentages of comfort hours based on the Category II adaptive comfort limits for the studied trade-off design scenarios.
Figure 11.
Monthly percentages of comfort hours based on the Category II adaptive comfort limits for the studied trade-off design scenarios.
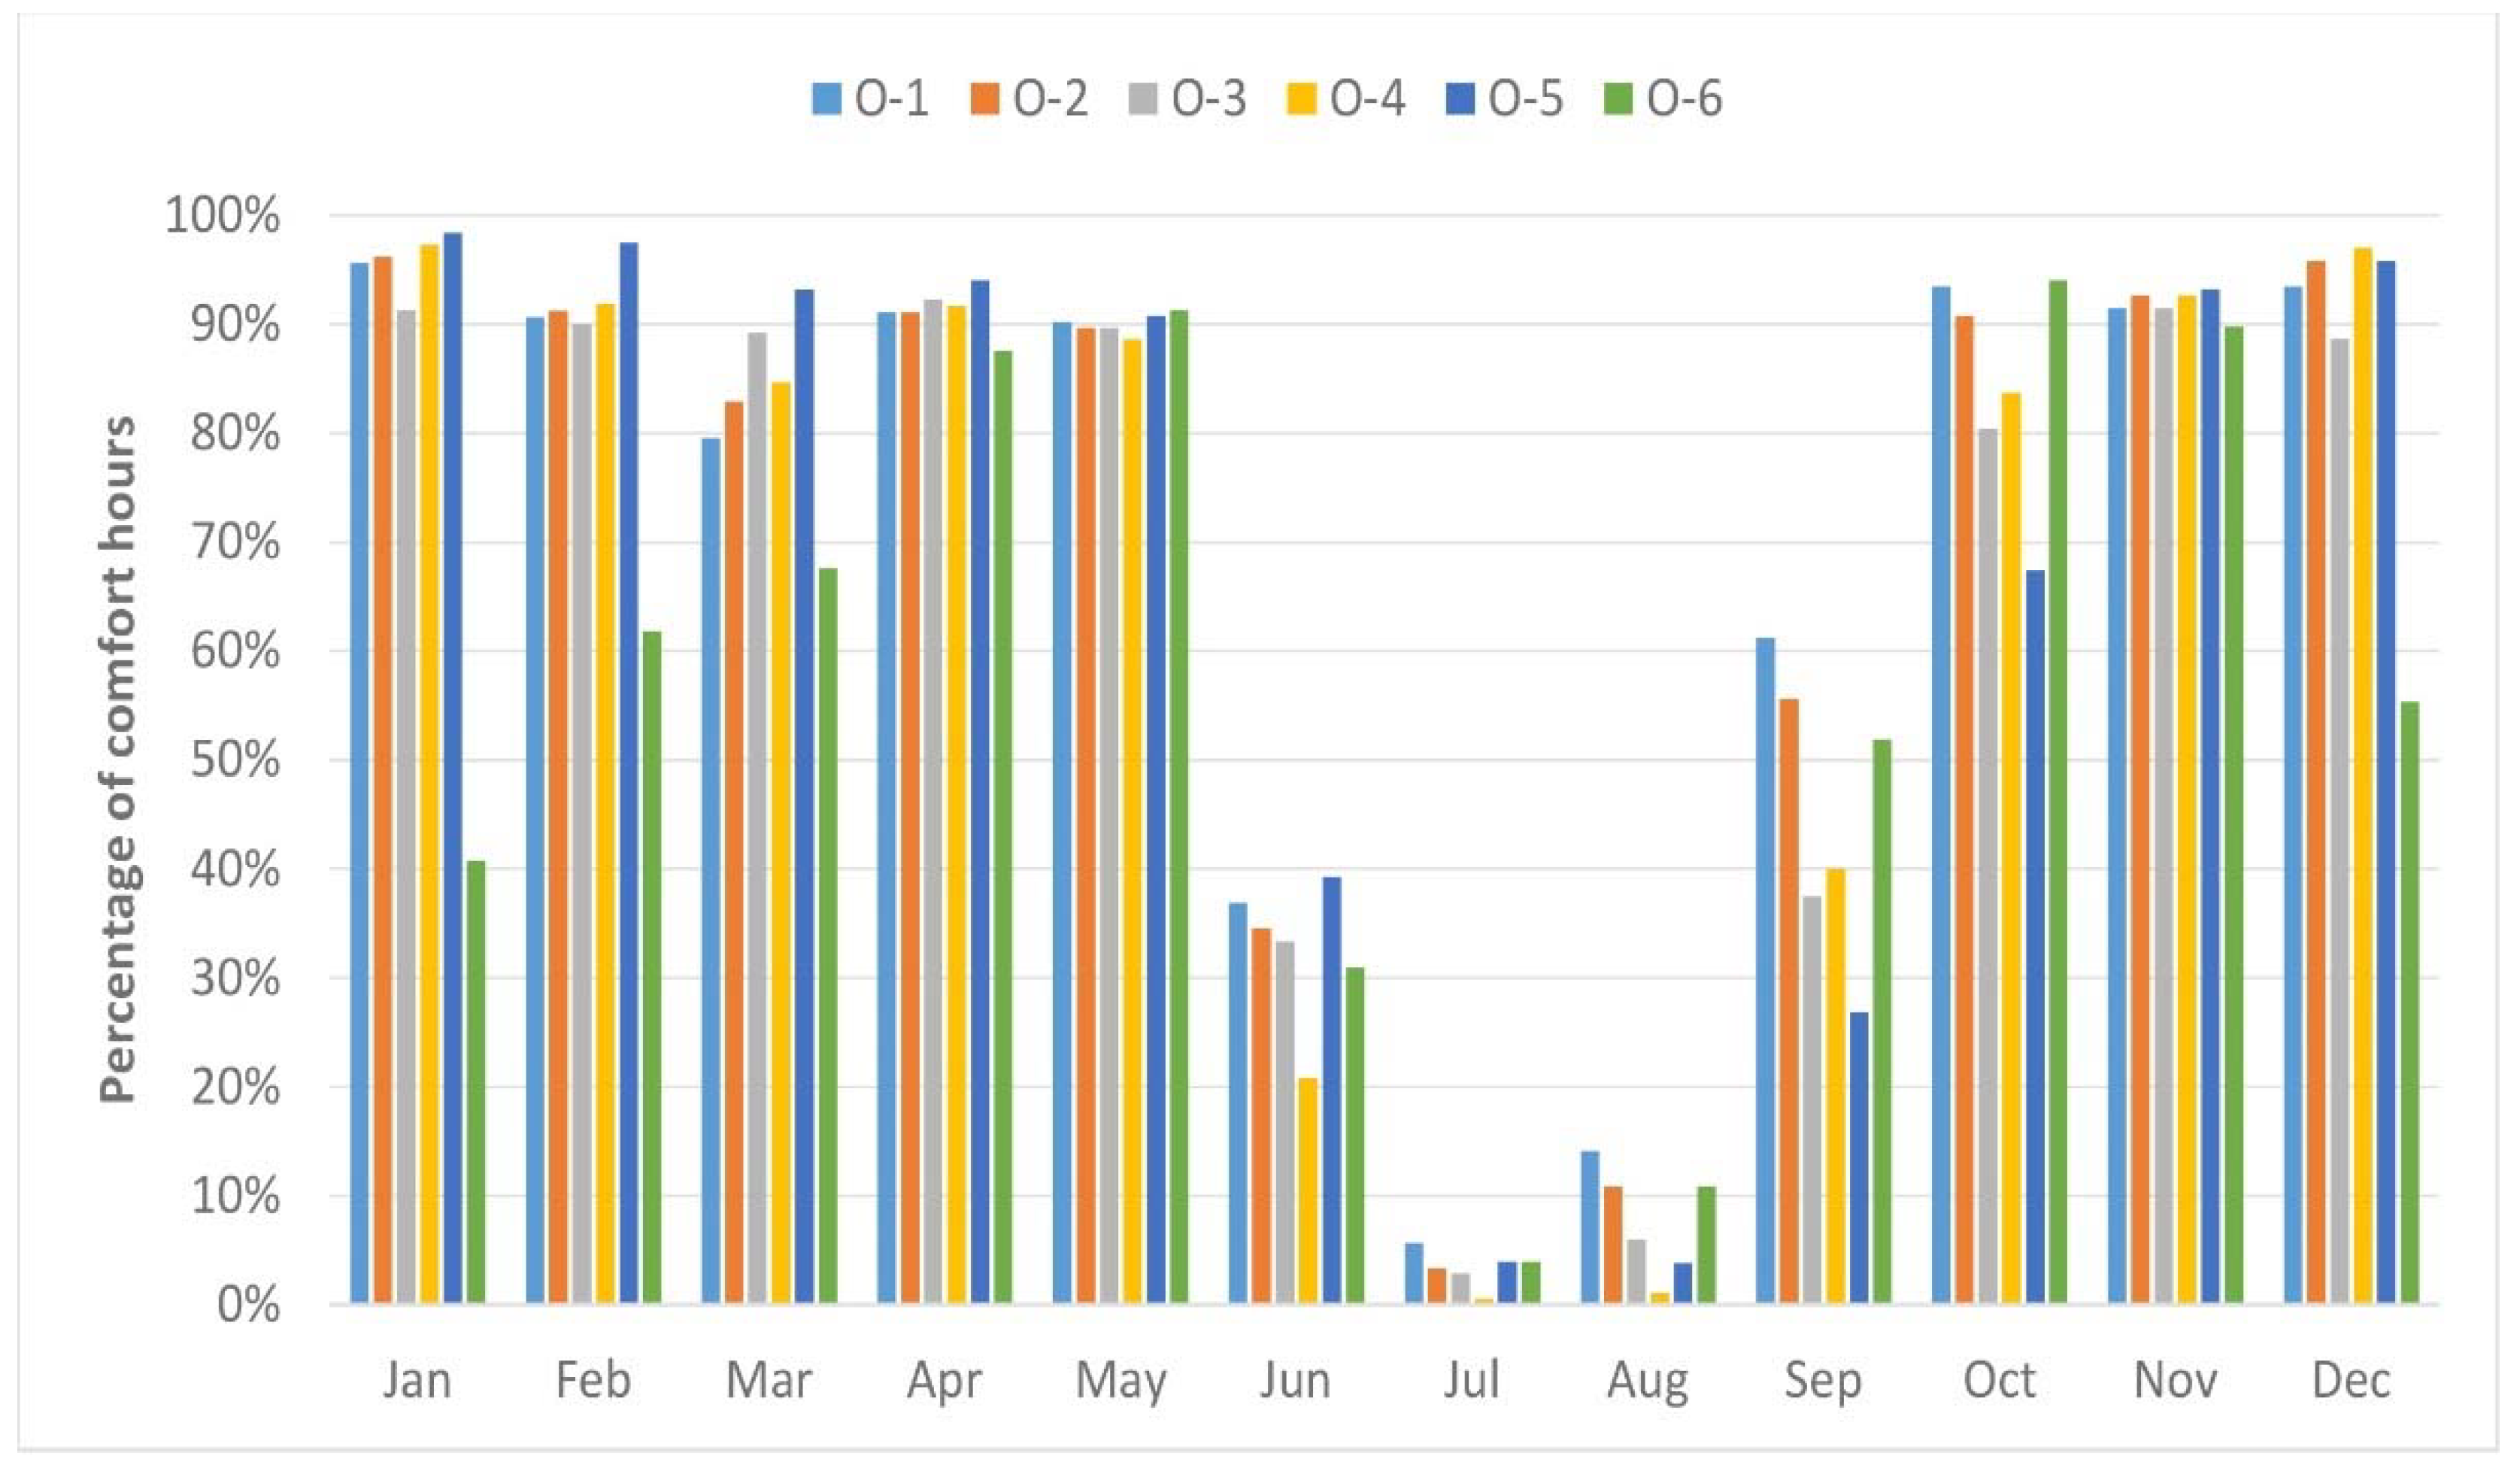
Figure 12.
Hourly indoor operative temperature for the adaptive comfort Category II in the case of (a) O-1 50% WFR and (b) O-6 20% WFR.
Figure 12.
Hourly indoor operative temperature for the adaptive comfort Category II in the case of (a) O-1 50% WFR and (b) O-6 20% WFR.
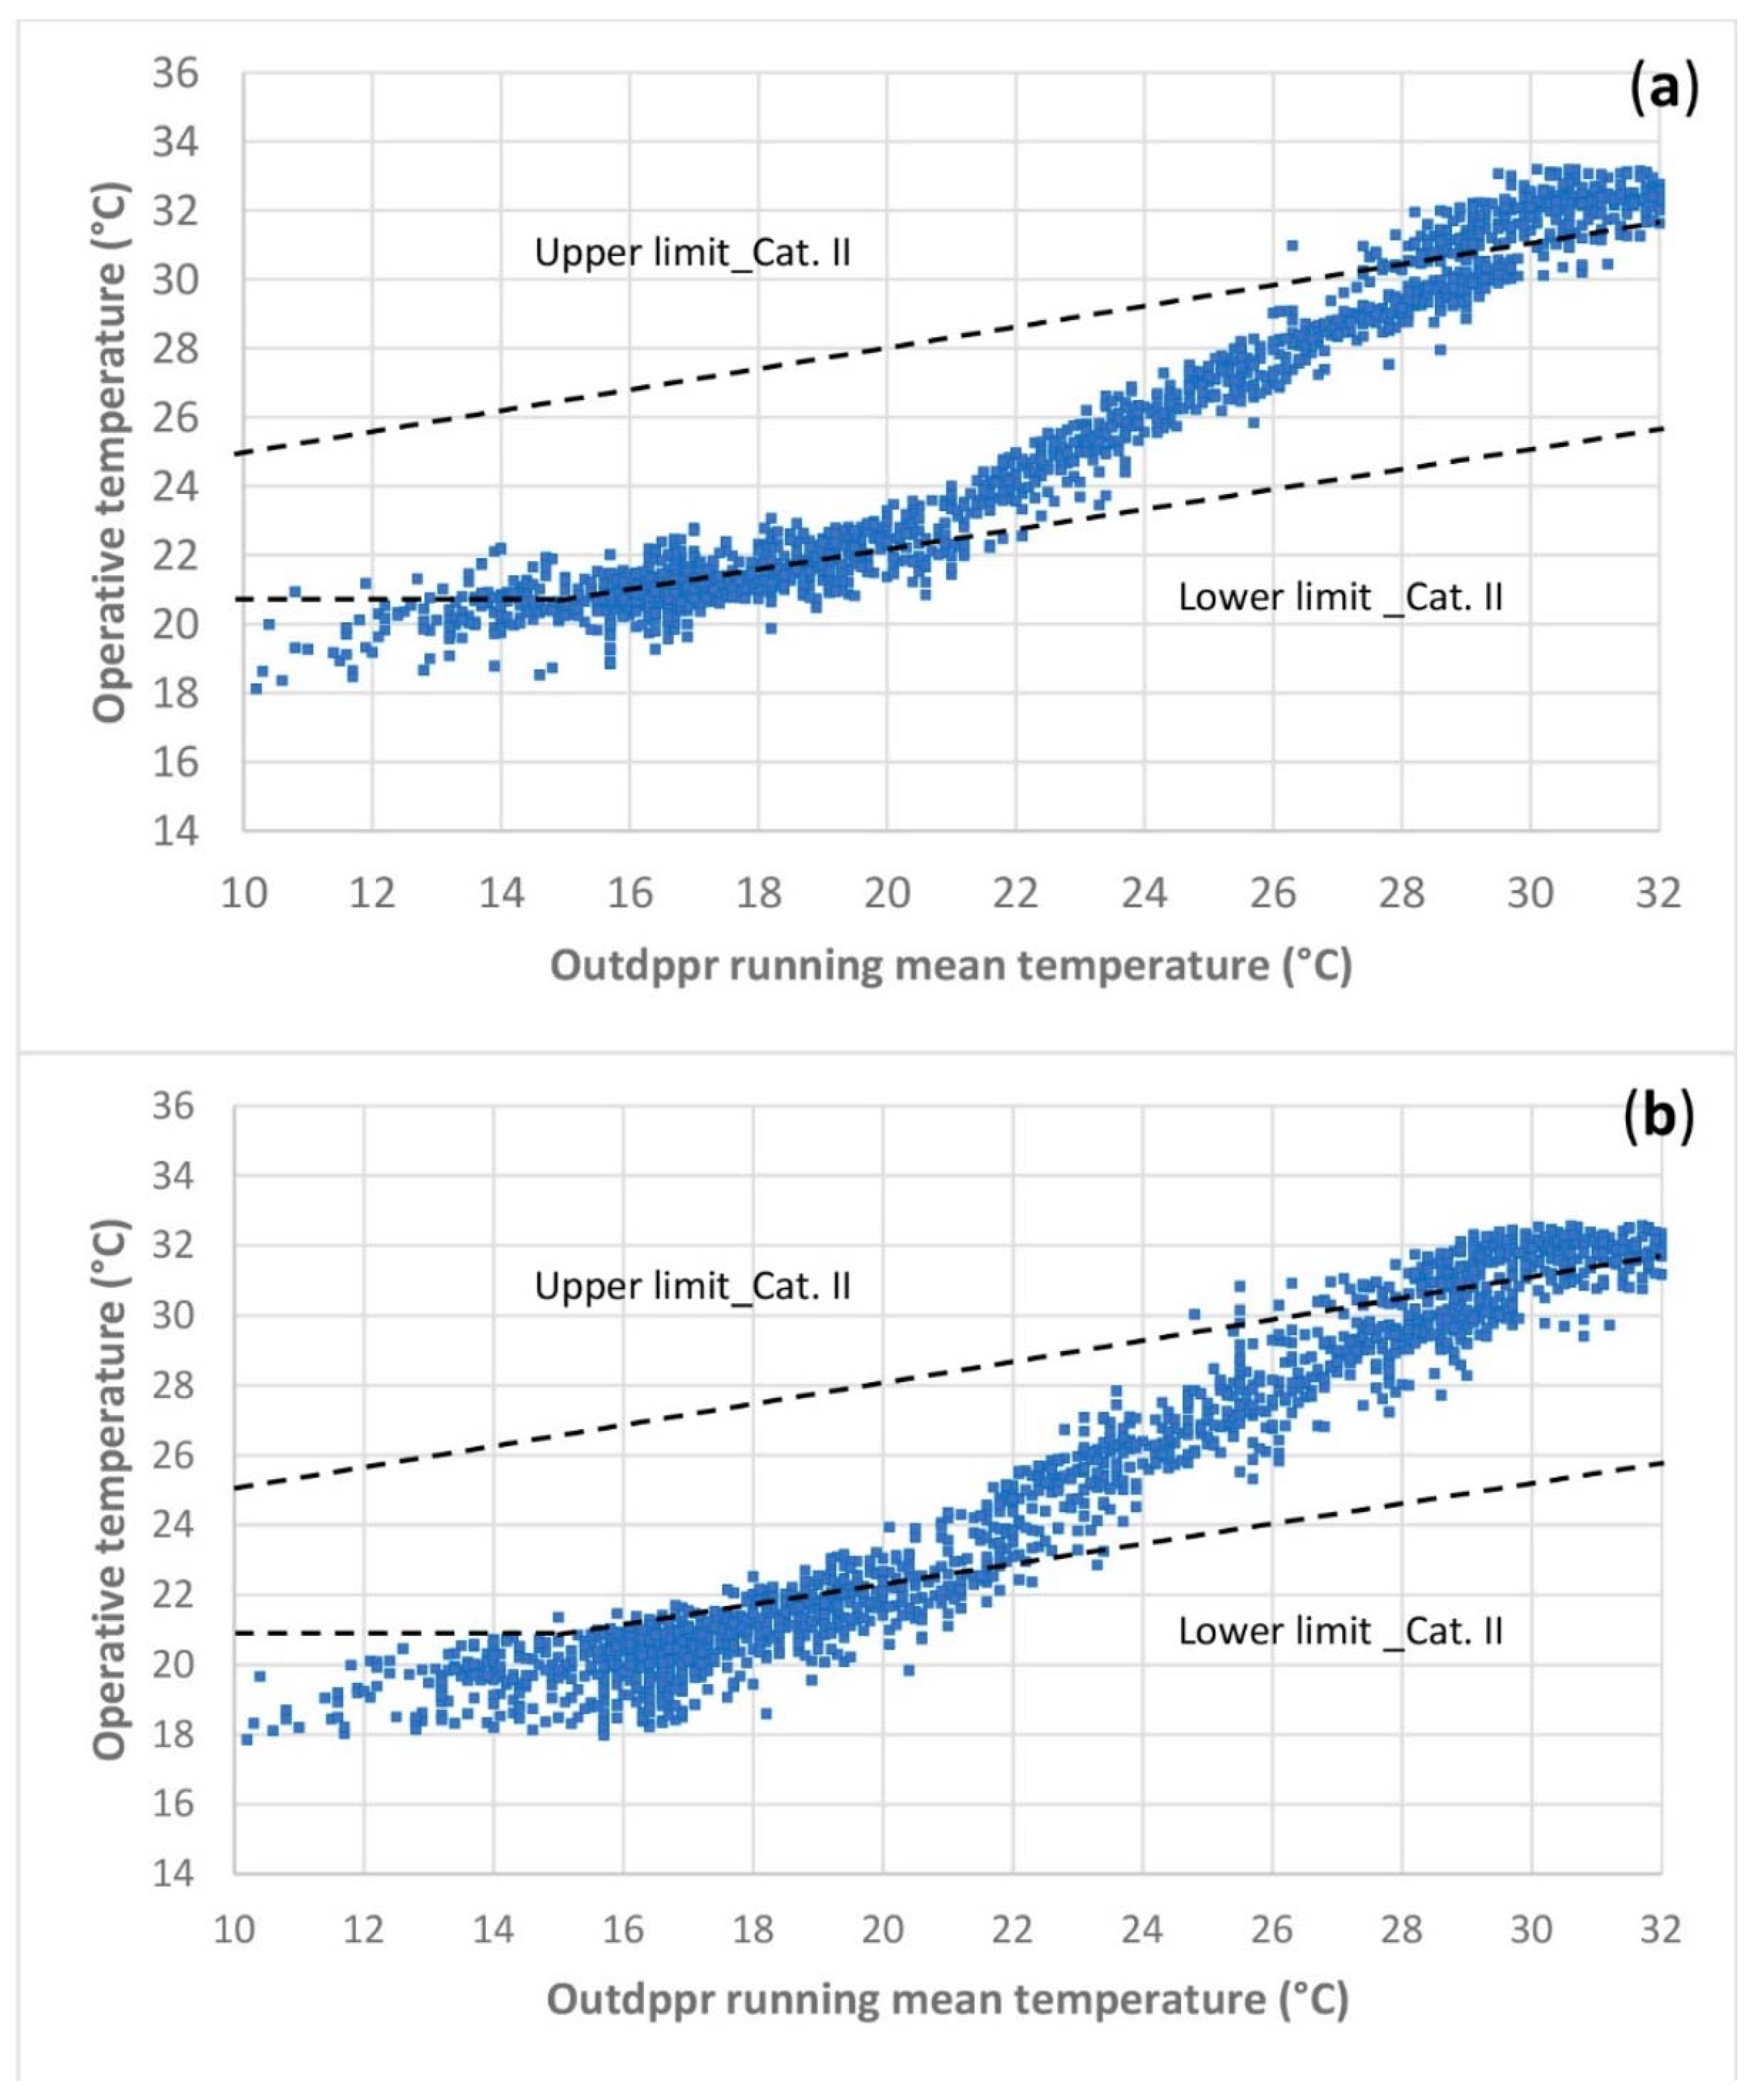
Figure 13.
Monthly AC loads for the trade-off design scenarios.
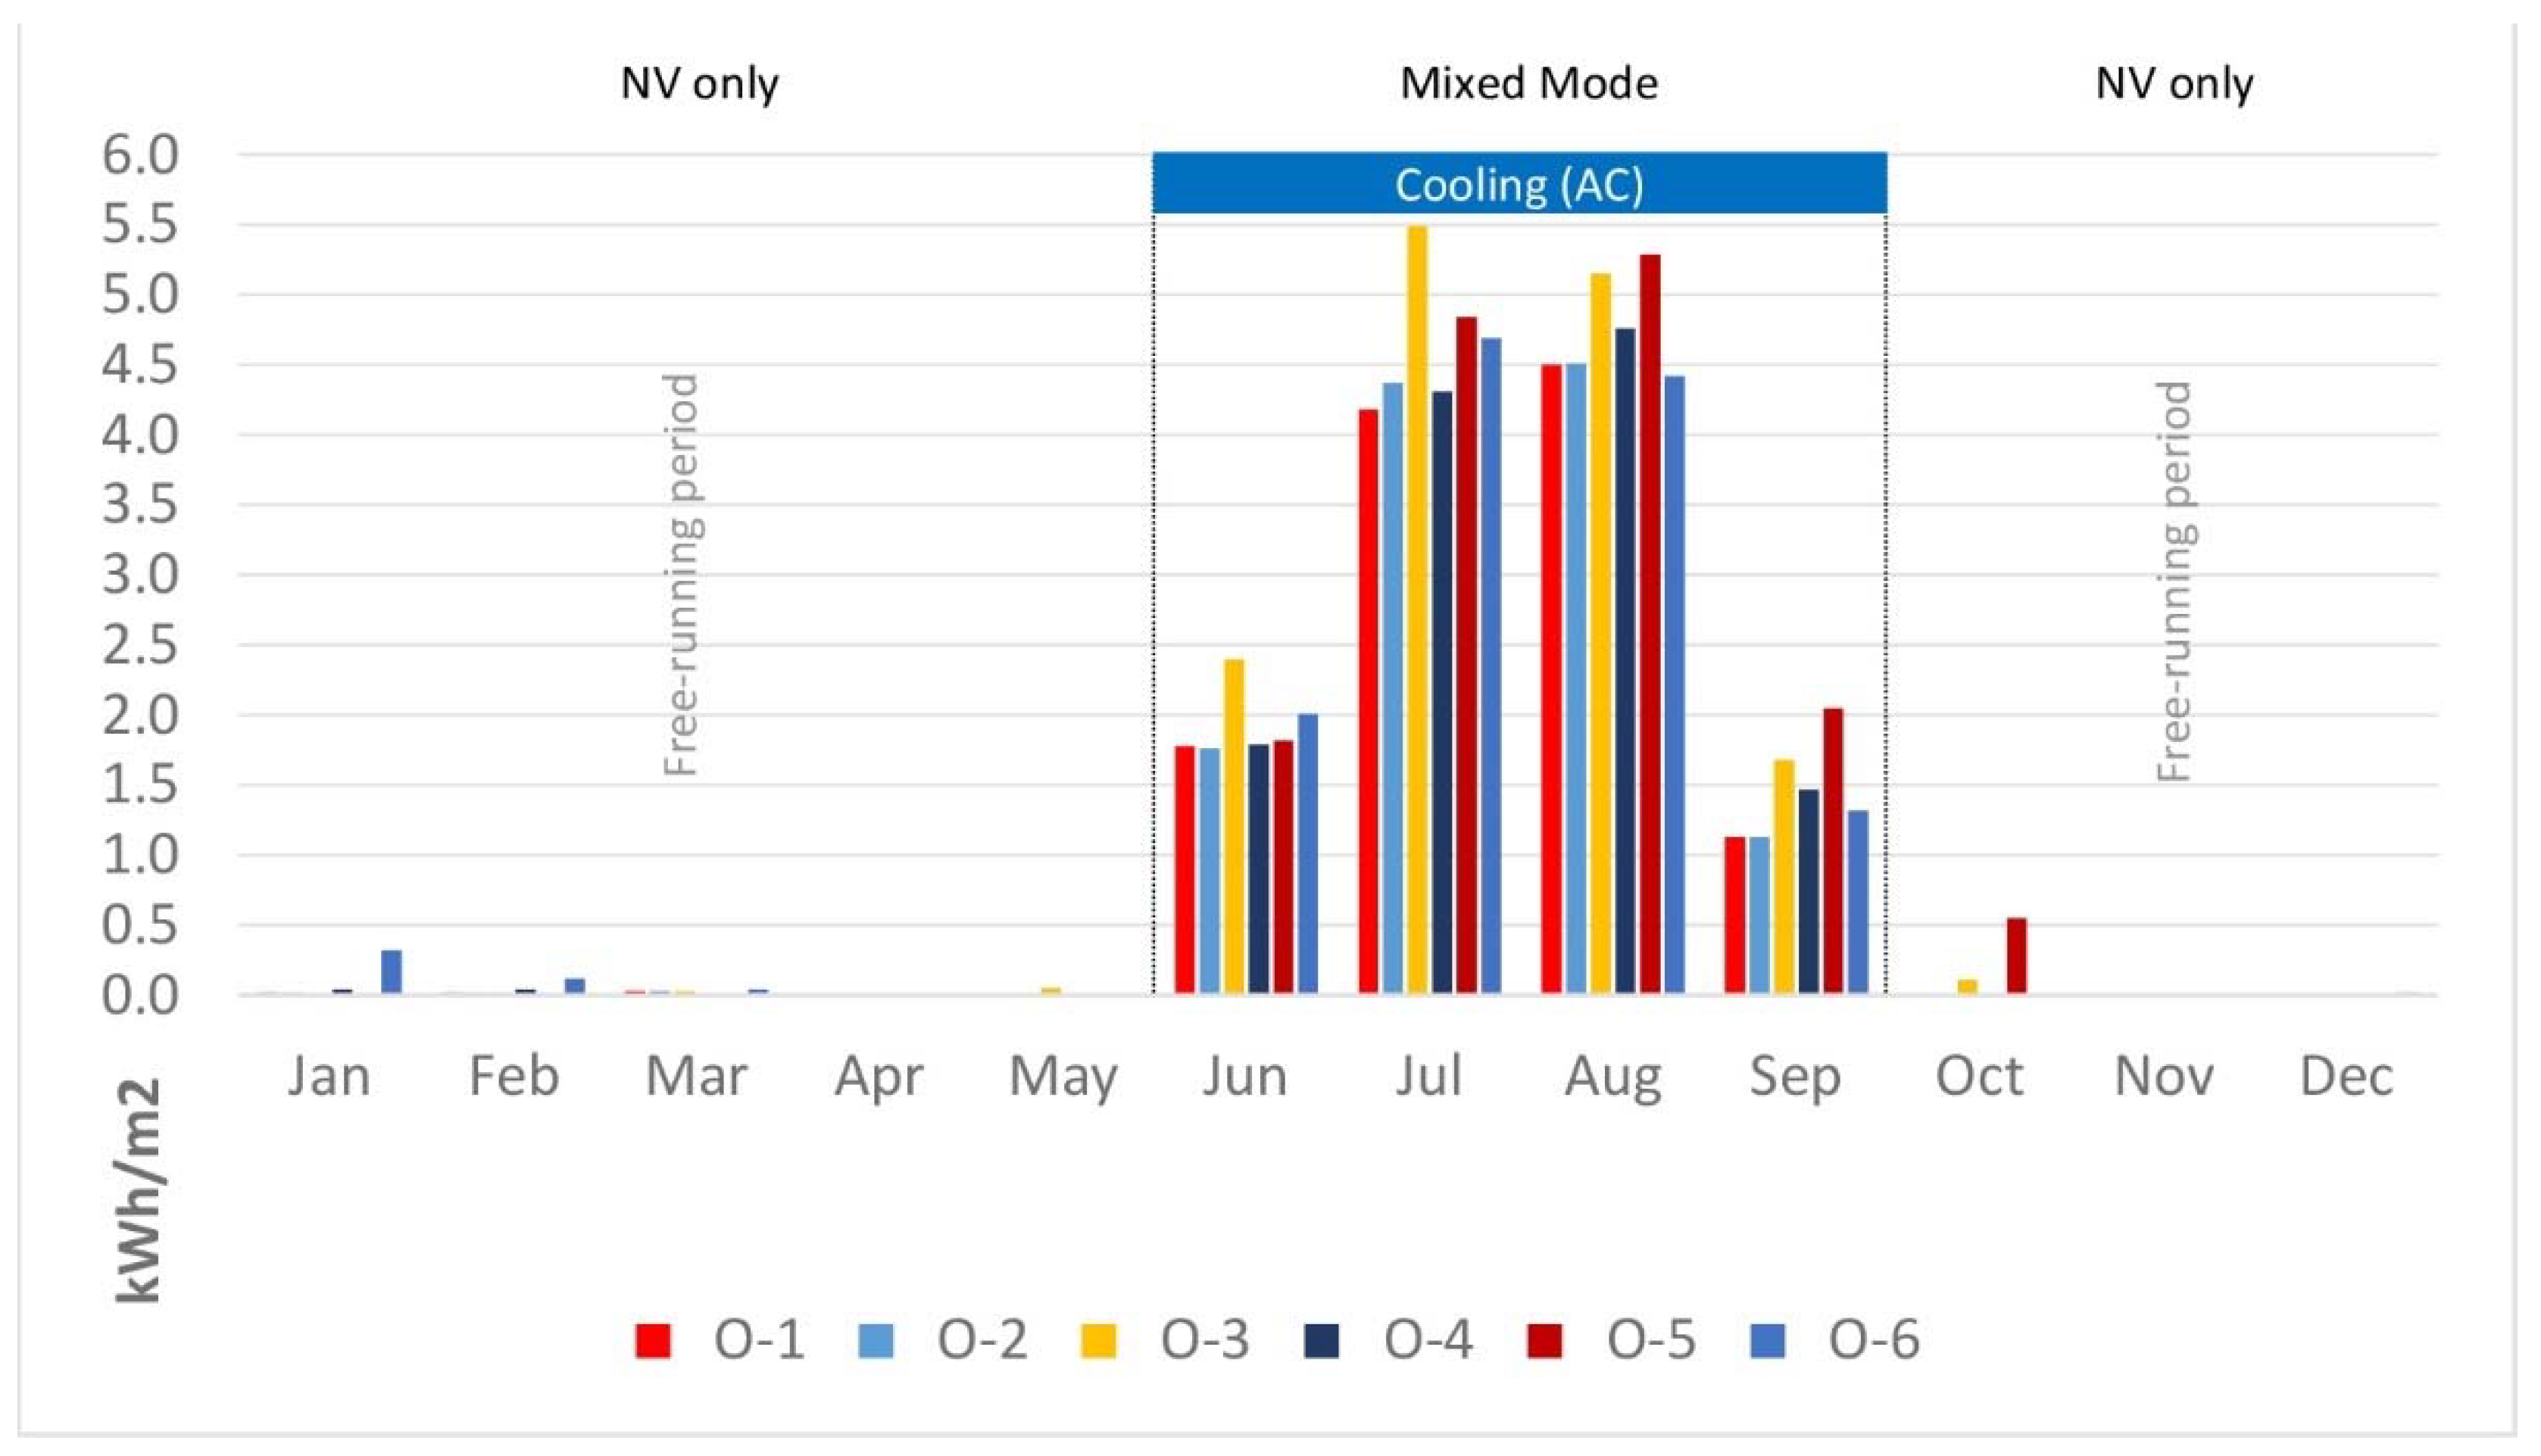
Figure 14.
Monthly AC loads for the O-1 design scenario in mixed-mode and fully AC systems.
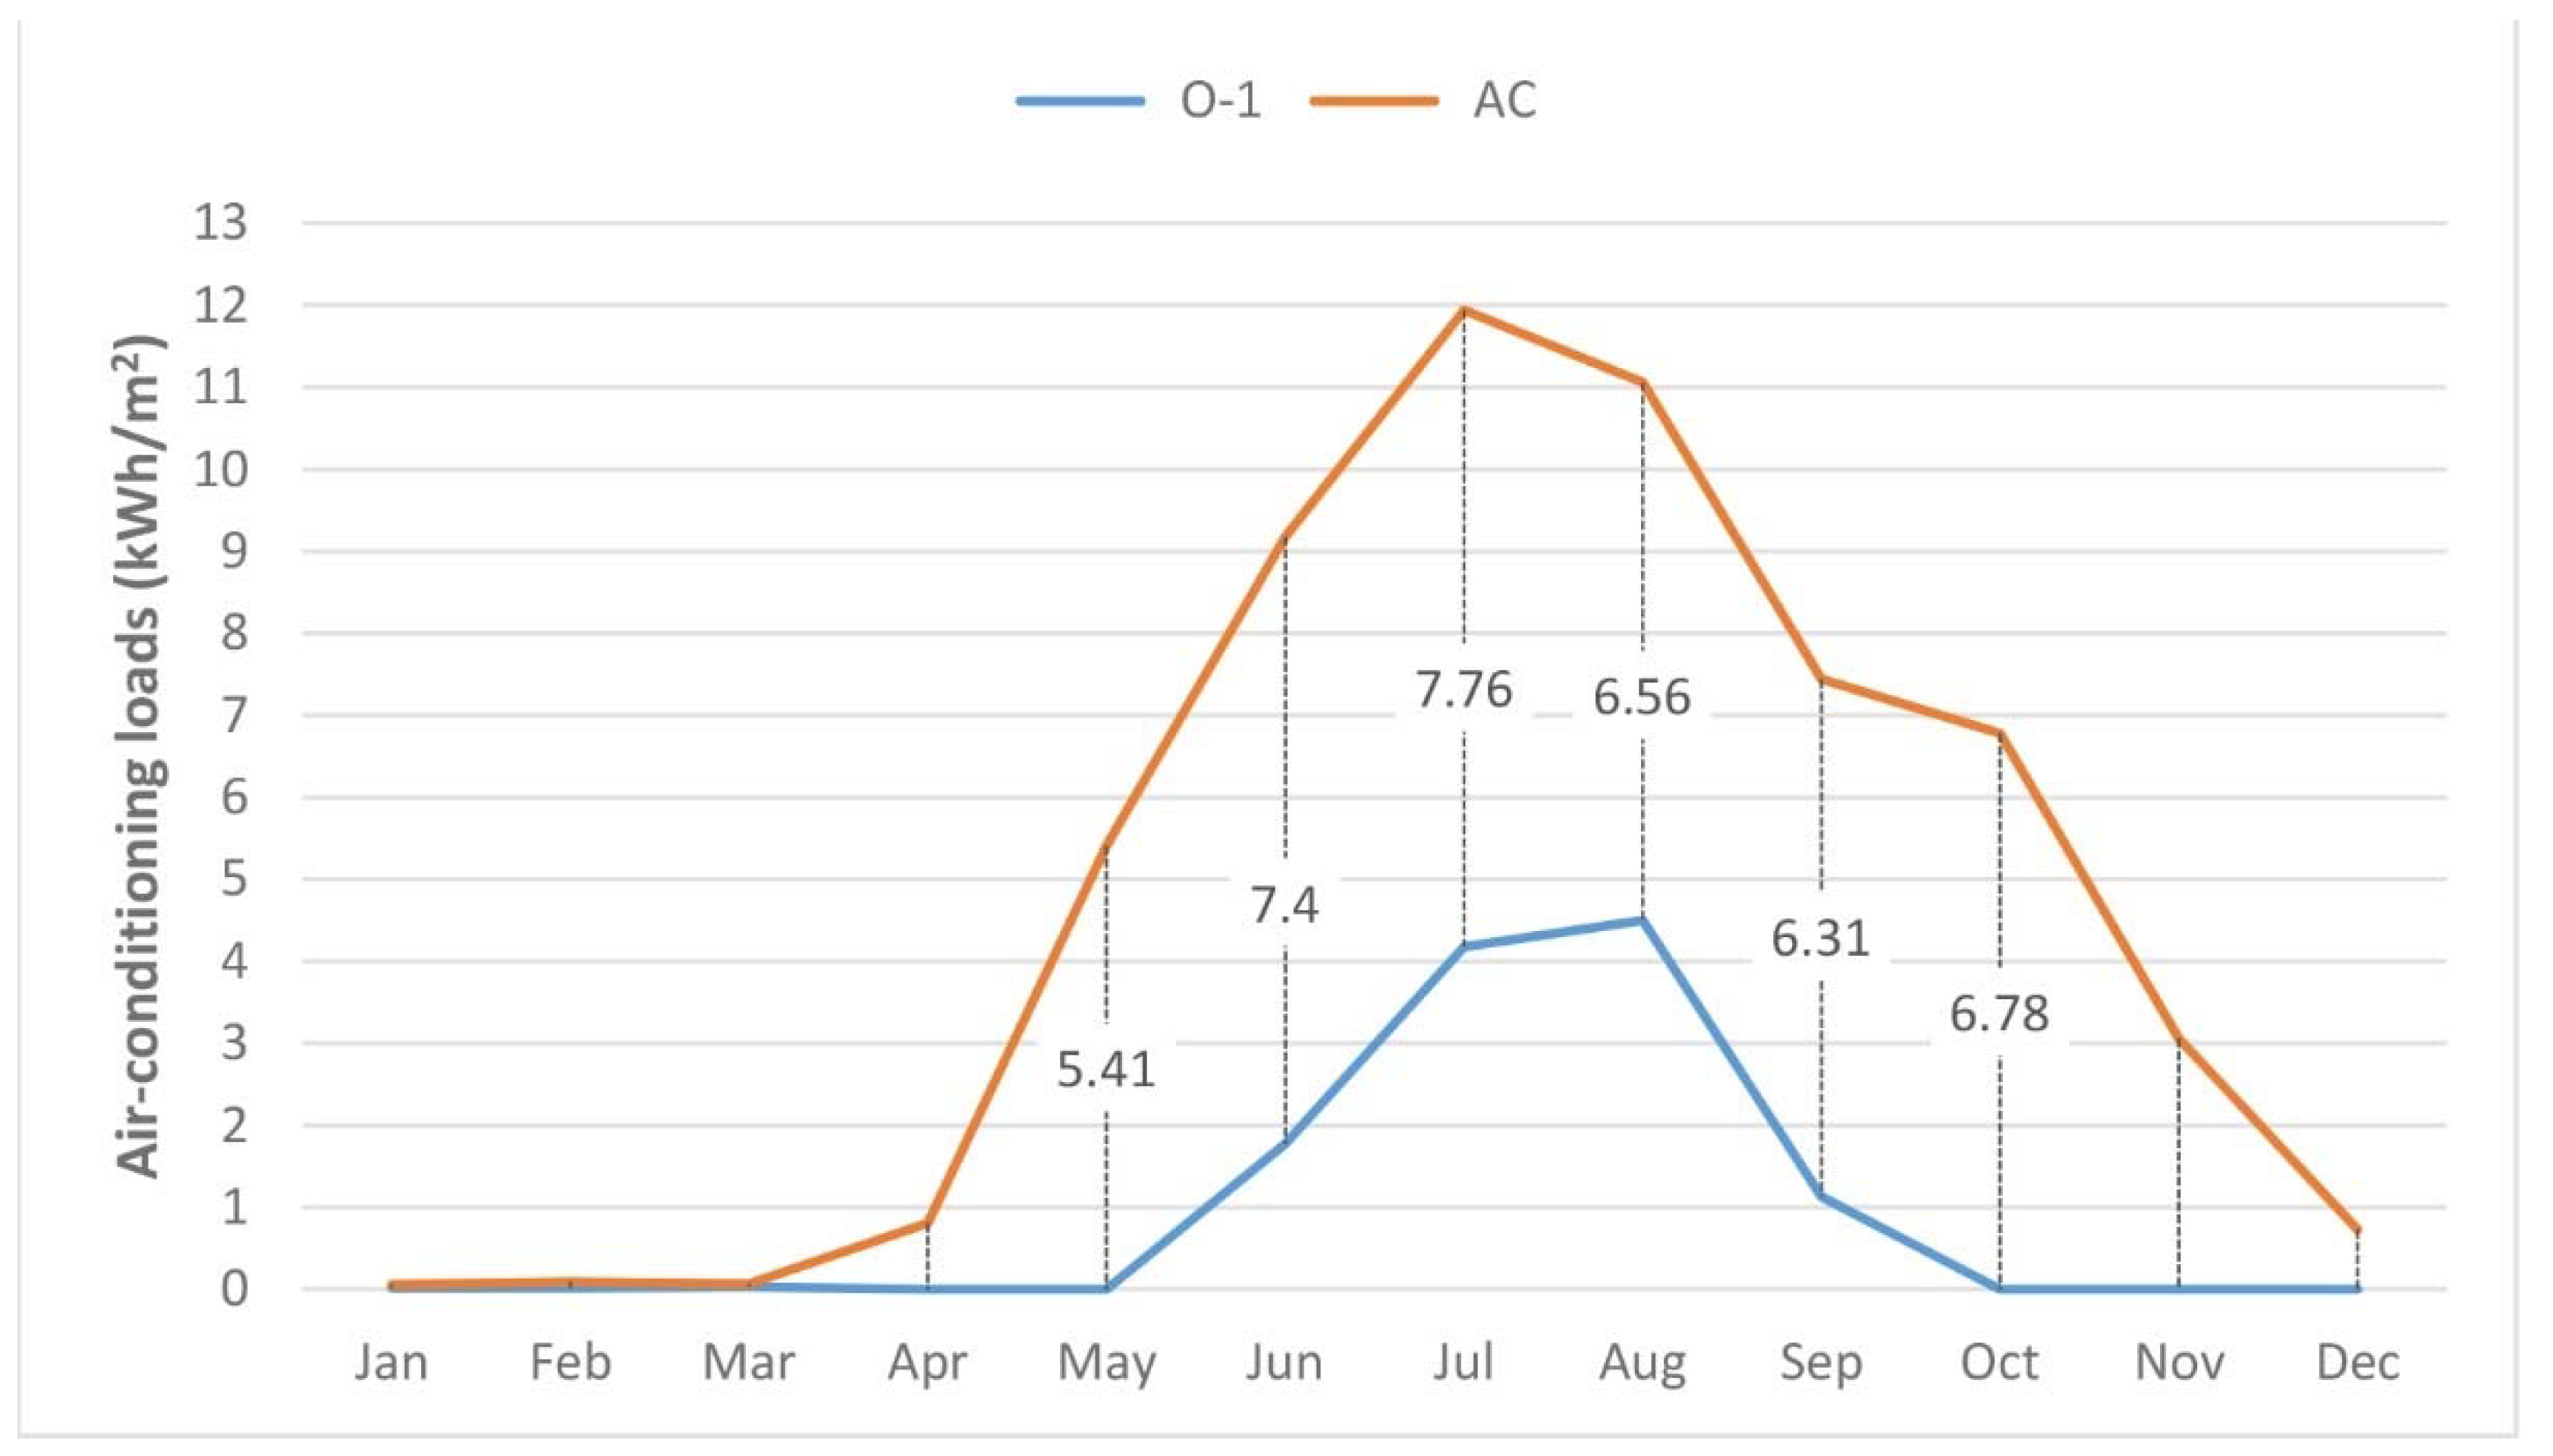

Table 1.
Classification of methods used for indoor environmental assessment [66].
Table 1.
Classification of methods used for indoor environmental assessment [66].
| Category | Evaluation Method | Building Status |
|---|---|---|
| a | Criteria used for energy calculations (design indicators) | New buildings |
| b | Whole-year computer simulations of the indoor environment and energy performance (calculated indicators) | New and existing buildings |
| c | Long-term measurement of selected parameters for the indoor environment (measurements) | Existing buildings |
| d | Subjective responses from occupants (questionnaire) | Existing buildings |
Table 2.
Indoor carbon dioxide concentration thresholds defined by relative standards.
| Standard | CO2 Concentration (ppm) | Method |
|---|---|---|
| WHO | 1000 ppm | Threshold |
| ASHRAE 62.1 | 1100 ppm | Threshold |
| BS EN 15251:2007 | 900 ppm, 1200 ppm | Category II, III |
Table 3.
Ventilation rates (L/s·m2) for non-low polluted offices defined by the BS EN 15251 standard [66].
Table 3.
Ventilation rates (L/s·m2) for non-low polluted offices defined by the BS EN 15251 standard [66].
| Building Type | Category | Occupancy Density (m2/pers) | Ventilation Rate (L/s·m2) | ||
|---|---|---|---|---|---|
| Occupancy (qp) | Building Pollution (qB) | Total (qtot) | |||
| Office | I | 10 10 10 | 1.0 | 2.0 | 3.0 |
| II | 0.7 | 1.4 | 2.1 | ||
| III | 0.4 | 0.8 | 1.2 | ||
Table 4.
The differences between American and British/European standards for an adaptive thermal comfort model.
Table 4.
The differences between American and British/European standards for an adaptive thermal comfort model.
| Standard | Adaptive Comfort Formula | Category | Comfort Range (°C) | Expectations | |
|---|---|---|---|---|---|
| Upper | Lower | ||||
|
ASHRAE 55
(American) | 90% | 2.5 | 2.5 | High | |
| 80% | 3.5 | 3.5 | Normal | ||
|
BS EN 15251
(British/European) | I | 2 | 2 | High | |
| II | 3 | 3 | Normal | ||
| III | 4 | 4 | Moderate | ||
Table 5.
Heating and cooling temperature ranges for hourly calculation in Category II of the BS EN 15251:2007 standard [66].
Table 5.
Heating and cooling temperature ranges for hourly calculation in Category II of the BS EN 15251:2007 standard [66].
| Space Type | Metabolic Rate (met) | Clothing Level (clo) | Heating Temp Range (°C) | Cooling Temp Range (°C) |
|---|---|---|---|---|
| Office (cellular and open-plan) | Sedentary activity (~1.2 met) | Winter (~1.0 clo) Summer (~0.5 clo) | 20.0–24.0 | 23.0–26.0 |
Table 6.
The construction materials and their U-values.
| Construction | Description/Thickness | U-Value (W/m²·°C) |
|---|---|---|
| External wall | Light-weight plaster (25 mm), clay brick wall (250 mm), light-weight plaster (25 mm) | 0.39 |
| Internal wall | Light-weight plaster (25 mm) and clay brick wall (100 mm), light-weight plaster (25 mm) | 0.66 |
| Ceiling/Floor | Ceiling tiles (15 mm), air gap (200 mm), reinforced concrete (150 mm), concrete screed (50 mm), floor wood tiles (10 mm) | 1.0 |
| Ground floor | Floor wood tiles (10 mm), concrete screed (50 mm), reinforced concrete (150 mm), crushed stone (75 mm), soil (1000 mm) | 0.28 |
| Single glass | 4 mm clear float glass | 5.75 (Gv = 0.85) |
| Double glass | 4 mm clear float glass, 10 mm air, 4 mm clear float glass | 2.96 (Gv = 0.75) |
| Double glass, low-E | 6 mm SG planilux clear, 12 mm air, 6 mm SG cool-lite neutral | 1.64 (Gv = 0.35) |
| Triple glass, low-E | 6 mm SG planitherm low-E, 12 mm argon, 6 mm SG cool-lite blue TS 120, 12 mm argon, 6 mm clear float glass | 1.0 (Gv = 0.24) |
| Window frame | 3 mm aluminium, 50 mm air, 3 mm aluminium | 1.450 |
Table 7.
The studied single-office window design variables and their levels.
| Level | Parameter (A) | Parameter (B) | Parameter (C) | Parameter (D) | Parameter (E) | Parameter (F) | Parameter (G) |
|---|---|---|---|---|---|---|---|
| Size (WFR) | Orientation | Type | Glazing | Aspect Ratio | Location | Shading | |
| 1 | 10% | North | Casement | Single-pane | 1:1 | Middle | Yes |
| 2 | 20% | East | Sliding | Double glass | 1:2 | Side | No |
| 3 | 30% | South | Double-hung | Double low-E | - | - | - |
| 4 | 50% | West | Single-hung | Triple low-E | - | - | - |
Table 8.
Simulation design scenarios based on the Taguchi L16 (4^4 2^3) standard orthogonal array.
| Simulation Experiments | Factorial Levels | Performance Values | ||||||
|---|---|---|---|---|---|---|---|---|
| Parameter (A) | Parameter (B) | Parameter (C) | Parameter (D) | Parameter (E) | Parameter (F) | Parameter (G) | ||
| 1 | 1 | 1 | 1 | 1 | 1 | 1 | 2 | P1 |
| 2 | 1 | 2 | 2 | 2 | 1 | 2 | 1 | P2 |
| 3 | 1 | 3 | 3 | 3 | 2 | 1 | 1 | P3 |
| 4 | 1 | 4 | 4 | 4 | 2 | 2 | 2 | P4 |
| 5 | 2 | 1 | 2 | 3 | 2 | 2 | 2 | P5 |
| 6 | 2 | 2 | 1 | 4 | 2 | 1 | 1 | P6 |
| 7 | 2 | 3 | 4 | 1 | 1 | 2 | 1 | P7 |
| 8 | 2 | 4 | 3 | 2 | 1 | 1 | 2 | P8 |
| 9 | 3 | 1 | 3 | 4 | 1 | 2 | 1 | P9 |
| 10 | 3 | 2 | 4 | 3 | 1 | 1 | 2 | P10 |
| 11 | 3 | 3 | 1 | 2 | 2 | 2 | 2 | P11 |
| 12 | 3 | 4 | 2 | 1 | 2 | 1 | 1 | P12 |
| 13 | 4 | 1 | 4 | 2 | 2 | 1 | 1 | P13 |
| 14 | 4 | 2 | 3 | 1 | 2 | 2 | 2 | P14 |
| 15 | 4 | 3 | 2 | 4 | 1 | 1 | 2 | P15 |
| 16 | 4 | 4 | 1 | 3 | 1 | 2 | 1 | P16 |
Table 9.
Schedules and loads assigned to calculate internal heat gains for the study of a single office.
Table 9.
Schedules and loads assigned to calculate internal heat gains for the study of a single office.
| Building Type | Office | |
|---|---|---|
| Operation time | Time | 09:00–17:00 |
| Hours/day | 8.0 | |
| Days/week | 5.0 | |
| Occupancy | Usage rate (0–1 k) | 1.0 |
| Metabolic rate (met) | 1.2 | |
| Density (m2/pers) | 8.4 | |
| Total (W/m2) | 15.0 | |
| Lighting | Usage rate (0–1 k) | 1.0 |
| Power (W/m2) | 12.0 | |
| Equipment | Usage rate (0–1 k) | 1.0 |
| Power (W/m2) | 18.0 | |
Table 10.
The total annual acceptable hours for VR, CO2, and TC, as well as air-conditioning loads for the set of the Taguchi L16 (4^4 2^3) simulation scenarios.
Table 10.
The total annual acceptable hours for VR, CO2, and TC, as well as air-conditioning loads for the set of the Taguchi L16 (4^4 2^3) simulation scenarios.
| Design Cases | Design Parameters | Measured Performance Criteria | |||||||||
|---|---|---|---|---|---|---|---|---|---|---|---|
| Size (WFR) | Window Orientation | Window Type | Glazing Property | Aspect Ratio | Window Location | External Shading | VR (h) | CO2 (h) | TC (h) | AC Load (kWh/m2) | |
| 1 | 10 | N | Casement | Single g. | 1:1 | Middle | No | 644 | 1044 | 923 | 18.1 |
| 2 | 10 | E | Sliding | Double g. | 1:1 | Side | Yes | 412 | 954 | 894 | 21.5 |
| 3 | 10 | S | D-hung | D. low-E | 1:2 | Middle | Yes | 745 | 1200 | 1034 | 15.3 |
| 4 | 10 | W | S-hung | Triple g. | 1:2 | Side | No | 429 | 982 | 976 | 18.8 |
| 5 | 20 | N | Sliding | D. low-E | 1:2 | Side | No | 1016 | 1298 | 987 | 14.6 |
| 6 | 20 | E | Casement | Triple g. | 1:2 | Middle | Yes | 1037 | 1331 | 1020 | 15.7 |
| 7 | 20 | S | S-hung | Single g. | 1:1 | Side | Yes | 952 | 1382 | 1251 | 18.1 |
| 8 | 20 | W | D-hung | Double g. | 1:1 | Middle | No | 1094 | 1362 | 1072 | 21.4 |
| 9 | 30 | N | D-hung | Triple g. | 1:1 | Side | Yes | 1171 | 1422 | 1020 | 12.9 |
| 10 | 30 | E | S-hung | D. low-E | 1:1 | Middle | No | 1090 | 1312 | 1076 | 21.5 |
| 11 | 30 | S | Casement | Double g. | 1:2 | Side | No | 1514 | 1634 | 1189 | 21.2 |
| 12 | 30 | W | Sliding | Single g. | 1:2 | Middle | Yes | 1138 | 1373 | 954 | 22.2 |
| 13 | 50 | N | S-hung | Double g. | 1:2 | Middle | Yes | 1151 | 1359 | 976 | 20.1 |
| 14 | 50 | E | D-hung | Single g. | 1:2 | Side | No | 1224 | 1442 | 1086 | 50.1 |
| 15 | 50 | S | Sliding | Triple g. | 1:1 | Middle | No | 1573 | 1740 | 1391 | 14.7 |
| 16 | 50 | W | Casement | D. low-E | 1:1 | Side | Yes | 1277 | 1498 | 1033 | 17.3 |
Table 11.
Factor effect percentages to acceptable hours of VR.
| Factor | DF | SSV | MSV | Effect | Rank |
|---|---|---|---|---|---|
| Size | 3 | 1355593 | 451864 | 81.59% | 1 |
| Orientation | 3 | 155118 | 51706 | 9.33% | 2 |
| Type | 3 | 96306 | 32102 | 5.80% | 3 |
| Glazing | 3 | 9242 | 3081 | 0.56% | 6 |
| Aspect ratio | 1 | 105 | 105 | 0.01% | 7 |
| Location | 1 | 14221 | 14221 | 0.86% | 5 |
| Shading | 1 | 30713 | 30713 | 1.85% | 4 |
| Residual error | 0 | ||||
| Total | 15 | 1661296 | 100% |
Table 12.
Factor effect percentages to acceptable hours of CO2.
| Factor | DF | SSV | MSV | Effect | Rank |
|---|---|---|---|---|---|
| Size | 3 | 498977 | 166326 | 73.54% | 1 |
| Orientation | 3 | 133147 | 44382 | 19.62% | 2 |
| Type | 3 | 32188 | 10729 | 4.74% | 3 |
| Glazing | 3 | 7457 | 2486 | 1.10% | 4 |
| Aspect ratio | 1 | 564 | 564 | 0.08% | 7 |
| Location | 1 | 743 | 743 | 0.11% | 6 |
| Shading | 1 | 5439 | 5439 | 0.80% | 5 |
| Residual error | 0 | ||||
| Total | 15 | 678515 | 100% |
Table 13.
Factor effect percentages to acceptable hours of adaptive TC.
| Factor | DF | SSV | MSV | Effect | Rank |
|---|---|---|---|---|---|
| Size | 3 | 59416 | 19805.4 | 24.25% | 2 |
| Orientation | 3 | 142395 | 47465.1 | 58.12% | 1 |
| Type | 3 | 1651 | 550.4 | 0.67 % | 6 |
| Glazing | 3 | 12756 | 4252.1 | 5.21% | 4 |
| Aspect ratio | 1 | 11990 | 11990 | 4.89% | 5 |
| Location | 1 | 6 | 6 | 0.00% | 7 |
| Shading | 1 | 16770 | 16770 | 6.85% | 3 |
| Residual error | 0 | ||||
| Total | 15 | 244986 | 100% |
Table 14.
Factor effect percentages to AC loads.
| Factor | DF | SSV | MSV | Effect | Rank |
|---|---|---|---|---|---|
| Size | 3 | 159.83 | 53.27 | 14.79% | 3 |
| Orientation | 3 | 286.47 | 95.49 | 26.52% | 2 |
| Type | 3 | 123.61 | 41.20 | 11.44% | 4 |
| Glazing | 3 | 317.15 | 105.71 | 29.36% | 1 |
| Aspect ratio | 1 | 65.65 | 65.65 | 6.08% | 6 |
| Location | 1 | 40.23 | 40.23 | 3.72% | 7 |
| Shading | 1 | 87.38 | 87.38 | 8.09% | 5 |
| Residual error | 0 | ||||
| Total | 15 | 1080.32 | 100% |
Table 15.
Results of the trade-off design solutions for different window design parameters.
| Trade-off Cases | Design Parameters | Measured Performance Criteria | |||||||||
|---|---|---|---|---|---|---|---|---|---|---|---|
| Size (WFR) | Window Orientation | Window Type | Glazing Property | Aspect Ratio | Window Location | External Shading | VR (h) | CO2 (h) | TC (h) | AC Load (kWh/m2) | |
| 1 | 50 | S | D-hung | D. low-E | 1:1 | Middle | Yes | 1511 | 1749 | 1466 | 11.66 |
| 2 | 50 | S | Sliding | D. low-E | 1:1 | Middle | Yes | 1502 | 1746 | 1451 | 11.85 |
| 3 | 50 | S | Casement | D. low-E | 1:1 | Middle | Yes | 1501 | 1748 | 1379 | 12.41 |
| 4 | 50 | S | S-hung | D. low-E | 1:1 | Middle | Yes | 1396 | 1632 | 1374 | 14.96 |
| 5 | 50 | S | Casement | Triple g. | 1:1 | Middle | No | 1586 | 1751 | 1398 | 14.56 |
| 6 | 20 | S | D-hung | D. low-E | 1:1 | Middle | Yes | 1125 | 1441 | 1194 | 12.94 |
Publisher’s Note: MDPI stays neutral with regard to jurisdictional claims in published maps and institutional affiliations. |
© 2022 by the authors. Licensee MDPI, Basel, Switzerland. This article is an open access article distributed under the terms and conditions of the Creative Commons Attribution (CC BY) license (https://creativecommons.org/licenses/by/4.0/).
Share and Cite
MDPI and ACS Style
Abdullah, H.K.; Alibaba, H.Z. A Performance-Based Window Design and Evaluation Model for Naturally Ventilated Offices. Buildings 2022, 12, 1141. https://doi.org/10.3390/buildings12081141
AMA Style
Abdullah HK, Alibaba HZ. A Performance-Based Window Design and Evaluation Model for Naturally Ventilated Offices. Buildings. 2022; 12(8):1141. https://doi.org/10.3390/buildings12081141
Chicago/Turabian StyleAbdullah, Hardi K., and Halil Z. Alibaba. 2022. "A Performance-Based Window Design and Evaluation Model for Naturally Ventilated Offices" Buildings 12, no. 8: 1141. https://doi.org/10.3390/buildings12081141
Note that from the first issue of 2016, this journal uses article numbers instead of page numbers. See further details here.